Article

The Impact of Carbon Emission Trading on Renewable Energy: A Comparative Analysis Based on the CGE Model

1
Jiaxing Hengchuang Electric Power Design & Institute Co., Ltd., Jiaxing 314100, China
2
School of Economics, Xi’an University of Finance and Economics, Xi’an 710003, China
3
School of Economics and Finance, Xi’an Jiaotong University, Xi’an 710049, China
*
Authors to whom correspondence should be addressed.
Sustainability 2023, 15(16), 12649; https://doi.org/10.3390/su151612649
Submission received: 3 August 2023 / Revised: 17 August 2023 / Accepted: 20 August 2023 / Published: 21 August 2023
(This article belongs to the Special Issue Environmental Impact Assessment and Green Energy Economy 2nd Edition)

Abstract

:
This study examines the effects of carbon emission trading on renewable energy consumption in China. The research applies the CEEEA2.0 model to simulate the economic, energy, and environmental impacts of carbon trading from 2018 to 2030. The CEEEA2.0 model is a recursive dynamic computable general equilibrium model that incorporates multiple households, sectors, and an energy and environment module. Four scenarios are considered: the Business as Usual (BaU) scenario, the Emission Trading Scheme (ETS)-benchmark scenario, and the ETS-strengthened and ETS-enhanced scenarios. The findings reveal that carbon emission trading positively influences electricity consumption, resulting in a higher preference for renewable energy due to reduced price disparities between renewable sources and fossil fuels. Consequently, electricity generation from renewable sources increases in all scenarios compared to the BaU scenario. However, the share of renewable energy is not substantially affected by carbon emission trading due to the complex interplay of factors, including substitution and income effects. The study further highlights that carbon trading significantly reduces coal usage and partially increases the overall proportion of renewable energy. These results underscore the significance of establishing ambitious carbon reduction targets and continual efforts to shift towards clean energy sources.

1. Introduction

The urgent need to tackle climate change has spurred the global community to search for innovative solutions that will reduce greenhouse gas emissions [1,2,3]. One such solution is carbon emission trading, which allows countries and companies to buy and sell carbon credits as a means to meet their emissions targets [4,5,6]. Carbon emission trading (or carbon trading, emission trading, ETS) is a market-based mechanism that allows companies to buy and sell permits that represent the right to emit a certain amount of carbon dioxide or other greenhouse gases into the atmosphere. It aims to incentivize emission reductions and promote cost-effective ways to achieve emission mitigation targets.
There are several carbon trading markets worldwide, including the EU Emissions Trading System (established in 2005 and currently the largest carbon market) [7,8,9,10], the carbon trading market in China (established in 2021 and currently covering only the power sector at present) [1,11], regional carbon trading markets in Canada (such as Quebec and Alberta) [12], the national carbon trading market in New Zealand (established in 2008) [13,14], and the carbon trading market in South Korea (established in 2015) [15]. This approach aims to create economic incentives for reducing emissions and may promote the transition to renewable energy sources [16].
Currently, there are several viewpoints in the research on the relationship between carbon trading and renewable energy. Firstly, the establishment of carbon emission trading markets promotes investment in renewable energy [17]. Chen et al. [18] found that emission trading could somehow increase the investment; however, the investment in renewable energy does not necessarily reduce carbon emissions. Yan et al. [17] employed scenario analysis to design four policy scenarios, no-policy scenario, carbon cap-and-trade mechanisms scenario, renewable portfolio standards scenario, and mixed scenario, and found that in terms of renewable energy promotion, the mixed scenario is the best. Wei et al. [19] argued that grandfathering and benchmarking methods in emission trading are both conducive to the investment of renewable energy. Carbon emission trading mechanisms introduce economic incentives for power generation companies, increasing the cost-effectiveness of investments in renewable energy by trading the necessary allowance for reducing carbon emissions. This means that the same investment amount can yield a higher renewable energy output, thus driving the expansion of renewable energy generation investment and its capacity. Using the real option model, Kim et al. [20] attempted to assess the effects of the uncertainty of newly appearing carbon markets on the economic value of renewable energy R&D in Korea, empirically, and found positive answers.
Secondly, carbon emission trading expands the market size of renewable energy [21], but shows an asymmetric relationship [22]. Bird et al. [23] think many U.S. consumers today are purchasing renewable energy in large part for the greenhouse gas (GHG) emissions benefits that the Emission Trading Scheme may provide. As carbon emission trading is implemented, the costs associated with carbon emissions from traditional energy sources also increase. This raises the price of fossil energy, prompting users to shift towards cleaner renewable energy sources. Zhang et al. [24] found that fossil energy consumption is the most critical transmission mechanism through which China’s ETS affects the development of renewable energy, playing a 73% role in the overall mediation effect. With the increased demand for renewable energy, the expansion of market size further boosts technological innovation and cost reduction.
Third, however, under specific conditions, carbon emission trading may have negative implications for renewable energy development, or vice versa [18,24], and the pandemic and the war may also distort the relationship [25]. If not well tuned, Huang et al. [26] believed that the two regulation policies may deviate from their original intention and lead to unnecessary social cost. If the development of renewable policy weakens the demand for emission allowance resulting in the reduction in manufacturers’ power generation then it will reduce the effect of carbon trading [27]. Most and Fichtner [28] found that a promotion of renewable energies reduces the scarcity of CO2 emission allowances and thus lowers marginal costs of CO2 reduction up to 30% in 2030; so, the carbon price in the emission trading market will be lower. Therefore, when formulating carbon pricing and trading rules, it is essential to fully consider the characteristics and market conditions of renewable energy.
The impact of carbon emission trading on renewable energy has been a topic of great interest and debate among scholars and policymakers [29]. However, the existing literature lacks research on the mechanism of the impact of carbon emission trading on renewable energy. In other words, most studies only answer the question of how much renewable energy consumption is affected without addressing how and why it is affected. Understanding this relationship is crucial for designing effective climate change mitigation policies and promoting the sustainable development of renewable energy industries. In this study, we aim to investigate how carbon emission trading affects renewable energy consumption, from the perspective of product prices, carbon emissions, and the effects on the economy.
To conduct our analysis, we will employ a computable general equilibrium (CGE) model, which is a widely-used method for evaluating the economic impacts of policy changes at both micro and macro levels [30,31,32]. What sets the CGE model apart from other approaches is its ability to capture the complex interactions and feedback effects between various economic sectors, including energy markets, and measure the distributional impacts across different income groups [33,34].
The research question we seek to address in this study is: How does carbon emission trading affect renewable energy? Specifically, we will compare the outcomes of a scenario with carbon emission trading implementation against a baseline scenario without trading. By simulating the effects of carbon emission trading using the CGE model, we can assess how renewable energy consumption, product prices, carbon emissions, and overall economic performance may change under different trading conditions.
Based on preliminary findings, we anticipate that carbon emission trading will have a certain impact on electricity consumption and the electricity generation mix. This is because the implementation of carbon trading will lead to a decrease in the price difference between renewable energy and fossil fuels, thereby increasing the preference for renewable energy sources. Consequently, compared to the baseline scenario, both generation capacity and share of renewable energy are expected to increase under a strong carbon trading scenario.
The findings of this study will contribute to the growing body of knowledge on the potential benefits and challenges associated with carbon emission trading. The use of the CGE model allows for a comprehensive assessment of the impacts on renewable energy consumption, product prices, carbon emissions, and economic performance. These insights will be valuable for policymakers and stakeholders in their efforts to design effective climate change mitigation strategies and promote renewable energy development.
Section 2 introduces the methodology of the study, including modelling methods, data source, dynamics, and scenario setting. Section 3 reports the results of how carbon trading affects energy mix. Section 4 provides discussions and further analysis of why renewable energy will be stimulated by emission trading. Section 5 concludes the paper.

2. Methodology

2.1. CEEEA2.0 Model: A Computable General Equilibrium Model

This paper adopts the China Energy–Environment–Economy Analysis Model 2.0 (CEEEA2.0/CGE model, CEEEA2.0 model thereafter) to simulate the effect of ETS policy [35]. Detailed descriptions of the CEEEA2.0 model equation system can be found in the previous literature [36]. The model’s data and code are also available on the website (https://github.com/Zhijie-Jia/CEEEA2.0-CGE, accessed on 1 August 2023).
The CEEEA2.0 model is a model based on the computable general equilibrium (CGE) model, which is combined with the general equilibrium theory and the input–output analysis, like many CGE studies [37,38,39,40]. It reflects the relationship between quantity and price and the relationship among governments, residents, enterprises, and international activities [41]. It encompasses two markets in this macro-environment: the commodity market and the factor market [42,43]. The main buyers are residents, governments, and enterprises in the commodity market, corresponding to final consumption and intermediate input. The leading sellers are the enterprises that provide goods and services to the buyers. In the factor market, the buyers are the enterprises, and the sellers are the residents (or households), and the “commodities” are the capital element and labor factor. By considering government taxes, international trade, dynamic factors, energy input, and other aspects, we can build a multi-sector dynamic recursive CGE model called the CEEEA2.0 model used in this paper.
There are some assumptions and boundaries in the model, which may affect the simulation results, such as the benchmark price and macro-closure condition.
The benchmark price is set in order to satisfy the zero-order homogeneity of price in the CGE model and adhere to the Walras law. It serves as the reference price level, with other prices presented as relative changes from this benchmark. Typically, we can choose the price of a specific commodity/factor or the Consumer Price Index (CPI) as the benchmark. To accurately measure price changes, it is important to select a less susceptible commodity. According to Goulder et al. [44], agricultural products are less affected. The macro-closure conditions can be defined based on different economic assumptions, such as Neoclassical closure or Keynesian closure. In China, with higher levels of capital accumulation and a reduced surplus of labor force, the study adopts Neoclassical closure, assuming full utilization of factor markets. This closure is better suited for long-run dynamic models.
In addition, this paper utilizes a dynamic recursive model. Transforming a static model into a dynamic one can be achieved through various approaches. In the case of this paper, it adopts the macro closure of Neoclassicism, where the dynamic model primarily incorporates three elements from Solow’s economic growth model: technological progress, population growth, and capital accumulation. For relevant assumptions, the previous literature can serve as a reference [45].

2.2. Data Source

The data in this article primarily come from the Chinese Input–Output Table, which includes intermediate inputs between all enterprises, capital, and labor inputs of enterprises, production taxes of enterprises, investments, consumption, imports, and exports of different products. The data related to the relationship between the government and residents are sourced from the “China Statistical Yearbook”, such as government taxation on residents, resident deposits, etc. The information on energy inputs by industry are sourced from the “China Energy Statistical Yearbook”. The sector-specific carbon emissions data for both industries and residents are calculated based on energy consumption using the carbon emission calculation rules provided by the IPCC. It is important to note that this article only considers carbon emissions from energy consumption and does not include emissions from sources such as respiration of animals and plants, land use, and cement production. Additionally, based on the industry classification in the Chinese Input–Output Table, we have reclassified the industries as shown in Table 1, with their abbreviations and full names.

2.3. Dynamics

In order to simulate the long-term impacts of carbon emission trading and renewable energy policies on the economy, environment, and energy, we have transformed the static CGE model into a dynamic CGE model using a recursive approach [30,46,47]. In general, the neoclassical macro-closure condition is preferred over Keynesian macro-closure and Lewis macro-closure in the long run, which means that all factors of production and goods are clear in the long run. Both prices and quantities are endogenous in this framework. However, economic development is constrained by resource endowments, which include labor and capital. Therefore, in the process of dynamization, we consider technological progress, automatic energy efficiency improvements, labor endowments, and capital endowments. The corresponding reference values and setting methods are based on [36,48].

2.4. Scenario Settings

The operating principles of China’s carbon emission trading pilot include “total control” and “market-based trading”. Total control means that the government sets a cap on the total amount of carbon emissions, and companies must stay within this limit. Market-based trading allows companies to buy or sell carbon emission allowances through market transactions to achieve their own emission targets.
The national carbon trading market in China was formally launched in 2017 and began trading in 2021. Currently, the market only covers the power sector, but it is expected to expand to key industries such as electricity, chemicals, construction materials, steel, nonferrous metals, papermaking, and aviation in the future. In the initial phase, most industries follow a grandfathering approach for allowance allocation, with a relatively high proportion of free allowances. Similar to the EU ETS, the proportion of free allowances will gradually decrease in the future, tightening the carbon constraints under the grandfathering approach or transitioning to benchmarking. Based on these specific characteristics of China’s carbon emission trading, the following logical scenarios are formulated.
Computable general equilibrium models are adept at conducting comparative analyses of target policies by constructing benchmark scenarios (scenarios without the policy under study, serving as a control group) and counterfactual scenarios (scenarios with the implementation of the policy under study, serving as an experimental group) [49,50]. The objective of this study is to examine the impact of carbon trading. Therefore, we have based our scenario construction on carbon trading.
  • The Business as Usual (BaU) scenario, which assumes China continues its current development path without implementing carbon trading or carbon tax policies, but still experiences heterogeneous technological progress and improvements in energy efficiency.
  • The Emission Trading Scheme-benchmark (ETS-benchmark) scenario, which builds on the BaU scenario and introduces a carbon emission trading mechanism. The covered industries for carbon trading are the same as the current ones in China, namely only the electricity sector. However, starting from 2025, the covered industries will follow the initial plan set by the National Development and Reform Commission in 2016, which includes eight high-energy-consuming industries: petrochemical, chemical, construction materials, iron and steel, nonferrous metals, papermaking, electricity, and aviation. This covers 18 subindustries, including crude oil processing and ethylene production. The total carbon quota and allocation plan are based on a carbon intensity-based grandfathering method. Since the Chinese government has committed to peaking carbon emissions by 2030, we assume that the government will control carbon emissions through carbon emission trading to achieve this peak by 2030. However, considering the current situation, China’s carbon peak target seems relatively easy to achieve, so we additionally consider two more ambitious scenarios.
  • The ETS-strengthened scenario, which is similar to the ETS-benchmark scenario. The only difference is that carbon emissions in this scenario will peak around 2025 and the peak emission will be lower. This scenario is more likely to occur considering the almost-reaching-peak coal consumption and the lowered economic growth. In addition, other papers also have the similar results [51].
  • The ETS-enhanced scenario, which is also similar to the ETS-benchmark scenario. The only difference is that carbon emissions in this scenario will reach the peak immediately, and the peak will be lower than the previous two scenarios.
In all the ETS scenarios, we set the total cap as calculated by the grandfathering method, which means the total cap is calculated by the last periods’ carbon intensity and current carbon intensity of the specific industry. To obtain the given emission mitigation path as we discussed above (also presented in the figures in the next section), we need to set the annual reduction factor of carbon intensity of the covered sectors, as shown in Figure 1.

3. Results

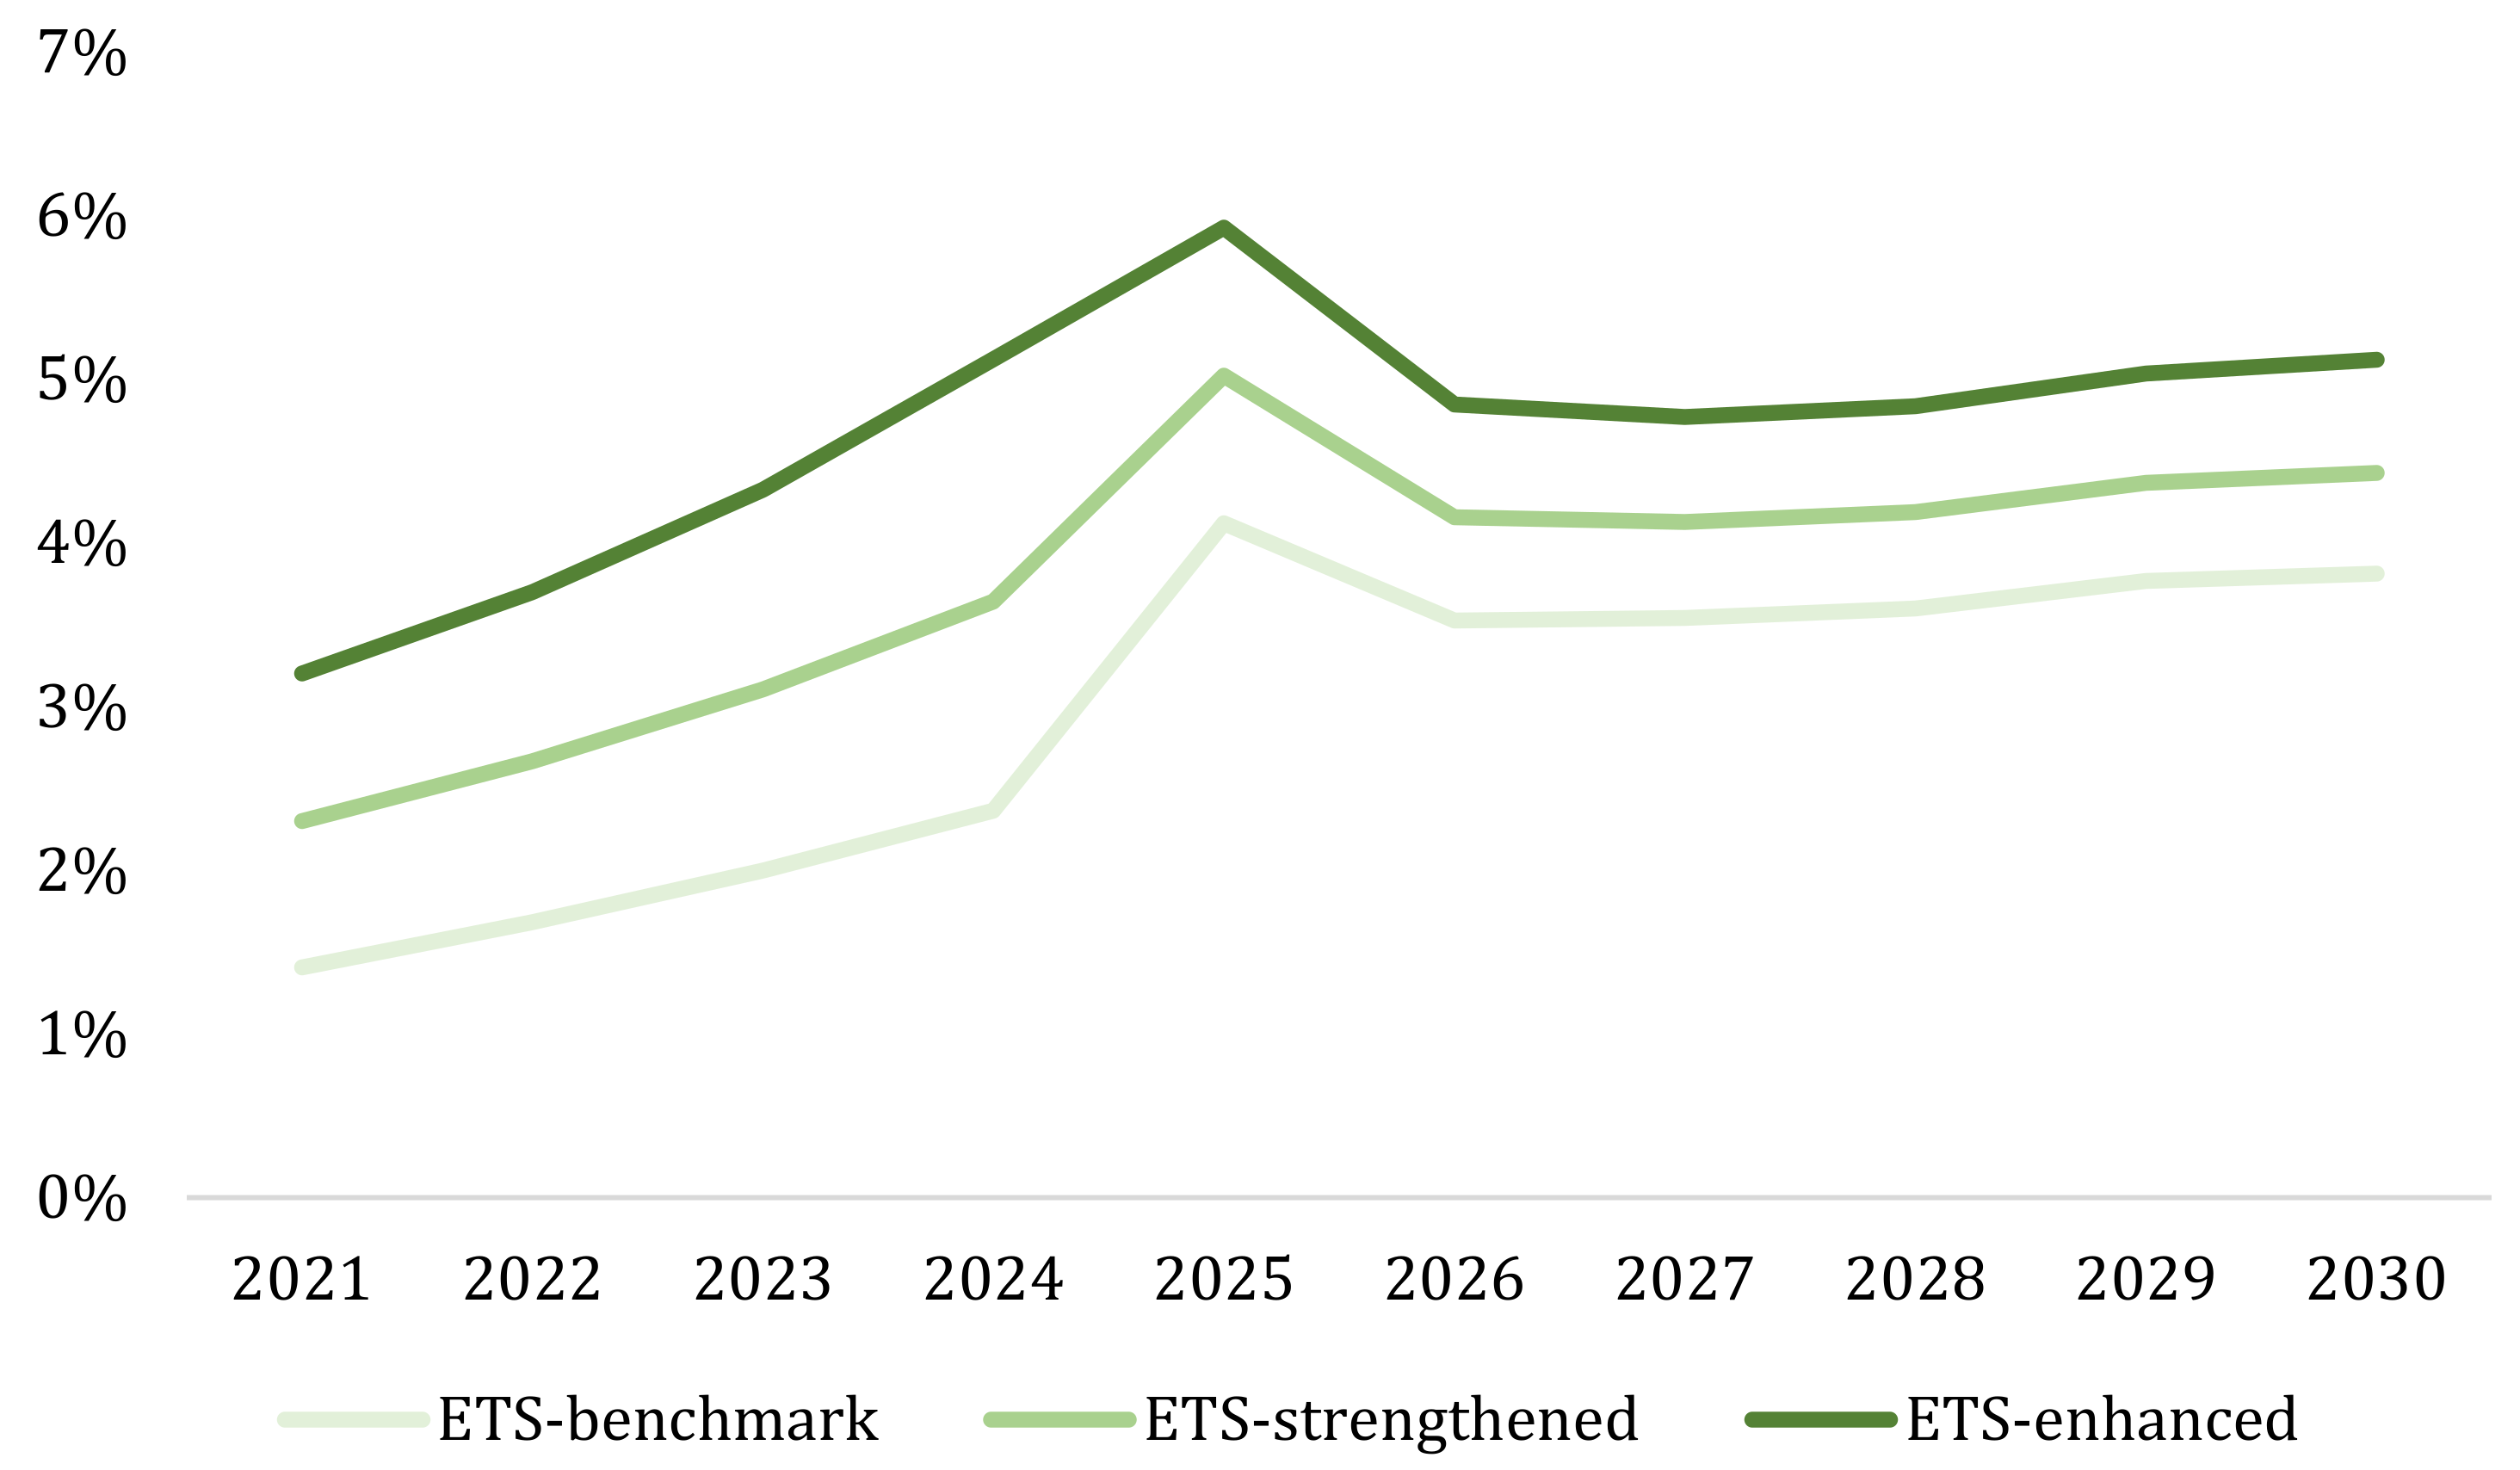
3.1. Impact on Electricity Mix

The main objective of this study is to examine how carbon trading affects renewable energy. Therefore, we first observe the impact of three simulated carbon trading scenarios on renewable energy from the perspective of electricity production and generation structure. From Figure 2, it can be seen that the ETS significantly increases electricity consumption, most likely due to energy substitution. With the existence of carbon trading, the price difference between renewable energy and fossil fuels has further reduced, leading energy consumers to prefer renewable energy over fossil fuels. Since almost all renewable energy comes from the power generation industry, electricity generation has seen a significant increase. Compared to the Business as Usual (BaU) scenario, the total electricity generation in the ETS-benchmark, ETS-strengthened, and ETS-enhanced scenarios has increased by 11, 15, and 17 billion kWh, respectively, by 2030.
However, we also find that the share of renewable energy does not seem to be greatly influenced by carbon emission trading. Compared to the BaU scenario, the share of renewable energy has increased by 1.10%, 1.72%, and 2.41% in the ETS-benchmark, ETS-strengthened, and ETS-enhanced scenarios, respectively. If we focus on the rate of change in electricity generation from various sources instead of change in share, we find that thermal power has decreased by 5.04%, while renewable energy has increased by 3.11%–9.14%, and a total of 241.37 billion kWh power generation, which is a relatively large change in these sectors and equivalent to near five times that of Singapore’s annual power generation.
Furthermore, in the ETS-benchmark scenario, the proportion of renewable energy generation is lower than the other two scenarios. This is because the increase in the proportion of renewable energy generation is influenced by factors similar to substitution effects and income effects. The income effect refers to the higher cost of using fossil fuels due to carbon trading, leading energy consumers to prefer electricity (not just renewable electricity). The substitution effect refers to the gradual cost advantage of renewable energy generation over thermal power generation due to the introduction of carbon trading, and this substitution effect increases with the increase in carbon trading prices. Therefore, in scenarios where carbon trading is not very strict, the income effect is slightly relatively higher than the substitution effect, resulting in a lower increase in the share of renewable energy. However, in the ETS-strengthened and ETS-enhanced scenarios, the substitution effect on the share of renewable energy generation is much greater than the income effect, leading to a simultaneous increase in renewable energy generation and share.
We also found that our results may be different from others. Zhang et al. [24] found that the ETS pilot in China may reduce renewable installation by 6.2 GW in the pilot area and increase installation by 16.9 GW in the nonpilot area, with a total increase of 10.7 GW installation, or about 0.4% of the total generation share. Yu et al. [52] investigated a 6.1% increase in renewable share in countries with an ETS market using cross-national data and a DID model. Our estimation results happen to be in the middle of this literature, and we can also explain why our results are lower than Zhang et al. [24] but higher than Yu et al. [52]; the former estimates the pilot’s impact to the whole region, so it is smaller, the latter estimates the impact at a cross-country level, which may implement ETS for many years, so the results may be higher.

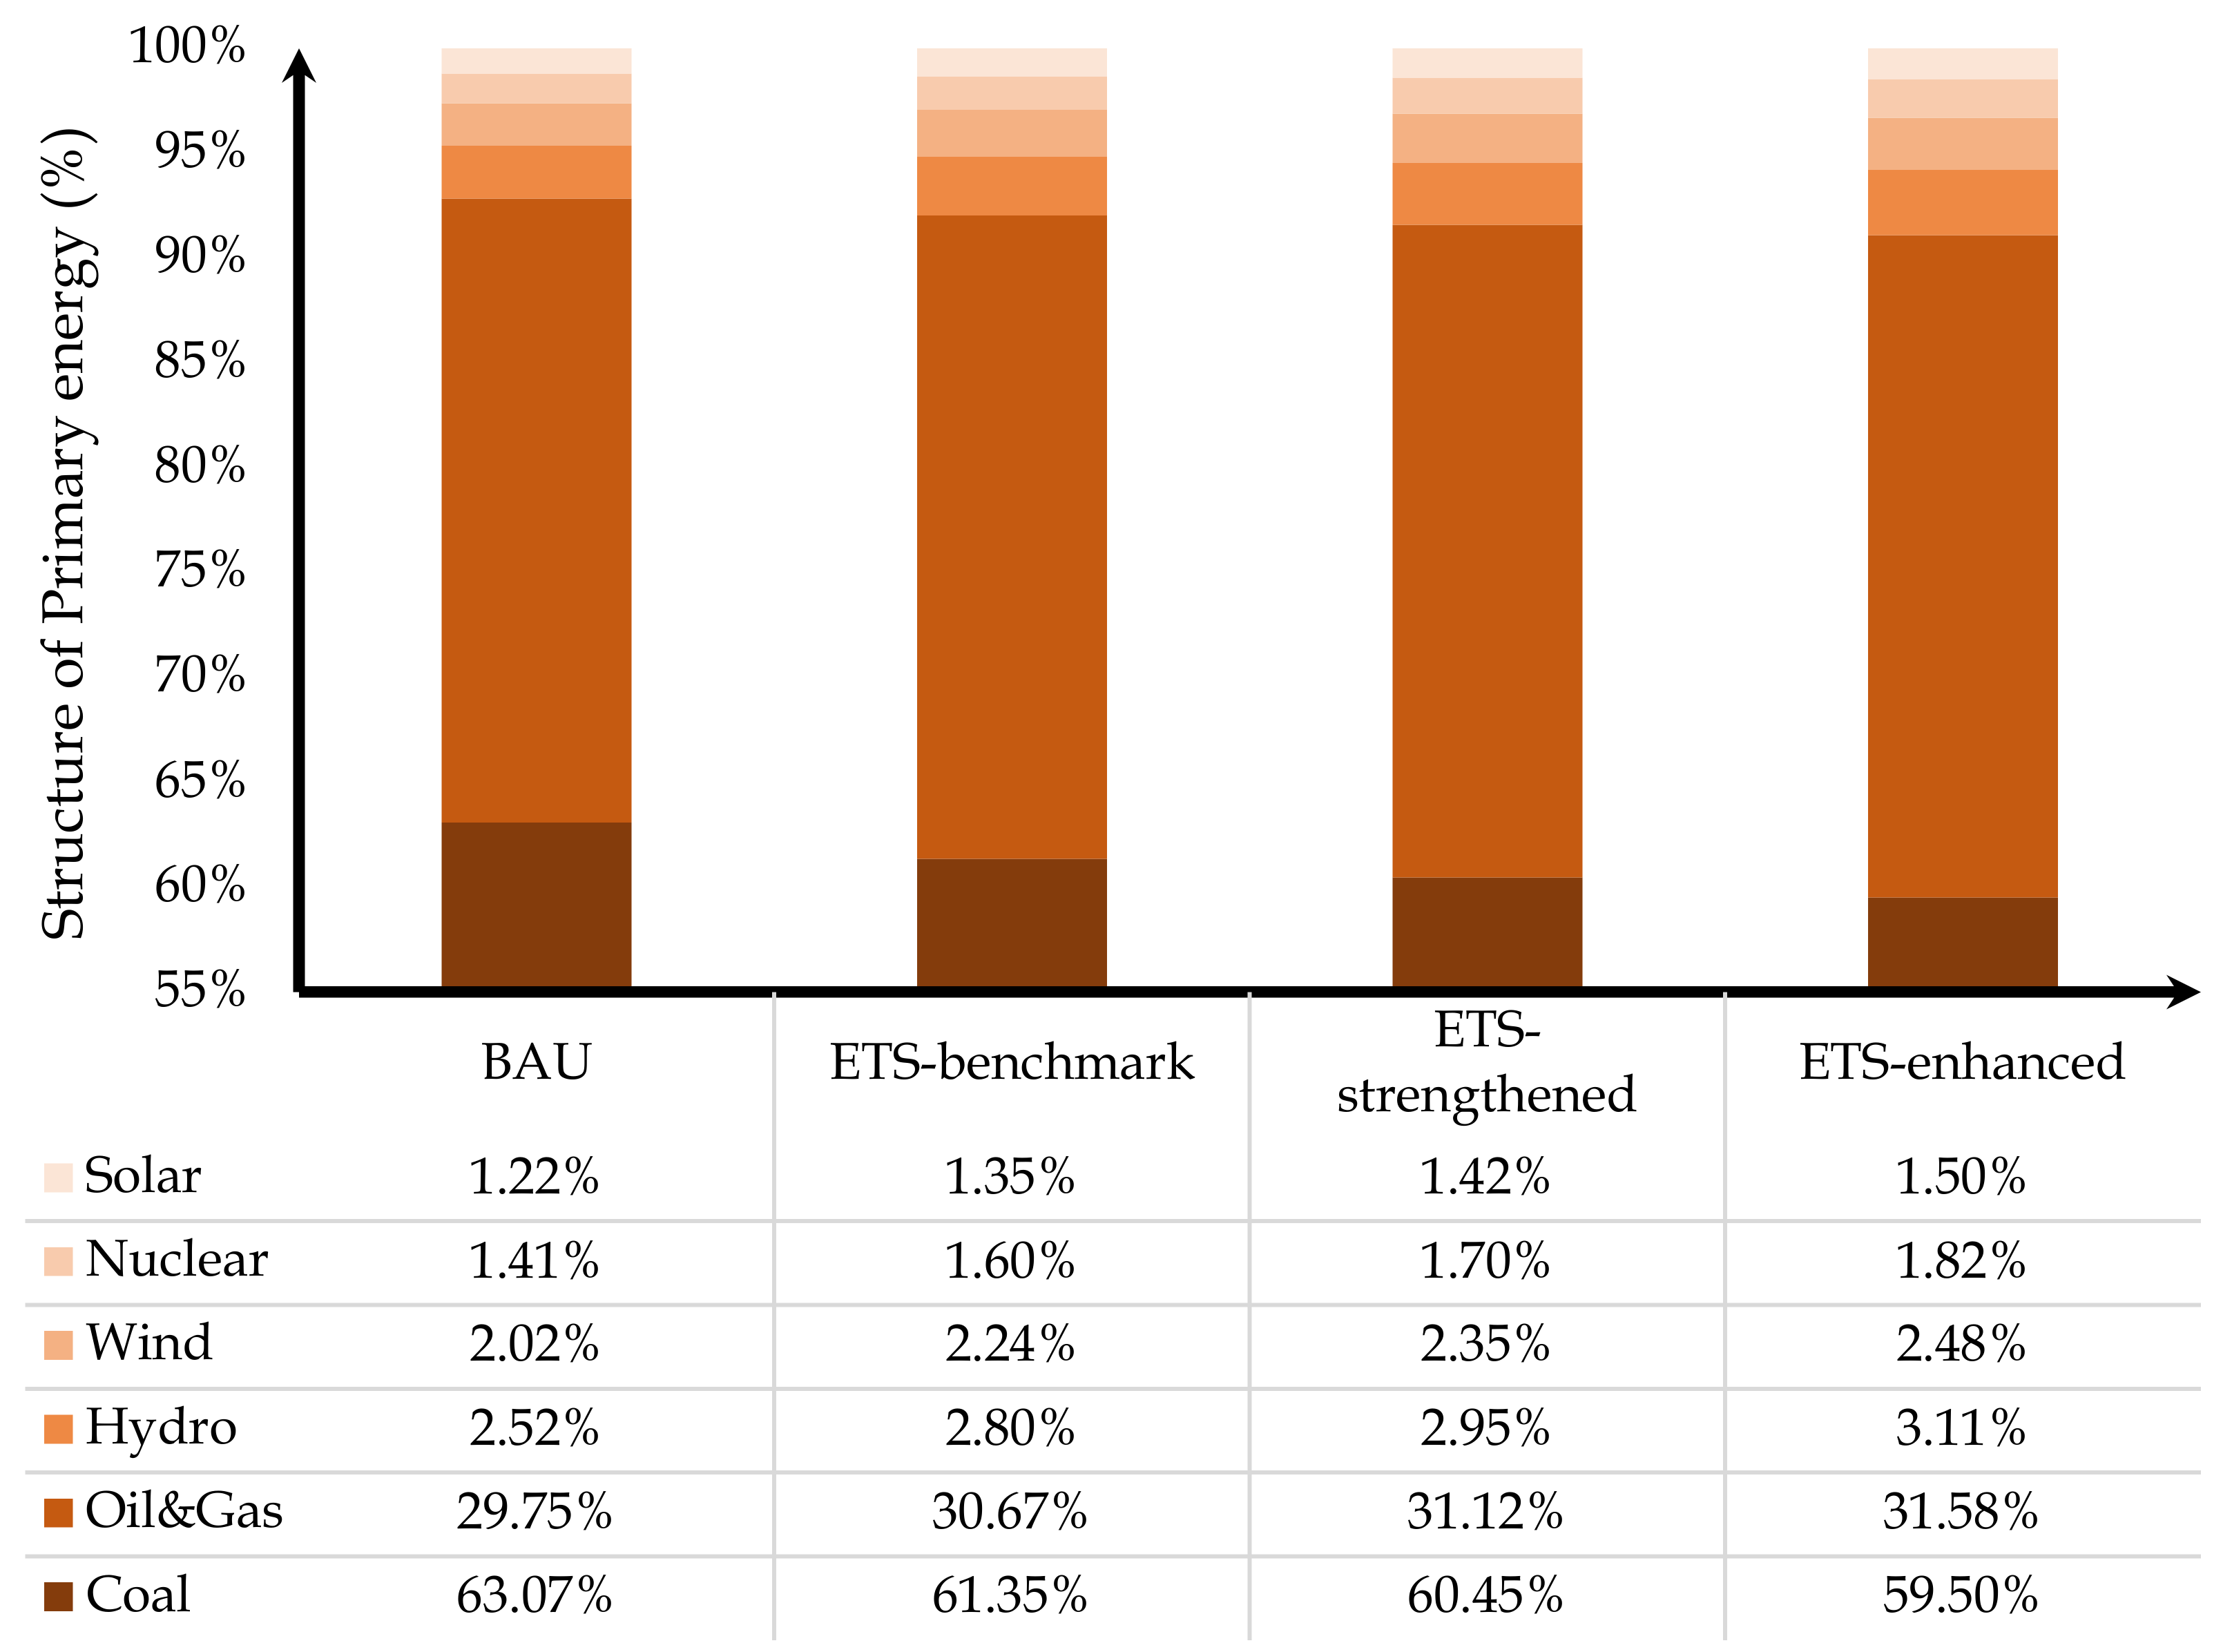
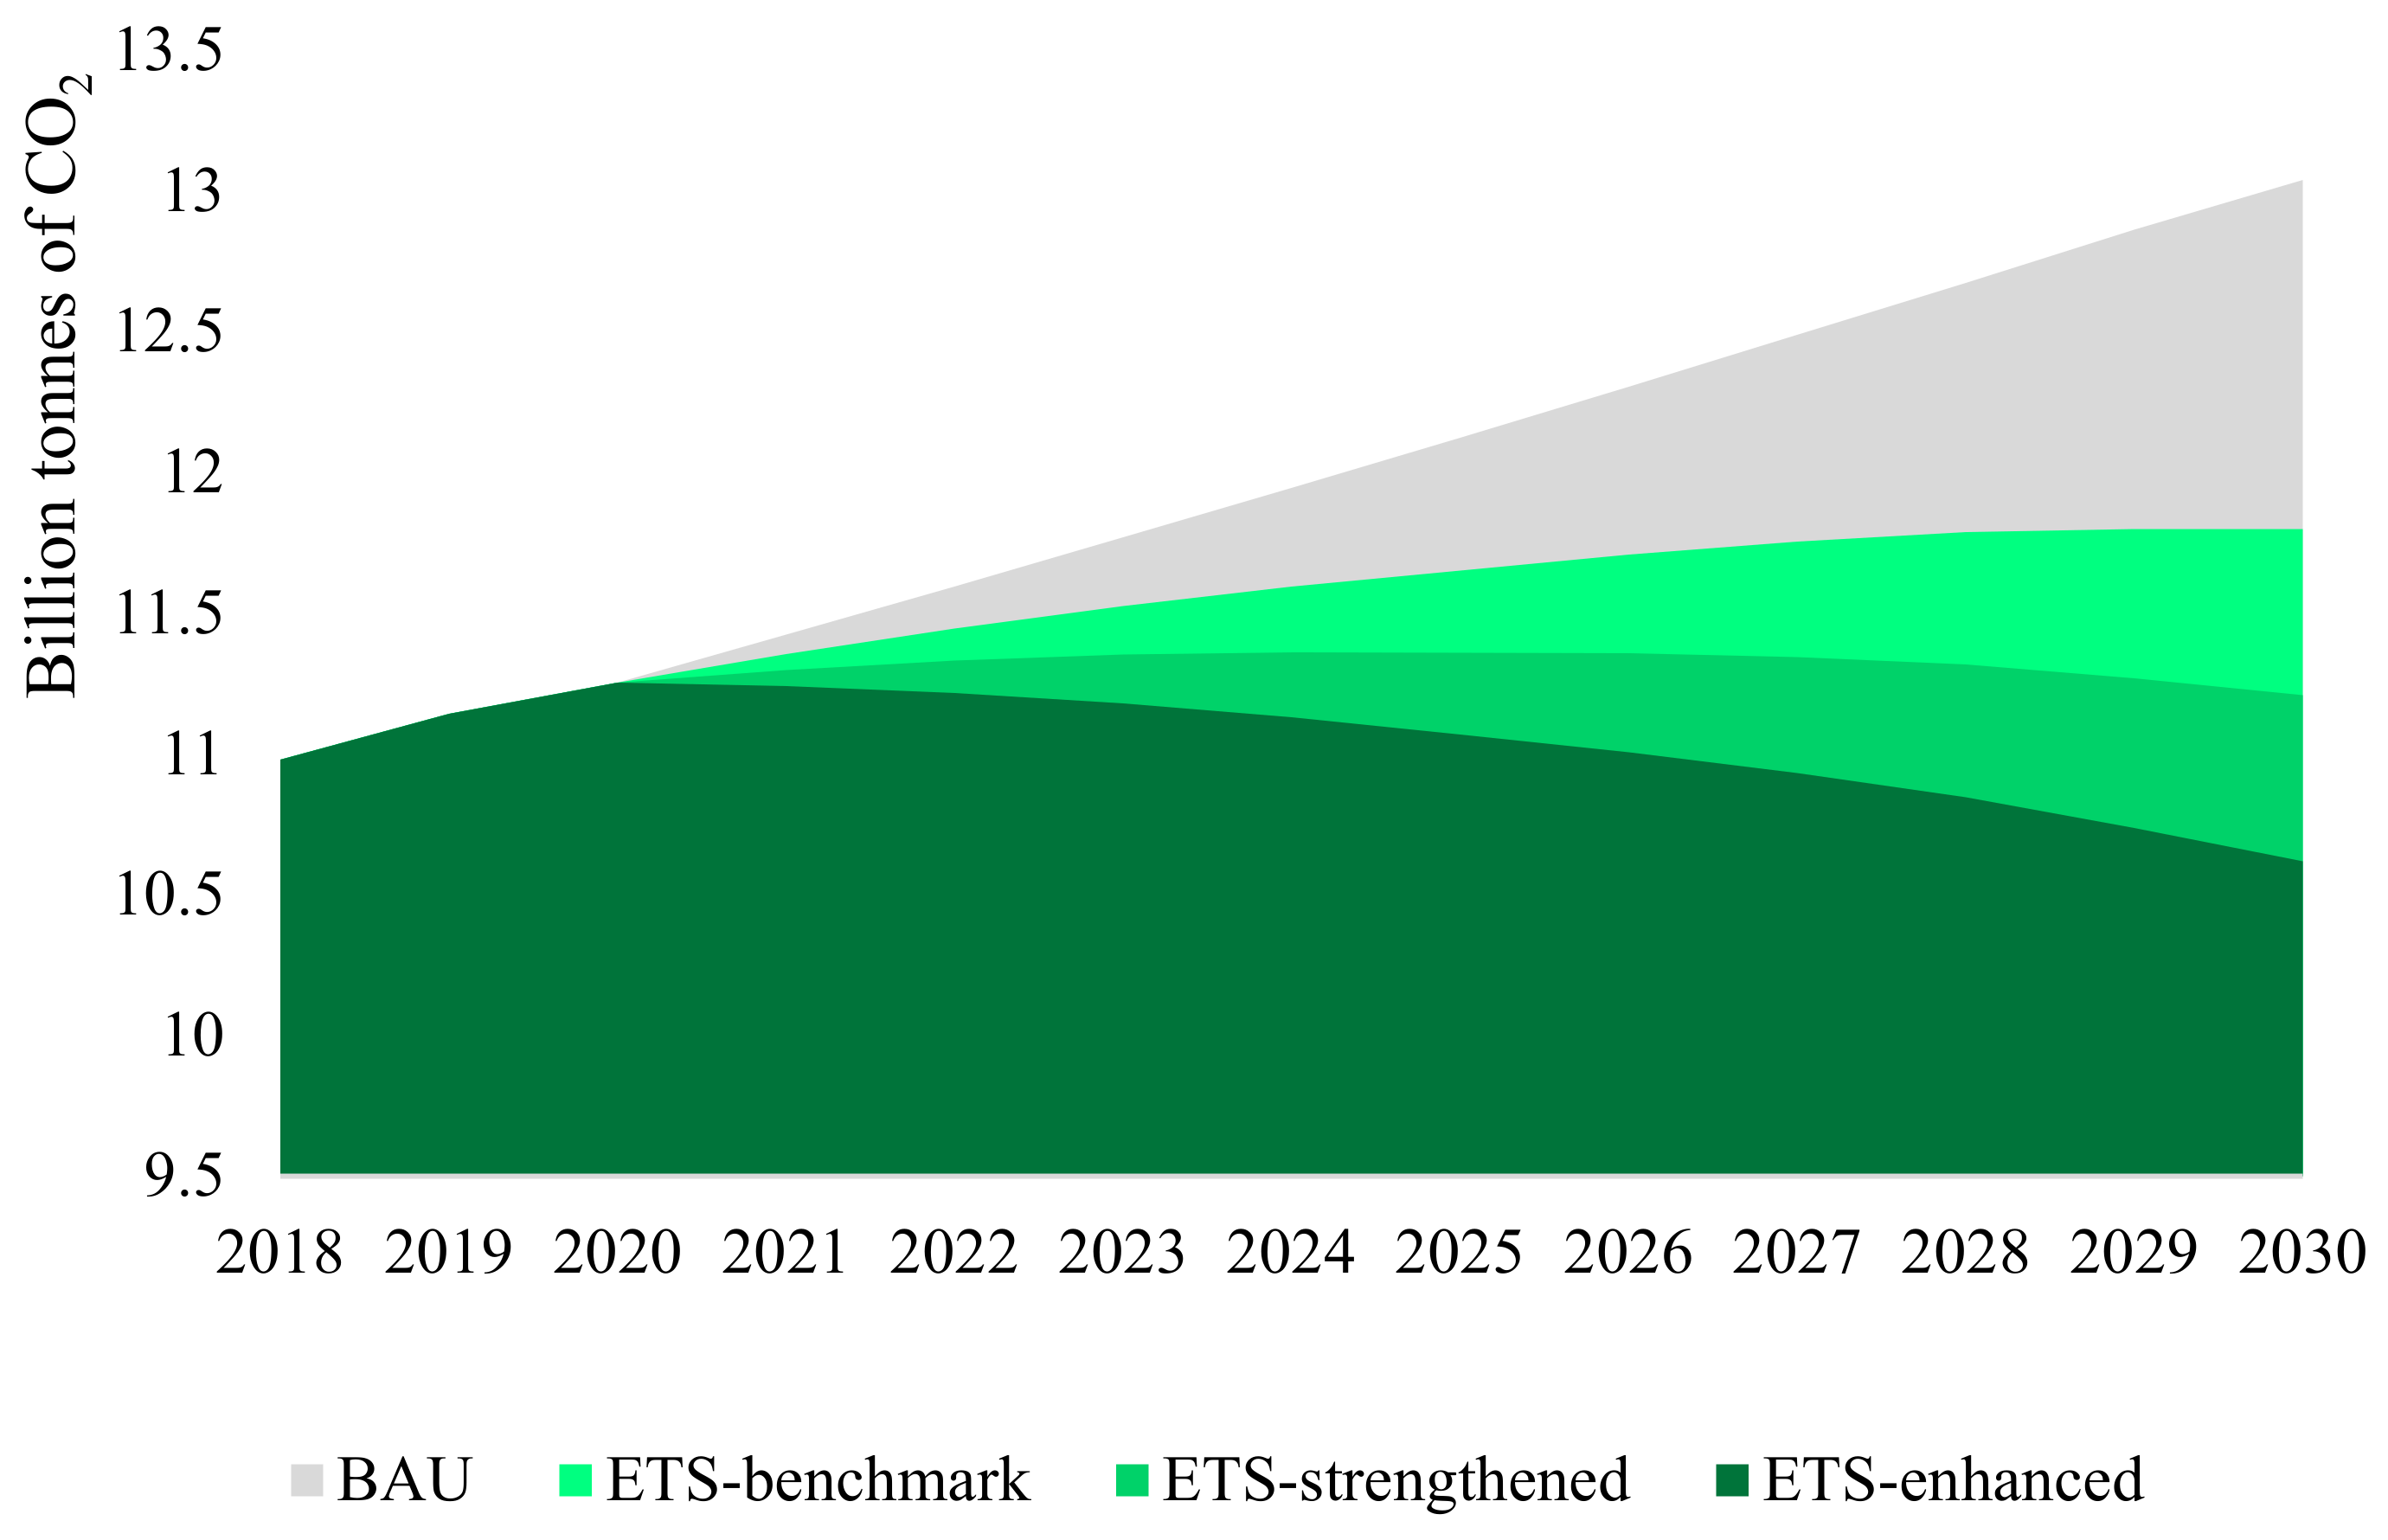
3.2. Impact on Primary Energy Mix and CO2 Emissions

In order to explore the reasons why the electricity generation sector of renewable energy has not been greatly positively influenced, this paper further investigates the carbon emissions in different scenarios and the shares of fossil energy. Specifically, refer to Figure 3 and Figure 4 for detailed information. Overall, carbon trading significantly reduces the share of coal and partially increases the overall share of renewable energy, mainly due to the arrival of carbon trading, which greatly reduces the use of primary energy, especially fossil energy. The share of coal decreases from 62.75% in the Business as Usual (BAU) scenario to 59.50% and 61.35% in the three counterfactual scenarios. The share of renewable energy increases from 7.65% to 7.98% to 8.92% in the three counterfactual scenarios. The transition towards clean energy is becoming increasingly evident with higher ambitions for carbon reduction. Additionally, it can be observed that there is a certain substitution relationship between oil, natural gas, and coal. Taking the ETS-benchmark scenario as an example, the consumption shares of oil and natural gas increase from 29.60% in the BAU scenario to 36.70% in the ETS-benchmark scenario. This clearly reflects the transformation of China’s energy system from high-carbon to low-carbon, and even a clean energy system.
Although the share of oil and natural gas has increased, it does not mean that their total consumption has increased. This can be indirectly confirmed by the evidence in Figure 4, which shows the carbon emissions in all scenarios. Strictly speaking, these scenarios are all exogenous variables in the model, which means they are given by us. In economic terms, it is assumed that the government regulates the total amount of carbon emission rights trading to regulate the overall carbon emissions. This assumption has some practical significance because the government does adjust the annual total carbon quota based on the overall macroeconomic and carbon emission situation. We can see that in the ETS-benchmark scenario, carbon emissions barely peak in 2030, which is the target promised by the Chinese government. However, based on the current carbon emission trajectory, the Chinese government is likely to achieve carbon peak before 2030, such as in the ETS-strengthened scenario where the peak is reached in 2025. Compared to the BAU scenario, the ETS-benchmark, ETS-strengthened, and ETS-enhanced scenarios reduce carbon emissions by 5.00%, 9.75%, and 14.50%, respectively, in the year 2030, with cumulative carbon emission reductions of 2.49 billion, 5.71 billion, and 8.93 billion tons, approximately 7.3%, 16.8%, and 26.3% of the global total carbon emissions in 2020.

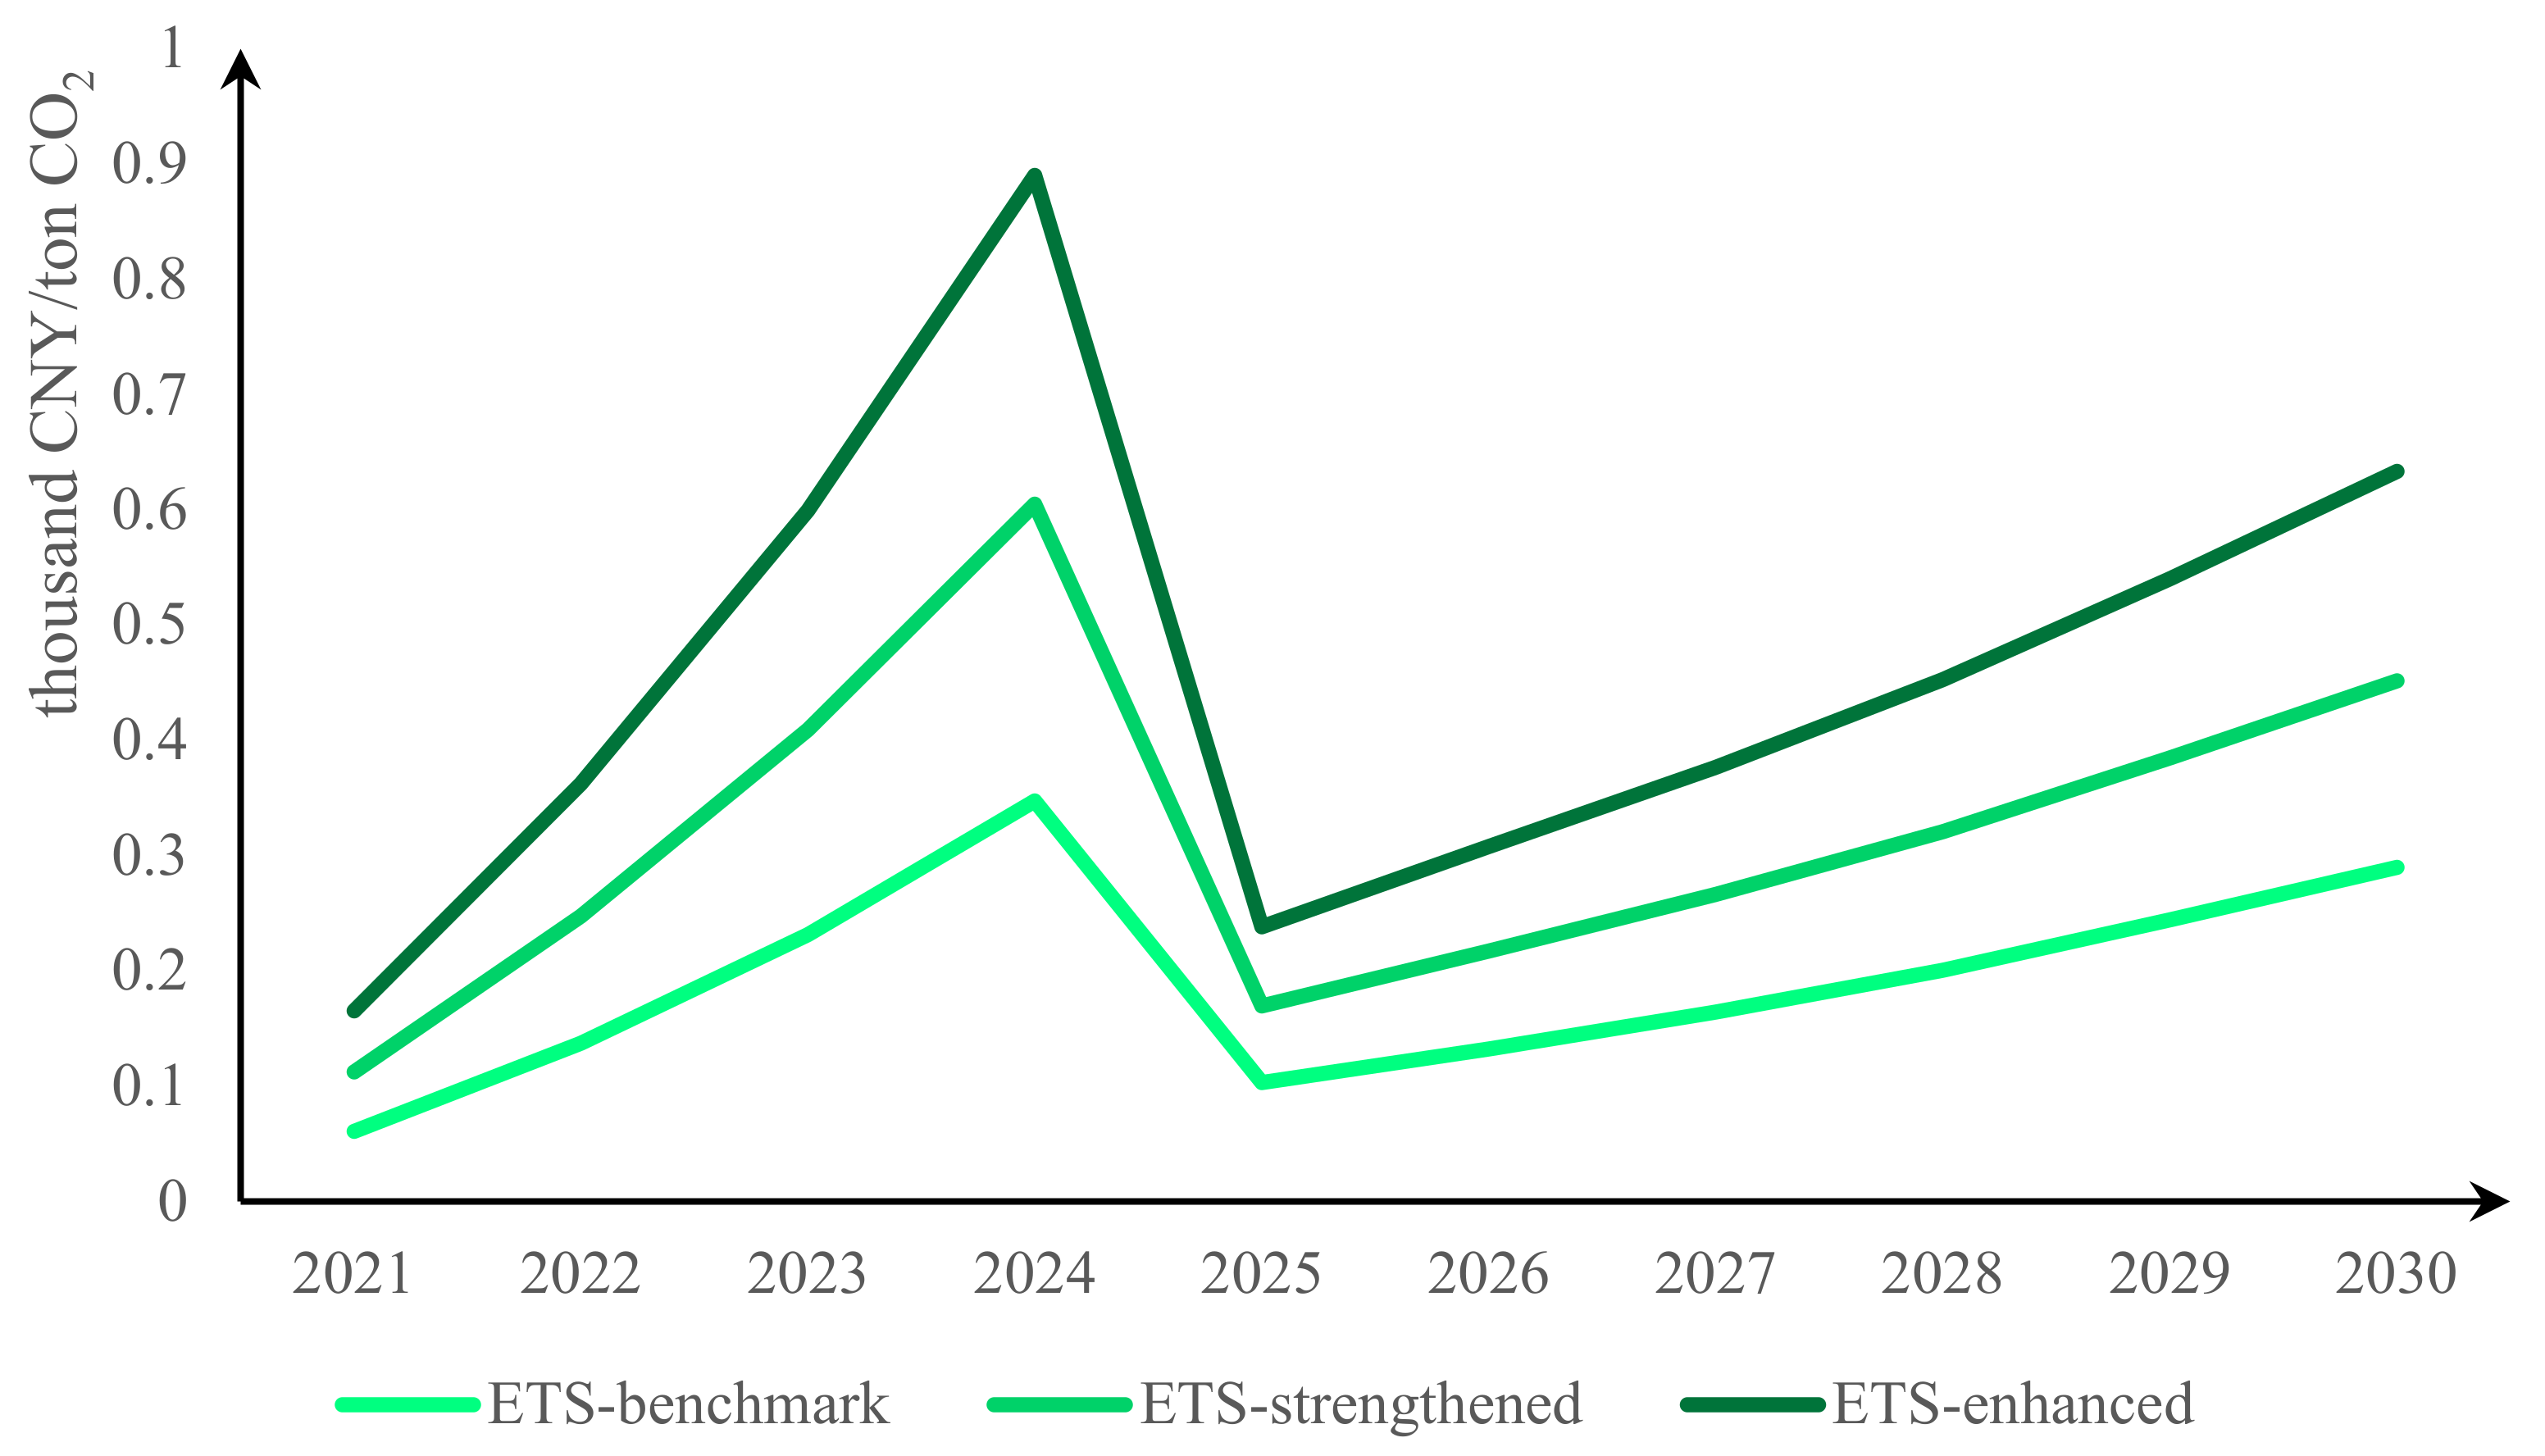
3.3. Impact on Carbon Pricing

In order to examine the variations in carbon trading prices under different carbon trading scenarios, we conducted an investigation of price fluctuations in carbon emission allowances in three different scenarios, as depicted in Figure 5. We found that between 2021 and 2024, the prices of carbon emission allowances gradually increased, with the carbon trading price under the ETS-enhanced scenario reaching close to 1000 CNY per ton. However, all carbon trading prices experienced a significant decrease in 2025, followed by a subsequent annual increase. The main reason lies in the assumption made in this study that, starting from 2025, the coverage of China’s carbon trading shifted from solely the power sector to the eight energy-intensive industries regulated by the National Development and Reform Commission in 2016. Due to the relatively high marginal abatement costs in the power sector compared to other energy-intensive industries, the prices of carbon emission allowances in the years 2021 to 2024 were relatively higher. However, after the inclusion of other energy-intensive industries with relatively lower marginal costs after 2025, the carbon trading prices did not remain as high as before.
Additionally, we observed a fundamental relationship that higher carbon ambition corresponds to higher carbon trading prices. In the three scenarios for 2030, carbon emission reductions of 620 million tons, 1.21 billion tons, and 1.8 billion tons corresponded to carbon trading prices of 290 CNY per ton, 452 CNY per ton, and 633 CNY per ton, respectively. The increased prices of carbon emission allowances would significantly elevate the cost of fossil fuel utilization and amplify the share of renewable energy sources.

4. Further Analysis

In order to gain further insights into the impact of carbon trading on renewable energy, we conducted a detailed analysis of the producer price index (PPI) and Gross Domestic Product (GDP).

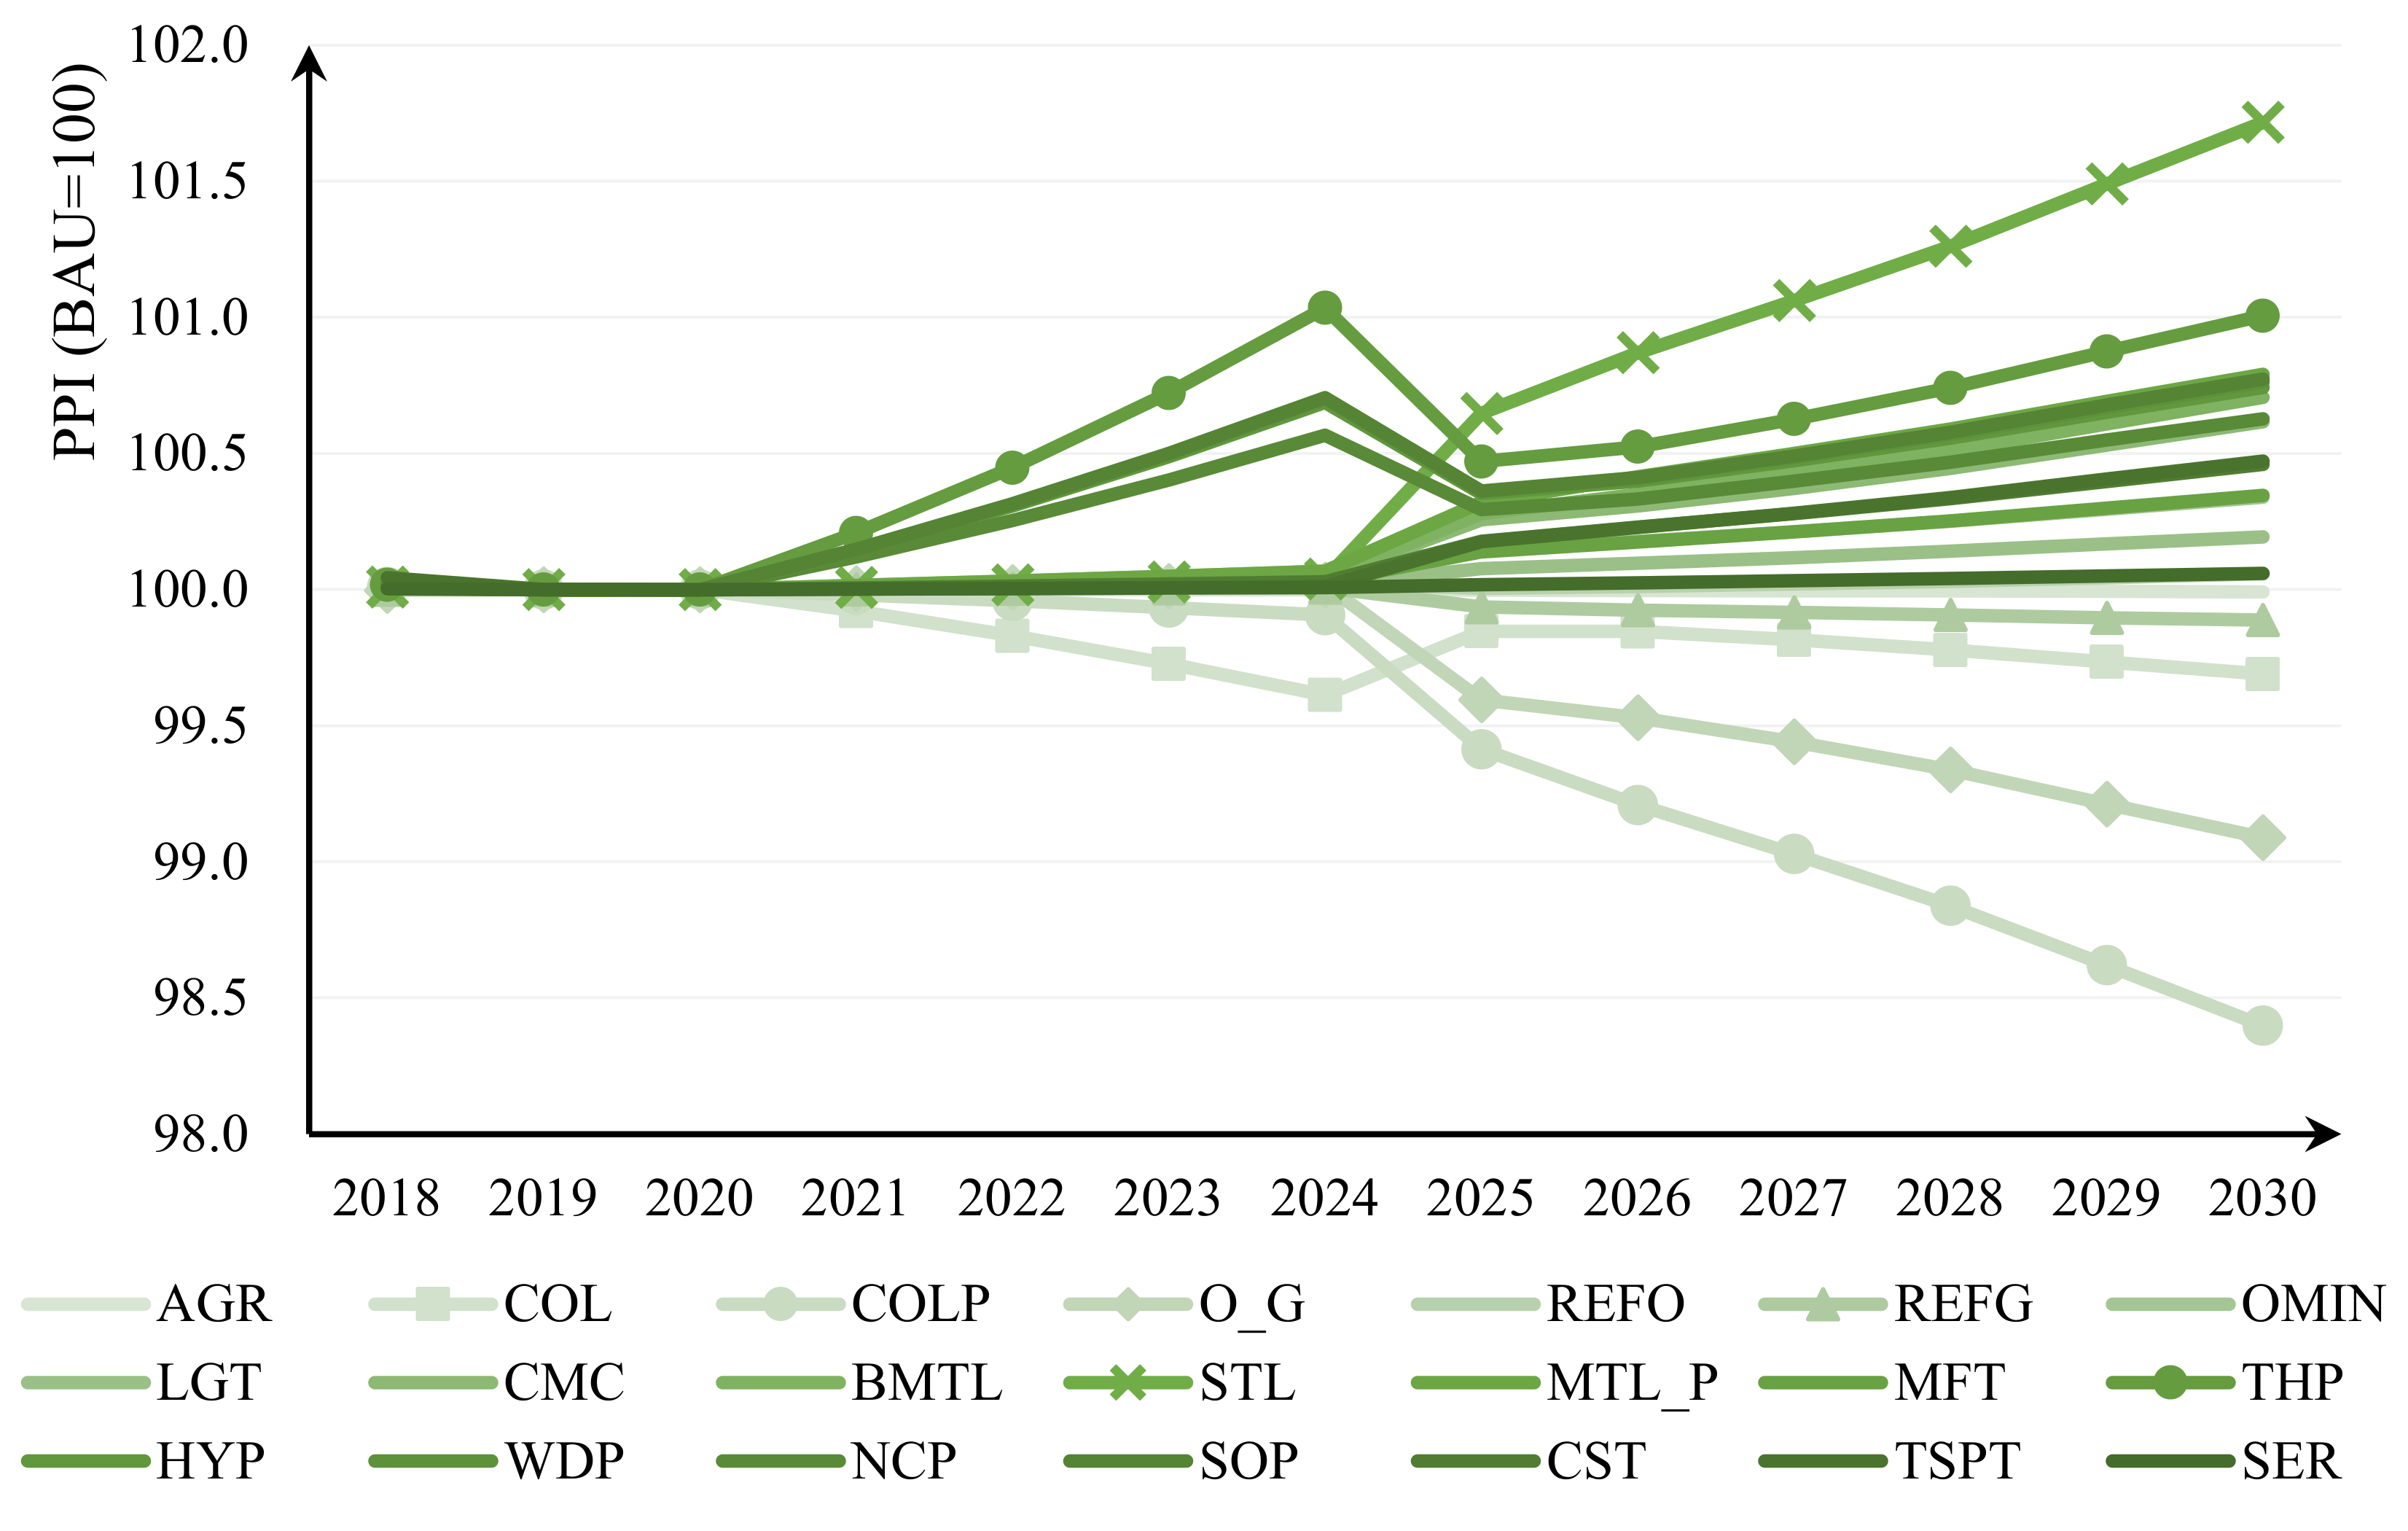
4.1. Producer Price Index
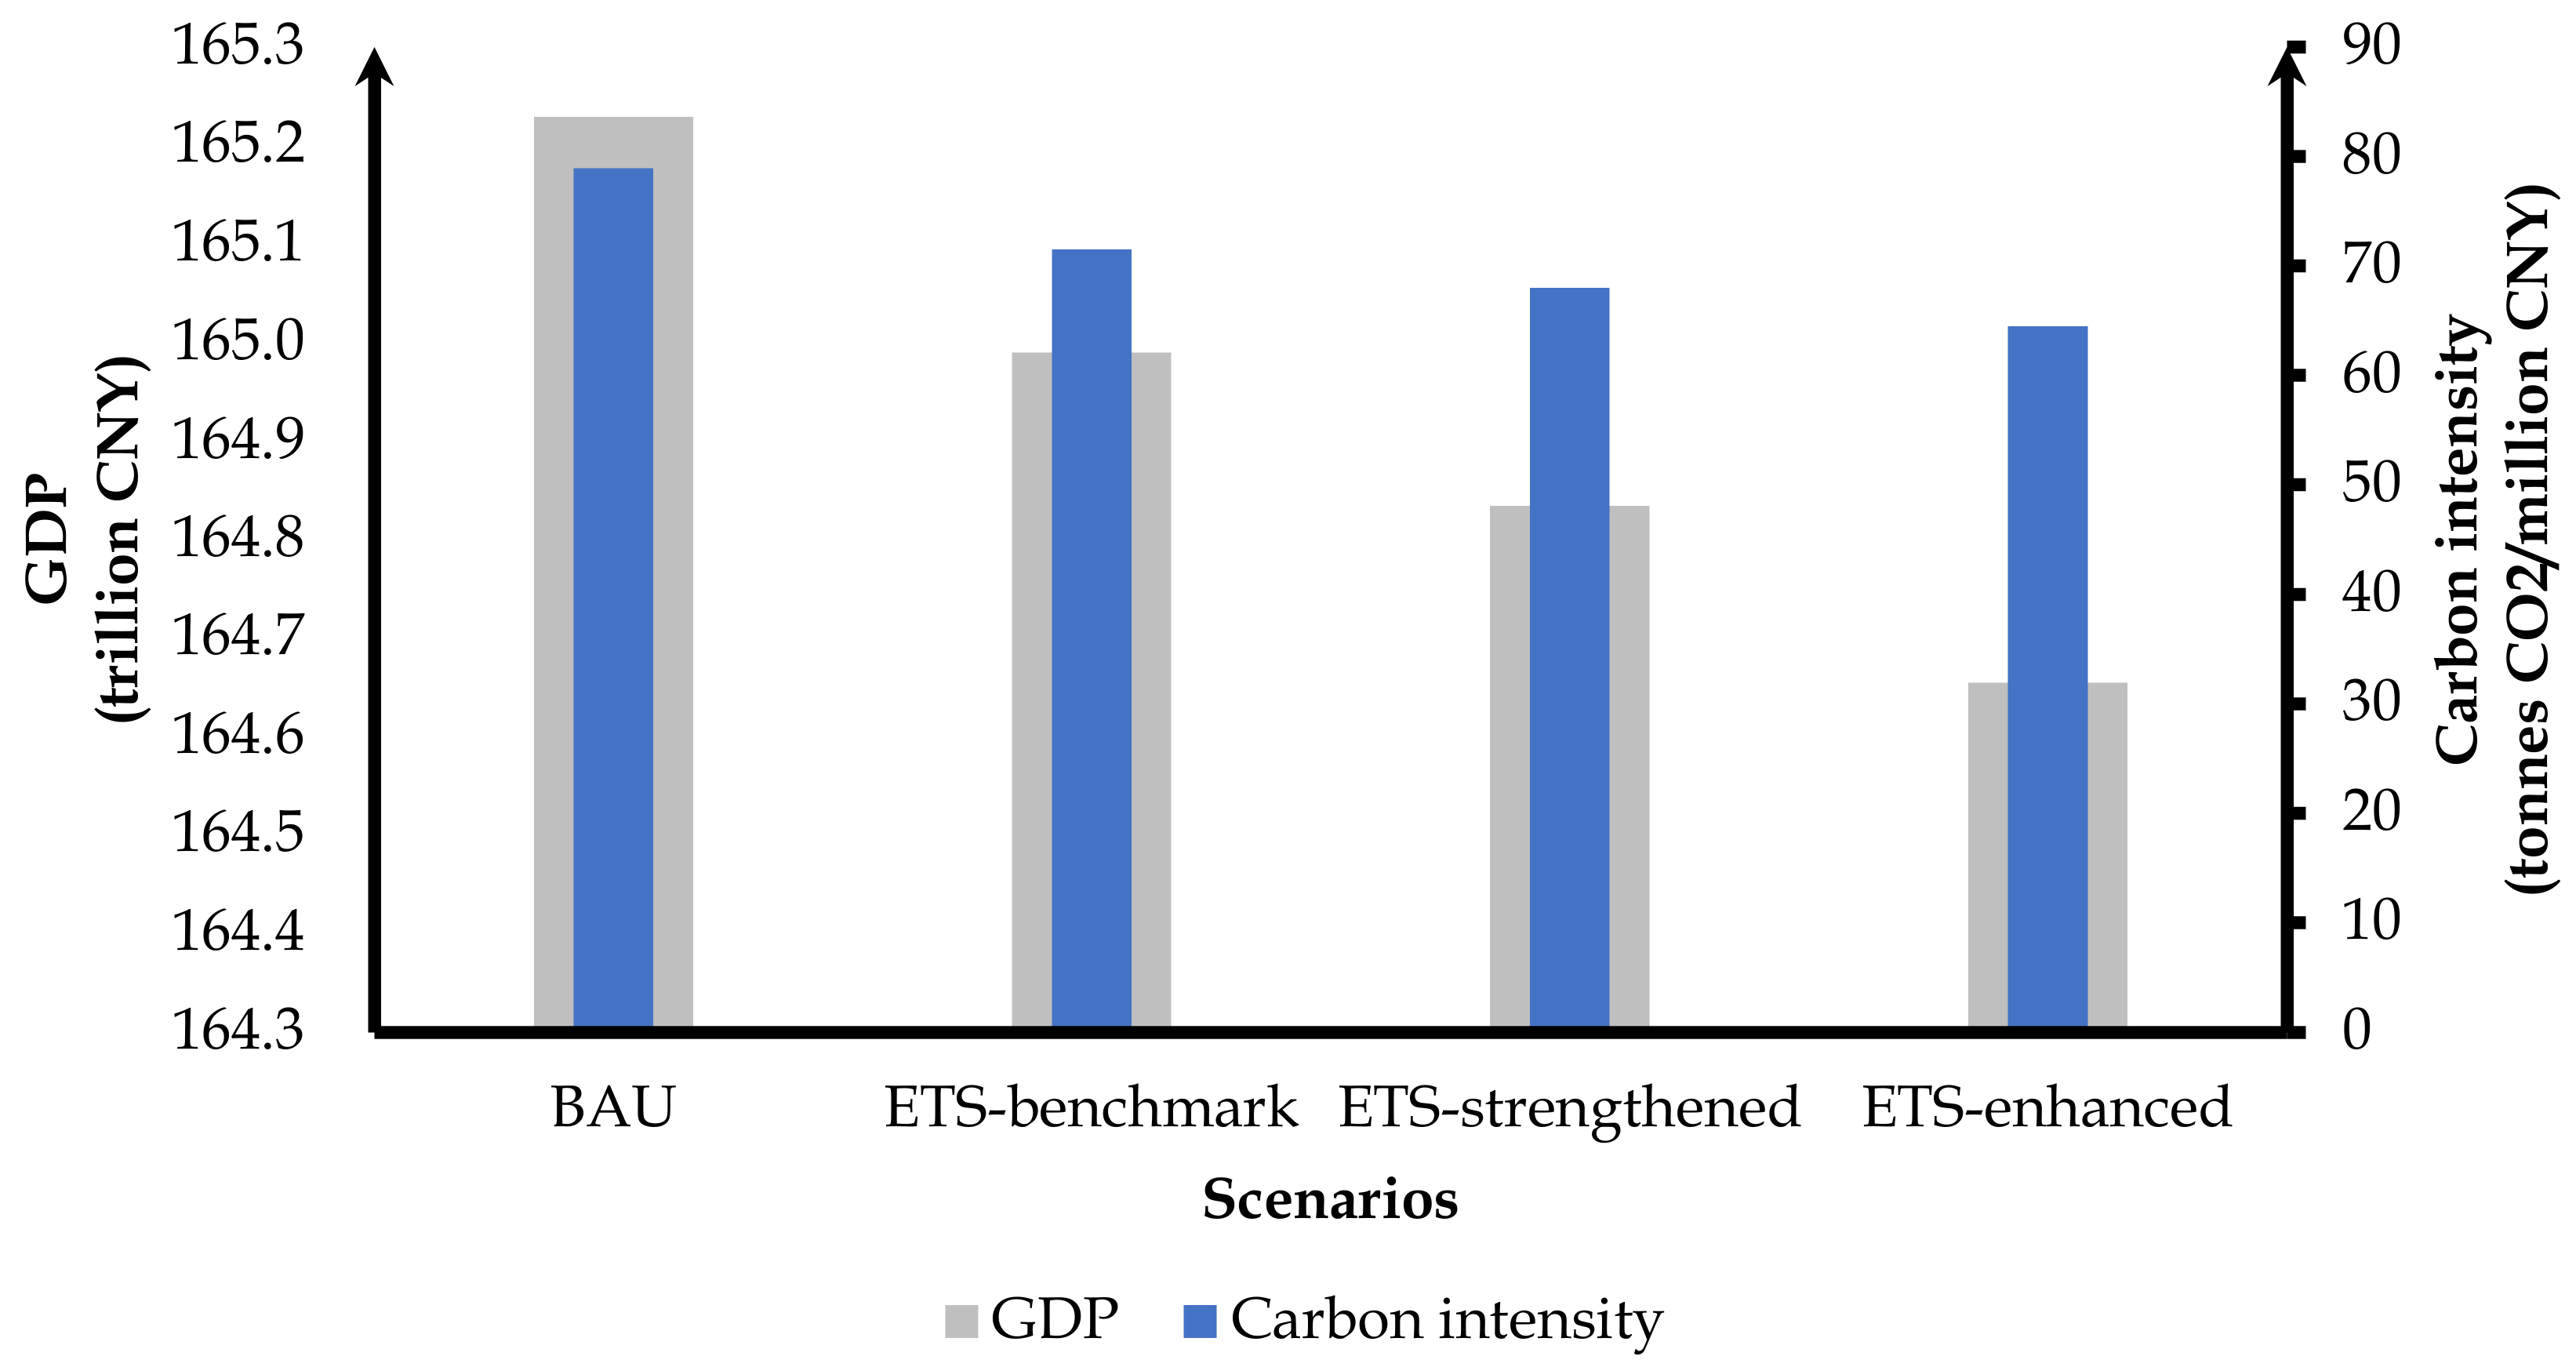
Figure 6 depicts the fluctuations of the producer price index (PPI) under the ETS-benchmark scenario compared to the BAU scenario in 2030. We found that the price fluctuations were transmitted along the industrial chain, significantly narrowing the PPI for upstream industries, particularly the primary energy sector and energy processing industry. On the other hand, certain secondary industries, specifically the manufacturing industry, experienced relatively high positive impacts on their PPI. For example, industries such as coal mining, coal processing, oil and gas extraction, and natural gas refining exhibited a reduction in PPI ranging from 0.11% to 1.6% compared to the BAU scenario. The decline in PPI in these industries can be attributed to the fact that carbon trading increases the energy usage costs for energy users, therefore reducing energy demand and, subsequently, lowering the producer prices in these sectors. Since the producer price directly corresponds to the selling price in each industry, we can infer that carbon emission trading decreases the selling prices in these industries. Carbon trading can be seen as a tax wedge that decreases seller prices and transaction volume but increases buyer prices.
At the same time, we observed a significant increase in PPI for certain high-energy-consuming industries, particularly the steel and thermal power sectors. The pronounced increase in PPI for these industries can be explained by their high-energy intensity and relatively higher proportion of energy inputs in their total inputs compared to other high-energy-consuming industries. Therefore, the PPI increase is more evident in these industries. However, it should be noted that the substantial rise in PPI for the steel industry occurs after 2025, which is a result of the industry coverage settings in this study. We assumed that carbon emission trading only included the power sector from 2021 to 2024, but from 2025 to 2030, high-energy-consuming industries, including steel, cement, construction materials, chemicals, aviation, and petrochemicals, were integrated into the carbon trading system. Consequently, the general increase in PPI for these industries occurred in and after 2025. However, the rise in PPI for the thermal power industry can actually have positive implications for the development of renewable energy.

4.2. GDP

Figure 7 illustrates the GDP and carbon intensity in 2030 under different scenarios. We can observe that when the intensity of carbon trading is relatively low (indicating a lower carbon emission reduction ambition), the decrease in carbon intensity is not significantly higher compared to the decrease in GDP. Specifically, the GDP losses in the three scenarios are 0.145%, 0.239%, and 0.348%, respectively, while the reductions in CO2 emissions are 9.52%, 14.05%, and 18.57%, respectively. The carbon trading with higher intensity shows greater effectiveness in carbon emissions reduction, but it also comes with higher marginal abatement costs. For example, compared to the ETS-benchmark scenario, the ETS-enhanced scenario reduces more carbon emissions by 0.95 times, but the GDP loss is 1.38 times higher.
Furthermore, considering the promoting effect of carbon trading on renewable energy, we can draw similar conclusions. Both the ETS-strengthened and ETS-enhanced scenarios are more favorable for the development of renewable energy, thus a more favorable carbon intensity.

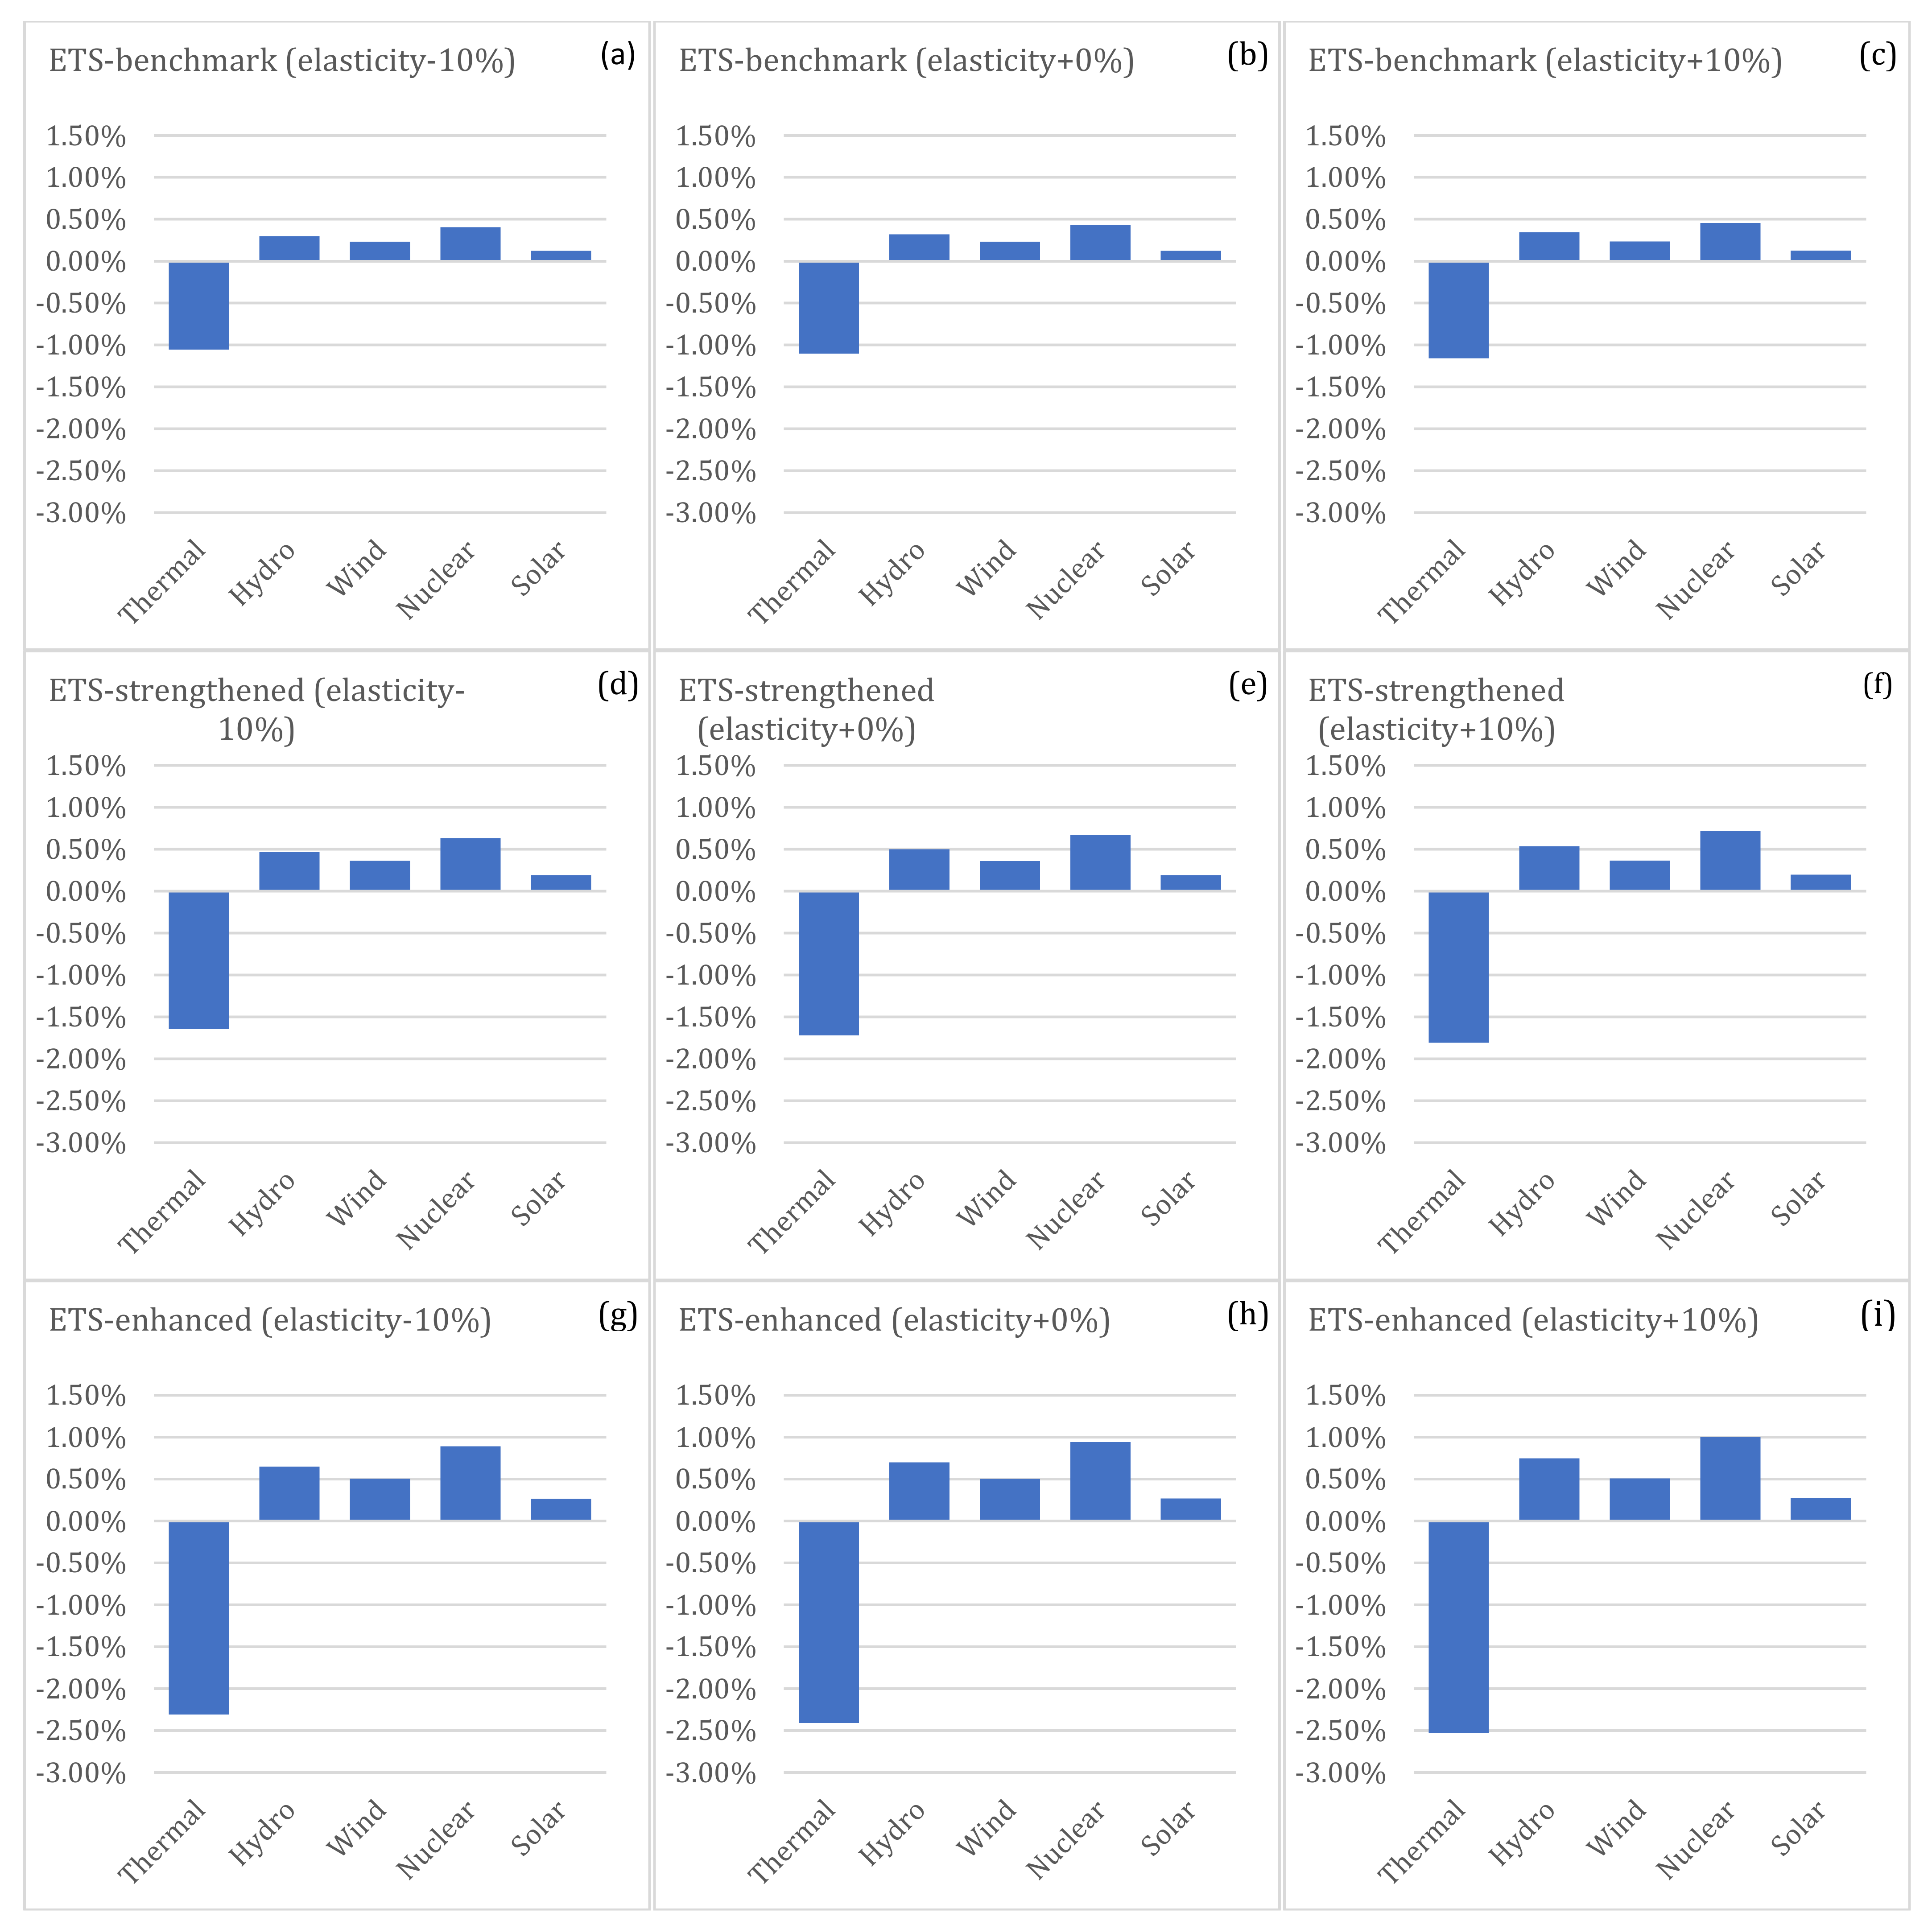
4.3. Sensitivity Analysis

There is a certain degree of uncertainty in the modeling process. This is because the subjective setting of the elasticity of the production function and calibration of other exogenous parameters are based on these elasticities and actual data. As a result, the predicted results of the model are often influenced by the magnitudes of these elasticities. In order to test the stability of our conclusions, we assume that all the elasticities we have set are increased or decreased by 10%, and then compare the changes in our core findings. Figure 8 report the results of the sensitivity analysis and shows that the key conclusion is robust.

5. Conclusions

The study conducted in this paper aimed to examine the impact of carbon emission trading on renewable energy in China. Three different scenarios were considered: the Business as Usual (BaU) scenario, the Emission Trading Scheme (ETS)-benchmark scenario, and the ETS-strengthened and ETS-enhanced scenarios.
The findings of this study indicate that carbon emission trading has a certain effect on electricity consumption. With the implementation of carbon trading, the price difference between renewable energy and fossil fuels decreases, leading to a preference for renewable energy. As a result, electricity generation from renewable sources increases in all scenarios compared to the BaU scenario.
However, the share of renewable energy does not seem to be greatly influenced by carbon emission trading. The increase in the proportion of renewable energy generation is influenced by factors such as substitution effects and income effects. The income effect refers to the higher cost of using fossil fuels due to carbon trading, leading energy consumers to prefer electricity in general, not just renewable electricity. The substitution effect refers to the cost advantage of renewable energy generation over thermal power generation due to the introduction of carbon trading. This effect increases with the increase in carbon trading prices. In scenarios where carbon trading is not very strict, the ratio of income effect to substitution effect is higher, resulting in a slight increase in the share of renewable energy. However, in the ETS-strengthened and ETS-enhanced scenarios, the substitution effect on the share of renewable energy generation is much greater than the income effect, leading to a higher increase in renewable energy generation and share.
Furthermore, the study found that carbon trading significantly reduces the share of coal and increases the overall share of renewable energy. The transition towards clean energy is becoming increasingly evident with higher ambitions for carbon reduction. Additionally, a certain substitution relationship between oil, natural gas, and coal was observed. The consumption shares of oil and natural gas increase in scenarios with carbon trading, reflecting the transformation of China’s energy system from high-carbon to low-carbon, and even a clean energy system.
The following research recommendations can be made for future studies: (1) Since the study found that the substitution effect of carbon trading on the share of renewable energy generation increases with higher carbon trading prices, further research can be conducted to examine the specific impact of different carbon trading prices on renewable energy generation. (2) The study mentioned that the income effect, which refers to the higher cost of using fossil fuels due to carbon trading, can lead energy consumers to prefer electricity in general, not just renewable electricity. Further research can be conducted to examine the factors influencing the income effect, such as the price sensitivity of different consumer groups, to better understand its impact on renewable energy generation. (3) The study focused on the overall impact of carbon emission trading on renewable energy generation in China. Future research can examine the regional variations of this impact, considering factors such as the availability of renewable energy resources and the existing energy infrastructure in different regions. This can provide insights into the effective implementation of carbon trading policies at the regional level.

Author Contributions

Conceptualization, S.H. and Z.J.; methodology, Z.J.; formal analysis, C.D., X.J., and D.Z.; investigation, S.H.; data curation, S.W.; writing—original draft preparation, S.H. and S.W.; writing—review and editing, S.W.; visualization, S.W.; supervision, Z.J.; funding acquisition, S.H. All authors have read and agreed to the published version of the manuscript.

Funding

This research received support by the provincial management industrial unit of State Grid Zhejiang Electric Power Co., Ltd. (Project Title: Research on Key Technologies for Deriving the Development Path of Renewable Energy and Electrification Considering Carbon Trading and Emissions in the Dual Carbon Background; Project number: 2022-KJLH-SJ-018). This funding source had no role in the design of this study and will not have any role during its execution, analyses, interpretation of the data, or decision to submit results.

Institutional Review Board Statement

Not applicable.

Informed Consent Statement

Not applicable.

Data Availability Statement

The data available are in a publicly accessible repository that does not issue DOIs.

Conflicts of Interest

The authors declare no conflict of interest.

References

  1. Cao, R.; Xiao, Y.; Yin, F. Spatio-Temporal Evolution of High-Quality Development and the Impact of Carbon Emissions Trading Schemes. Sustainability 2023, 15, 2900. [Google Scholar] [CrossRef]
  2. Zhang, R.; Fujimori, S.; Dai, H.; Hanaoka, T. Contribution of the Transport Sector to Climate Change Mitigation: Insights from a Global Passenger Transport Model Coupled with a Computable General Equilibrium Model. Appl. Energy 2018, 211, 76–88. [Google Scholar] [CrossRef]
  3. Salehi, M.; Fahimifard, S.H.; Zimon, G.; Bujak, A.; Sadowski, A. The Effect of CO2 Gas Emissions on the Market Value, Price and Shares Returns. Energies 2022, 15, 9221. [Google Scholar] [CrossRef]
  4. Zheng, L.; Omori, A.; Cao, J.; Guo, X. Environmental Regulation and Corporate Environmental Performance: Evidence from Chinese Carbon Emission Trading Pilot. Sustainability 2023, 15, 8518. [Google Scholar] [CrossRef]
  5. Xu, S.; Pan, W.; Wen, D. Do Carbon Emission Trading Schemes Promote the Green Transition of Enterprises? Evidence from China. Sustainability 2023, 15, 6333. [Google Scholar] [CrossRef]
  6. Higgins, A.; Foliente, G.; McNamara, C. Modelling Intervention Options to Reduce GHG Emissions in Housing Stock—A Diffusion Approach. Technol. Forecast. Soc. Change 2011, 78, 621–634. [Google Scholar] [CrossRef]
  7. Ortas, E.; Álvarez, I. The Efficacy of the European Union Emissions Trading Scheme: Depicting the Co-Movement of Carbon Assets and Energy Commodities through Wavelet Decomposition. J. Clean. Prod. 2015, 116, 40–49. [Google Scholar] [CrossRef]
  8. Creti, A.; Joets, M. Multiple Bubbles in the European Union Emission Trading Scheme. Energy Policy 2017, 107, 119–130. [Google Scholar] [CrossRef]
  9. Koch, N.; Themann, M. Catching up and Falling behind: Cross-Country Evidence on the Impact of the EU ETS on Firm Productivity. Resour. Energy Econ. 2022, 69, 101315. [Google Scholar] [CrossRef]
  10. Pattak, D.C.; Tahrim, F.; Salehi, M.; Voumik, L.C.; Akter, S.; Ridwan, M.; Sadowska, B.; Zimon, G. The Driving Factors of Italy’s CO2 Emissions Based on the STIRPAT Model: ARDL, FMOLS, DOLS, and CCR Approaches. Energies 2023, 16, 5845. [Google Scholar] [CrossRef]
  11. Jia, Z. The Hidden Benefit: Emission Trading Scheme and Business Performance of Downstream Enterprises. Energy Econ. 2023, 117, 106488. [Google Scholar] [CrossRef]
  12. Hanoteau, J.; Talbot, D. Impacts of the Québec Carbon Emissions Trading Scheme on Plant-Level Performance and Employment. Carbon Manag. 2019, 10, 287–298. [Google Scholar] [CrossRef]
  13. Richter, J.L.; Mundaca, L. Achieving and Maintaining Institutional Feasibility in Emissions Trading: The Case of New Zealand. Mitig. Adapt. Strateg. Glob. Change 2015, 20, 1487–1509. [Google Scholar] [CrossRef]
  14. Inderberg, T.H.J.; Bailey, I.; Harmer, N. Designing New Zealand’s Emissions Trading Scheme. Glob. Environ. Politics 2017, 17, 31–50. [Google Scholar] [CrossRef]
  15. Wei, Y.; Li, Y.; Wang, Z. Multiple Price Bubbles in Global Major Emission Trading Schemes: Evidence from European Union, New Zealand, South Korea and China. Energy Econ. 2022, 113, 106232. [Google Scholar] [CrossRef]
  16. Wang-Helmreich, H.; Kreibich, N. The Potential Impacts of a Domestic Offset Component in a Carbon Tax on Mitigation of National Emissions. Renew. Sustain. Energy Rev. 2019, 101, 453–460. [Google Scholar] [CrossRef]
  17. Yan, Y.; Sun, M.; Guo, Z. How Do Carbon Cap-and-Trade Mechanisms and Renewable Portfolio Standards Affect Renewable Energy Investment? Energy Policy 2022, 165, 112938. [Google Scholar] [CrossRef]
  18. Chen, W.; Chen, J.; Ma, Y. Renewable Energy Investment and Carbon Emissions under Cap-and-Trade Mechanisms. J. Clean. Prod. 2021, 278, 123341. [Google Scholar] [CrossRef]
  19. Wei, C.; Li-Feng, Z.; Hong-Yan, D. Impact of Cap-and-Trade Mechanisms on Investments in Renewable Energy and Marketing Effort. Sustain. Prod. Consum. 2021, 28, 1333–1342. [Google Scholar] [CrossRef]
  20. Kim, K.-T.; Lee, D.-J.; An, D. Real Option Valuation of the R&D Investment in Renewable Energy Considering the Effects of the Carbon Emission Trading Market: A Korean Case. Energies 2020, 13, 622. [Google Scholar] [CrossRef]
  21. Qi, L.; Lin, X.; Shi, X.; Zhang, Y.; Pan, H.; Sharp, B. Feed-in Tariffs and the Carbon Emission Trading Scheme under China’s Peak Emission Target: A Dynamic CGE Analysis for the Development of Renewable Electricity. J. Environ. Manag. 2023, 335, 117535. [Google Scholar] [CrossRef] [PubMed]
  22. Chang, K.; Zhang, C.; Wang, H.W. Asymmetric Dependence Structures between Emission Allowances and Energy Markets: New Evidence from China’s Emissions Trading Scheme Pilots. Environ. Sci. Pollut. Res. 2020, 27, 21140–21158. [Google Scholar] [CrossRef] [PubMed]
  23. Bird, L.A.; Holt, E.; Levenstein Carroll, G. Implications of Carbon Cap-and-Trade for US Voluntary Renewable Energy Markets. Energy Policy 2008, 36, 2063–2073. [Google Scholar] [CrossRef]
  24. Zhang, M.; Ge, Y.; Liu, L.; Zhou, D. Impacts of Carbon Emission Trading Schemes on the Development of Renewable Energy in China: Spatial Spillover and Mediation Paths. Sustain. Prod. Consum. 2022, 32, 306–317. [Google Scholar] [CrossRef]
  25. Zimon, G.; Tarighi, H.; Salehi, M.; Sadowski, A. Assessment of Financial Security of SMEs Operating in the Renewable Energy Industry during COVID-19 Pandemic. Energies 2022, 15, 9627. [Google Scholar] [CrossRef]
  26. Huang, J.; Xue, F.; Song, X. Simulation Analysis on Policy Interaction Effects between Emission Trading and Renewable Energy Subsidy. J. Mod. Power Syst. Clean Energy 2013, 1, 195–201. [Google Scholar] [CrossRef]
  27. Ying, Z.; Xin-gang, Z. The Impact of Renewable Portfolio Standards on Carbon Emission Trading under the Background of China’s Electricity Marketization Reform. Energy 2021, 226, 120322. [Google Scholar] [CrossRef]
  28. Möst, D.; Fichtner, W. Renewable Energy Sources in European Energy Supply and Interactions with Emission Trading. Energy Policy 2010, 38, 2898–2910. [Google Scholar] [CrossRef]
  29. Jiang, C.; Wu, Y.-F.; Li, X.-L.; Li, X. Time-Frequency Connectedness between Coal Market Prices, New Energy Stock Prices and CO2 Emissions Trading Prices in China. Sustainability 2020, 12, 2823. [Google Scholar] [CrossRef]
  30. Hu, H.; Zhao, L.; Dong, W. How to Achieve the Goal of Carbon Peaking by the Energy Policy? A Simulation Using the DCGE Model for the Case of Shanghai, China. Energy 2023, 278, 127947. [Google Scholar] [CrossRef]
  31. Cai, Y.; Woollacott, J.; Beach, R.H.; Rafelski, L.E.; Ramig, C.; Shelby, M. Insights from Adding Transportation Sector Detail into an Economy-Wide Model: The Case of the ADAGE CGE Model. Energy Econ. 2023, 123, 106710. [Google Scholar] [CrossRef] [PubMed]
  32. Hu, Y.; Cutler, H.; Mao, Y. Economic Loss Assessment for Losses Due to Earthquake under an Integrated Building, Lifeline, and Transportation Nexus: A Spatial Computable General Equilibrium Approach for Shelby County, TN. Sustainability 2023, 15, 8610. [Google Scholar] [CrossRef]
  33. Ma, M.; Huang, D.; Hossain, S.S. Opportunities or Risks: Economic Impacts of Climate Change on Crop Structure Adjustment in Ecologically Vulnerable Regions in China. Sustainability 2023, 15, 6211. [Google Scholar] [CrossRef]
  34. O’Ryan, R.; Nasirov, S.; Osorio, H. Assessment of the Potential Impacts of a Carbon Tax in Chile Using Dynamic CGE Model. J. Clean. Prod. 2023, 403, 136694. [Google Scholar] [CrossRef]
  35. Jia, Z.; Wen, S.; Liu, Y. China’s Urban-Rural Inequality Caused by Carbon Neutrality: A Perspective from Carbon Footprint and Decomposed Social Welfare. Energy Econ. 2022, 113, 106193. [Google Scholar] [CrossRef]
  36. Jia, Z.; Lin, B. CEEEA2.0 Model: A Dynamic CGE Model for Energy-Environment-Economy Analysis with Available Data and Code. Energy Econ. 2022, 112, 106117. [Google Scholar] [CrossRef]
  37. Xu, J.; Wei, W. The Effects of Tax and Fee Reduction Policy on Mitigating Shock of the COVID-19 Epidemic in China. Appl. Econ. 2021, 53, 5303–5318. [Google Scholar] [CrossRef]
  38. Duan, H.; Bao, Q.; Tian, K.; Wang, S.; Yang, C.; Cai, Z. The Hit of the Novel Coronavirus Outbreak to China’s Economy. China Econ. Rev. 2021, 67, 101606. [Google Scholar] [CrossRef]
  39. Bekkers, E.; Koopman, R.B.; Rêgo, C.L. Structural Change in the Chinese Economy and Changing Trade Relations with the World. China Econ. Rev. 2021, 65, 101573. [Google Scholar] [CrossRef]
  40. Cui, Q.; He, L.; Liu, Y.; Zheng, Y.; Wei, W.; Yang, B.; Zhou, M. The Impacts of COVID-19 Pandemic on China’s Transport Sectors Based on the CGE Model Coupled with a Decomposition Analysis Approach. Transp. Policy 2021, 103, 103–115. [Google Scholar] [CrossRef]
  41. Jia, Z.; Wen, S.; Lin, B. The Effects and Reacts of COVID-19 Pandemic and International Oil Price on Energy, Economy, and Environment in China. Appl. Energy 2021, 302, 117612. [Google Scholar] [CrossRef] [PubMed]
  42. An, K.; Zhang, S.; Zhou, J.; Wang, C. How Can Computable General Equilibrium Models Serve Low-Carbon Policy? A Systematic Review. Environ. Res. Lett. 2023, 18, 033002. [Google Scholar] [CrossRef]
  43. Clora, F.; Yu, W.; Corong, E. Alternative Carbon Border Adjustment Mechanisms in the European Union and International Responses: Aggregate and within-Coalition Results. Energy Policy 2023, 174, 113454. [Google Scholar] [CrossRef]
  44. Goulder, L.H.; Hafstead, M.A.C.; Kim, G.; Long, X. Impacts of a Carbon Tax across US Household Income Groups: What Are the Equity-Efficiency Trade-Offs? J. Public Econ. 2019, 175, 44–64. [Google Scholar] [CrossRef]
  45. Jia, Z. What Kind of Enterprises and Residents Bear More Responsibilities in Carbon Trading? A Step-by-Step Analysis Based on the CGE Model. Environ. Impact Assess. Rev. 2023, 98, 106950. [Google Scholar] [CrossRef]
  46. Rajbhandari, S.; Winyuchakrit, P.; Pradhan, B.B.; Chaichaloempreecha, A.; Pita, P.; Limmeechokchai, B. Thailand’s Net-Zero Emissions by 2050: Analysis of Economy-Wide Impacts. Sustain. Sci. 2023, 4, 1–14. [Google Scholar] [CrossRef] [PubMed]
  47. Fereira, S.B.; Cateia, J.V. Trade Reform, Infrastructure Investment, and Structural Transformation in Africa: Evidence from Guinea-Bissau. Emerg. Mark. Rev. 2023, 55, 101027. [Google Scholar] [CrossRef]
  48. Fujimori, S.; Masui, T.; Matsuoka, Y. AIM/CGE [Basic] Manual; Center for Social and Environmental Systems Research: Kyoto, Japan, 2012. [Google Scholar]
  49. Babatunde, K.A.; Begum, R.A.; Said, F.F. Application of Computable General Equilibrium (CGE) to Climate Change Mitigation Policy: A Systematic Review. Renew. Sustain. Energy Rev. 2017, 78, 61–71. [Google Scholar] [CrossRef]
  50. Lamperti, F.; Dosi, G.; Napoletano, M.; Roventini, A.; Sapio, A. Faraway, So Close: Coupled Climate and Economic Dynamics in an Agent-Based Integrated Assessment Model. Ecol. Econ. 2018, 150, 315–339. [Google Scholar] [CrossRef]
  51. Liu, J.; Wang, K.; Zou, J.; Kong, Y. The Implications of Coal Consumption in the Power Sector for China’s CO2 Peaking Target. Appl. Energy 2019, 253, 113518. [Google Scholar] [CrossRef]
  52. Yu, M.; He, M.; Liu, F. Impact of Emissions Trading System on Renewable Energy Output. Procedia Comput. Sci. 2017, 122, 221–228. [Google Scholar] [CrossRef]
Figure 1. Annual decline factors in emission cap calculation in ETS scenarios. Notes: The figure shows the annual reduction factor calculated for the total quota of carbon trading. The annual reduction factor emphasizes that the average carbon intensity of all industries should be lower than the value of the following year.
Sustainability 15 12649 g001
Figure 2. Power generation and its mixes in 2030. Notes: The bar and the left y-axis represent the share of electricity production from different sources. The line and the right y-axis represent the total electricity generation.
Sustainability 15 12649 g002
Figure 3. Primary energy mix in 2030. Notes: The bar and the left y-axis represent the share of primary energy from different sources.
Sustainability 15 12649 g003
Figure 4. CO2 emissions during 2018–2030. Notes: The chart depicts the carbon emissions from 2018 to 2030 under different scenarios, where the area of each region represents its cumulative carbon emissions. The darkest portion represents the carbon emissions in the ETS-enhanced scenario, while the lighter portion represents the additional carbon emissions in the ETS-strengthened scenario compared to the ETS-enhanced scenario, and so forth.
Sustainability 15 12649 g004
Figure 5. Carbon trading price during 2021–2030. Notes: The line and the left y-axis in the figure illustrate the carbon trading prices under different scenarios during the period from 2021 to 2030.
Sustainability 15 12649 g005
Figure 6. Producer price index (PPI) in ETS-benchmark scenario in 2030 relative to BAU scenario. Notes: The graph demonstrates the changes in producer price indices for various goods relative to the Business as Usual (BAU) scenario (BAU = 100) under the ETS-benchmark scenario. The complete industry names of the legend can be found in Table 1.
Sustainability 15 12649 g006
Figure 7. GDP and carbon intensity in 2030. Notes: The left y-axis and the gray bar represent the changes in GDP in 2030 under each scenario. The blue bar chart and the right y-axis represent the carbon intensity in these scenarios, calculated based on the carbon emissions divided by GDP for that year.
Sustainability 15 12649 g007
Figure 8. The sensitivity analysis of the ETS impact on the share of power generation. Notes: The figure shows the changes in core findings (changes in power generation share) when simulating a 10% increase or decrease in elasticity. The same row represents the same scenario, and the same column represents the same elasticity. The unit is the percentage change.
Sustainability 15 12649 g008
Table 1. Sector classification.
AbbreviationsSectors’ Full Name
AGRAgriculture
COLCoal mining
COLPCoal processing
O_GOil and gas exploitation
REFORefined oil
REFGRefined gas
OMINOther mining
LGTLight industry
CMCChemicals
BMTLBuilding material
STLSteel
MTL_PMetal product
MFTManufacturing
THPThermal power
HYPHydropower
WDPWind power
NCPNuclear power
SOPSolar power
CSTConstruction
TSPTTransportation
SERServices
Disclaimer/Publisher’s Note: The statements, opinions and data contained in all publications are solely those of the individual author(s) and contributor(s) and not of MDPI and/or the editor(s). MDPI and/or the editor(s) disclaim responsibility for any injury to people or property resulting from any ideas, methods, instructions or products referred to in the content.

