Article

Classification of 3D Casting Models for Product Lifecycle Management and Corporate Sustainability

Department of Industrial Education and Technology, Bao-Shan Campus, National Changhua University of Education, No. 2, Shi-Da Road, Changhua 500, Taiwan
*
Author to whom correspondence should be addressed.
Sustainability 2023, 15(17), 12683; https://doi.org/10.3390/su151712683
Submission received: 15 June 2023 / Revised: 18 July 2023 / Accepted: 3 August 2023 / Published: 22 August 2023

Abstract

:
The purpose of this study was to combine simulations and experiments in order to present the first stage of construction in product lifecycle management. Based on the simplification of casting models, the relationship between the filling and solidification characteristics, casting methods, and geometrical classifications of aluminum alloy precision casting products was investigated. By rearranging and summarizing the data, the casting models could be digitally managed; moreover, the digitized data could be used as the basis for intelligent processes in further developments. The simulations calculated and analyzed the casting speeds, defect locations, material densities, and critical fraction of a solid A356 aluminum–silicon alloy; the actual casting was carried out and samples were taken for metallographic observation to confirm the simulation results. The part model was simplified with four basic geometric shapes: solid cylinder, tubular, block rectangle, and thin-shell rectangle. The 150 casting models were summarized using 37 combinations, which were further classified into five main categories to match the casting method: solid cylindrical, tubular, and thin-shell rectangular for side casting, and discoidal and plate rectangular for bottom casting. File-compression rates of up to 75% were achieved after classification and archiving, and data integrity was maintained. Finally, model training using random forest classification resulted in an 88.8% accuracy when predicting the casting method. This research is based on the practical issues raised by business owners and R&D engineers, and a solution was obtained. From the perspective of product lifecycle management, the results of this study show the consistency and uniformity of product design rules, as well as the reusability of product process planning, which can be integrated with carbon emissions trading and carbon taxes to save energy and achieve corporate sustainability.

1. Introduction

Product lifecycle management (PLM) integrates product characteristics, derivative information, design solutions, process planning, and professional knowledge and applies these factors to product business competition, functionality enhancement, stability analysis, customer opinion analysis, marketing forecasts, etc. After completing a product cycle, it can return to cost estimation for new products, which can assist business owners in making decisions [1,2,3]. Similarly to Industry 4.0, the digitization of all data related to product lifecycle management will allow for a variety of analyses and restructuring, which will benefit traditional industries through the introduction of process automation and increased process intelligence. However, the concepts and technologies mentioned above still require promotion in small and medium enterprises, and their actual implementation requires time and manpower, which is a burden for business owners. Conversely, from the perspective of corporate sustainability, it is an appropriate time to carry out the digitization of product lifecycle management at the stage when smart manufacturing is not yet common and the second generation of an enterprise has not yet dominated a company. Most importantly, a digital system built on the existing experience of the company can maintain the level of process capability and achieve flexibility in sustainable development [4,5].
The energy-intensive processes and repetitive cost depletion in the trial production stage of the traditional foundry industry are environmental and governance issues, respectively, with respect to corporate sustainability [6]. If product development, design changes, or process planning can be predicted at each stage, the repeated consumption of energy and costs can be reduced. In order to achieve this goal, computer-assisted design (CAD) and computer-assisted process planning (CAPP) are the main practices used to retrieve product information, such as materials, geometries, design changes, and process parameters, to facilitate communication with parts’ library features during the design phase [7,8]. Process planning for digital casting and process parameter selection in the form of database control can predict the flow, heat transfer, solidification, and defect formation of metal flow under different casting conditions in advance [9], which can save the cost incurred by the actual trial and confirm the applicability of the pouring system in advance, thus improving the success of castings. In the foundry industry, digital construction is not only a necessary procedure for saving energy [10] but is also the basis for achieving sustainable development.
During the solidification of castings, isolated molten metal zones are easily generated that cannot be compensated by the surrounding metal liquid, and the formed shrinkage holes directly affect the mechanical properties of the castings. Most of these incomplete fillings are related to poor pouring systems with incorrect filling temperatures. To solve this problem, using mold flow software to simulate and determine suitable parameters is an efficient method. In 2019, A. R. Pradhan et al. [11] simulated a modified pouring system using mold flow software and found that optimizing the flow rate could make the metal liquid without fluctuation and reduce defects due to turbulence. In 2017, Y. W. Dong et al. [12] predicted the deformation and shrinkage distribution of castings during the solidification of investment casting through modeling. It is necessary to take the structural characteristics and the inhomogeneous shrinkage distribution into account during the casting process. L. Patnaik et al. [13] conducted an Al-Si-Cu mold flow simulation using MAGMASOFT in 2020 to predict the filling temperature, filling time, solidification, pressure, and slagging and finally evaluated the cooling position and made minor modifications to accommodate a shorter filling time and lower pressure in the mold.
Simplification of the geometry of casting 3D models is a typical method used to reduce the complexity of mold flow analysis and shorten the development time and cost. The purpose of retaining the main features and removing the features with smaller influence factors [14,15] is to maintain the similarity between the original model and the simplified model in the process of data size reduction. There are many ways to simplify 3D models, such as maintaining their polygonal shape to reduce the number of vertices and the space required [16], the boundary representation’s model data to connect geometrical entities with a topology [17], and rule-based methods with learning-based feature recognition [18]. The ultimate goal of simplification is to automate production. In 2023, C. Li et al. [19] proposed a unified tool for the design/analysis/virtual evaluation of ship structures based on multi-domain feature mapping. The design changes are always reflected in CAD and computer-assisted engineering (CAE) models through data regeneration and analysis iterations. Automated manufacturing systems are the most efficient methods of finishing a product from the design to the manufacturing stage, and feature recognition is one of the most important keys to integrating the two stages.
About 60% of the product design process is spent searching for correct information, and 80% of the parts can be changed from the existing design. If the new parts can be reconstructed using the data from the database and then linked with the new process, the overall efficiency of the design can be greatly improved [20]. In 2021, S. Bickel et al. [21] applied the geometric similarity from the verified old parts to the new parts to reduce the development cost and shorten the production startup time. H. Besharati-Foumani et al. [22] mentioned in 2020 that the development of an ontological approach to feature databases and further standardization of feature-based modeling frameworks is imperative to avoid the continuation of current interoperability issues. In 2023, B. Ji et al. [23] constructed a CAD model that can choose a subpart with arbitrary boundaries to successfully describe it for retrieval by combining local features. In 2023, S. Bickel et al. [24] presented a method that focuses on the needs of product development to retrieve similar components by comparing the geometrical similarity of existing parts. Therefore, feature similarity and simplification are important elements in digital manufacturing.
One of the main purposes of CAPP is to integrate CAD/CAE with computer-assisted manufacturing (CAM) and to determine the processing characteristics through automatic facial recognition. Y. Yang et al. [25] developed a system in 2021 that has been successfully tested on representative parts containing features ranging from simple bends to composite features, in which feature recognition plays an important role in digital manufacturing as it supports activities such as automated process planning and part redesign. In 2018, P. Yepez et al. [26] proposed a system that automatically recognizes products and links with a knowledge base without human intervention. In 2021, C. Favi et al. [27] identified geometrical features and parameters that cause problems during the manufacturing process in order to define numerical thresholds for the characteristic parameters and ensure the feasibility of the casting process. S. Ren et al. [28] mentioned in 2019 that big data analytics is one of the most important technologies for smart manufacturing, as it can uncover hidden useful information, such as lifecycle decisions and relationships between process parameters, to help industrial leaders make more informed business decisions in a complex management environment. From our literature review, it can be confirmed that simulation analysis, model simplification, and experimental validation can be used to optimize the filling parameters and design parameters of a pouring system in advance of the design stage to improve the casting yield. At the same time, digital pouring system classification is also helpful for process planning and reuse, which is in line with the importance of sustainability and resource reuse in product lifecycle management.

2. Research Method and Procedure

Based on the practical problems raised by business owners and R&D engineers, this study investigated the digital construction process of precision casting products in the design stage. Therefore, 150 pieces of aluminum alloy precision castings in the production line of a foundry were used as the research samples, and the digitalization of casting product characteristics and the construction procedures of classification were set as the objectives, so as to make the product process sustainable and in line with the standards of lifecycle management. Therefore, simulation and experimental methods were used as the main methods, and SolidWorks 2021 and SOLIDCast 9.0 were used as auxiliary tools for the analysis. The classification rules used to simplify the geometries of the models can be determined and established by disassembling and summarizing the geometries of 3D models. On the other hand, based on the pouring system and casting method commonly used in foundries, SOLIDCast 9.0 was used to assist in analyzing, modifying, and predicting the appropriate combination of the product geometry, pouring system, and casting method. In order to verify the correctness of the simulated physical behavior of the aluminum alloy, casting experiments and metallographic observations were performed. If the material density and critical fraction of the solid matched the defect location of the experimental samples, the simulation results were reliable. Simplified classification was used instead of codes; meanwhile, the characteristic data and classification rules were stored in a database to facilitate the subsequent machine learning and classification prediction. Abbreviations and symbols are listed in Appendix A.

2.1. Model Dimensions

The casting samples in this study consisted of two basic shapes: rectangular and cylindrical. The rectangular shapes ranged from 100 mm to 250 mm in length, from 100 mm to 250 mm in width, and from 55 mm to 200 mm in height, while the cylindrical shapes ranged from 10 mm to 400 mm in height, with a maximum diameter of 250 mm, as shown in Table 1. These 3D models consisted of a maximum of five layers of geometries. However, the geometry of castings processed in post-processing machining, such as threaded holes, was not analyzed in this study, and the holes were filled up beforehand.

2.2. Model Pretreatment

The two basic shapes, rectangular and circular, were subdivided into solid and hollow types. Solid cylinders are designated as A1, hollow cylinders as A2, solid rectangles as B1, and thin shell rectangles as B2, and if the layer has no geometry, it is designated as D, as shown in Table 2. The first layer must not be D or it will be judged as an invalid simplification. To build the model, the parts need to be dismantled and the characteristics of each layer from bottom to top must be presented. The shapes of the 150 existing castings can be classified into five categories after dismantling and simplifying, namely, A/A/A, A/A/D, A/D/D, B/B/D, and B/D/D. A/A/A is a three-layer cylinder, A/A/D is a two-layer cylinder, A/D/D is a single-layer cylinder, B/B/D is a two-layer rectangle, and B/D/D is a single-layer rectangle, as shown in Table 3. A Cartesian coordinate system was used and X0 Y0 Z0 was defined as the coordinate datum. When simplifying a part, the center point of each layer should be determined first, and then the coordinates are given according to the number of layers and geometries, as shown in Equation (1), where i , j , and k are the distances from the datum to the center point in the x, y, and z directions, respectively.
( X X 0 ,   Y Y 0 ,   Z Z 0 ) = i , j , k

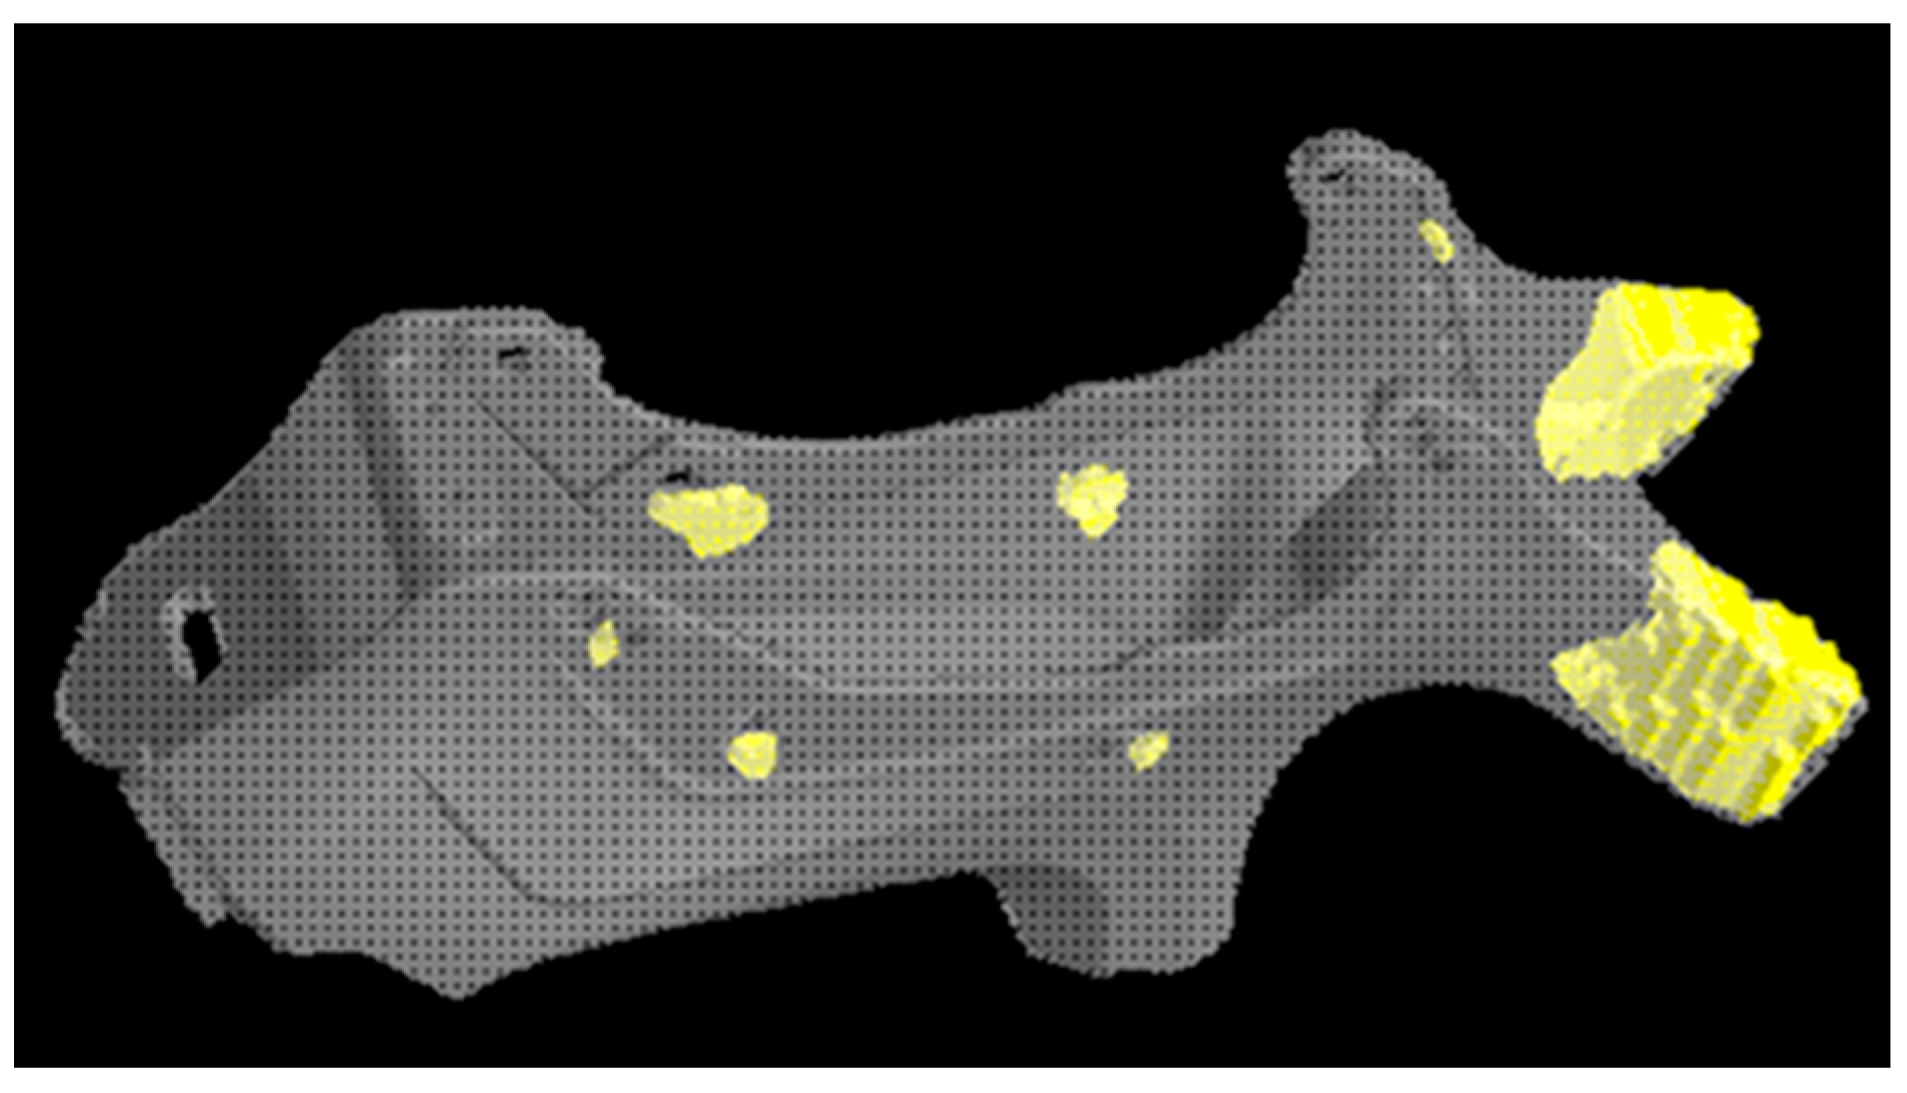
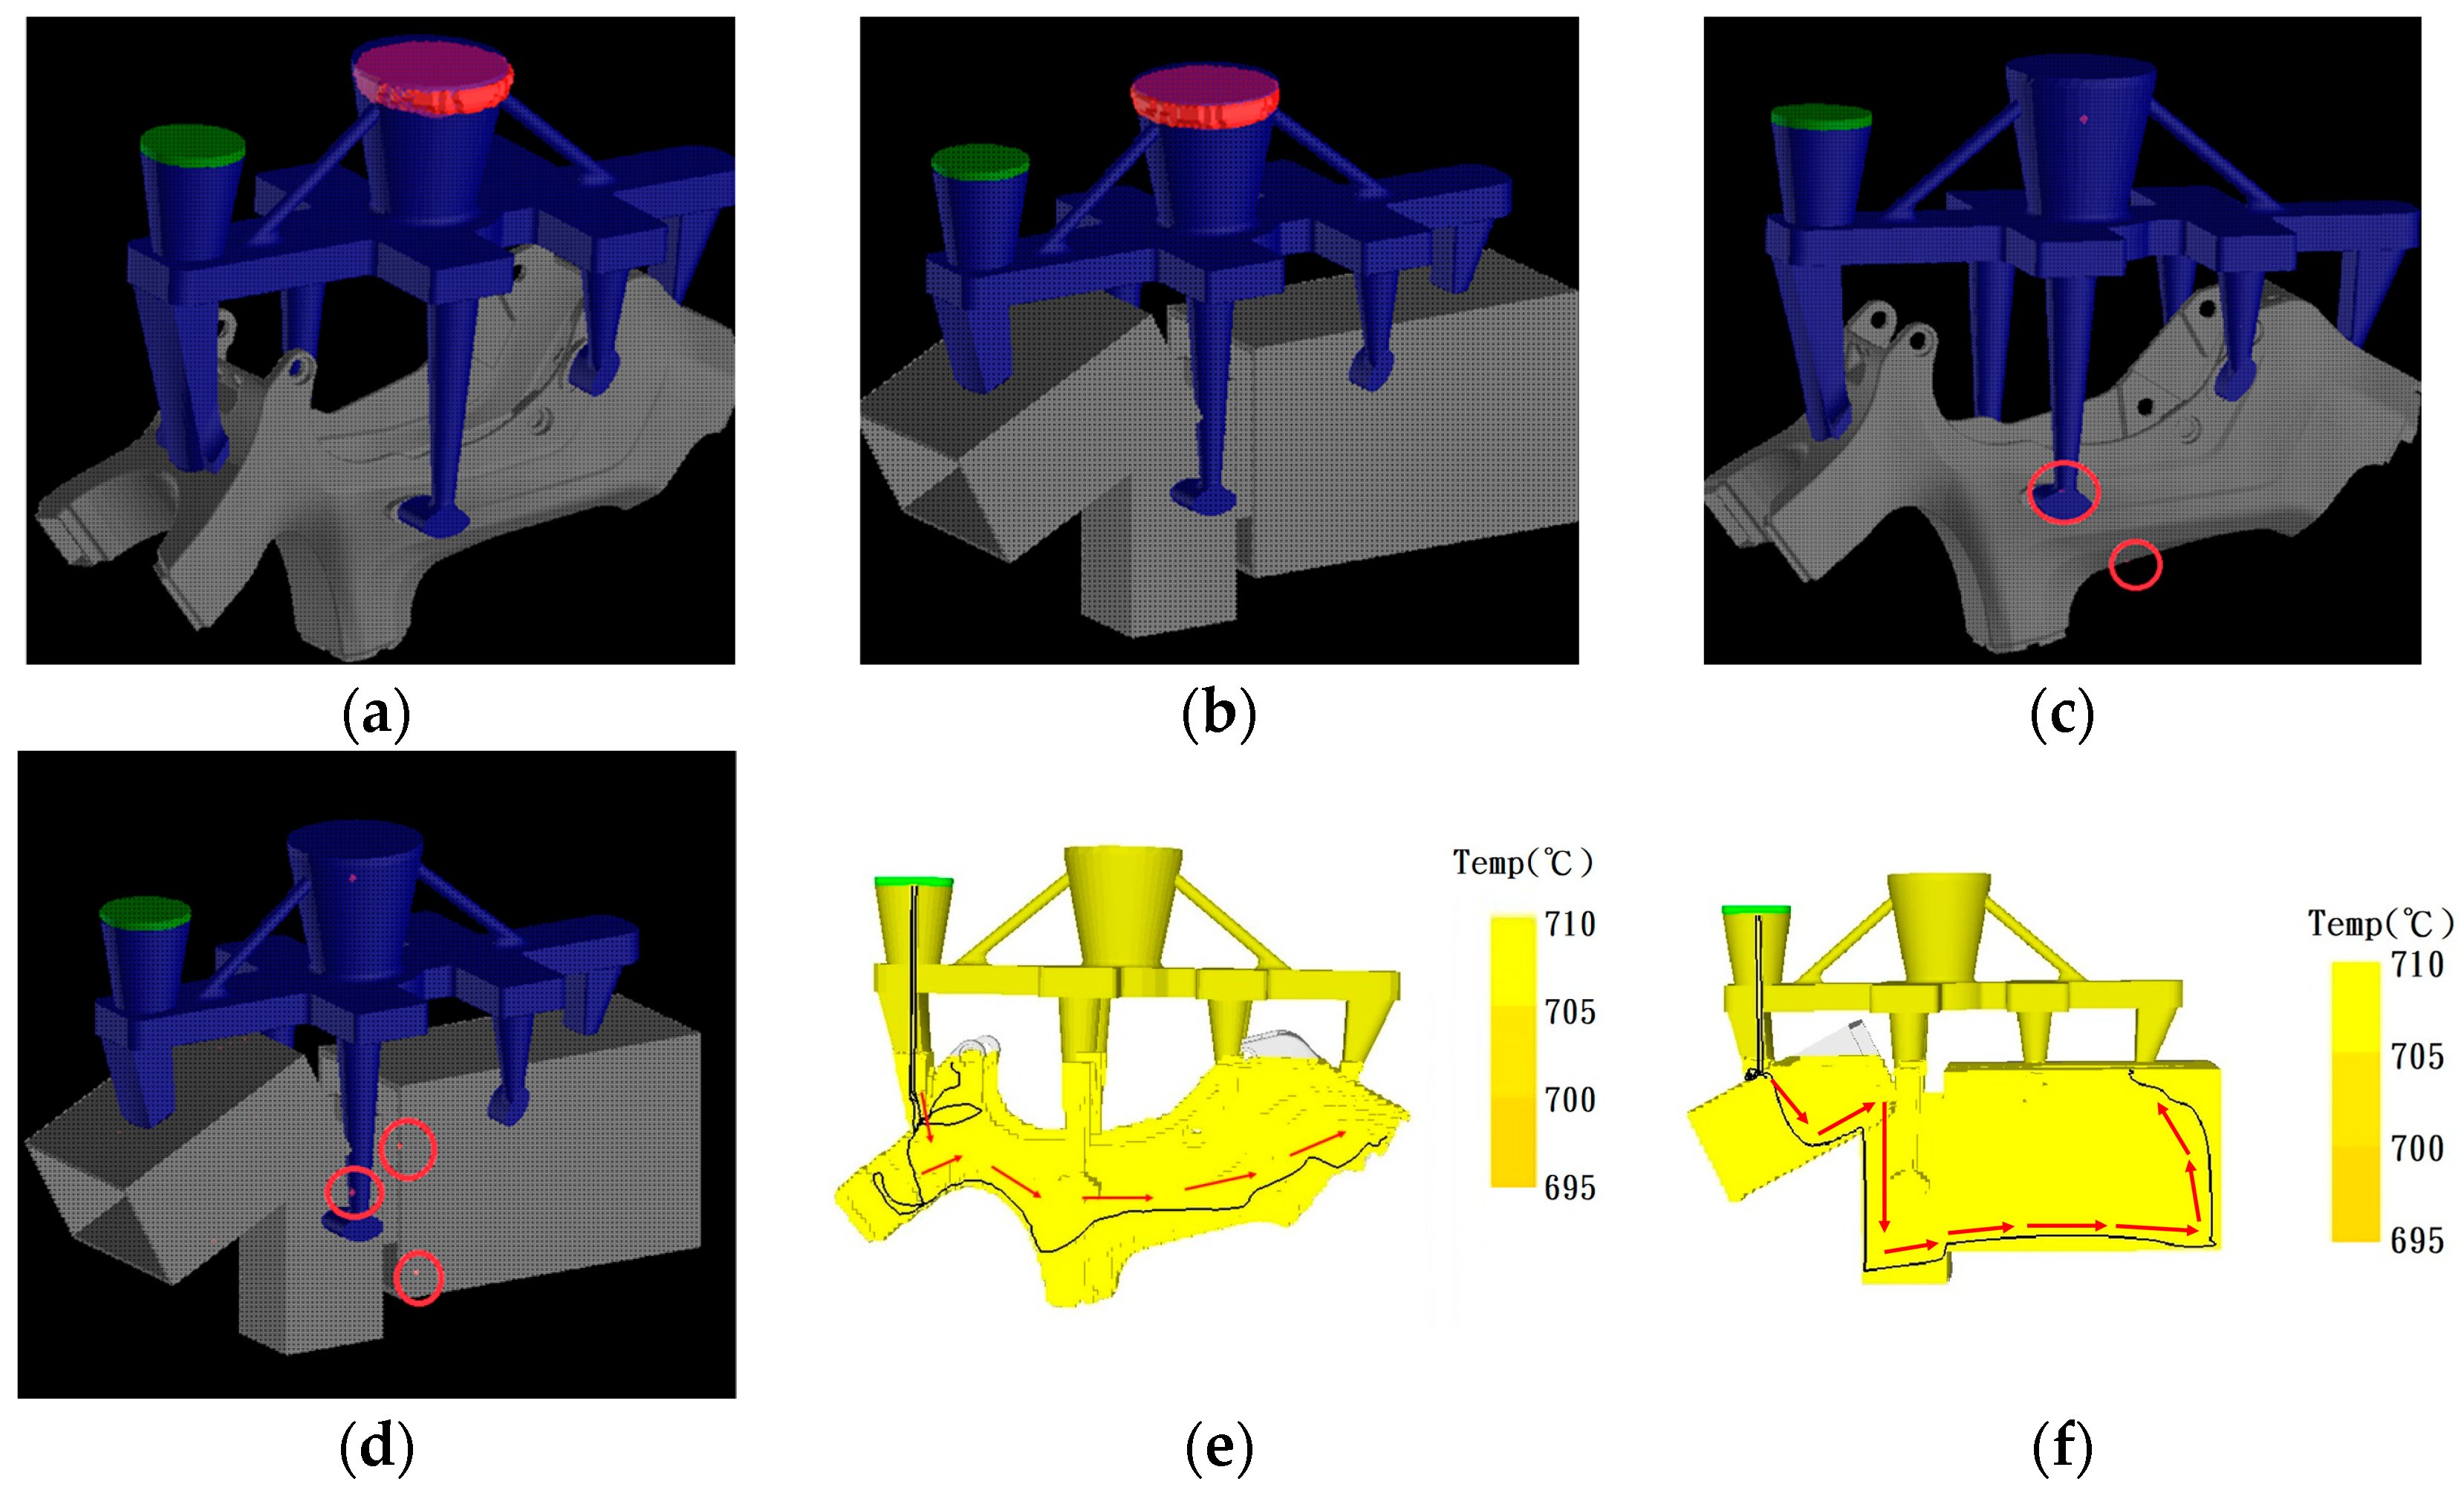
2.3. Mold Flow Analysis

In this study, SOLIDCast was used to calculate the critical fraction of solid, material density, temperature, flow rate, and pressure inside each casting. The simulated casting temperature and surrounding temperature of the shell mold were set to 710 °C, the thickness of the shell mold was set to 6 mm, and the casting time was set to 20 s. The temperature difference in a casting was not more than 100 °C, the difference in the flow rate was not more than 1.5 m/s, and the difference in the pressure drop was not more than 5 kPa. The mesh of the simulation was set to 1.5 mm. All the data are listed in Table 4.

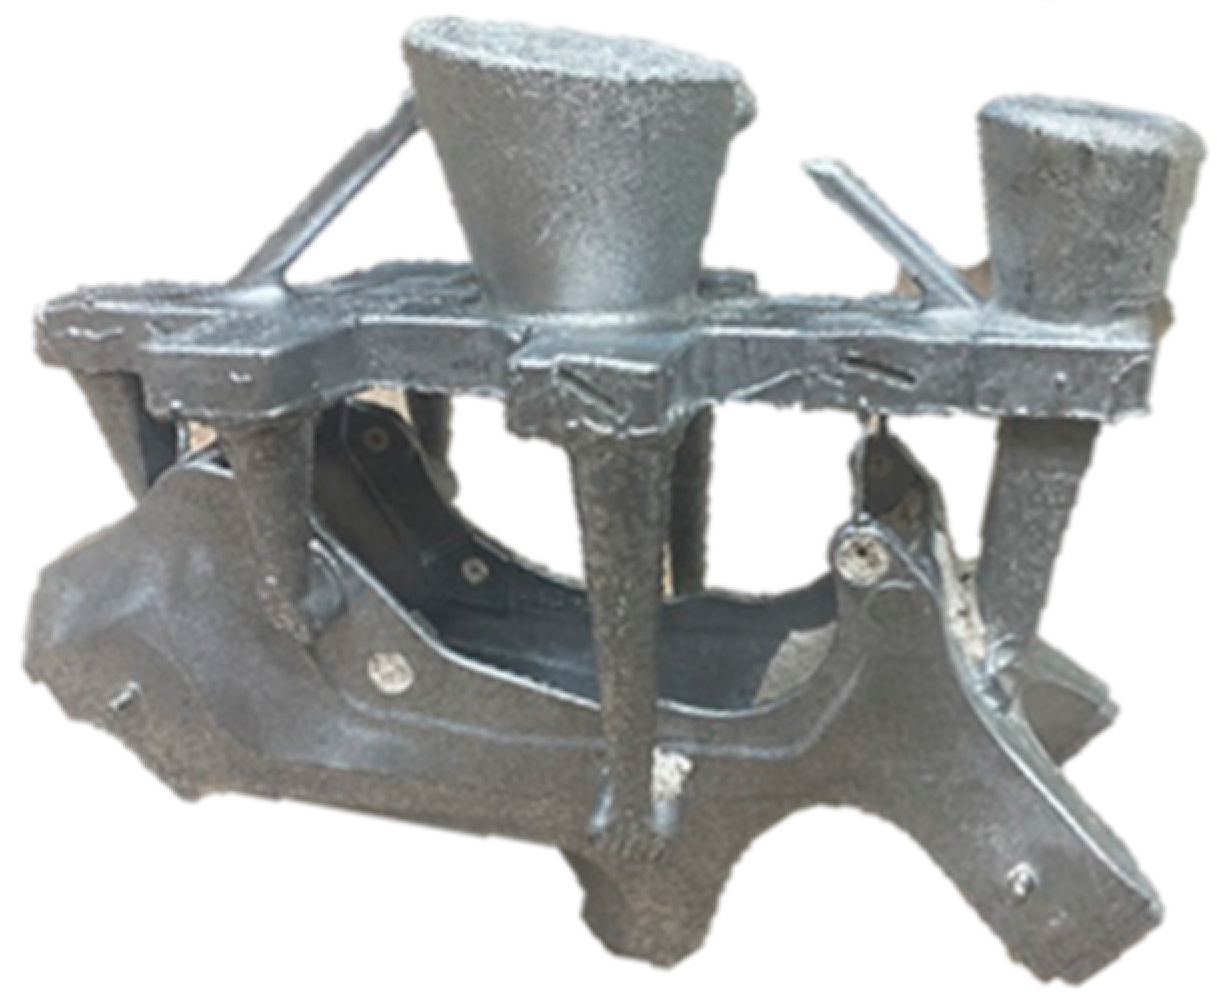
2.4. Specimen Preparation

The casting parameters of the experimental sample followed the simulated results of this study and were then verified with metallographic observation to match the results. In order to analyze the internal organization of the material, the preparation of the specimens included location selection, cutting, mounting, grinding, etching, and cleaning. The composition of the A356 aluminum alloy used in this study is shown in Table 5. The etching solution was 5 g of sodium hydroxide and 100 c.c. of water, and the etching time was 400 s.

3. Results and Discussion

The construction rules of model classification are discussed in this study. A simulation was used to construct and predict the correlation between 3D model geometry, pouring system, and casting method. Therefore, the simulation results of the design solutions consistent with the actual casting results were the basis of the usability of the simulation. In addition, the consistency between the simulation results of the original 3D model and the simplified model was an important link to the reliability of the classification rules. Finally, the correspondence between the classified model and the casting method was the basis for the classification and training accuracy of machine learning. Therefore, the following four subsections address the above aspects. The main purpose of Section 3.4 is to show that the digitized system constructed in this study can be directly used for machine learning, but the machine learning algorithm is outside of the scope of this study.

3.1. Design Solution and Experimental Verification

To confirm the correctness of the casting method, an A356 casting with a thin shell was simulated and analyzed. It is easy to determine the degree of consistency between the simulation and the actual casting as the thin shell is prone to producing internally isolated zones and causing shrinkage holes. Through the analysis of casting bare parts, it can be seen that there are obvious shrinkage zones in the middle and the thinnest yellow parts on the right of the casting, as shown in Figure 1. Therefore, the pouring system and die inlet were planned to be placed close to this region. It can be seen from the analysis results that, after a design with a suitable pouring system was created, the defects shifted from inside the casting body to the yellow parts of the outer pouring system. The isolated molten zone also disappeared in a thin-walled region due to the directional solidification of the metal liquid, as shown in Figure 2. The black flow line was also smooth without turbulence, as expected, as shown in Figure 3.
The appearance of the actual cast product showed no shrinkage or cracks, as shown in Figure 4. There were also no obvious defects in the casting at the closest point to the gate and the farthest point from the riser, and there were no holes exceeding 1 mm, as shown in Figure 5 and Figure 6. In addition, needle-like or flaky Si can be seen in the SEM image, as shown in Figure 7a. An EDX analysis confirmed that the composition of the test piece was Al-Si alloy, which contains a slender Si-rich structure, while Fe, Cu, Mn, Mg, Ti, and Zn are evenly dispersed in the Al substrate, as shown in Figure 7b,c. Therefore, it was confirmed that the method of planning and analysis in advance with correct parameters is credible and can effectively save costs and improve the success of casting.

3.2. Model Simplification and Comparison

To demonstrate the feasibility of model simplification, the thin-shell casting investigated in Section 3.1 was simplified in shape as a combination of three thin-shell rectangles, as shown in Figure 8a,b. The analysis of the bare part found that the simplified castings had fewer curves in shape, and so the geometry in the pouring system changed to a flat surface. The consistency of the same pouring system before and after simplification was simulated, and the present material density and the critical fraction of solid in the red part of simulation were the same, as shown in Figure 9a–d. The flow lines of both models all entered the die from the left and started filling with the side casting, as shown in Figure 9e,f. The red color indicates that all the trends were the same. It was proven that the simulation results could be maintained, and regions prone to defects showed no difference after simplification.

3.3. Classification Type and Casting Method

The casting methods to be selected for the parts are related to the height, thickness, area, and volume of the parts. In this study, several casting methods for foundation shapes were simulated using SOLIDCast, and finally, five categories of geometries with two casting methods were identified, as shown in Table 6. The models in category 1 were placed horizontally, and side casting was selected. There were no defects inside the casting with this combination, and the maximum differences in temperature and pressure were 20.8 °C and 116.4 Pa, respectively. The models in category 2 combined with the bottom casting showed no defects, and the maximum differences in temperature and pressure were 27.7 °C and 983.4 Pa. Category 3 was suitable for side casting, and the maximum differences in temperature and pressure were 48.5 °C and 2488 Pa, respectively. For category 4, a bottom casting was adopted, and the maximum differences in temperature and pressure without defects were 20.8 °C and 36.4 Pa, respectively. Finally, the models in category 5 without inside defects were connected with side casting. The maximum differences in temperature and pressure were 27.7 °C and 592 Pa, respectively.
From the above analysis, it can be seen that side casting can be combined with two kinds of geometries. The first is parts that are relatively large in volume and in height. If bottom casting is used in these parts, defects would appear due to a large drop in flow. The second kind is the geometry of thin-shell rectangles or round tubes. This type of casting can easily solidify prematurely because of the thin wall thickness, and it is crucial to consider the location and height of the pouring gates related to the casting. On the other hand, bottom casting is more suitable for these plates. In addition to the differences in pressure and temperature, the position and amount of subsequent machining must be taken into account when selecting the casting method.

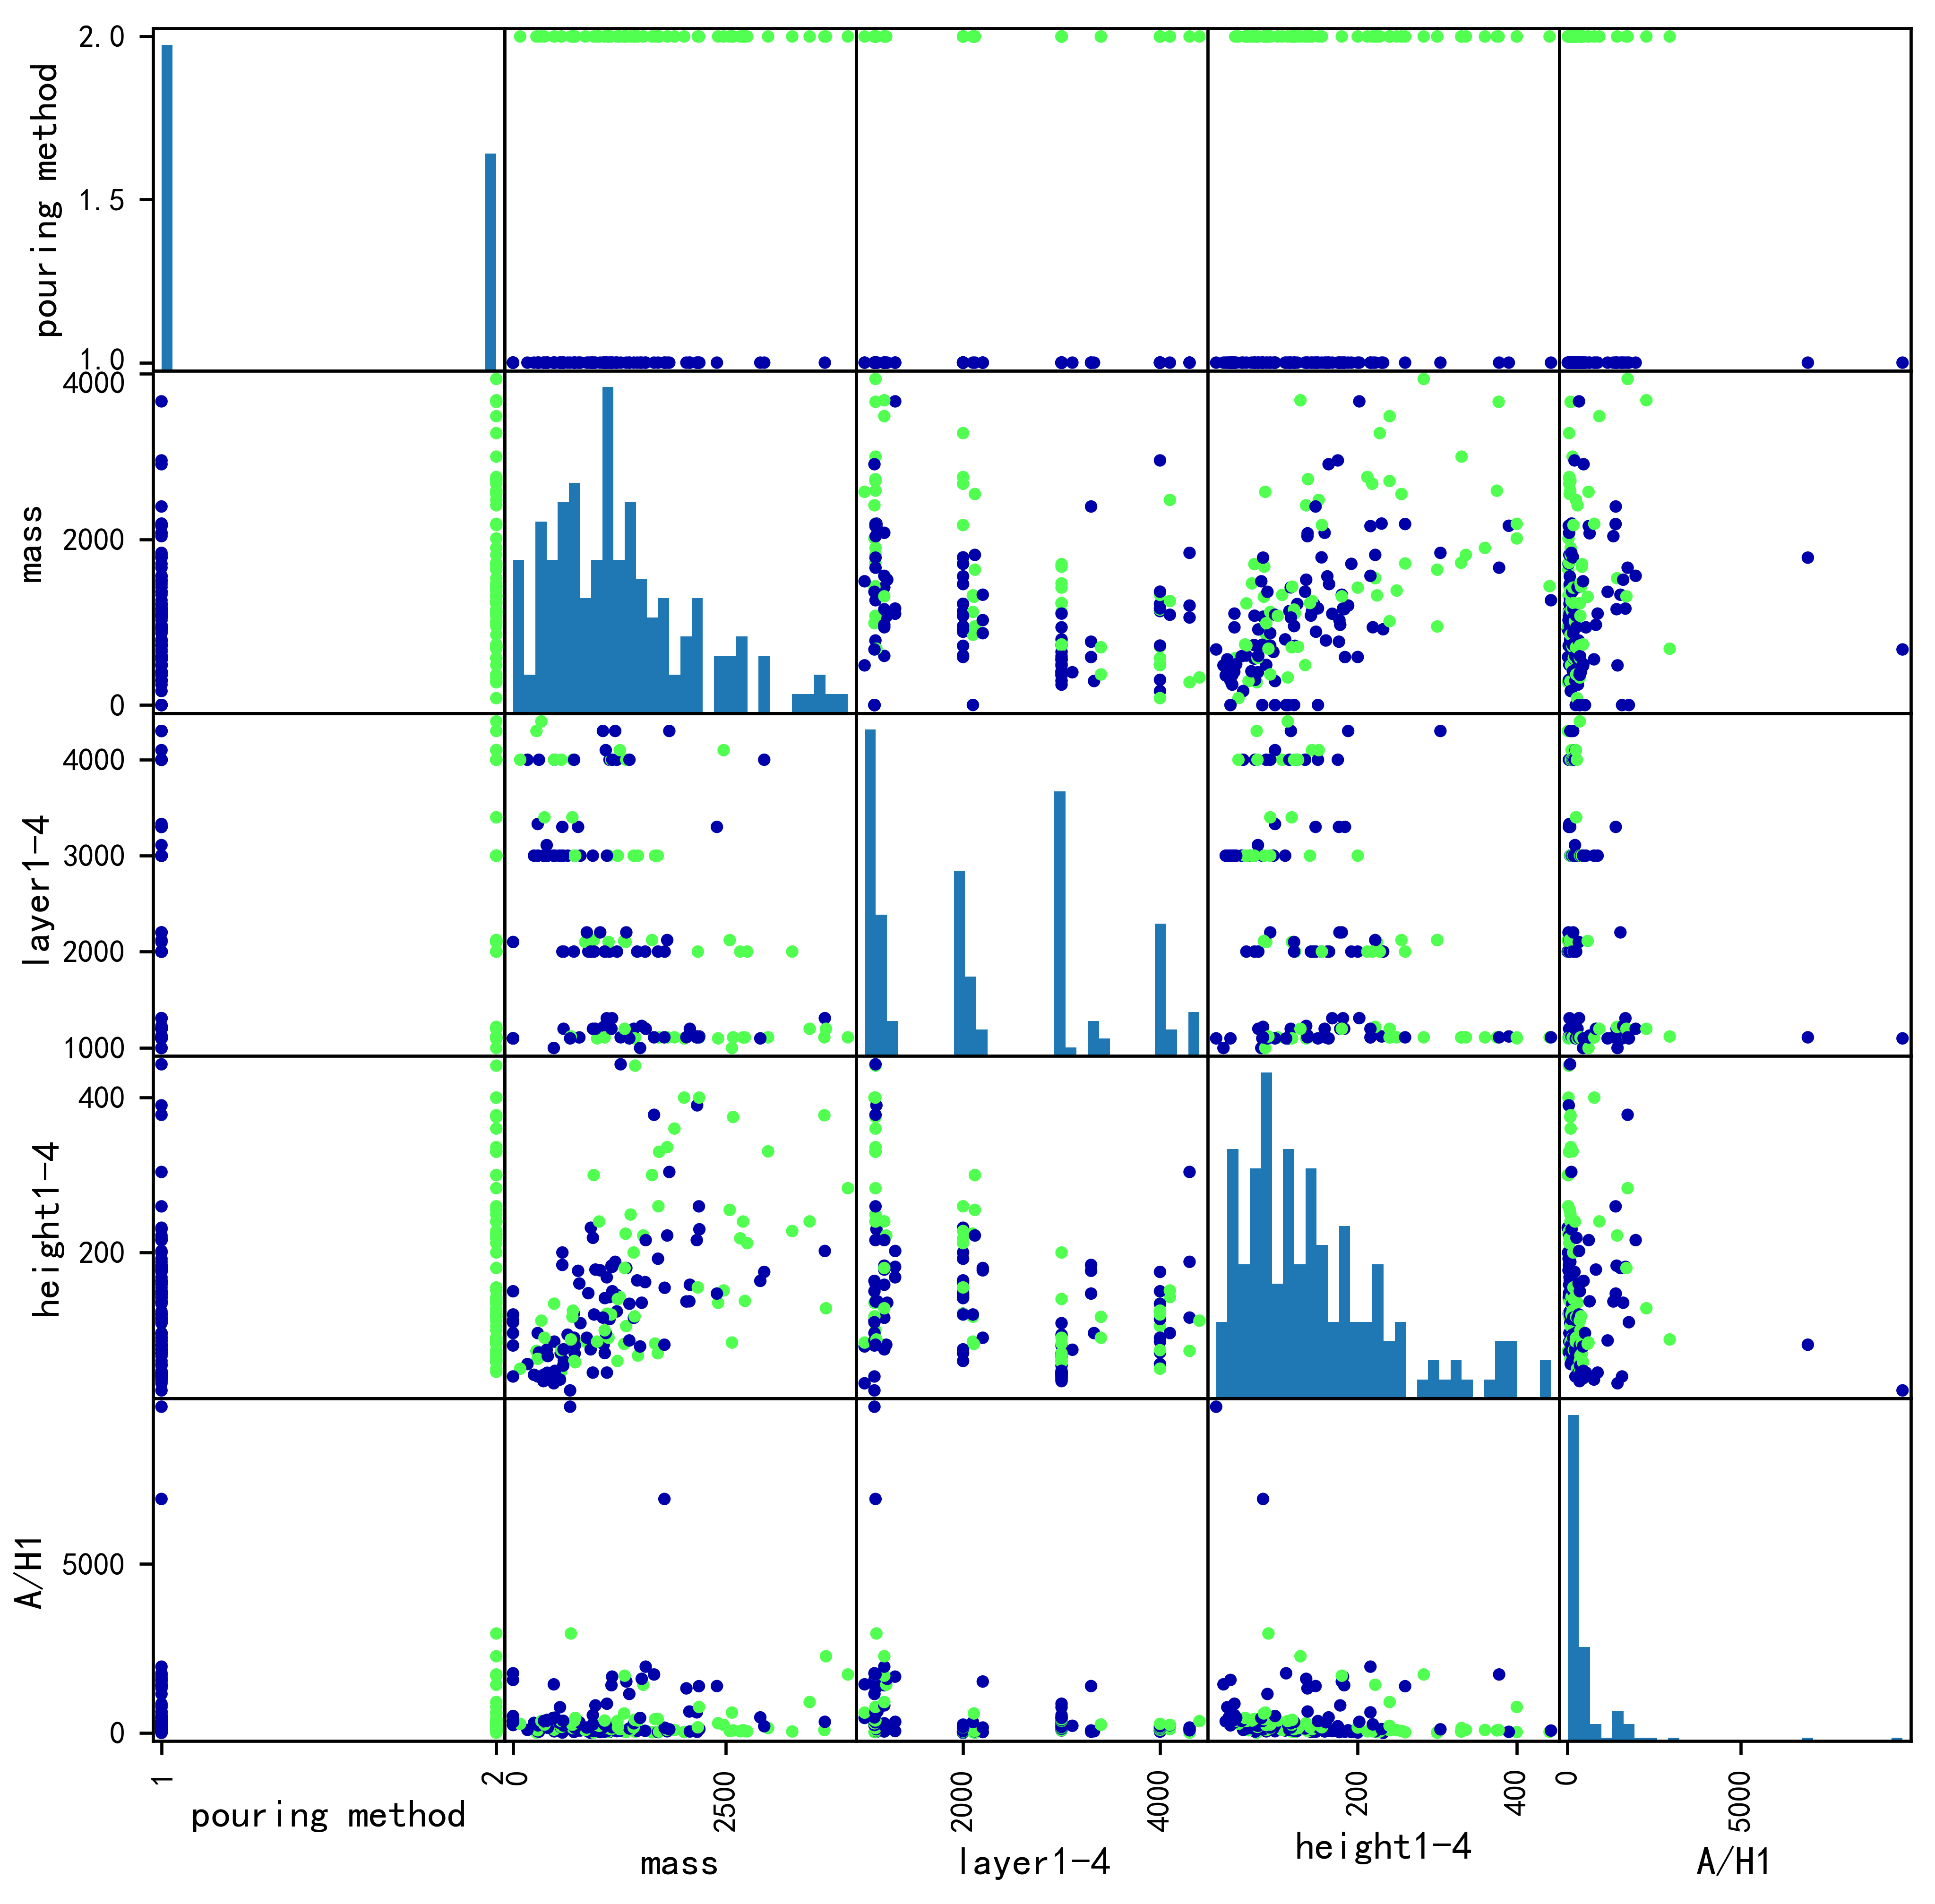
3.4. Database and Learning

For the final normalization of the five categories and to compress the data, the simplified data were automatically converted into CAD 3D drawing files through macro instructions. Category 1 contains 30 samples, which can be summarized in seven ways with a compression rate of 76.7%. The 30 samples in category 2 can be summarized in eight ways with a compression rate of 73.4%. In category 3, the 30 samples can be summarized in five ways with a compression rate of 83.4%. Category 4 contains 30 samples, which can be summarized in 11 ways with a compression rate of 63.4%. The final 30 samples in category 5 can be summarized in six ways with a compression rate of 80%. Therefore, the database can be shown to only use 37 methods for 150 castings with a compression rate of 75% on average, as shown in Table 7. The need for part simplification can also be highlighted through the aforementioned methods and compression ratios.
All the classification data, including part number, number of layers, dimensions, datum, volume, surface area, and casting method, can be recorded in the database. Based on these data, it is possible to directly transfer the information as codes for machine learning. Through the visual analyses that are shown in Figure 10, it was confirmed that objects with more than three layers are more suitable for side casting (blue spots), while plates with high area/height ratios are suitable for bottom casting (green spots), which is consistent with the results of mold flow analysis. The relationships of layer number, surface area, height, mass, and casting method can be used as characteristics and imported into machine learning for learning and training. Model training by random forest classification with the data of 150 casting samples resulted in an 88.8% accuracy when predicting the casting method. The code is shown in Appendix B. Therefore, it is certain that the digital product database system constructed in this study can be used for developing intelligent processes and as a basis for life cycle management.

4. Conclusions

Based on the classification of the casting geometry and the pouring system, a mold flow analysis using SOLIDCast was conducted to obtain the feeding efficiency, while casting simplification could indeed achieve the purpose of effective classification and data reduction. The following four conclusions can be drawn from the study:
  • Similar geometries can be applied to the same pouring system, but with the same range of volumes.
  • Part simplification does result in data compression, as 150 castings ended up using only 37 methods, resulting in an average compression rate of 75% and preserving data integrity after compression.
  • From a geometric analysis, it was found that the qualities of thin-shell rectangles, round tubes, and solid cylindrical castings were better when using side casting, and those of plate rectangles and pie models were better when using bottom casting. The quality of any shape of castings with a height from 55 mm to 200 mm was poor when using top casting.
  • All of the model classification data in the database, including material and geometrical characteristics, can be directly used in machine learning for a predicted casting method with 88.8% accuracy. The data and the database constructed in this study are in line with digital product lifecycle management and successfully save costs for further development.
This study demonstrates the foundation of process intelligence, and future development should focus on expanding the number of original 3D model samples. At the same time, it is necessary to establish a single or conversion standard between upstream and downstream factories in order to achieve a sound digital 3D modeling system. Based on a sufficient amount of product characteristic data and information, the foundry industry can establish a mature intelligent process and prediction system through data science analysis to achieve the ultimate goal of corporate sustainability.

Author Contributions

T.-M.C. directed this study. T.-M.C. and J.-Q.W. designed the architecture and experiments of the research, and then all of the authors carried out the data analysis. T.-M.C. wrote the manuscript with the help of J.-Q.W. and J.-T.L. All authors have read and agreed to the published version of the manuscript.

Funding

This research received no external funding.

Institutional Review Board Statement

Not applicable.

Informed Consent Statement

Not applicable.

Data Availability Statement

The data used in this research are enclosed within the manuscript. No external data sources were used in this research.

Acknowledgments

The authors acknowledge the help from Geober precision casting Co., Ltd. and Chyn Wang Light Metal Tech Co., Ltd. for supplying models and manufacturing parameters.

Conflicts of Interest

The authors declare no conflict of interest.

Appendix A

Abbreviations and symbols:
  • A: Cylinder; A1: Solid Cylinder; A2: Hollow Cylinder
  • B: Rectangle; B1: Solid Rectangle; B2: Shell Rectangle
  • D: No Geometry
  • X0, Y0, Z0: Coordinate Datum
  • i : Distance in the X Direction from the Coordinate Datum
  • j : Distance in the Y Direction from the Coordinate Datum
  • k : Distance in the Z Direction from the Coordinate Datum
  • SEM: Scanning Electron Microscope
  • EDX: Energy-dispersive X-ray Spectroscopy
  • Δ: Difference in Temperature or Pressure

Appendix B

The random forest classification code.
import time
from sklearn.model_selection import train_test_split
from sklearn.ensemble import RandomForestClassifier
from sklearn import metrics
from sklearn.feature_selection import SelectKBest
import pandas as pd
from imblearn.over_sampling import SMOTE
from collections import Counter
cast = pd.read_csv(r′./feature.csv′, encoding = “big5”)
cast = pd.get_dummies(cast)
cast = pd.DataFrame(cast)
5 = cast.drop(labels = [‘pouring method_bottom pouring’,‘pouring method_side
  pouring’], axis = 1)y5 = cast[‘pouring method_side pouring’]
smote = SMOTE()
x_smote, y_smote = smote.fit_resample(x5, y5)
x = x_smote
y = y_smote
a = 0
b = 0
c = 0
score = 0
while score < 0.85:
  for z in range(9,10):
    for d in range(5,13):
      selector = SelectKBest(k = z)
      phn = selector.fit_transform(x, y)
      mask = selector.get_support()
      new_features = x.columns[mask]
      print(new_features)
      mas = mask.copy()
      mas = (mas-1)∗(−1)
      mas = 1 <= mas
      new_features = x.columns[mas]
      x2 = phn
      x_train,x_test,y_train,y_test = train_test_split(x2, y, test_size = 0.25,
       random_state = 0)
      if score < 0.85:
        rfc = RandomForestClassifier(d)
        start = time.clock()
        rfc.fit(x_train, y_train)
        train_score = rfc.score(x_train, y_train)
        cv_score = rfc.score(x_test, y_test)
        print(′elaspe: {0:.6f}; train_score: {1:0.6f}; cv_score: {2:.6f}′.format
          (time.clock()-start, train_score, cv_score) + ′k = ′+ str(z))
        if cv_score > a:
          a = cv_score
          b = z
          c = d
          score = cv_score
  print(‘score = ‘+str(a)+’ k = ‘+str(b)+’ degree = ’+ str(c))

References

  1. Terzi, S.; Bouras, A.; Dutta, D.; Garetti, M.; Kiritsis, D. Product Lifecycle Management—From Its History to Its New Role. J. Prod. Lifecycle Manag. 2010, 4, 360–389. [Google Scholar] [CrossRef]
  2. Wijayasekera, S.C.; Hewage, K.; Hettiaratchi, P.; Siddiqui, Q.; Razi, F.; Pokhrel, D.; Sadiq, R. Sustainability of Waste-to-hydrogen Conversion Pathways: A Life Cycle Thinking-based Assessment. Energy Convers. Manag. 2022, 270, 116218. [Google Scholar] [CrossRef]
  3. Chen, Y.; Xu, Z.; Wang, J.; Lund, P.D.; Han, Y.; Cheng, T. Multi-objective Optimization of An Integrated Energy System Against Energy, Supply-demand Matching and Exergo-environmental Cost Over the Whole Life-cycle. Energy Convers. Manag. 2022, 254, 115203. [Google Scholar] [CrossRef]
  4. Sohns, T.M.; Aysolmaz, B.; Figge, L.; Joshi, A. Green Business Process Management for Business Sustainability: A Case Study of Manufacturing Small and Medium-sized Enterprises (SMEs) from Germany. J. Clean. Prod. 2023, 401, 136667. [Google Scholar] [CrossRef]
  5. Ferreira, J.J.; Lopes, J.M.; Gomes, S.; Rammal, H.G. Industry 4.0 Implementation: Environmental and Social Sustainability in Manufacturing Multinational Enterprises. J. Clean. Prod. 2023, 404, 136841. [Google Scholar] [CrossRef]
  6. Mory-Alvarado, A.; Juiz, C.; Bermejo, B.; Campoverde-Molina, M. Green IT in Small and Medium-sized Enterprises: A Systematic Literature Review. Sustain. Comput. Inform. Syst. 2023, 39, 100891. [Google Scholar] [CrossRef]
  7. Favi, C.; Campi, F.; Germani, M.; Mandolini, M. Engineering Knowledge Formalization and Proposition for Informatics Development Towards a CAD-integrated DfX System for Product Design. Adv. Eng. Inform. 2022, 51, 101537. [Google Scholar] [CrossRef]
  8. Hong, T.; Lee, K.; Kim, S. Similarity Comparison of Mechanical Parts to Reuse Existing Designs. Comput. Aided Des. 2006, 38, 973–984. [Google Scholar] [CrossRef]
  9. Dou, K.; Lordan, E.; Zhang, Y.J.; Jacot, A.; Fan, Z.Y. A Complete Computer Aided Engineering (CAE) Modelling and Optimization of High Pressure Die Casting (HPDC) Process. J. Manuf. Process. 2020, 60, 435–446. [Google Scholar] [CrossRef]
  10. Xu, Q.; Zhong, M.; Li, X. How does Digitalization Affect Energy? International Evidence. Energy Econ. 2022, 107, 105879. [Google Scholar] [CrossRef]
  11. Pradhan, A.R.; Pattnaik, S.; Sutar, M.K. Improving the Filling System for a Defect Free Casting: A Review. Mater. Today Proc. 2019, 18, 2887–2892. [Google Scholar] [CrossRef]
  12. Dong, Y.W.; Li, X.L.; Zhao, Q.; Yang, J.; Dao, M. Modeling of Shrinkage During Investment Casting of Thin-walled Hollow Turbine Blades. J. Mater. Process. Technol. 2017, 244, 190–203. [Google Scholar] [CrossRef]
  13. Patnaik, L.; Saravanan, I.; Kumar, S. Die Casting Parameters and Simulations for Crankcase of Automobile Using MAGMAsoft. Mater. Today Proc. 2020, 22, 563–571. [Google Scholar] [CrossRef]
  14. Lee, H.; Lee, J.; Kwon, S.; Ramani, K.; Chi, H.; Mun, D. Simplification of 3D CAD Model in Voxel Form for Mechanical Parts Using Generative Adversarial Networks. Comput. Aided Des. 2023, 163, 103577. [Google Scholar] [CrossRef]
  15. Kwon, S.; Mun, D.; Kim, B.C.; Han, S.; Suh, H.W. B-rep Model Simplification Using Selective and Iterative Volume Decomposition to Obtain Finer Multi-resolution Models. Comput. Aided Des. 2019, 112, 23–34. [Google Scholar] [CrossRef]
  16. Bahoo, Y.; Durocher, S.; Keil, J.M.; Mondal, D.; Mehrabi, S.; Mehrpour, S. Polygon Simplification by Minimizing Convex Corners. Theor. Comput. Sci. 2019, 791, 76–86. [Google Scholar] [CrossRef]
  17. Da, D.; Xia, L.; Li, G.; Huang, X. Evolutionary Topology Optimization of Continuum Structures with Smooth Boundary Representation. Struct. Multidisc. Optim. 2018, 57, 2143–2159. [Google Scholar] [CrossRef]
  18. Zhang, H.; Zhang, S.; Zhang, Y.; Liang, J.; Wang, Z. Machining Feature Recognition Based on a Novel Multi-task Deep Learning Network. Robot. Comput.-Integr. Manuf. 2022, 77, 102369. [Google Scholar] [CrossRef]
  19. Li, C.; Wei, P.; Luo, X.; Jiang, Z.; Wang, D. An unified CAD/CAE/VR Tool for Ship Structure Design and Evaluation Based on Multi-domain Feature Mapping. Ocean Eng. 2023, 280, 114888. [Google Scholar] [CrossRef]
  20. Klees, M.; Evirgen, S. Building a Smart Database for Predictive Maintenance in Already Implemented Manufacturing Systems. Procedia Comput. Sci. 2022, 204, 14–21. [Google Scholar] [CrossRef]
  21. Bickel, S.; Sauer, C.; Schleich, B.; Wartzack, S. Comparing CAD Part Models for Geometrical Similarity: A Concept Using Machine Learning Algorithms. Procedia CIRP 2021, 96, 133–138. [Google Scholar] [CrossRef]
  22. Besharati-Foumani, H.; Lohtander, M.; Varis, J. Fundamentals and New Achievements in Feature-based Modeling, A Review. Procedia Manuf. 2020, 51, 998–1004. [Google Scholar] [CrossRef]
  23. Ji, B.; Zhang, J.; Li, Y.; Pang, J. Free-form CAD Model Retrieval Approach for Engineering Reuse Based on Local Feature Segmentation. Comput. Graph. 2023, 111, 111–121. [Google Scholar] [CrossRef]
  24. Bickel, S.; Schleich, B.; Wartzack, S. A Novel Shape Retrieval Method for 3D Mechanical Components Based on Object Projection, Pre-trained Deep Learning Models and Autoencoder. Comput. Aided Des. 2023, 154, 103417. [Google Scholar] [CrossRef]
  25. Yang, Y.; Hinduja, S.; Owodunni, O.O.; Heinemann, R. Recognition of Features in Sheet Metal Parts Manufactured Using Progressive Dies. Comput. Aided Des. 2021, 134, 102991. [Google Scholar] [CrossRef]
  26. Yepez, P.; Alsayyed, B.; Ahmad, R. Automated Maintenance Plan Generation Based on CAD Model Feature Recognition. Procedia CIRP 2018, 70, 35–40. [Google Scholar] [CrossRef]
  27. Favi, C.; Mandolini, M.; Campi, F.; Germani, M. A CAD-based Design for Manufacturing Method for Casted Components. Procedia CIRP. 2021, 100, 235–240. [Google Scholar] [CrossRef]
  28. Ren, S.; Zhang, Y.; Liu, Y.; Sakao, T.; Huisingh, D.; Almeida, C.M.V.B. A Comprehensive Review of Big Data Analytics Throughout Product Lifecycle to Support Sustainable Smart Manufacturing: A Framework, Challenges and Future Research Directions. J. Clean. Prod. 2019, 210, 1343–1365. [Google Scholar] [CrossRef]
Figure 1. The defects appear in the middle and in the thinnest yellow parts of the casting body.
Sustainability 15 12683 g001
Figure 2. The defects shift from the inside of the casting body to the yellow parts of the outer yellow pouring system.
Sustainability 15 12683 g002
Figure 3. The black flow line is smooth without turbulence, as expected.
Sustainability 15 12683 g003
Figure 4. The appearance of the actual cast product shows no shrinkage and cracks.
Sustainability 15 12683 g004
Figure 5. There are no obvious defects in the casting at the closest point to the gate and no holes exceeding 1 mm. From (AF) represent the metallographic observations of each localized position shown in (G).
Sustainability 15 12683 g005aSustainability 15 12683 g005b
Figure 6. There are no obvious defects in the casting at the farthest point from the riser and no holes exceeding 1 mm. From (AF) represent the metallographic observations of each localized position shown in (G).
Sustainability 15 12683 g006
Figure 7. (a) The needle-like Si can be seen from the SEM image; (b,c) the composition analysis confirms that the test piece is Al-Si alloy.
Sustainability 15 12683 g007
Figure 8. (a) The original 3D model of a thin-shell casting; (b) the model is simplified in shape as a combination of three thin-shell rectangles. Blocks 1 to 3 are simplifications of individual shapes.
Sustainability 15 12683 g008
Figure 9. Comparison of the original model and the simplified shape in (a,b): material density; (c,d): critical fraction of solid in the red circles; (e,f): flow lines. The red color indicates that all the trends are the same.
Sustainability 15 12683 g009
Figure 10. The relationships between layer number, surface area, height, mass, and casting method can be used as characteristics and imported into machine learning for learning and training.
Sustainability 15 12683 g010
Table 1. The size range of rectangular and cylindrical shapes that constitute the basic geometry of castings.
ShapeRectangleCylinder
Length (mm)100~250-
Width (mm)100~250-
Height (mm)55~20010~400
Diameter (mm)-Below 250
Table 2. The two basic shapes of rectangle and cylinder are further divided into solid and hollow types.
A1A2B1B2
Sustainability 15 12683 i001Sustainability 15 12683 i002Sustainability 15 12683 i003Sustainability 15 12683 i004
Sustainability 15 12683 i005Sustainability 15 12683 i006
Table 3. A total of 150 models can be divided into 5 categories.
A/A/AA/A/DA/D/D B/B/DB/D/D
Sustainability 15 12683 i007Sustainability 15 12683 i008Sustainability 15 12683 i009Sustainability 15 12683 i010Sustainability 15 12683 i011
Sustainability 15 12683 i012
Table 4. The simulation parameters and constraints used in SOLIDCast 9.0.
TemperatureShell MoldCasting TimeTemperature DifferenceFlow Rate
Difference
Pressure
Drop
Simulation Mesh
710 °C6 mm20 s≤100 °C≤1.5 m/s≤5 kPa1.5 mm
Table 5. The composition of A356.
ElementSiFeCuMnMgTiZnAl
Wt%6.5–7.5≤0.15≤0.2≤0.10.25–0.45≤0.2≤0.1Bal.
Table 6. The suitable casting methods for 5 categories and the maximum differences in temperatures and pressures inside castings.
Side CastingBottom Casting
Sustainability 15 12683 i013Sustainability 15 12683 i014Sustainability 15 12683 i015Sustainability 15 12683 i016Sustainability 15 12683 i017
Category 1Category 3Category 5Category 2Category 4
Δ20.8 °CΔ48.5 °CΔ27.7 °CΔ27.7 °CΔ20.8 °C
Δ116.4 PaΔ2488 PaΔ592 PaΔ983.4 PaΔ36.4 Pa
Table 7. The total 150 castings can be summarized into five categories and 37 methods.
Category 1Category 2Category 3Category 4Category 5
76.7% (7/30)73.4% (8/30)83.4% (5/30)63.4% (11/30)80% (6/30)
A2/A1
A1/A1
A2/A1/A2
A1/A1/A1
A1/A1/A1/A1
A1/A1/A1/A2
A1/A1/A1/A1/A1
A1
A2/A2
A2/A1
A1/A1
A1/A2
A1/A1/A2
A1/A2/A1
A2/A1/A1
A2
A1/A2
A2/B1
A2/B1/B1
A1/A2/A2
B1
B1/B1
B1/B1/B1
B1/B1/B1/B1
B1/B1/B1/B1/B1
B1/B1/B1/B1/B1/B1
B1/A2
B1/A1
B1/A1/A1
B1/A1/A1
B1/B1/A1/A1/A1/A1
B2
B2/B1
B1/B1
B1/B2
B2/A1
B2/B2
Disclaimer/Publisher’s Note: The statements, opinions and data contained in all publications are solely those of the individual author(s) and contributor(s) and not of MDPI and/or the editor(s). MDPI and/or the editor(s) disclaim responsibility for any injury to people or property resulting from any ideas, methods, instructions or products referred to in the content.

