Review

Identifying Factors to Develop and Validate Social Vulnerability to Floods in Malaysia: A Systematic Review Study

by
Ismallianto Isia
1,
Tony Hadibarata
1,*,
Muhammad Noor Hazwan Jusoh
1,
Rajib Kumar Bhattacharjya
2,
Noor Fifinatasha Shahedan
1,
Norma Latif Fitriyani
3 and
Muhammad Syafrudin
4,*
1
Environment Engineering Program, Curtin University Malaysia, CDT 250, Miri 98009, Sarawak, Malaysia
2
Department of Civil Engineering, Indian Institute of Technology, Guwahati Near Doul Gobinda Road, Amingaon, North Guwahati, Guwahati 781039, Assam, India
3
Department of Data Science, Sejong University, Seoul 05006, Republic of Korea
4
Department of Artificial Intelligence, Sejong University, Seoul 05006, Republic of Korea
*
Authors to whom correspondence should be addressed.
Sustainability 2023, 15(17), 12729; https://doi.org/10.3390/su151712729
Submission received: 3 July 2023 / Revised: 17 August 2023 / Accepted: 17 August 2023 / Published: 23 August 2023
(This article belongs to the Special Issue Climate Change Adaptation and Disaster Risk Assessments)

Abstract

:
Flood disasters, a natural hazard throughout human history, have caused significant damage to human safety and infrastructure. This paper presents a systematic study using databases from Springer Link, Science Direct, JSTOR, and Web of Science. The study employs the PRISMA report analysis method to examine 11 flood disaster case studies between 2010 and 2022. The findings reveal that demographic characteristics, socioeconomic status, and access to healthcare crucially determine social vulnerability to adverse flood events. Notably, risk perception and coping capacity also received substantial attention in the case studies. Unfortunately, many indicators of social vulnerability fail to adequately consider the influence of these factors. The effects of factors that make communities vulnerable vary across disaster stages and countries. This emphasizes the importance of considering specific situations and locations when understanding the origins and consequences of vulnerability. The article concludes by offering recommendations to customize quantitative indicators of social vulnerability to flood contexts, covering aspects such as temporal context, measurability, and indicator relationships.

1. Introduction

Climate change is leading to an increased frequency and intensity of extreme weather events, like floods [1,2]. The occurrence of such phenomena poses significant hazards to both human life and property. As a result, these catastrophes tend to inflict greater harm on households, communities, and nations, primarily due to factors such as uneven distribution of hazards, exposure, and vulnerability [3]. Worldwide, climate change is contributing to a rise in flood occurrences and intensity [4]. Warming temperatures are responsible for more extreme weather phenomena, such as intense rainfall and snowfall, leading to flooding [5,6]. Additionally, rising sea levels caused by melting glaciers and ice are exacerbating coastal flooding [6,7,8]. Deforestation contributes to climate change by releasing stored carbon, intensifying greenhouse gases and global warming. This alteration in climate patterns increases the likelihood of heavy rainfall and floods. Moreover, deforested regions are more susceptible to flooding due to the diminished vegetation’s capacity to absorb water and stabilize soil [9,10,11]. The global population residing in urban areas is continuously expanding [12], leading to urban sprawl and soil sealing [13]. The interplay of extreme weather and climate change impacts rainfall patterns in water catchment regions [14], consequently leading to higher flow rates and faster runoff generation [14,15]. The combination of urbanization growth and expected climate shifts will lead to heightened extreme weather events, resulting in more frequent and severe urban flooding occurrences. These inundations may arise from either river floods or rainfall-related floods (pluvial floods). Furthermore, there is a global trend of an increasing elderly population residing in urban areas [16].
The term “flood” refers to the “transient inundation of land that is conventionally non-submerged” [14]. Though alterations in precipitation within a drainage basin are the predominant catalyst for river flooding [9,17,18,19], other factors, such as swift snow thaw in mountainous regions [20,21] and dam malfunctions, may also contribute to this phenomenon [22,23]. Storm surges [24] and tsunamis [24] are two coastal phenomena that may lead to inundation. Flooding resulting from river and coastal events is typically an outcome of natural occurrences, and the severity and frequency of such events are connected to specific areas. The sheer force of water [25] associated with these events may often result in significant damage. Moreover, in addition to the physical harm inflicted by water, its force can act as a powerful agent of erosion [26]. This can lead to the degradation of materials situated beneath the foundations of buildings, ultimately resulting in their collapse [26]. Subsequent to the recession of a flood, the aftermath may exacerbate owing to several factors, such as power and water shortages, coupled with the dissemination of ailments such as cholera, leptospirosis, and typhoid fever [27,28], These circumstances can lead to additional economic and personal losses in the affected region [29]. Although these floods result from natural factors, the majority of the damage is attributed to human habitation in flood-prone regions [30,31,32]. People often reside in these areas due to the limited availability of alternative locations for construction within a municipality. The presence of modern engineering infrastructure can create a false sense of security, as it does not entirely eliminate the risk of flooding [33]. Consequently, recent shifts in land use are primarily driven by population growth and economic development in flood-prone regions, rendering societies more vulnerable to such occurrences [34,35]. Hence, rainfall plays a vital role in assessing climate change, particularly concerning floods. To classify a flood event, essential elements like flood severity, duration, and inundation area are examined [36]. These factors act as key indicators for understanding and characterizing floods. Utilizing quantitative assessments of flood risks and models is crucial in making informed decisions to prevent disastrous flood incidents [37].
According to the IPCC Fifth Assessment Report, vulnerability is a consequence of the interaction between two fundamental components: sensitivity and capacity (coping/adaptive) [38]. Therefore, social vulnerability is a multifaceted concept that can be defined and used in various ways, and is often related to other concepts like resilience, risk, exposure, sensitivity, and coping capacity [39,40,41]. Social vulnerability is a complex issue that affects many people around the world. It refers to the susceptibility of certain groups of people to harm and negative outcomes due to their social, economic, and political positions in society. This vulnerability can be influenced by various factors, including poverty, unemployment, discrimination, limited access to healthcare, education, and other essential resources, as well as age, gender, race, and ethnicity. In this essay, we will explore the concept of social vulnerability in more detail and examine its impact on individuals and communities.
The impact of social vulnerability can be seen in many different areas of life; for example, socially vulnerable individuals may have limited access to education and job opportunities, which can make it difficult for them to achieve economic stability and financial security. Additionally, poverty is a primary cause of social vulnerability [42]. People who live in poverty often lack the resources and support necessary to protect themselves from harm. They may live in unsafe housing, lack access to healthcare, and struggle to provide basic necessities for themselves and their families. As a result, they may be more vulnerable to environmental hazards, such as natural disasters or pollution, as well as health risks, such as infectious diseases or chronic conditions [10,43]. Furthermore, they may experience higher rates of illness and disease, as well as increased exposure to environmental hazards, due to their living conditions and lack of access to healthcare. Additionally, socially vulnerable individuals may be at higher risk of experiencing violence or abuse, as well as social exclusion and stigmatization.
In recent years, social vulnerability indices have become a popular method for measuring and mapping human vulnerability to hazards [32,43,44,45]. There are a multitude of social vulnerability indicators utilized for natural hazards, including, but not limited to, the Social Vulnerability Index for Disaster Management [46], the Social Determinants of Vulnerability Framework [47], and the Social Vulnerability Index (SoVI) [48]. Although design and context impose limitations, quantitative indicators offer significant advantages for reducing vulnerability. Quantifying social vulnerability can facilitate the identification of the most vulnerable regions and the critical drivers of social vulnerability. Quantitative indicators present significant advantages in reducing vulnerability despite the limitations imposed by design and context [35].
The objective of this research focuses on exploring the interconnection between social vulnerability contexts, flood hazard incidence, disaster phases, and the levels of development at the national scale. The interconnection between the national level of development and the social vulnerability context in Malaysia is complex. Elevated national development has the potential to enhance infrastructure and resources, thereby augmenting community resilience. Nevertheless, social vulnerability may still prevail in certain communities due to regional discrepancies. To tackle this issue, it is essential to implement targeted interventions, ensure equitable resource allocation, and foster community engagement, regardless of overall national development.
The purpose of this analysis is to enhance understanding with regard to the identification, development, and validation of factors that contribute to social susceptibility to floods. To achieve this objective, a comprehensive PRISMA meta-analysis of qualitative case studies focusing on flood disasters was conducted. PRISMA (Preferred Reporting Items for Systematic Reviews and Meta-Analyses) is an advantageous instrument that offers a transparent means of reporting and the latest guidance for incorporating advances in methodologies pertaining to the identification, selection, appraisal, and synthesis of studies. Moreover, PRISMA provides a systematic approach to data extraction and synthesis, allowing researchers to compare and combine data from various studies. This facilitates a more comprehensive and meaningful analysis of social vulnerability to floods, resulting in more robust findings. Overall, PRISMA is an invaluable tool for conducting rigorous systematic reviews and meta-analyses on social vulnerability to floods. It ensures transparency, guides literature searches, sets criteria, and facilitates data synthesis, thereby contributing to high-quality research in this area.

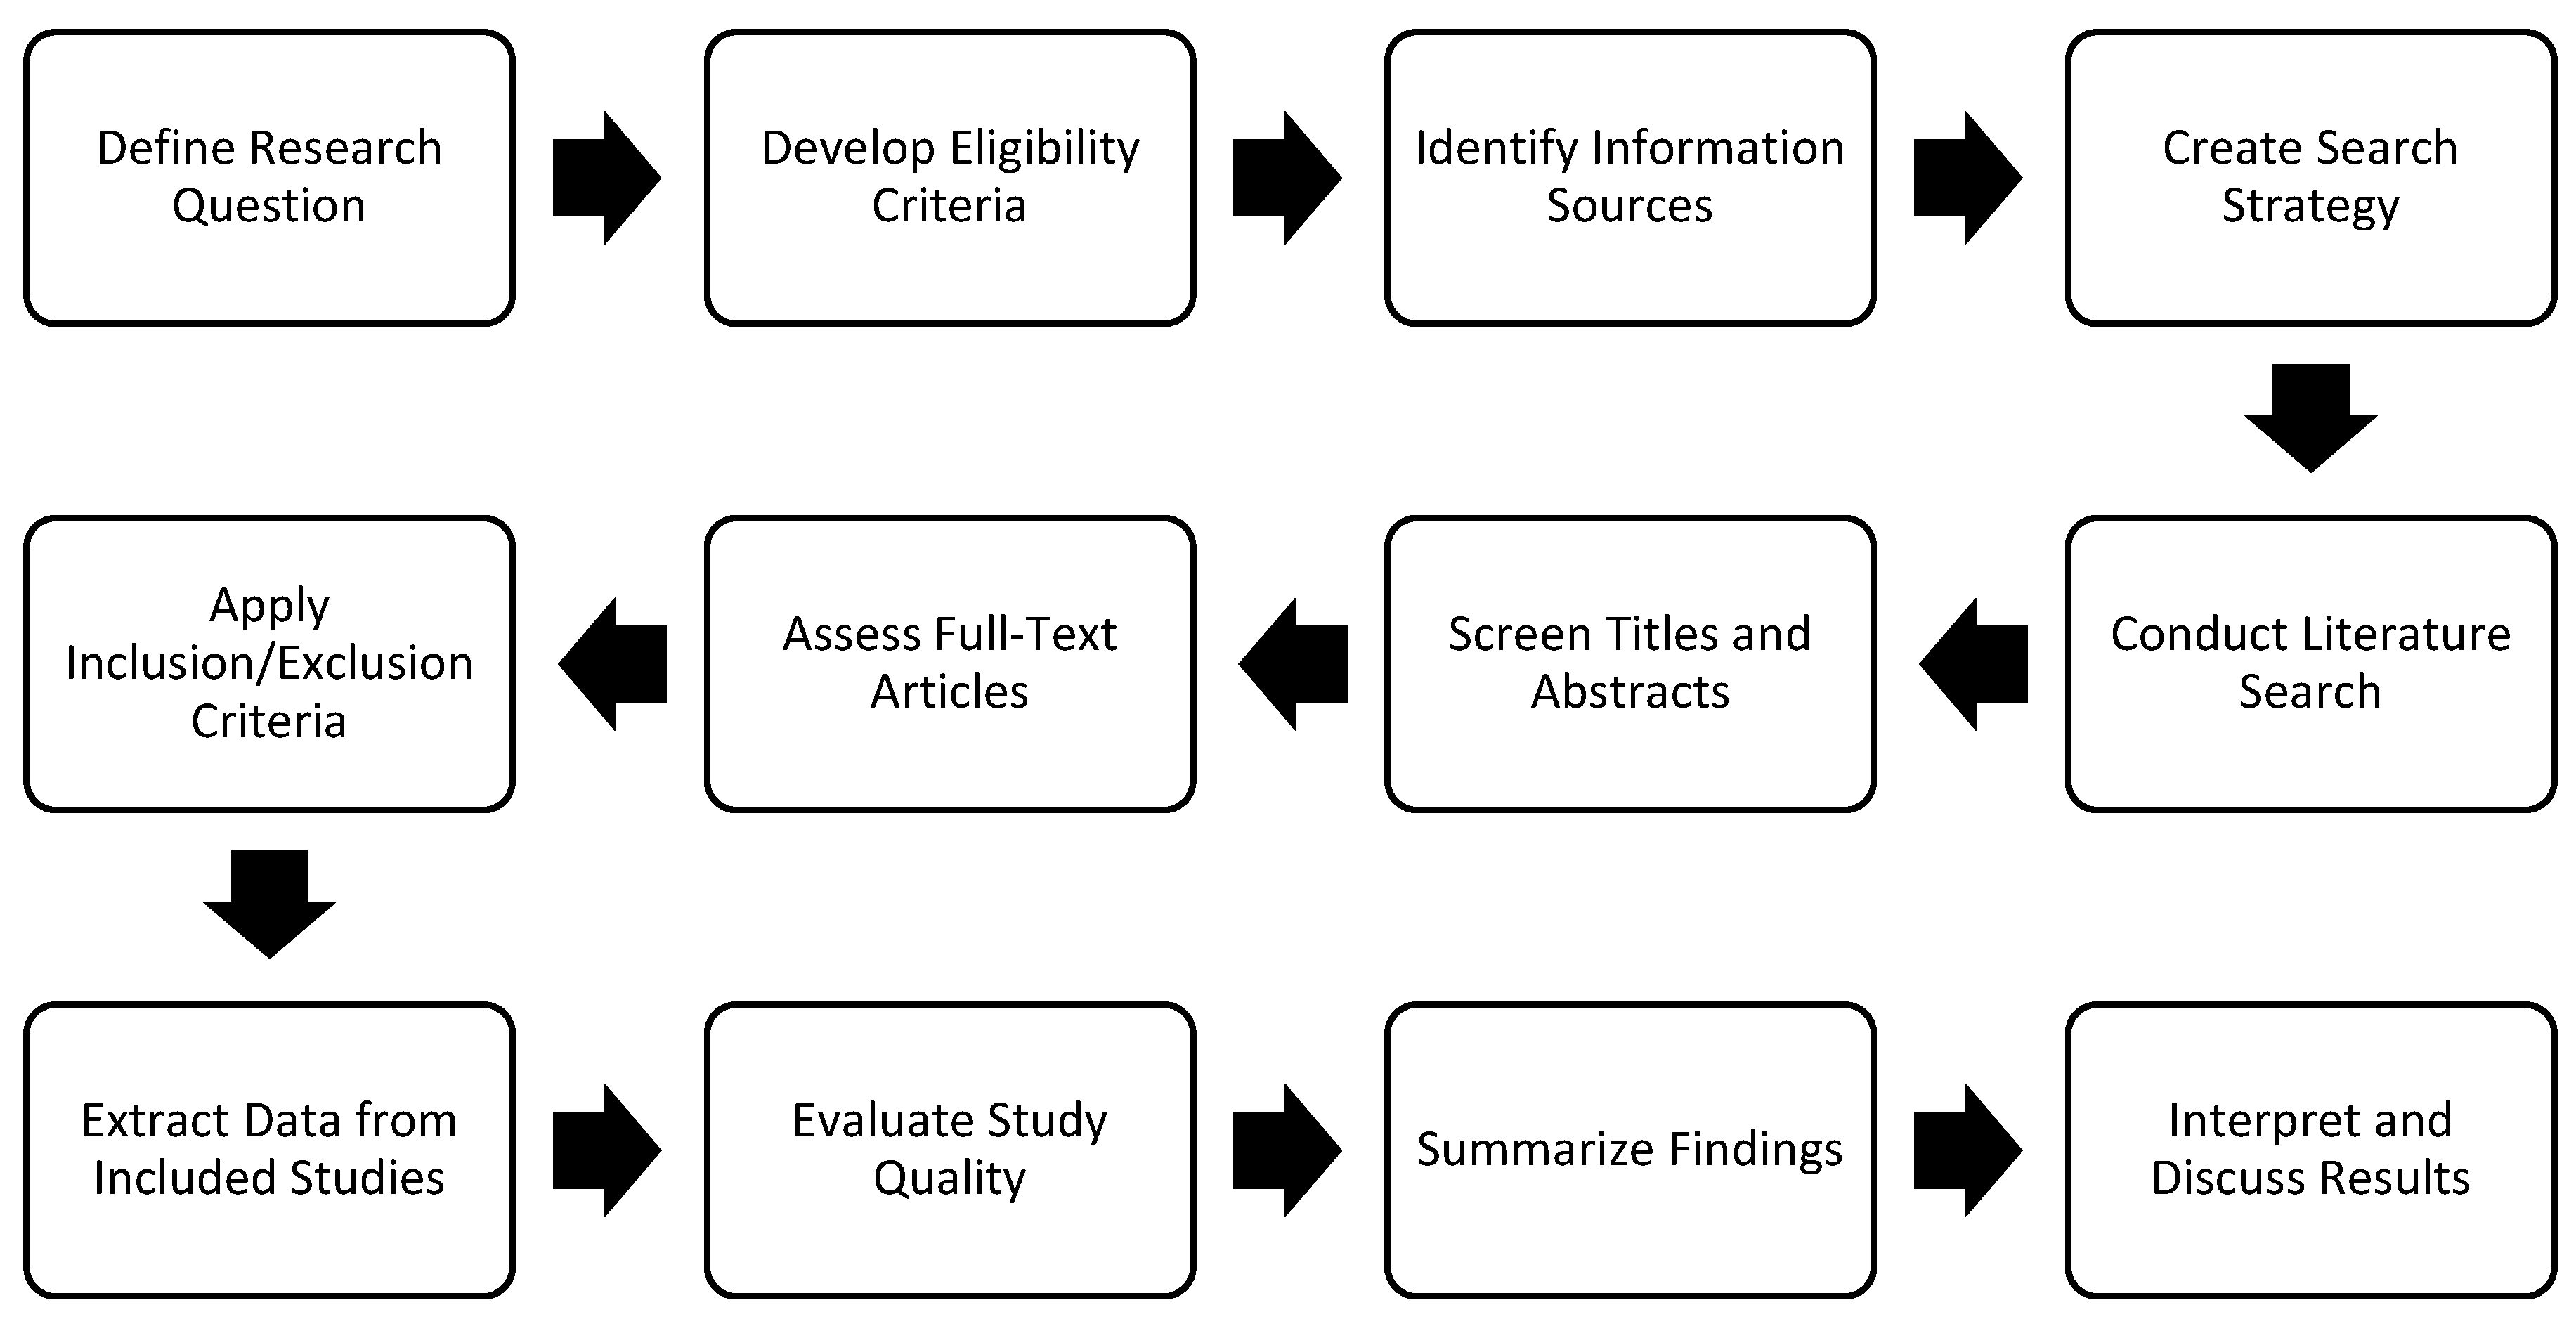
2. Materials and Methods

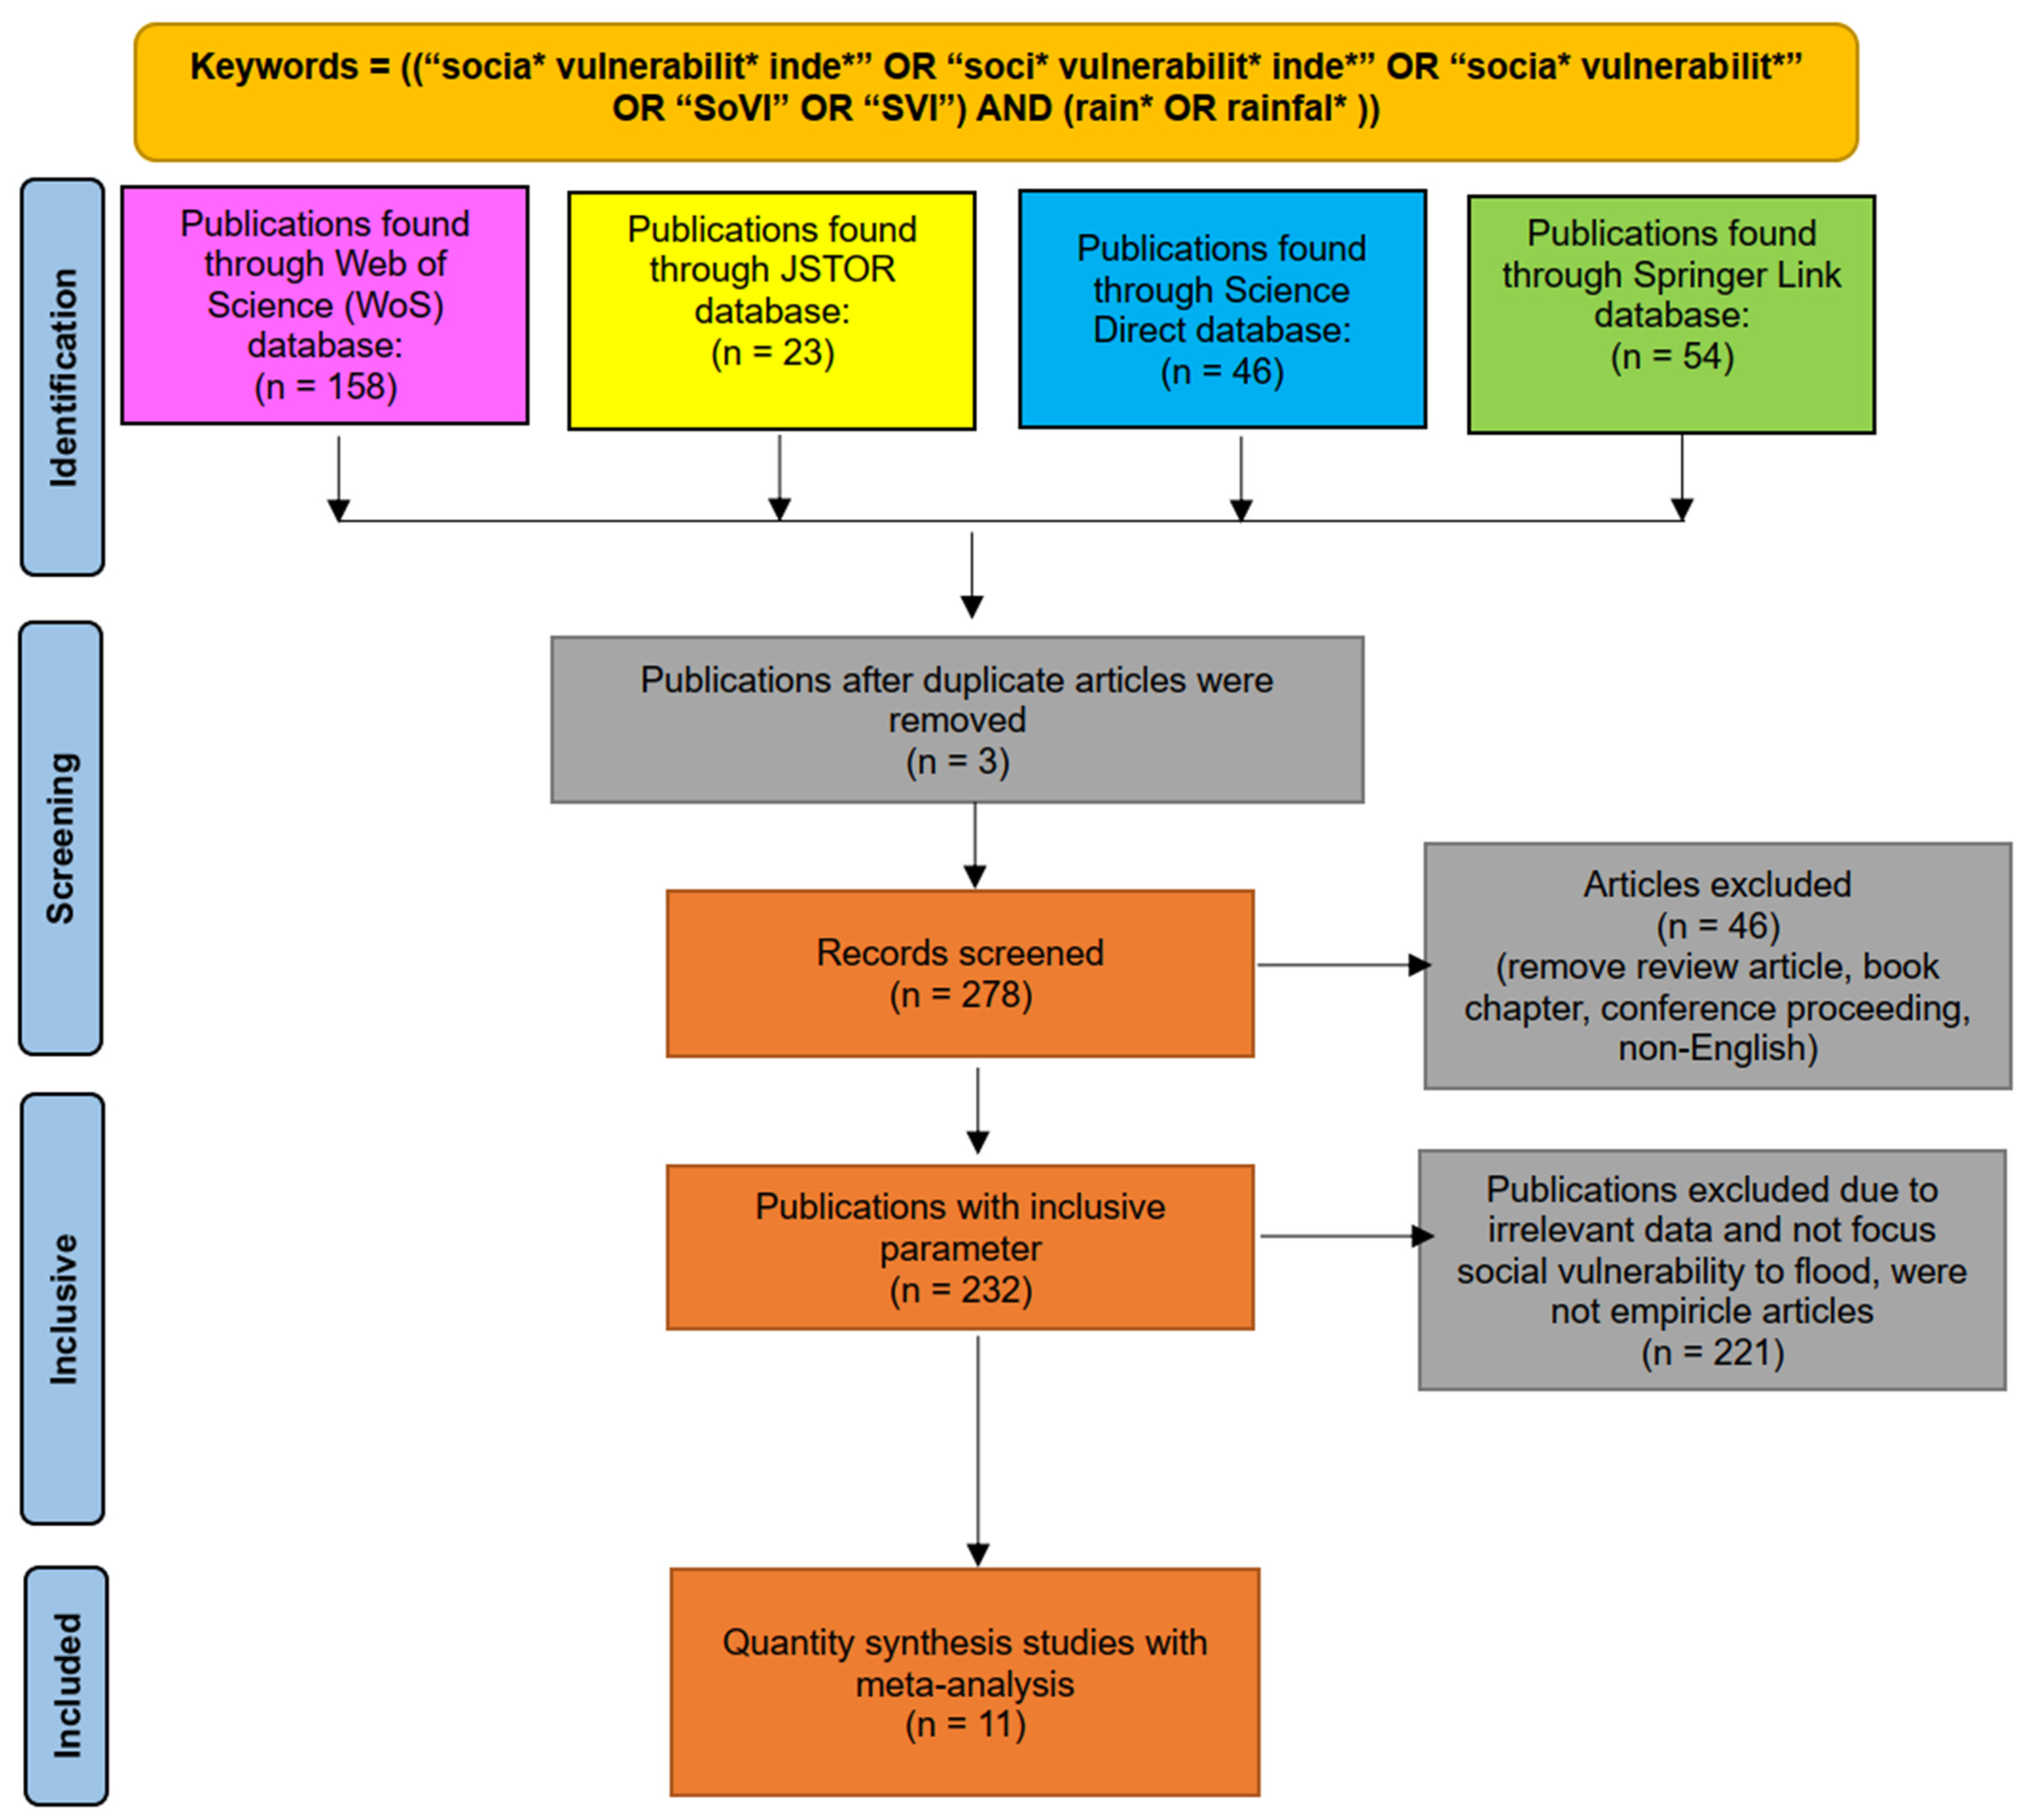
2.1. Search and Literature Database

The present article employs the PRISMA approach for a methodical assessment. This approach has mainly been used by healthcare professionals for the formulation of systematic reviews and meta-analyses. However, specialists in environmental management have also adopted PRISMA for conducting systematic reviews. Below is a simplified overview of the primary components and methodology behind the PRISMA approach:
The PRISMA guideline comprises a set of precise measures that researchers must follow. It begins by formulating a research question and establishing criteria for study selection or exclusion. Researchers then identify relevant information sources and create a comprehensive search strategy to retrieve studies. The procedure involves evaluating titles and abstracts, analyzing full-text articles, and applying inclusion/exclusion criteria to select studies aligned with the research query. Systematic data extraction and quality evaluation of the chosen studies are conducted. Summarizing findings, interpreting outcomes, and drawing evidence-based conclusions are pivotal steps in the PRISMA process. The flowchart layout of PRISMA visually represents the study selection process, providing a clear overview of the progression (Figure 1).
A comprehensive literature search was conducted in order to identify relevant studies pertaining to the assessment of social vulnerability, covering a time period of 12 years from January 2010 to January 2022. To perform this search, a number of online databases were utilized, including Springer Link, Science Direct, JSTOR, and Web of Science. In order to narrow down the results, specific search terms, such as “social vulnerability to floods”, “flood”, “flooding”, “social”, “vulnerability”, “index”, “hazard”, “assessment”, “tool”, “index”, “risk”, “SoVI”, and “SVI”, were employed as inclusion criteria for the literature selection. These terms were used both individually and in combination as inclusion criteria for the literature to be considered for this review. It is essential to note that this study only includes peer-reviewed articles in the English language that discuss the development of a social vulnerability assessment tool or index.

2.2. Screening Process

The screening phase is the second step of the systematic review process. During this phase, it is essential to gather all of the articles related to the research topic and eliminate any irrelevant data simultaneously. Table 1 outlines the parameters for inclusion and non-inclusion that must be followed in order to identify relevant articles. In order to identify relevant articles, a total of 281 articles were examined using a series of inclusion and non-inclusion parameters. These parameters were designed to consider factors such as the nature of the literature, language, timeline, countries, and territories, as well as the field of study. For the literature type criterion, this study narrowed its focus to journal research articles while excluding papers that mimic review articles, book chapters, and conference proceedings. In terms of language, only English publications were considered, while articles not written in English were not considered. The publication criteria stipulated the period between 2010 and 2022 exclusively, while the geographical criterion was limited to ASEAN, the Middle East, and European countries. Lastly, this study selected articles exclusively from environmental studies and sustainability, social studies, and agricultural science. From the inclusion and non-inclusion criteria, 249 articles were eliminated in total (see Figure 2).

2.3. Inclusive and Non-Inclusive

For the third phase of inclusion, 232 articles were used in total. Each paper with a title, abstract, and content is crucial, and requires a thorough examination to ensure that it meets the inclusion criteria and objective review requirements. A total of 221 articles did not meet the criteria and were excluded; therefore, the selected articles for analysis are primarily focused on social vulnerability and empirical research. This selection was made because the objective of this study is to determine the indicators utilized to evaluate social vulnerability in the Malaysian flood context. The importance of this study is based on understanding the actions related to social vulnerability, especially in integrating climate change and risk reduction into the governance and arrangement of both urban and rural sectors. More specifically, this method highlights the significance of public education in raising awareness about potential flooding more accurately. While flood frequency can vary across countries due to diverse climate conditions, this study aims to include ASEAN, the Middle East, and European countries to bridge the research gap in developing social vulnerability indicators. By doing so, the research can offer valuable insights into how to better address flood risks and enhance community preparedness in a broader geographical context.
After completing the assessment and analysis of the remaining articles, the researcher initiated the data extraction process. The first stage involved a comprehensive evaluation of the abstract of each article, which was followed by a thorough examination of the entire text to identify the relevant themes and subthemes related to the research objectives. Subsequently, in order to establish a typology for each article, the themes and subthemes were systematically arranged.

3. Results

Based on the results shown in Table 2, a total of 11 articles were chosen for this study, and the authors of these articles include those of [4,25,26,27,28,29,30,31,32,33,50]. Furthermore, the chosen articles were published within the years spanning from 2014 to 2021. The primary aim of this study is to identify patterns in research pertaining to social indicators that are consistently examined and deliberated upon for the purpose of constructing a social vulnerability index for a specific region or community. With respect to the countries represented in this study, two of the studies originated from Australia and Canada, while the others were conducted in Italy, the Philippines, the Netherlands, the United States, China, Taiwan, and Indonesia. This compilation encompasses the names of the authors, the countries where the studies were conducted, the titles of the articles, and the objectives of the scholars’ investigations.

3.1. Indicators Used to Measure Social Vulnerability in a Flood

The indicators of social vulnerability to floods were most frequently related to demographic characteristics, particularly in the stages of disaster response and recovery. The indicators most frequently detected after these were those related to socioeconomic status, primarily noted during the response phase. The correlation between demographic as well as socioeconomic factors and their impact on susceptibility to inundations highlights the significance of characteristics like ethnicity, gender, age, and income in determining a society’s resilience, response, and recovery from flood-related disruptions. In addition, other significant factors include health, education, risk perception, migration, disability, and disabled persons.
Floods can significantly impact both the physical and psychological health of individuals and communities [58]. Additionally, exposure to contaminated floodwaters can lead to waterborne diseases, posing a severe health risk, while disrupted access to medical assistance during floods can delay treatment for injuries and medical conditions, amplifying health concerns [10,59]. Moreover, the psychological toll of the upheaval caused by floods, including displacement and loss, can lead to heightened stress and emotional distress. Addressing the health impact of floods requires proactive disaster preparedness and response measures, such as early warning systems, evacuation plans, and improved infrastructure. Public awareness and education on flood risks and safety measures are essential to empower individuals and communities to protect themselves during such events [58,60]. By understanding and effectively responding to the health consequences of floods, communities can enhance their resilience and safeguard their well-being in the face of these challenging natural disasters.
Meanwhile, education plays a significant role in shaping how individuals comprehend and react to flood-related information as well as resources [61,62]. Education in this context pertains to the level of formal schooling and knowledge acquired by individuals. People with higher levels of education are more likely to comprehend flood warnings issued by authorities, enabling them to take appropriate and timely actions during flood events [63]. They can also access recovery resources more effectively, utilizing problem-solving skills and resource management capabilities [64]. On the other hand, individuals with limited formal education may face challenges in comprehending flood warnings and finding recovery resources, potentially making them more vulnerable to the impacts of floods [50,65]. Enhancing education and promoting flood-related awareness can improve preparedness and response among communities, reducing the adverse consequences of floods on vulnerable populations.
Moreover, risk perception refers to how individuals and communities perceive the likelihood and severity of potential hazards, such as floods [66]. It involves people’s subjective judgments and beliefs about the risks that they face, which can be influenced by various factors, including past experiences, cultural beliefs, and access to information [67,68]. Individuals with high risk perception are more likely to take precautionary measures and engage in preparedness actions to reduce their vulnerability to floods [10,69]. They are more likely to pay attention to warnings, plan for evacuation, and implement strategies to safeguard themselves and their properties during flood events. Understanding risk perception is crucial for disaster management and community resilience, as it can help authorities tailor communication strategies, improve preparedness programs, and foster a better understanding of how individuals respond to flood risks [70].
On the other hand, migration refers to the movement of people from one location to another, often driven by various factors like economic opportunities, environmental changes, or seeking better living conditions. In the context of flood vulnerability, migration can have both positive and negative impacts [21]. People may migrate away from flood-prone areas to avoid the risks associated with floods, reducing their vulnerability. However, migration can also lead to increased vulnerability if people relocate to areas with a higher flood risk or inadequate infrastructure, or if they become displaced during extreme flood events [21].
The term “disability” denotes physical or mental impairments that hinder an individual’s daily functioning, and this can be further exacerbated by flood events. Disabled persons are individuals with disabilities who may encounter additional difficulties in terms of preparing for and responding to flood events. Overall, these factors highlight the complex and multifaceted nature of social vulnerability to floods, as well as the need for a comprehensive understanding of the drivers and impacts of vulnerability in order to effectively address and mitigate flood risks. Table 3 provides an inclusive list of 14 indicators that can be used to determine the level of social vulnerability in the event of a flood. These indicators encompass factors such as age group, gender, property ownership, physical infrastructure, economic status, household composition, academic background, employment status, profession, urbanization level, disability, migration status, healthcare availability, and population demographics.

3.2. Demographic Characteristics

In contemporary research, demographic characteristics serve as frequent indicators of social vulnerability. Nevertheless, there is often an inconsistency in the academic literature in terms of the exact effect of individual demographic variables on socially vulnerable populations. For example, there are studies that highlight that children are a particularly susceptible demographic in the population; however, they may also act as a driving force for promoting resilience by means of fostering community networks through their education or aiding in household recovery endeavors [34,72,73]. It is commonly assumed that the elderly and women are the most vulnerable; however, research on fatalities related to floods reveals that young [49] and middle-aged men are also at risk due to their inclination towards risky behavior [52], rescue activities, and health impairments caused by drug or alcohol consumption [4,49]. A review of standard demographic factors is necessary due to these discrepancies. A detailed classification of the frequency of citations on demographic factors that impact social vulnerability to floods is presented in Table 3. The demographic features that are most commonly found in the literature encompass age (with a particular emphasis on the elderly and young populations), gender, race, recent immigrants, and single-parent households [25,26,27,28,29,30,31,32,33].
In the literature, age is widely recognized as the primary demographic factor that influences social vulnerability, mainly due to its pervasive prevalence and consequential impact. The age variable includes the ratio of inhabitants classified into four age groups: those aged 65 and above; aged 4 and below; individuals aged 5–14; and residents aged 15–19 [4,25,26,27,28,29,30,31,32,33,50]. From these findings, a negative outcome has been shown for elderly people, indicating an increased susceptibility to vulnerability. Reducing social vulnerability with regard to age can be accomplished by utilizing prior experience with disasters and taking proactive measures in the mitigation phase; however, studies suggest that the elderly and young are more susceptible to disasters due to their dependence and physical condition, with limited linear connections between age and vulnerability identified. [4,49,51]. This indicates that individuals who fall into the categories of “very young” or “very old” may require additional assistance and support during disasters due to their age-related limitations.
Disabled populations, including those living in institutions, those with limited abilities to care for themselves, individuals with long-term or chronic illnesses requiring continuous care, and residents of nursing homes, have frequently been identified as the main driver of social vulnerability. According to research, patients in nursing homes and hospitals face significant challenges when it comes to evacuation and seeking shelter in situ [51,54]. Furthermore, in severe situations, family members of patients may hinder the evacuation of those who require self-care. The presence of limited mobility, dependence on care, and reliance on medication as well as other services poses significant challenges to the process of evacuation. In contrast, when services are disrupted, the recovery process may be impeded due to the increasing difficulty in providing care for special needs populations [54].
Furthermore, recognizing the complex relationship between gender identity and flood susceptibility is essential, as women are disproportionately responsible for taking care of their families [44]. Gender-based vulnerability was evident in both developed and developing nations, stemming from differences in resource accessibility, opportunities, power, rights, informal sector employment, and income [26]. The only choice available to women is often informal sectors with low wages, which leads to limited opportunities for economic expansion and lower pay than men [27].
The impact of gender on susceptibility to floods is not a simple phenomenon to understand; women are recognized for their superior coping mechanisms, greater commitment to obtaining knowledge related to risk, and stronger social bonds, which account for this [33]. The analysis of individual cases has demonstrated the difficulty in generalizing the vulnerability of women in society. Furthermore, it is important to consider the overall complexity and diversity of individual cases when analyzing the vulnerability of women in society. Even in developing nations with high levels of inequality, social vulnerability cannot be predicted solely by gender. Women’s daily living conditions are affected by their socioeconomic status, household structures, and geographic locations, making it an unreliable indicator [4]. The evidence from several studies conducted in this specific context suggests that gender is not a determining factor in the level of social vulnerability experienced during flooding events [55,57]. The factors of race, class, ethnicity, and immigration status serve as supplementary drivers of social vulnerability to floods. Cultural and linguistic obstacles can impact the selection of residential areas in high-risk zones, pre-disaster mitigation measures, and the availability of post-disaster resources for recovery [72,73,74].

3.3. Socioeconomic Status

The elements that determine socioeconomic status are commonly utilized as primary features in measuring social vulnerability in different geographic locations. In social vulnerability studies, several common indicators of socioeconomic status are measured, such as household composition, poverty, profession, academic background, economic and employment status, and property ownership. At the individual level, social vulnerability may arise from a variety of factors, including resource constraints, power dynamics, poverty, and marginalization. These factors can limit access to resources, influence coping behaviors, and induce stress [8]. Similarly, at the community level, social vulnerability is determined by factors such as income distribution, resource accessibility, and economic asset variety [46].
Within this specific context, income and poverty are the foremost factors that significantly impact social vulnerability. The primary reason for this is that income is intricately connected with other forms of capital that could potentially act as alternative indicators for social vulnerability to floods. To assess social vulnerability to floods, various indicators can be used, such as access to education, affluence, occupational category, overcrowding in residences, home or car ownership, and unemployment [19]. Education is an important factor in the correlation between income and other forms of capital. Individuals who are educated have a greater advantage in all areas of life compared to those who have not received education or have only received minimal education. Moreover, it can lead to better-paying jobs and ultimately result in higher incomes [31]. As a result, this may lead to an increase in asset ownership, though at a higher cost for wealthier households specifically in regard to flood damage; however, flood damage expenses make up a smaller fraction of the total income and capital of wealthier households [32]. On the contrary, a lower level of education is correlated with poverty, unemployment, overcrowding, marginalization, and income inequality. Low-income groups tend to experience more severe negative effects from detrimental flood incidents, and recovering from a moderately damaging event may take years for individuals who lack adequate financial resources, as indicated by [27]. Moreover, individuals with a higher level of education are less likely to be vulnerable to any form of hazard. According to [19], someone who has sufficient education and knowledge about a certain issue will have a more thorough understanding of the nature of a hazard and its potential effects on them.

3.4. Health

Health is a primary indicator of social vulnerability to flooding. Furthermore, flooding causes adverse consequences on fatality rates and bodily as well as psychological health. In particular, the most significant impact of floods on human health is the fatalities resulting from drowning. Thus, variables such as medical services, health issues, and proximity to healthcare facilities are crucial components in evaluating social vulnerability [4,49,51,54].
Deaths resulting from flood-related illness can be influenced by various factors, such as age, gender, medication disruptions, and public water consumption [49]. Meanwhile, the impact of flooding on psychological well-being may vary depending on individual factors, such as anxiety and stress levels, age, gender, pre-existing health conditions, and recovery duration [4]. Additionally, floods can also have a significant impact on mental health, which can be prolonged due to conflicts with insurance companies and homeowners, as well as the disruption of various public, commercial, and health services [4,30]. Despite establishing the key determinants of vulnerability to health issues caused by floods, current research does not come to a consensus on the demographic and societal aspects linked to health outcomes from floods. In addition, the influence of flood circumstances in worsening health concerns and mortality is still inconclusive.

3.5. Coping Capacity

Analyses of social vulnerability often focus on identifying social characteristics that increase susceptibility to negative impacts; however, it is important to recognize that social vulnerability also includes individuals’ ability to manage the impacts of hazards in the short term and adapt to them in the long term [75,76]. Coping capacity refers to the capacity of individuals and communities to effectively manage the adverse effects of hazards, especially natural disasters like floods. Coping strategies are successful when they allow individuals to access or allocate resources to meet immediate needs without putting assets and income sources at risk. These resources can be both individual, such as personal skills and knowledge, and social, such as support networks and community organizations. Successful coping strategies involve accessing or allocating these resources in a way that allows people to overcome immediate challenges while also maintaining their long-term assets and livelihoods. This means that people need to be able to balance their short-term needs with their long-term goals. The concept of coping capacity is important because it helps us understand why some individuals and communities are better able to recover from disasters or crises than others. The specific strategies adopted vary depending on social, physical, and geographic contexts. In the literature, the evaluation of coping capacity involves examining not only proactive measures taken before flooding, such as preventive and adaptive actions, but also reactive strategies implemented immediately after an event [77]. This means that coping capacity can be understood as both proactive measures taken before a disaster occurs and reactive measures taken in response to a disaster.
Coping capacity refers to the ability of individuals and communities to deal with and recover from the impacts of disasters. Preventative measures are actions taken before a disaster occurs to reduce the impact of a disaster. In the case of floods, preventative measures include accumulating food and medicine supplies, saving finances, arranging construction materials, and obtaining insurance coverage [78,79]. These measures can help individuals and communities prepare for a flood and reduce the damage caused by a flood; however, the use of preventative strategies is constrained by income and land tenure. This means that individuals and communities with limited financial resources or insecure land tenure may not be able to take these preventative measures. Instead, the majority of pre-flood actions focus on elevating structures and their contents in order to protect residences from flooding. Structural mitigation refers to physical changes made to buildings to reduce the impact of a disaster. In the case of floods, this may involve elevating the building or its contents to prevent damage from floodwaters [80]. While these structural mitigation measures can be moderately effective in reducing damage, they may not be accessible to all individuals and communities. This highlights the importance of addressing social and economic inequalities in disaster risk reduction efforts.

3.6. Risk Perception

The evaluation of risk perception centers on comprehending the manner in which perception influences conduct and mitigates susceptibility. In the context of flood-related calamities, numerous case studies have frequently noted the influence of risk perception on societal vulnerability. Previous research endeavors have delved into diverse aspects of flood perception, encompassing flood awareness, antecedent experiences, trust, appraisal of flood risk, as well as demographic characteristics [25]; however, the findings regarding perception and vulnerability were often contradictory in nature.
The issue of flood awareness and knowledge has frequently been the subject of investigation, with the underlying belief that awareness serves as a crucial prerequisite for preparedness [81]. Emotions such as fear, uncertainty, and concern are important intermediaries in the relationship between cognizance and safeguarding measures [76,82]. Indeed, several studies have reported a correlation between a lack of awareness regarding floods and a limited uptake of measures aimed at flood protection and preparedness [65,83]. Generally, measures are implemented by considering elevating homes, acquiring flood insurance, accumulating supplies, relocating building contents to higher floors, and carrying out evacuations. Although government dissemination of official flood information can increase awareness, it may not be enough to reduce societal susceptibility.

3.7. Land Tenure Property

Social vulnerabilities across land tenure categories differ during a disaster, indicating that individuals belonging to a specific tenure category may be vulnerable in one phase of a disaster but not in another. Before a flood occurs, homeowners tend to become more aware of flood hazards [84], understand alerts better [25], and quickly take steps to prevent damage [85], and are less likely to seek emergency shelter [86]. Meanwhile, flood insurance was mainly considered a factor for reducing the impact of floods in studies conducted in developed countries [54]. Nevertheless, the connection between tenure and flood insurance is not straightforward.
In the aftermath of the flooding, tenants experienced a greater number of health-related consequences and stress compared to property owners during the flood event [8]. Furthermore, they continued to rely on property owners during the recovery and reconstruction processes. In response to flooding, property owners were also more inclined to engage in structural enhancements to mitigate future flood-related losses [27]. There are multiple factors that contribute to the stronger attachment that homeowners tend to have to their homes compared to renters. These factors include emotional attachment, market conditions, and control over maintenance and repairs.

3.8. Disaster Management Plans

Disaster management plans are designed to address the unique challenges posed by different types of disasters [70]. Each disaster requires a tailored approach for an effective mitigation and response. Accordingly, higher-risk areas receive greater attention and allocation of state resources to ensure comprehensive protection [46,87]. In the context of flood management, the flood vulnerability matrix serves as a valuable tool to guide suitable actions. These actions may involve the maintenance of existing reservoirs and the construction of new water storage dams, ranging from small- to large-scale structures [70]. These reservoirs play a crucial role in regulating water flow, especially during flood events. By strategically managing water release, downstream areas can be safeguarded from excessive flooding. To further mitigate flood risks, it is essential to adopt measures that reduce runoff and divert floodwaters into designated reservoirs [36]. These reservoirs should be strategically located at a safe distance from populated regions to minimize potential damage and protect human lives [85]. Special attention should also be given to city drainage systems, ensuring the efficient channeling of excess water away from urban areas [88]. A proactive approach involves diverting runoff water to potential flood pocket zones, which can act as natural storage areas, helping protect cities and communities from the brunt of flood impacts. By employing a combination of infrastructure development, strategic planning, and proper drainage management, disaster management plans can enhance flood resilience and minimize the devastating consequences of flooding events on vulnerable populations [83].

4. Discussion

Several studies have utilized both case study and indicator development techniques to analyze social vulnerability in the context of floods. In general, the selection of variables, analyses of indicators, weighting mechanisms, and aggregation techniques are often based on implicit factors or justified by the principles of simplicity or prior study decisions. There are numerous cases where no justification is provided. Improving contextual integration can significantly enhance the effectiveness of social vulnerability indices in representing observed conditions. The results of this study show several deficiencies in understanding pertaining to the formulation of social vulnerability indices. To identify indicators of social vulnerability, it is essential to consider the time period during which these indicators are applicable. In addition, it is essential to enhance the ability to quantify the factors that have a significant impact on vulnerability. Furthermore, a comprehensive understanding of social vulnerability requires an appreciation of how various indicators interact with one another.

4.1. Temporal Context

One interesting finding from the meta-analysis is that social vulnerability determinants show a lot of variation during different stages of a disaster, which highlights the fact that social vulnerability is a dynamic state that can change over time [30,47,89]. The results from demographic and health studies offer important insights. Both young and elderly people were found to be more vulnerable to floods because they lacked knowledge and preparedness [34]. Among those affected during floods, men and middle-aged individuals showed higher vulnerability due to risky behaviors and involvement in emergency operations [45,60]. Additionally, children and elderly individuals were more vulnerable as they had limited swimming abilities and difficulty finding safe places during floods [60,86]. In the aftermath of a flood, females, single-parent households, and the elderly experienced heightened vulnerability, primarily stemming from limited access to resources and difficulties in upholding their long-term care and services [47,60].

4.2. Measurability

Although indicators are valuable tools for policy formulation and public communication, it is crucial to understand that there are certain boundaries that need to be considered [90,91]. When social vulnerability indicators are employed without proper consideration of practical factors, such as cost, data availability, and measurability, misguided decision making can occur, with these factors taking precedence over validity [92]. Improving measurability is important, especially when it comes to social capital, risk perception, and the psychosocial dimensions of health. These things can be challenging to measure because they often depend on the situation and require different scales than other indicators (like individual or network scales). Indicators for these aspects are usually not available in publicly accessible databases, such as national censuses. Conversely, they require the implementation of qualitative methodologies, specific surveys, and participatory strategies. To overcome these limitations, scorecards have been widely adopted as a popular survey instrument, especially for researchers studying urban resilience; however, more research is necessary to enhance the integration of research outcomes derived from the application of these methods. Specifically, the value of participatory approaches in generating meaningful quantitative data is often disregarded and should be afforded greater attention [93].
Each of the mentioned indicators can be measured through specific metrics. For instance, in Northeast India, the indicator of income levels can be used to determine socioeconomic status [94], while in Pakistan the indicator of educational attainment can be used to evaluate education level [63]. Similarly, proximity to flood-prone areas can be used to measure proximity, among other metrics. Measurable data offer a clear comprehension of the vulnerabilities that exist in various communities and regions, thereby enabling a comprehensive and systematic evaluation of social vulnerability. For instance, when evaluating the accessibility of healthcare facilities during river floods in Bangladesh, researchers have the ability to gather data on various factors, such as the number of healthcare facilities available, their exact locations, and the population that they cater to. By measuring this particular indicator, it becomes possible to comprehend the level of accessibility to healthcare services during floods and also to pinpoint areas that may have insufficient access [95]. Similarly, in the case of examining the impact of education levels on vulnerability during urban floods in Jakarta, experts can gather information on literacy rates, school enrolment figures, and educational achievements within the affected communities [4]. These data facilitate an assessment of how education can influence an individual’s ability to comprehend flood warnings and respond appropriately.
The ability to measure is also restricted by a limited comprehension of the fundamental processes of social vulnerability. In certain studies, protective factors included being a child [47,62], elderly [45,96], a woman [97,98], and a minority group [50]. The impact on social vulnerability displayed considerable ambiguity and nuance, especially in relation to risk perception. The results of previous studies on risk perception are too contradictory to draw general conclusions for selecting indicators [99,100]; therefore, there is a need for the development and testing of new geospatial indicators of social capital. Social capital encompasses social networks, shared cultural norms, and interpersonal trust that facilitate cooperation and coordination among individuals and groups [51]. These indicators can help in understanding the social context of flood risk and inform decision making. Additionally, there is a need to search for suitable existing proxy measures that can be used as indicators. Proxy measures are indirect measures that are used to estimate a variable of interest when direct measures are not available or feasible.
Generally, measurability challenges are important in developing social vulnerability indicators and being aware of the limitations. Researchers should be cautious when making claims about the accuracy of these indicators, especially when important factors that are difficult to measure are not included. This means that researchers should carefully examine what information is missing and how it may affect the accuracy of the indicators.

4.3. Indicator Relationship

Additional studies are required to gain a deeper understanding of how social vulnerability drivers interact, particularly across varying geographical and temporal scales. The case studies offer fascinating examples, highlighting the interdependence between population composition, economic status, property ownership, social relationships [64], ethnicity and social status, age, financial status [101], and social isolation. Moreover, the analysis of flood insurance underscores the complex relationship between social vulnerability drivers and their effects. At an individual level, a significant correlation has been observed between the purchase of insurance policies and income, home ownership, and mitigation behavior.
Age and gender are key factors in determining vulnerability to various hazards. The unique circumstances of children, elderly individuals, and women often render them more vulnerable. Children may be deficient in awareness and coping skills, whereas the elderly may have reduced mobility and resilience. Meanwhile women, particularly in conservative societies, may encounter cultural and societal barriers that impede their ability to respond to disasters effectively. Additionally, vulnerability is significantly influenced by property ownership and economic status. Those with restricted access to resources and financial means are more vulnerable during disasters. Property ownership affects the ability to relocate or access safe shelter, while economic status impacts access to healthcare, food, and other essential resources. The other significant indicators are the state of infrastructure and household composition. Adequate infrastructure, such as well-maintained roads, bridges, and emergency services, can mitigate vulnerabilities and enable better disaster responses. Supportive household structures, with strong social networks and capable caregivers, enhance resilience and coping mechanisms during adversity.
The determinants of livelihood resilience are influenced by various factors, including educational background, employment status, and profession. Individuals who possess higher levels of education are endowed with better access to information, resources, and opportunities, thereby enhancing their ability to adapt to diverse circumstances and challenges. Furthermore, stable employment guarantees a reliable source of income and financial security, enabling individuals to cope with adversities more effectively. Vulnerability is significantly impacted by urbanization and migration patterns. In rapidly developing areas with dense populations, there exists an increased exposure to risks such as environmental hazards and limited access to basic services. The concentration of people in urban centers can strain resources, thus making it more challenging to provide adequate support and assistance during times of disasters.
In regard to indicator aggregation, many social vulnerability indicators still use additive techniques. According to this methodology, every element contributing to susceptibility is assumed to operate independently, and any inadequacy in one aspect of social vulnerability can be counterbalanced by an excess in another aspect [102]. The meta-analysis (Figure 3) reveals the limitations of relying on individual indicators to understand social vulnerability to floods and emphasizes the need for modeling and mapping approaches that consider the interactions between drivers. The flood social vulnerability illustrated in Figure 3 is based on a statistical analysis utilizing Pearson’s correlation analysis; an investigation was conducted to scrutinize the relationship between the drivers that were identified in each of our individual studies. The aforementioned correlation elevates the level of interaction between drivers, thereby revealing the specific drivers that are positively (indicated by the color dark orange) or negatively (indicated by the color light orange) correlated. However, it is essential to realize that the existence of the aforementioned factors during the practical investigation does not necessarily indicate a causal correlation between them; instead, they have a tendency to concur or manifest simultaneously. Moreover, in most instances, empirical studies primarily devote attention to the dominant relationships.

5. Conclusions

In this study, we undertook a comprehensive analysis of the components of flood and social vulnerability. Firstly, we searched key databases and identified a total of 281 articles. Subsequently, we employed PRISMA guidelines to filter the articles based on inclusion and exclusion criteria, resulting in a final selection of 11 pertinent articles. Using information gathered from these studies, we collated a list of fifteen variables that are commonly utilized as indicators in the context of Malaysia. Not all places or locations bear the same brunt of floods; thus, the extent of social vulnerability would vary and the methods used to measure them would differ as well. Even if people face the same calamity or catastrophe, it does not imply that every individual undergoes identical phases of devastation, recuperation, appraisal, etc., as their counterparts. Certain individuals are at a significantly greater risk of social vulnerability, and this is subject to the indicators utilized.
In the context of Malaysia and its climatic conditions, there are seven crucial indicators that have been identified with regard to flood occurrences. These indicators include education, age, migration, special needs populations, health accessibility, demographic characteristics, and socioeconomic status. These indicators are significant in measuring the social vulnerability index of high-risk communities in the face of flood hazards. The measurements obtained from these indicators would prove useful to authorities as complementary data to their geological mapping of disaster risk management, specifically with regard to the location of flood events. This study is of significant importance as it enables a better understanding of the social vulnerability index in the context of floods in Malaysia.

Author Contributions

Conceptualization, I.I., T.H. and M.S.; methodology, I.I., T.H., N.L.F. and M.S.; validation, M.N.H.J., R.K.B. and N.F.S.; formal analysis, I.I., M.N.H.J., N.F.S. and N.L.F.; investigation, M.N.H.J. and R.K.B.; resources, M.N.H.J., R.K.B. and N.F.S.; data curation, I.I. and N.F.S.; writing—original draft preparation, I.I. and N.F.S.; writing—review and editing, T.H., N.L.F. and M.S.; visualization, I.I., N.L.F. and M.S.; supervision, T.H. and M.S.; project administration, T.H. and R.K.B.; funding acquisition, T.H. All authors have read and agreed to the published version of the manuscript.

Funding

This research received no external funding.

Institutional Review Board Statement

Not applicable.

Informed Consent Statement

Not applicable.

Data Availability Statement

Not applicable.

Acknowledgments

The authors are grateful to the Sarawak Meteorological Department for providing the data necessary to complete this research. This research was supported by the Higher Research Degree Scholarship (HRD) of Curtin University, Miri, Sarawak, Malaysia.

Conflicts of Interest

The authors declare no conflict of interest.

References

  1. Zikra, M.; Suntoyo; Lukijanto. Climate Change Impacts on Indonesian Coastal Areas. Procedia Earth Planet. Sci. 2015, 14, 57–63. [Google Scholar] [CrossRef]
  2. AR6 Climate Change 2022: Mitigation of Climate Change—IPCC. Available online: https://www.ipcc.ch/report/sixth-assessment-report-working-group-3/ (accessed on 13 March 2023).
  3. Shukla, P.R.; Skea, J.; Calvo Buendia, E.; Masson-Delmotte, V.; Pörtner, H.O.; Roberts, D.C.; Zhai, P.; Slade, R.; Connors, S.; Van Diemen, R.; et al. Climate Change and Land: An IPCC Special Report on Climate Change, Desertification, Land Degradation, Sustainable Land Management, Food Security, and Greenhouse Gas Fluxes in Terrestrial Ecosystems; IPCC: Geneva, Switzerland, 2019; 864p. [Google Scholar]
  4. Kim, J.; Gim, T.-H.T. Assessment of social vulnerability to floods on Java, Indonesia. Nat. Hazards 2020, 102, 101–114. [Google Scholar] [CrossRef]
  5. Nasiri, S.; Shahmohammadi-Kalalagh, H. Flood vulnerability index as a knowledge base for flood risk assessment in urban area. J. Nov. Appl. Sci. 2013, 2, 269–272. [Google Scholar]
  6. Nazeer, H.R.; Bork, M. Flood Vulnerability Assessment through Different Methodological Approaches in the Context of North-West Khyber Pakhtunkhwa, Pakistan. Sustainability 2019, 11, 6695. [Google Scholar] [CrossRef]
  7. Sarkar, M.S.K.; Begum, R.A.; Pereira, J.J.; Jaafar, A.H.; Saari, M.Y. Impacts of and adaptations to sea level rise in Malaysia. Asian J. Water Environ. Pollut. 2014, 11, 29–36. [Google Scholar]
  8. Wu, T. Quantifying coastal flood vulnerability for climate adaptation policy using principal component analysis. Ecol. Indic. 2021, 129, 108006. [Google Scholar] [CrossRef]
  9. Isia, I.; Hadibarata, T.; Jusoh, M.N.H.; Bhattacharjya, R.K.; Shahedan, N.F.; Bouaissi, A.; Fitriyani, N.L.; Syafrudin, M. Drought Analysis Based on Standardized Precipitation Evapotranspiration Index and Standardized Precipitation Index in Sarawak, Malaysia. Sustainability 2022, 15, 734. [Google Scholar] [CrossRef]
  10. Abdul Rahman, H. Climate Change Scenarios in Malaysia: Engaging the Public. Int. J. Malay-Nusant. Stud. 2018, 1, 55–77. Available online: https://www.researchgate.net/publication/329642223_CLIMATE_CHANGE_SCENARIOS_IN_MALAYSIA_ENGAGING_THE_PUBLIC (accessed on 10 March 2023).
  11. Tang, K.H.D. Climate change in Malaysia: Trends, contributors, impacts, mitigation and adaptations. Sci. Total. Environ. 2018, 650, 1858–1871. [Google Scholar] [CrossRef] [PubMed]
  12. Hammond, M.; Chen, A.; Djordjević, S.; Butler, D.; Mark, O. Urban flood impact assessment: A state-of-the-art review. Urban Water J. 2013, 12, 14–29. [Google Scholar] [CrossRef]
  13. Saraswat, B.K.; Kumar, C.; Mishra, P. Assessment of stormwater run off management practices and governance under climate change and urbanization: An analysis of Bangkok, Hanoi and Tokyo. Environ. Sci. Policy 2016, 3, 101–117. [Google Scholar] [CrossRef]
  14. Erena, S.H.; Worku, H. Urban flood vulnerability assessments: The case of Dire Dawa city, Ethiopia. Nat. Hazards 2019, 97, 495–516. [Google Scholar] [CrossRef]
  15. Apel, H.; Trepat, O.M.; Hung, N.N.; Chinh, D.T.; Merz, B.; Dung, N.V. Combined fluvial and pluvial urban flood hazard analysis: Concept development and application to Can Tho city, Mekong Delta, Vietnam. Nat. Hazards Earth Syst. Sci. 2016, 16, 941–961. [Google Scholar] [CrossRef]
  16. Di Ludovico, D.; Fabietti, V. Strategic Environmental Assessment, key issues of its effectiveness. The results of the Speedy Project. Environ. Impact Assess. Rev. 2018, 68, 19–28. [Google Scholar] [CrossRef]
  17. Sa’adi, Z.; Shahid, S.; Ismail, T.; Chung, E.-S.; Wang, X.-J. Distributional changes in rainfall and river flow in Sarawak, Malaysia. Asia Pacific J. Atmos. Sci. 2017, 53, 489–500. [Google Scholar] [CrossRef]
  18. Mayowa, O.O.; POUR, S.H.; Shahid, S.; Mohsenipour, M.; BIN Harun, S.; Heryansyah, A.; Ismail, T. Trends in rainfall and rainfall-related extremes in the east coast of peninsular Malaysia. J. Earth Syst. Sci. 2015, 124, 1609–1622. [Google Scholar] [CrossRef]
  19. Shakhovska, N.; Fedushko, S. Data analysis of music preferences of web users based on social and demographic factors. Procedia Comput. Sci. 2022, 198, 730–735. [Google Scholar] [CrossRef]
  20. Javadinejad, S.; Dara, R.; Jafary, F. Climate Change Scenarios and Effects on Snow-Melt Runoff. Civ. Eng. J. 2020, 6, 1715–1725. [Google Scholar] [CrossRef]
  21. Anderson, J.T.; Wadgymar, S.M. Climate change disrupts local adaptation and favours upslope migration. Ecol. Lett. 2019, 23, 181–192. [Google Scholar] [CrossRef]
  22. Youssef, A.M.; Abu-Abdullah, M.M.; Abu AlFadail, E.; Skilodimou, H.D.; Bathrellos, G.D. The devastating flood in the arid region a consequence of rainfall and dam failure: Case study, Al-Lith flood on 23th November 2018, Kingdom of Saudi Arabia. Für Geomorphol. 2021, 63, 115–136. [Google Scholar] [CrossRef]
  23. Ge, W.; Wang, X.; Li, Z.; Zhang, H.; Guo, X.; Wang, T.; Gao, W.; Lin, C.; van Gelder, P. Interval Analysis of the Loss of Life Caused by Dam Failure. J. Water Resour. Plan. Manag. 2021, 147, 04020098. [Google Scholar] [CrossRef]
  24. Eghdami, S.; Scheld, A.M.; Louis, G. Socioeconomic vulnerability and climate risk in coastal Virginia. Clim. Risk Manag. 2023, 39, 100475. [Google Scholar] [CrossRef]
  25. Abuzied, S.M.; Mansour, B.M.H. Geospatial hazard modeling for the delineation of flash flood-prone zones in Wadi Dahab basin, Egypt. J. Hydroinformatics 2018, 21, 180–206. [Google Scholar] [CrossRef]
  26. Pollard, J.; Spencer, T.; Brooks, S. The interactive relationship between coastal erosion and flood risk. Prog. Phys. Geogr. Earth Environ. 2018, 43, 574–585. [Google Scholar] [CrossRef]
  27. Haryanto, B. Climate Change and Public Health in Indonesia Impacts and Adaptation Budi Haryanto Austral Policy Forum 09-05S. Naut. Inst. Aust. 2009, 1–12. Available online: https://www.researchgate.net/publication/228382505_Climate_Change_and_Public_Health_in_Indonesia_Impacts_and_Adaptation (accessed on 7 March 2023).
  28. Alhoot, M.A.; Tong, W.T.; Low, W.Y.; Sekaran, S.D. Climate Change and Health: The Malaysia Scenario. In Advances in Asian Human-Environmental Research; Springer: Berlin/Heidelberg, Germany, 2016; pp. 243–268. [Google Scholar] [CrossRef]
  29. Taiye, I.O. Assessment of Urban Vulnerability Towards Flood: A Case Study of Kosofe Lga, Lagos State. Master’s Thesis, Department of Geography, University of Lagos, Lagos, Nigeria, 2014. Volume 39, pp. 1 –24. [Google Scholar]
  30. Aroca-Jimenez, E.; Bodoque, J.M.; Garcia, J.A.; Diez-Herrero, A. Construction of an integrated social vulnerability index in urban areas prone to flash flooding. Nat. Hazards Earth Syst. Sci. 2017, 17, 1541–1557. [Google Scholar] [CrossRef]
  31. Sarmah, T.; Das, S.; Narendr, A.; Aithal, B.H. Assessing human vulnerability to urban flood hazard using the analytic hierarchy process and geographic information system. Int. J. Disaster Risk Reduct. 2020, 50, 101659. [Google Scholar] [CrossRef]
  32. Molodetska, K.; Brodskiy, Y.; Fedushko, S. Model of assessment of information-psychological influence in social networking services based on information insurance. CEUR Workshop Proc. 2020, 2616, 187–198. [Google Scholar]
  33. Fekete, A. Critical infrastructure and flood resilience: Cascading effects beyond water. WIREs Water 2019, 6, e1370. [Google Scholar] [CrossRef]
  34. Tascón-González, L.; Ferrer-Julià, M.; Ruiz, M.; García-Meléndez, E. Social Vulnerability Assessment for Flood Risk Analysis. Water 2020, 12, 558. [Google Scholar] [CrossRef]
  35. Rufat, S.; Tate, E.; Burton, C.G.; Maroof, A.S. Social vulnerability to floods: Review of case studies and implications for measurement. Int. J. Disaster Risk Reduct. 2015, 14, 470–486. [Google Scholar] [CrossRef]
  36. Kvočka, D.; Falconer, R.A.; Bray, M. Flood hazard assessment for extreme flood events. Nat. Hazards 2016, 84, 1569–1599. [Google Scholar] [CrossRef]
  37. Burton, C.; Betts, R.A.; Jones, C.D.; Williams, K. Will Fire Danger Be Reduced by Using Solar Radiation Management to Limit Global Warming to 1.5 °C Compared to 2.0 °C? Geophys. Res. Lett. 2018, 45, 3644–3652. [Google Scholar] [CrossRef]
  38. AR5 Climate Change 2014: Impacts, Adaptation, and Vulnerability—IPCC. Available online: https://www.ipcc.ch/report/ar5/wg2/ (accessed on 25 May 2023).
  39. Diaz-Sarachaga, J.M.; Jato-Espino, D. Analysis of vulnerability assessment frameworks and methodologies in urban areas. Nat. Hazards 2019, 100, 437–457. [Google Scholar] [CrossRef]
  40. Bucherie, A.; Hultquist, C.; Adamo, S.; Neely, C.; Ayala, F.; Bazo, J.; Kruczkiewicz, A. A comparison of social vulnerability indices specific to flooding in Ecuador: Principal component analysis (PCA) and expert knowledge. Int. J. Disaster Risk Reduct. 2022, 73, 102897. [Google Scholar] [CrossRef]
  41. Seeboonruang, U. Impact assessment of climate change on groundwater and vulnerability to drought of areas in Eastern Thailand. Environ. Earth Sci. 2015, 75, 1–13. [Google Scholar] [CrossRef]
  42. Huynh, L.T.M.; Stringer, L.C. Multi-scale assessment of social vulnerability to climate change: An empirical study in coastal Vietnam. Clim. Risk Manag. 2018, 20, 165–180. [Google Scholar] [CrossRef]
  43. Haines, A.; Kovats, R.; Campbell-Lendrum, D.; Corvalan, C. Climate change and human health: Impacts, vulnerability and public health. Public Health 2006, 120, 585–596. [Google Scholar] [CrossRef]
  44. Sung, C.-H.; Liaw, S.-C. A GIS-based approach for assessing social vulnerability to flood and debris flow hazards. Int. J. Disaster Risk Reduct. 2020, 46, 101531. [Google Scholar] [CrossRef]
  45. Fan, J.; Huang, G. Are Women More Vulnerable to Flooding Than Men in an Aging Japanese Society? Int. J. Environ. Res. Public Health 2023, 20, 1299. [Google Scholar] [CrossRef]
  46. Shah, A.A.; Ye, J.; Abid, M.; Khan, J.; Amir, S.M. Flood hazards: Household vulnerability and resilience in disaster-prone districts of Khyber Pakhtunkhwa province, Pakistan. Nat. Hazards 2018, 93, 147–165. [Google Scholar] [CrossRef]
  47. Hamidi, A.R.; Jing, L.; Shahab, M.; Azam, K.; Tariq, M.A.U.R.; Ng, A.W.M. Flood Exposure and Social Vulnerability Analysis in Rural Areas of Developing Countries: An Empirical Study of Charsadda District, Pakistan. Water 2022, 14, 1176. [Google Scholar] [CrossRef]
  48. Aksha, S.K.; Juran, L.; Resler, L.M.; Zhang, Y. An Analysis of Social Vulnerability to Natural Hazards in Nepal Using a Modified Social Vulnerability Index. Int. J. Disaster Risk Sci. 2018, 10, 103–116. [Google Scholar] [CrossRef]
  49. Kirby, R.H.; Reams, M.A.; Lam, N.S.N.; Zou, L.; Dekker, G.G.J.; Fundter, D.Q.P. Assessing Social Vulnerability to Flood Hazards in the Dutch Province of Zeeland. Int. J. Disaster Risk Sci. 2019, 10, 233–243. [Google Scholar] [CrossRef]
  50. Tate, E.; Rahman, A.; Emrich, C.T.; Sampson, C.C. Flood exposure and social vulnerability in the United States. Nat. Hazards 2021, 106, 435–457. [Google Scholar] [CrossRef]
  51. Porio, E.; See, J. Assessing Social Vulnerability to Flooding in Metro Manila Using Principal Component Analysis. Philipp. Sociol. Rev. 2015, 63, 53–80. Available online: https://www.researchgate.net/publication/314442893 (accessed on 7 March 2023).
  52. Roder, G.; Sofia, G.; Wu, Z.; Tarolli, P. Assessment of Social Vulnerability to Floods in the Floodplain of Northern Italy. Weather. Clim. Soc. 2017, 9, 717–737. [Google Scholar] [CrossRef]
  53. El-Zein, A.; Ahmed, T.; Tonmoy, F. Geophysical and social vulnerability to floods at municipal scale under climate change: The case of an inner-city suburb of Sydney. Ecol. Indic. 2020, 121, 106988. [Google Scholar] [CrossRef]
  54. Chakraborty, L.; Thistlethwaite, J.; Minano, A.; Henstra, D.; Scott, D. Leveraging Hazard, Exposure, and Social Vulnerability Data to Assess Flood Risk to Indigenous Communities in Canada. Int. J. Disaster Risk Sci. 2021, 12, 821–838. [Google Scholar] [CrossRef]
  55. Rolfe, M.I.; Pit, S.W.; McKenzie, J.W.; Longman, J.; Matthews, V.; Bailie, R.; Morgan, G.G. Social vulnerability in a high-risk flood-affected rural region of NSW, Australia. Nat. Hazards 2020, 101, 631–650. [Google Scholar] [CrossRef]
  56. Zhang, Y.-L.; You, W.-J. Social vulnerability to floods: A case study of Huaihe River Basin. Nat. Hazards 2013, 71, 2113–2125. [Google Scholar] [CrossRef]
  57. Oulahen, G.; Mortsch, L.; Tang, K.; Harford, D. Unequal Vulnerability to Flood Hazards: “Ground Truthing” a Social Vulnerability Index of Five Municipalities in Metro Vancouver, Canada. Ann. Assoc. Am. Geogr. 2015, 105, 473–495. [Google Scholar] [CrossRef]
  58. Speis, P.-D.; Andreadakis, E.; Diakakis, M.; Daidassi, E.; Sarigiannis, G. Psychosocial vulnerability and demographic characteristics in extreme flash floods: The case of Mandra 2017 flood in Greece. Int. J. Disaster Risk Reduct. 2019, 41, 101285. [Google Scholar] [CrossRef]
  59. Olaniyi, O.N.; Szulczyk, K.R. Estimating the economic impact of the white root rot disease on the Malaysian rubber plantations. For. Policy Econ. 2022, 138, 102707. [Google Scholar] [CrossRef]
  60. Cvetković, V.M.; Roder, G.; Öcal, A.; Tarolli, P.; Dragićević, S. The Role of Gender in Preparedness and Response Behaviors towards Flood Risk in Serbia. Int. J. Environ. Res. Public Health 2018, 15, 2761. [Google Scholar] [CrossRef] [PubMed]
  61. Otto, I.M.; Reckien, D.; Reyer, C.P.O.; Marcus, R.; Le Masson, V.; Jones, L.; Norton, A.; Serdeczny, O. Social vulnerability to climate change: A review of concepts and evidence. Reg. Environ. Chang. 2017, 17, 1651–1662. [Google Scholar] [CrossRef]
  62. Deguen, W.; Amuzu, S.; Simoncic, M.; Kihal-Talantikite, V. Exposome and Social Vulnerability: An Overview of the Literature Review. Int. J. Environ. Res. Public Health 2022, 19, 3534. [Google Scholar] [CrossRef]
  63. Ali, A.; Erenstein, O. Assessing farmer use of climate change adaptation practices and impacts on food security and poverty in Pakistan. Clim. Risk Manag. 2017, 16, 183–194. [Google Scholar] [CrossRef]
  64. Kumar, D.; Bhattacharjya, R.K. Study of Integrated Social Vulnerability Index SoVIint of Hilly Region of Uttarakhand, India. Environ. Clim. Technol. 2020, 24, 105–122. [Google Scholar] [CrossRef]
  65. Yu, Q.; Wang, Y.; Li, N. Extreme Flood Disasters: Comprehensive Impact and Assessment. Water 2022, 14, 1211. [Google Scholar] [CrossRef]
  66. de Andrade, M.M.N.; Szlafsztein, C.F. Vulnerability assessment including tangible and intangible components in the index composition: An Amazon case study of flooding and flash flooding. Sci. Total. Environ. 2018, 630, 903–912. [Google Scholar] [CrossRef] [PubMed]
  67. McElwee, P.; Nghiem, T.; Le, H.; Vu, H. Flood vulnerability among rural households in the Red River Delta of Vietnam: Implications for future climate change risk and adaptation. Nat. Hazards 2016, 86, 465–492. [Google Scholar] [CrossRef]
  68. Ehsan, S.; Begum, R.A.; Maulud, K.N.A. Household external vulnerability due to climate change in Selangor coast of Malaysia. Clim. Risk Manag. 2022, 35, 100408. [Google Scholar] [CrossRef]
  69. Hamidi, A.R.; Wang, J.; Guo, S.; Zeng, Z. Flood vulnerability assessment using MOVE framework: A case study of the northern part of district Peshawar, Pakistan. Nat. Hazards 2020, 101, 385–408. [Google Scholar] [CrossRef]
  70. Khan, T.A.; Alam, M.M.; Shahid, Z.; Su’Ud, M.M. Investigation of Flash Floods on Early Basis: A Factual Comprehensive Review. IEEE Access 2020, 8, 19364–19380. [Google Scholar] [CrossRef]
  71. Diana, M.I.N.; Muhamad, N.; Taha, M.R.; Osman, A.; Alam, M. Social Vulnerability Assessment for Landslide Hazards in Malaysia: A Systematic Review Study. Land 2021, 10, 315. [Google Scholar] [CrossRef]
  72. Cao, F.; Wang, H.; Zhang, C.; Kong, W. Social Vulnerability Evaluation of Natural Disasters and Its Spatiotemporal Evolution in Zhejiang Province, China. Sustainability 2023, 15, 6400. [Google Scholar] [CrossRef]
  73. Jones, S.; Barton, H.; Hunt, C.; Janowski, M.; Lloyd-Smith, L.; Barker, G. The cultural antiquity of rainforests: Human–plant associations during the mid-late Holocene in the interior highlands of Sarawak, Malaysian Borneo. Quat. Int. 2016, 416, 80–94. [Google Scholar] [CrossRef]
  74. Yang, B.; Jahan, I. Comprehensive Assessment for Post-Disaster Recovery Process in a Tourist Town. Sustainability 2018, 10, 1842. [Google Scholar] [CrossRef]
  75. Zhou, H.; Wang, X.; Wang, J. A Way to Sustainability: Perspective of Resilience and Adaptation to Disaster. Sustainability 2016, 8, 737. [Google Scholar] [CrossRef]
  76. Haque, C.E.; Zaman, J.R.; Walker, D. Risk-Reduction, Coping, and Adaptation to Flood Hazards in Manitoba, Canada: Evidence from Communities in the Red River Valley. Geosciences 2023, 13, 88. [Google Scholar] [CrossRef]
  77. Aznar-Crespo, P.; Aledo, A.; Melgarejo-Moreno, J.; Vallejos-Romero, A. Adapting Social Impact Assessment to Flood Risk Management. Sustainability 2021, 13, 3410. [Google Scholar] [CrossRef]
  78. Aerts, J.C.J.H. A Review of Cost Estimates for Flood Adaptation. Water 2018, 10, 1646. [Google Scholar] [CrossRef]
  79. Ashikin, A.N.; Diana, M.I.N.; Siwar, C.; Alam, M.; Yasar, M. Community Preparation and Vulnerability Indices for Floods in Pahang State of Malaysia. Land 2021, 10, 198. [Google Scholar] [CrossRef]
  80. Jonkman, S.N.; Dawson, R.J. Issues and Challenges in Flood Risk Management—Editorial for the Special Issue on Flood Risk Management. Water 2012, 4, 785–792. [Google Scholar] [CrossRef]
  81. Charalambous, K.; Bruggeman, A.; Giannakis, E.; Zoumides, C. Improving Public Participation Processes for the Floods Directive and Flood Awareness: Evidence from Cyprus. Water 2018, 10, 958. [Google Scholar] [CrossRef]
  82. Faruk, O.M.; Maharjan, K.L. Factors Affecting Farmers’ Adoption of Flood Adaptation Strategies Using Structural Equation Modeling. Water 2022, 14, 3080. [Google Scholar] [CrossRef]
  83. Samansiri, S.; Fernando, T.; Ingirige, B. Critical Failure Factors of Flood Early Warning and Response Systems (FEWRS): A Structured Literature Review and Interpretive Structural Modelling (ISM) Analysis. Geosciences 2023, 13, 137. [Google Scholar] [CrossRef]
  84. Torgersen, G.; Rød, J.K.; Kvaal, K.; Bjerkholt, J.T.; Lindholm, O.G. Evaluating Flood Exposure for Properties in Urban Areas Using a Multivariate Modelling Technique. Water 2017, 9, 318. [Google Scholar] [CrossRef]
  85. Singha, M.; Dong, J.; Sarmah, S.; You, N.; Zhou, Y.; Zhang, G.; Doughty, R.; Xiao, X. Identifying floods and flood-affected paddy rice fields in Bangladesh based on Sentinel-1 imagery and Google Earth Engine. ISPRS J. Photogramm. Remote. Sens. 2020, 166, 278–293. [Google Scholar] [CrossRef]
  86. Chelariu, O.-E.; Iațu, C.; Minea, I. A GIS-Based Model for Flood Shelter Locations and Pedestrian Evacuation Scenarios in a Rural Mountain Catchment in Romania. Water 2022, 14, 3074. [Google Scholar] [CrossRef]
  87. Kim, J.; Kwon, H. Calculation of a Climate Change Vulnerability Index for Nakdong Watersheds Considering Non-Point Pollution Sources. Appl. Sci. 2022, 12, 4775. [Google Scholar] [CrossRef]
  88. Pandey, R.; Kala, S.; Pandey, V.P. Assessing climate change vulnerability of water at household level. Mitig. Adapt. Strat. Glob. Chang. 2015, 20, 1471–1485. [Google Scholar] [CrossRef]
  89. Anees, M.T.; Bin Abu Bakar, A.F.; San, L.H.; Abdullah, K.; Nordin, M.N.M.; Ab Rahman, N.N.N.; Ishak, M.I.S.; Kadir, M.O.A. Flood Vulnerability, Risk, and Susceptibility Assessment. Decis. Support Methods Assess. Flood Risk Vulnerability 2019, 75, 1–27. [Google Scholar] [CrossRef]
  90. Nguyen, K.-A.; Liou, Y.-A.; Terry, J.P. Vulnerability of Vietnam to typhoons: A spatial assessment based on hazards, exposure and adaptive capacity. Sci. Total. Environ. 2019, 682, 31–46. [Google Scholar] [CrossRef] [PubMed]
  91. Dizdaroglu, D. The Role of Indicator-Based Sustainability Assessment in Policy and the Decision-Making Process: A Review and Outlook. Sustainability 2017, 9, 1018. [Google Scholar] [CrossRef]
  92. Hidayah, A.D.; Wiyono, E.; Wicaksono, R.U.A. Development of the flood vulnerability index using a multi-element approach. J. Water L. Dev. 2021, 50, 255–264. [Google Scholar] [CrossRef]
  93. Rana, I.A.; Routray, J.K. Integrated methodology for flood risk assessment and application in urban communities of Pakistan. Nat. Hazards 2017, 91, 239–266. [Google Scholar] [CrossRef]
  94. Thong, P.; Thangjam, U.; Sahoo, U.K.; Pebam, R. Socio-economic vulnerability assessment of shifting cultivators (Jhumias) amidst the changing climate in Mizoram, northeast India. Appl. Geogr. 2022, 147, 102790. [Google Scholar] [CrossRef]
  95. Aktar, A.; Shohani, K.; Hasan, N.; Hasan, K. Flood Vulnerability Assessment by Flood Vulnerability Index (FVI) Method: A Study on Sirajganj Sadar Upazila. Int. J. Disaster Risk Manag. 2021, 3, 1–13. [Google Scholar] [CrossRef]
  96. Fekete, A. Social vulnerability change assessment: Monitoring longitudinal demographic indicators of disaster risk in Germany from 2005 to 2015. Nat. Hazards 2018, 95, 585–614. [Google Scholar] [CrossRef]
  97. Coulibaly, J.Y.; Mbow, C.; Sileshi, G.W.; Beedy, T.; Kundhlande, G.; Musau, J. Mapping Vulnerability to Climate Change in Malawi: Spatial and Social Differentiation in the Shire River Basin. Am. J. Clim. Chang. 2015, 4, 282–294. [Google Scholar] [CrossRef]
  98. Laila, F. Assessment on Social Vulnerabilities to Climate Change—A Study on South-Western Coastal Region of Bangladesh. Master’s Thesis, Uppsala University, Uppsala, Sweden, 2013; p. 46. Available online: http://uu.diva-portal.org/smash/get/diva2:648362/FULLTEXT01.pdf (accessed on 25 March 2023).
  99. Downing, G.; Patwardhan, T.E.; Klien, A.; Mukhala, R.; Stephen, E.; Winograd, L.; Ziervogel, M. Vulnerability Assessment for Climate Adaptation. APF Tech. Paper 2002. Available online: https://www.researchgate.net/publication/248360294_Vulnerability_Assessment_for_Climate_Adaptation (accessed on 18 March 2023).
  100. Depietri, Y. The social–ecological dimension of vulnerability and risk to natural hazards. Sustain. Sci. 2019, 15, 587–604. [Google Scholar] [CrossRef]
  101. Mekonnen, Z.; Woldeamanuel, T.; Kassa, H. Socio-ecological vulnerability to climate change/variability in central rift valley, Ethiopia. Adv. Clim. Chang. Res. 2019, 10, 9–20. [Google Scholar] [CrossRef]
  102. Bukvic, A.; Rohat, A.; Apotsos, G.; de Sherbinin, A. A Systematic Review of Coastal Vulnerability Mapping. Sustainability 2020, 12, 2822. [Google Scholar] [CrossRef]
Figure 1. Flowchart of the PRISMA method procedure [49].
Sustainability 15 12729 g001
Figure 2. Analysis of literary works using the Preferred Reporting Items for Systematic Reviews and Meta-Analyses (PRISMA 2020) (modification method from [49]).
Sustainability 15 12729 g002
Figure 3. The drivers of flood social vulnerability (mentioned in more than 5 papers).
Sustainability 15 12729 g003
Table 1. Inclusion and exclusion criteria.
ParameterInclusionNon-Inclusion
Literature typeJournal (research articles) EnglishJournals (review articles), book chapters, and conference proceedings
LanguageEnglishNon-English
Timeline2010–2022<2010
Countries and territoriesASEAN, the Middle East, and European countriesNon-ASEAN, the Middle East, and European countries
Subject areaEnvironmental studies and sustainability, social studies, and agricultural scienceOther than environmental studies and sustainability, social studies, and agricultural science
Table 2. List of articles analyzed for systematic review.
AuthorCountryYearTitleObjective
[4]Indonesia2020Assessment of social vulnerability to floods on Java, IndonesiaTo determine the local government units with the highest vulnerability and analyze their spatial allocation through cluster analysis.
[50]United States2021Flood exposure and social vulnerability in the United States.To explore the geographic dimensions of social susceptibility to inland flood exposure in the contiguous United States (CONUS), employing the use of flood hazard maps.
[44]Taiwan2020A GIS-based approach for assessing social vulnerability to flood and debris flow hazards.To supply a collection of reliable indicators that may be utilized to examine social vulnerability as a means of enabling decision makers to develop a plan for mitigating environmental hazards.
[49]Netherland2019Assessing Social Vulnerability to Flood Hazards in the Dutch Province of Zeeland.To identify indicators of social vulnerability at the level of municipal districts in the Netherlands and construct a simple social vulnerability index.
[51]Philippines2015Assessing Social Vulnerability to Flooding in Metro Manila Using Principal Component Analysis.The researchers aim to identify the most important factors contributing to social vulnerability to flooding and create a social vulnerability index.
[52]Italy2017Assessment of Social Vulnerability to Floods in the Floodplain of Northern Italy.To apply the Social Vulnerability Index (SoVI) to the floodplain of Northern Italy, using census data to identify social differences and vulnerabilities in the area.
[53]Australia2021Geophysical and social vulnerability to floods at municipal scale under climate change: The case of an inner-city suburb of Sydney.To propose a novel approach and susceptibility index for flooding that integrates advanced hydrologic and hydraulic modeling with metrics relating to the built environment and socioeconomic factors.
[54]Canada2021Leveraging Hazard, Exposure, and Social Vulnerability Data to Assess Flood Risk to Indigenous Communities in CanadaTo evaluate and compare the level of flood risk faced by Indigenous communities residing on reserve lands as opposed to other communities in Canada.
[55]Australia2020Social vulnerability in a high-risk flood-affected rural region of NSW, AustraliaTo illustrate the societal vulnerability of communities impacted by substantial river inundation in the northern area of New South Wales, Australia.
[56]China2014Social vulnerability to floods: a case study of Huaihe River BasinTo study the social vulnerability to floods in the Huaihe River Basin and develop measures for disaster prevention or emergency response for disaster relief.
[57]Canada2015Unequal Vulnerability to Flood Hazards: “Ground Truthing” a Social Vulnerability Index of Five Municipalities in Metro Vancouver, CanadaIllustrating the validation process of a social vulnerability index with professionals operating in five municipalities within the Metro Vancouver region.
Source: Author analysis, 2022.
Table 3. List of variables/indicators used as social vulnerability indices.
IndicatorsVariablesReference
Age groupThe calculation of the percentage or proportion of individuals falling within the age ranges of 0–15 (children), 15–24 (teenagers), 25–64 (adults), and 65 years and above (elderly).[4,44,49,50,51,52,53,54,55,57]
GenderThe proportion of males to females in a population.[4,44,49,50,51,52,54,55,57]
Property ownershipPercentage of housing units (owned, renter), housing type.[4,50,52,53,54,57]
Physical infrastructure Condition of housing, the degree of overcrowding, and the availability of fundamental amenities, such as water supply, sanitation facilities, and access to electricity.[4]
Economic statusMeasurement of the median household income, the percentage of households residing below the poverty line, and income inequality metrics, such as the Gini coefficient.[44,49,50,51,52,55,56,57]
Household compositionAverage household size, percentage of single-parent households, or percentage of households with elderly or disabled individuals.[50,51]
Academic backgroudThe proportion of individuals with different levels of education, literacy rates, or school enrolment rates.[4,44,49,50,51,52,53,54,55,56,57]
Employment statusThe percentage of the population of working age, job security, and informal as well as underemployment rate.[4,49,50,52,57]
Profession The level of accessibility to higher-paying or more secure occupations and the identification of potential vulnerabilities in terms of employment opportunities and income.[4,49]
Urbanization levelThe density of the population is a potential variable that can be considered appropriate for measuring the level of urbanization in social vulnerability.[4,44,49,57]
Disability The collected data on the number or percentage of individuals who possess physical, sensory, cognitive, or mental impairments that may restrict their daily activities or societal participation.[44,49,51,54]
MigrationForeign population, absentee population.[44,54]
HealthMedical services, health problems, and distance from a hospital.[4,49,51,54]
PopulationPopulation growth rate (subtract the previous population from the current population, then divide the result by the previous population).[49,51,52]
Sources: Adopted from [71].
Disclaimer/Publisher’s Note: The statements, opinions and data contained in all publications are solely those of the individual author(s) and contributor(s) and not of MDPI and/or the editor(s). MDPI and/or the editor(s) disclaim responsibility for any injury to people or property resulting from any ideas, methods, instructions or products referred to in the content.

