Article

Analyst Coverage and Corporate ESG Performance

School of Management, Xiamen University, Xiamen 361005, China
*
Author to whom correspondence should be addressed.
Sustainability 2023, 15(17), 12763; https://doi.org/10.3390/su151712763
Submission received: 30 June 2023 / Revised: 3 August 2023 / Accepted: 18 August 2023 / Published: 23 August 2023

Abstract

:
In recent years, environmental, social, and governance factors (ESG) have played an increasingly significant role in the practice of corporate development of widespread concern. For corporate ESG, it is still necessary to consider the factors that influence the development of corporate ESG. This paper performed fixed-effect panel model analysis to investigate the relationship between analyst coverage and corporate ESG performance using data from China’s listed firms from 2011 to 2021. Our results showed that analyst coverage improves corporate ESG performance, especially the environmental (E) and social (S) dimensions, proving that analyst coverage is an important driving force behind corporate ESG engagement. The results were shown to be valid through a series of endogeneity and robustness checks. In the heterogeneity analysis, we showed that the promotion effects are more significant for state-owned firms and firms faced with greater financial constraints and higher information asymmetry. Furthermore, analyst coverage improves corporate ESG performance through the potential channels of attracting media attention and conducting site visits. Our study enriches the existing literature on the determinants of corporate ESG performance, and highlights the role analysts play in shaping corporate non-financial behavior and promoting corporate sustainable development.

1. Introduction

Temperature change and environmental issues have become important issues affecting global economic and social development, and they have attracted widespread attention. To address this issue, the Chinese government made active commitments at the UN General Assembly to achieve a carbon peak by the year 2030 and carbon neutrality by the year 2060. With enterprise as the micro foundation for the development of a green economy, Chinese regulators require companies to incorporate environmental protection into their corporate governance systems. As a response to the dual carbon goal and promoting corporate sustainable development, the number of Chinese firms that release ESG reports has increased rapidly [1]. The rapid development of ESG in practice has aroused increased discussion; existing studies have discussed how to promote the development of enterprise ESG from the institutional and firm level [2,3,4,5], but little attention has been paid to whether analysts can impact corporate ESG performance, thus ignoring the possible influence of analysts, who are important participants in capital markets. In this paper, we focused on whether analysts are a crucial external governance mechanism that can influence corporate ESG performance.
There are incentives for analysts to consider corporate ESG performance [6]. The demand for ESG information from stakeholders, especially investors, drives analysts to focus on corporate ESG performance. In recent years, investors have realized that “climate risk is investment risk”, and the development of a low-carbon economy will make some assets depreciate rapidly or even become liabilities [7]. This has pushed investors to shift to a sustainable development investment strategy. Therefore, more and more investors are taking corporate ESG performance into consideration when making investment decisions, which leads to exponentially increasing demand for corporate ESG information. Investors’ demand for firms’ ESG information has forced analysts to shift more attention to understanding corporate ESG performance. Corporate ESG information not only provides non-financial information, but also contains a useful supplement to the firm’s financial information, which helps analysts to better understand a company’s fundamentals, form more accurate estimates of a company’s value, and improves the analyst’s forecast quality [8,9,10]. Analysts also have the ability to influence corporate ESG performance. Analysts can alleviate the information asymmetry between the capital market and corporate management. By releasing their interpretation of the enterprise ESG report, analysts increase external investors’ understandings of the real situation of corporate ESG. Analysts are a significant external corporate governance force, who can effectively detect corporate misconduct and discipline management behaviors by playing a moderating role. For example, analyst coverage reduces firms’ pollution and improves their corporate ESG performance.
To date, there has been no serious investigation into the impact of analyst coverage on corporate ESG performance. To bridge this knowledge gap, in this paper, we focused on the role of the analyst in influencing corporate sustainable development, in particular, corporate environmental, social, and governance (ESG) performance. Using data from Chinese A-share listed firms from 2011 to 2021, we investigated the relationship between analyst coverage and corporate ESG performance. Our results showed that analyst coverage improves corporate ESG performance, especially the environment (E) and social (S) dimensions, proving that analyst coverage is an important driving force promoting corporate ESG engagement. The promotion effects of analyst coverage on corporate ESG are more significant for state-owned firms and firms facing greater financial constraints and high information asymmetry. Attracting media attention and participating in site visits are the two potential channels through which analyst coverage improves corporate ESG performance. The results remained valid after a series of endogeneity and robustness checks, including the instrumental variable, Heckman two-stages method, entropy balance matching, alternative variable measures, and change samples.
Our research contributes to the literature in the following ways: first, our study enriches the research on corporate ESG performance driving factors. Regarding the determinants of firm ESG performance factors, prior studies were predominantly conducted at the country-level and firm-level, based on institutional and legitimacy theories [11,12], such as policy regulation [2], investors [5,13], board structure [1], and managerial characteristics [4,14,15]. The influence of the analyst, an important participant in capital markets, has been largely ignored. In this study, we focused on analyst coverage as an external driving factor affecting corporate ESG performance. Furthermore, in contrast to developed countries with formal regulations and mature market environments, the ESG development of Chinese enterprises is still in its infancy. It is of significance to explore the impact factors of corporate ESG in China using Chinese A-share listed firm data. Our research provides evidence from emerging markets for ESG-related research.
Most of the prior studies of analyst coverage have focused on examining the influence on a firm’s capital markets and the economic consequences [16,17]. This may ignore the impact of analyst attention on corporate non-financial information. With the widespread development of ESG around the world, and the demand from investors for corporate ESG information, analysts are increasingly required to provide the actual conditions of corporate ESG. Analysts are also paying more attention to a firm’s non-financial information; our research provides evidence that analysts have an influence on corporate non-financial performance from the perspective of firm ESG performance.
The influence of analysts on corporate decisions is controversial. By focusing on the information role and monitoring role of the analyst, we offer an analytical framework that explains the complex relationship between analyst coverage and corporate ESG performance. Because of the imperfect formal system, Chinese listed firms are often plagued by serious agency problems [18]. Our results prove that analysts discipline management behavior through improving information transparency, by playing an information provision role, and increasing the likelihood of violations being detected through a monitoring role. Our study confirmed that analyst coverage is an important external monitoring mechanism, and may make a marginal contribution to agency theory.
Lastly, we have added to the literature on analyst coverage and firms’ sustainable development. Existing studies have reported that analyst coverage increases corporate philanthropy [19], improves workplace safety and increases employee welfare via a supervisory role [20], and shapes corporate environment policies by increasing the cost of a firm’s environmental misbehaviors [21]. These studies proved that analyst coverage is a driving force in promoting corporate sustainable development, but they focused on analyst coverage within a specific dimension of ESG; there remains a lack of direct tests of how analyst coverage affects firm sustainability development under the overall framework of corporate ESG. Regarding analyst influence on firm sustainability development, we explored the impact of analyst coverage on corporate ESG performance and bridged the knowledge gap in this relationship. Our research provides strong evidence within the broader literature by providing theoretical insights into the underlying mechanisms by which analyst coverage may affect corporate sustainability.
The remainder of this paper is structured as follows. Section 2 presents the literature review on corporate ESG and hypothesis development; Section 3 describes the research design, including the sample and data, regression models, variables, etc.; Section 4 presents the empirical testing results and robustness analysis; Section 5 presents suggestions for further research, including heterogeneity tests, potential channels, and impacts on firm value. Section 6 gives the conclusions and implications.

2. Literature Review and Hypothesis Development

2.1. Literature Review on Corporate ESG

The existing studies have explored a variety of determinants that may affect enterprise ESG performance. Wang, Le, Peng, Zeng, and Kong [2] provided evidence on the institutional level that central environmental protection inspection has an improvement effects on corporate ESG performance. Baldini, Dal Maso, Liberatore, Mazzi, and Terzani [11] pointed out that social structures and social legitimization significantly affect firms’ ESG practices. As one of the firms’ significant stakeholders, institutional ownership reduces facility toxic releases [5] by way of site visits [22], improving corporate environmental performance. Corporate and management characteristics also have an influence on ESG performance. For instance, board gender diversity affects firms’ ESG strategies; when there are at least three female directors on the board, especially among the executive directors, improved ESG performance has been noted [4]. McBrayer [14] concluded that, as management tenure increases, ESG disclosure quality increases. Kind, Zeppenfeld, and Lueg [15] provided evidence from ESG decision-making; their research found CEOs with narcissistic traits showed a U-shaped relationship with overall ESG which was significantly negatively correlated with environmental performance and social performance, shaping a good corporate image.

2.2. Analyst Coverage and Corporate ESG Performance

Analyst coverage exerts an information effect to improve corporate ESG performance. As recognized industry experts, analysts have more experience and expertise than ordinary investors and, through the collection, processing, and dissemination of firm information, analyst coverage reduces the information asymmetry between management and investors and alleviates the agency problem caused by the separation of ownership and operation, enhancing corporate ESG performance. Analysts obtain the actual firm ESG information through public or private contact with management, and may also participate in site visits. Cheng et al. [23] pointed out that, in a market environment with weak institutions and regulations, site visits are an important way to obtain corporate ESG information. In a typical site visit, the analyst can directly observe the firm’s actual operation by going into the factory, helping the analyst to collect the firm’s ESG information, including information on employee morale and other subtle information that is difficult to obtain from financial reports [24]. Furthermore, analysts can draw investors’ limited attention to corporate ESG performance by delivering high-quality research reports to the market. Moreover, analyst coverage attracts media attention. Research reports produced by analysts improve media reporting and expand the dissemination scope of the firm’s ESG information, increasing public perception and the discussion of firms’ ESG. Participation in ESG is not cost-free, and ESG activities require significant resources. Analyst coverage results in improvements in information transparency, and can reduce capital market friction and increase enterprises’ access to external financing opportunities, as well as attracting ESG-oriented investors to make more ESG investments. The alleviation of corporate financing constraints promotes firms to make more investments in pollution abatement activities, and increases firms’ compliance with environmental laws [25].
Analyst coverage plays a monitoring role to reduce agency problems, improving corporate ESG performance. In a weak legal and regulatory environment of emerging markets like China, the cost of non-compliance is low, which gives firms plenty of leeway to exaggerate their ESG performance or to hide negative outcomes to manipulate ESG information. Firms with greater analyst coverage are more closely monitored by security analysts and investors, and are generally less likely to engage in opportunistic behavior [26]. Previous research has documented the monitoring role of analysts in detecting corporate misconduct and disciplining management behaviors. For example, Dyck et al. [27] found that analysts play a bigger role in detecting corporate fraud than the SEC and auditors. Chen et al. [28] documented that analyst coverage reduces excess compensation for CEOs. It has been found that firms covered by more analysts engage in less earnings management [29,30]. Analysts also pay close attention to corporate non-financial information [31]; Jing, Keasey, Lim, and Xu [21] found that analysts play a monitoring role in influencing corporate environmental policy. Bradley, Mao, and Zhang [20] provided evidence that analyst coverage increases the emphasis on workplace safety issues and improves employee welfare. Firms with a large amount of analyst coverage may show improved corporate ESG performance and reduced opportunistic behavior because of increased monitoring.
Accordingly, we proposed the following hypothesis:
Hypothesis H. 
Analyst coverage has a positive effect on corporate ESG performance.
Based on the above, we designed the conceptual research model in Figure 1.

3. Data and Model Design

3.1. Data Source

We used firms listed on the Shanghai and Shenzhen stock exchange A-share markets from 2011 to 2021 as the research objects of our study. The sample period began in 2011 because the Bloomberg ESG rating data of firms were mainly available from this year. In the years before this, there was less corporate ESG disclosure. Bloomberg’s ESG rating data were chosen because, in previous research, it has been widely used as a measurement for firms’ ESG performance. Analyst coverage and corporate financial data were from the Chinese CSMAR database, and analyst site visit data were from the Wind database. To ensure the validity of the data, we (1) excluded financial firms with particularity in the financial industry and differences in accounting treatment methods; (2) excluded observations missing important variables; and (3) dropped firms that had received special treatment (ST) because of their abnormal financial status. After processing, we obtained a total of 1399 Chinese listed firms with 10,289 firm-year observations. Table 1 displays the sample industrial distribution from 2011 to 2021. In addition, we reduced the bias caused by extreme outliers via all continuous variables being winsorized up or down by 1%. Table 1 shows the sample industrial distribution of our study. A total of 3494 firm-year observations from the papermaking and printing industry, at 33%, were included.

3.2. Research Model

We constructed the following two-way fixed effects model, Equation (1), to examine how analyst coverage has an effect on firms’ ESG:
E S G i , t = β 0 + β 1 c o v i , t + β 2 C o n t r o l s i , t + F i r m + Y e a r + ε i , t  
where ESG represents the firm ESG performance, Cov represents the indicator of analyst coverage, Cov1 or Cov2, and Controls is a vector including all control variables. Additionally, we added the firm fixed effect (Firm) and year fixed effect (Year) to the model to eliminate the influence of individual and time trends. The indices i and t correspond to firm and year, respectively.

3.3. Variables

3.3.1. Dependent Variables

Referring to McBrayer [14], we used the ESG rating score from Bloomberg as a proxy variable to measure firms’ ESG performance. Bloomberg’s ESG score ranges from 0.1 to 100 based on firm engagement with ESG activities; the higher the score, the better the ESG performance of the firm. We also used the ESG rating from the Sino-Securities Index Information Service, which is widely recognized and used in research as a proxy variable for corporate ESG performance.

3.3.2. Independent Variables

Following Ali and Hirshleifer [32], we defined analyst concern as if the analyst had issued at least one earnings forecast for the company over the past 12 months. Cov1 was the total number of firms covered by all analysts. In addition, we used the sum number of forecast reports (Cov2) as an alternative measurement for robustness.

3.3.3. Control Variables

Referring to existing research [33,34], the following variables that may affect firms’ ESG performance were considered as control variables: size (Size), leverage (Lev), growth (Growth), institutional ownership (Inst), corporate ownership type (State), firm age (Age), profitability (Roa), CEO duality (Dual), ownership concentration (Big1), and board independence (Indep). We also controlled firm-fixed effects and year-fixed effects to exclude the influence of firm-level characteristics and time trends. In Table 2, the detailed variable definitions are presented.

4. Results

4.1. Descriptive Statistics

The descriptive statistics of the main variables are presented in Table 3. The mean (median) value of ESG was 28.681 (27.643), and the minimum and maximum were 6.189 and 68.971, with a standard deviation of 8.873. From the perspective of the sample distribution, the results showed a widening gap between the ESG performance of Chinese listed firms in our sample. Our ESG scores were slightly below those of Baldini, Dal Maso, Liberatore, Mazzi, and Terzani [11], who also used ESG scores from the Bloomberg ESG database, where the mean of ESG scores was 31.833. This was probably because they used multi-country data. Since the ESG scores are based on a scale of 0–100, our sample did not provide the same high-performance level of ESG scores as Al Amosh, Khatib, and Ananzeh [33]. The mean values of the three pillars were 12.580, 9.291, and 64.712, respectively. Among the three ESG pillars, the score for corporate governance was much higher than that of the environmental and social dimensions, indicating that the corporate governance performance of Chinese listed firms is relatively mature, and the development of each ESG pillar has been uneven. The mean (median) values of Cov1 and Cov2 were 11.616 (7) and 25.558 (13), and the standard deviations were 12.331 and 31.150, respectively, similar to those reported by Zhang [35], suggesting that the listed firms received analyst coverage to varying degrees. The values of other control variables were similar to those in previous studies and within reasonable ranges.

4.2. Correlation Analysis

Table 4 presents the Pearson correlations of the main variables employed in our study.
As shown in Table 4, analyst coverage (Cov1 and Cov2) was significantly positively correlated with corporate ESG performance at the 1% level. This suggests that analyst coverage improves corporate ESG performance, providing preliminary proof of hypothesis H. We calculated the variance inflation factor (VIF) to reduce the influence of the collinearity of variables. According to our analysis, the maximum VIF among all variables in our study was 1.93, and the mean VIF was 1.79. These values were below the empirical threshold value of 10, indicating that our study was not affected by serious multicollinearity issues.

4.3. Main Regression Results

Table 5 presents the results of the relationship between analyst coverage and corporate ESG performance. The coefficients of Cov1 and Cov2 in column (1) and column (5) of Table 5 were 0.052 and 0.018, respectively; both were significantly positive at the 1% level, which implies that corporate ESG performance improves with increases in analyst coverage, supporting hypothesis H. The results were consistent with the finding that analysts are an important external governance force and can influence corporate decision-making [19,29]. Analysts play an information role to reduce information asymmetry and play a monitoring role to alleviate agency cost, which may explain this positive impact. Furthermore, we tested the impact of analyst coverage on each component of corporate ESG. The results are shown in columns (2)–(4) of Table 5. The coefficients of analyst coverage for the environment dimension and social dimension were 0.051 and 0.111, respectively; both were significantly positive at the 1% level, which indicates that analyst coverage significantly improves corporate environmental and social performance. This can be ascribed to firms increasing their environmental friendliness and social welfare operations in response to analyst coverage. However, the coefficient for governance was not significant, suggesting that analyst coverage has no significant improvement effect on the corporate governance dimension. A possible reason for this may be that, under the ESG framework, the score for the corporate governance dimension is much higher than that of the environmental dimension and social dimension, and the corporate governance level of most Chinese listed firms is better than the corporate social and environmental performance, so the analyst promotion effect is not obvious. Previous studies have shown that analyst coverage enhances socially responsible donations [36], reduces employee injuries [20], and shapes corporate environmental policies [21]. Our results were consistent with the findings that analysts pay attention to corporate non-financial information, and analyst coverage improves corporate non-financial performance. We found similar results using Cov2 as the explanatory variable in columns (5)–(8).

4.4. Robustness Tests

4.4.1. IV 2sls

Analysts take the initiative to follow firms with good ESG performance for more accurate predictions or recommendations. There are unobservable factors that affect both coverage and firms’ ESG performance, which will trigger endogeneity problems. To alleviate the endogeneity concern between analyst coverage and firms’ ESG performance, referring to Zhang [35], we employed the mean of analyst coverage of the firms in the same industry, but excluded the firm itself as an instrumental variable (Ind_Cov). Industry-level analyst coverage can directly impact corporate analyst coverage but cannot directly affect the firm’s ESG performance. In column (1) and column (3) of Table 6, the coefficients of Ind_Cov were significantly positive, suggesting that industry-level analyst coverage can increase the corporate analyst coverage level. In column (2) and column (4) of Table 6, the coefficients for ESG were still significantly positive. The Cragg–Donald Wald F statistics of the two instrumental variables were 123.2 and 94.01, respectively, both of which were above 10, which indicates the instrumental variable was not a weak one.

4.4.2. Entropy Balance Matching Method

To reduce the differences between groups caused by whether there was analyst coverage or not, we used the entropy balance matching method. According to Hainmueller [37], with fewer limiting assumptions and a higher degree of covariate balance, the entropy balance test was more advantageous in the matching process treatment group and the control group. In the process of entropy balance matching, we treated the control combination processing group according to the control variable characteristics. Specifically, we ran a logistic model that weighted all observations of all of the control variables included in our baseline analysis, then used the matching results for regression. The results are shown in Table 6 column (5) and column (6); the coefficients of Treat1 and Treat2 were 0.459 and 0.574, respectively, and significant at the 1% level. After the above processing, our main results remained robust, further validating the outcomes.

4.5. Change Variable Measurement and Sample Selection

4.5.1. Alternative Measurement of the Independent Variables

Referring to He and Tian [33], we recalculated analyst Cov1 using the natural logarithm (one plus) of the annual analyst coverage number, and Cov2 using the natural logarithm (one plus) of the annual analyst reports number to carry out the regression again. The results are given in Table 7 column (1) and column (2) and were not changed, suggesting robustness.

4.5.2. Alternative Measurement of the Dependent Variable

We adopted the ESG rating data from the Sino-Securities Index Information Service, which is also widely recognized and used in research to replace the dependent measurement used in the main regression. The results are shown in Table 7 column (3) and column (4); the coefficients of analyst coverage on corporate ESG performance were still significantly positive. Therefore, the benchmark results were still robust under different evaluation systems.

4.5.3. Lag All Explanatory Variables

To reduce the endogenous problems caused by reverse causation, we lagged the independent and all control variables one period to perform a new regression. The results are shown in column (5) and column (6) of Table 7. The coefficients of Cov1 and Cov2 were still significantly positive at the 1% level; therefore, our conclusion remained robust.

4.5.4. Drop Sample without Analyst Coverage

To eliminate the interference of the sample with no analyst coverage, we dropped the observations without analyst coverage. The results are shown in Table 7 column (7) and column (8); the coefficients of Cov1 and Cov2 were still significantly positive at the 1% level, and our results were not changed.

5. Further Research

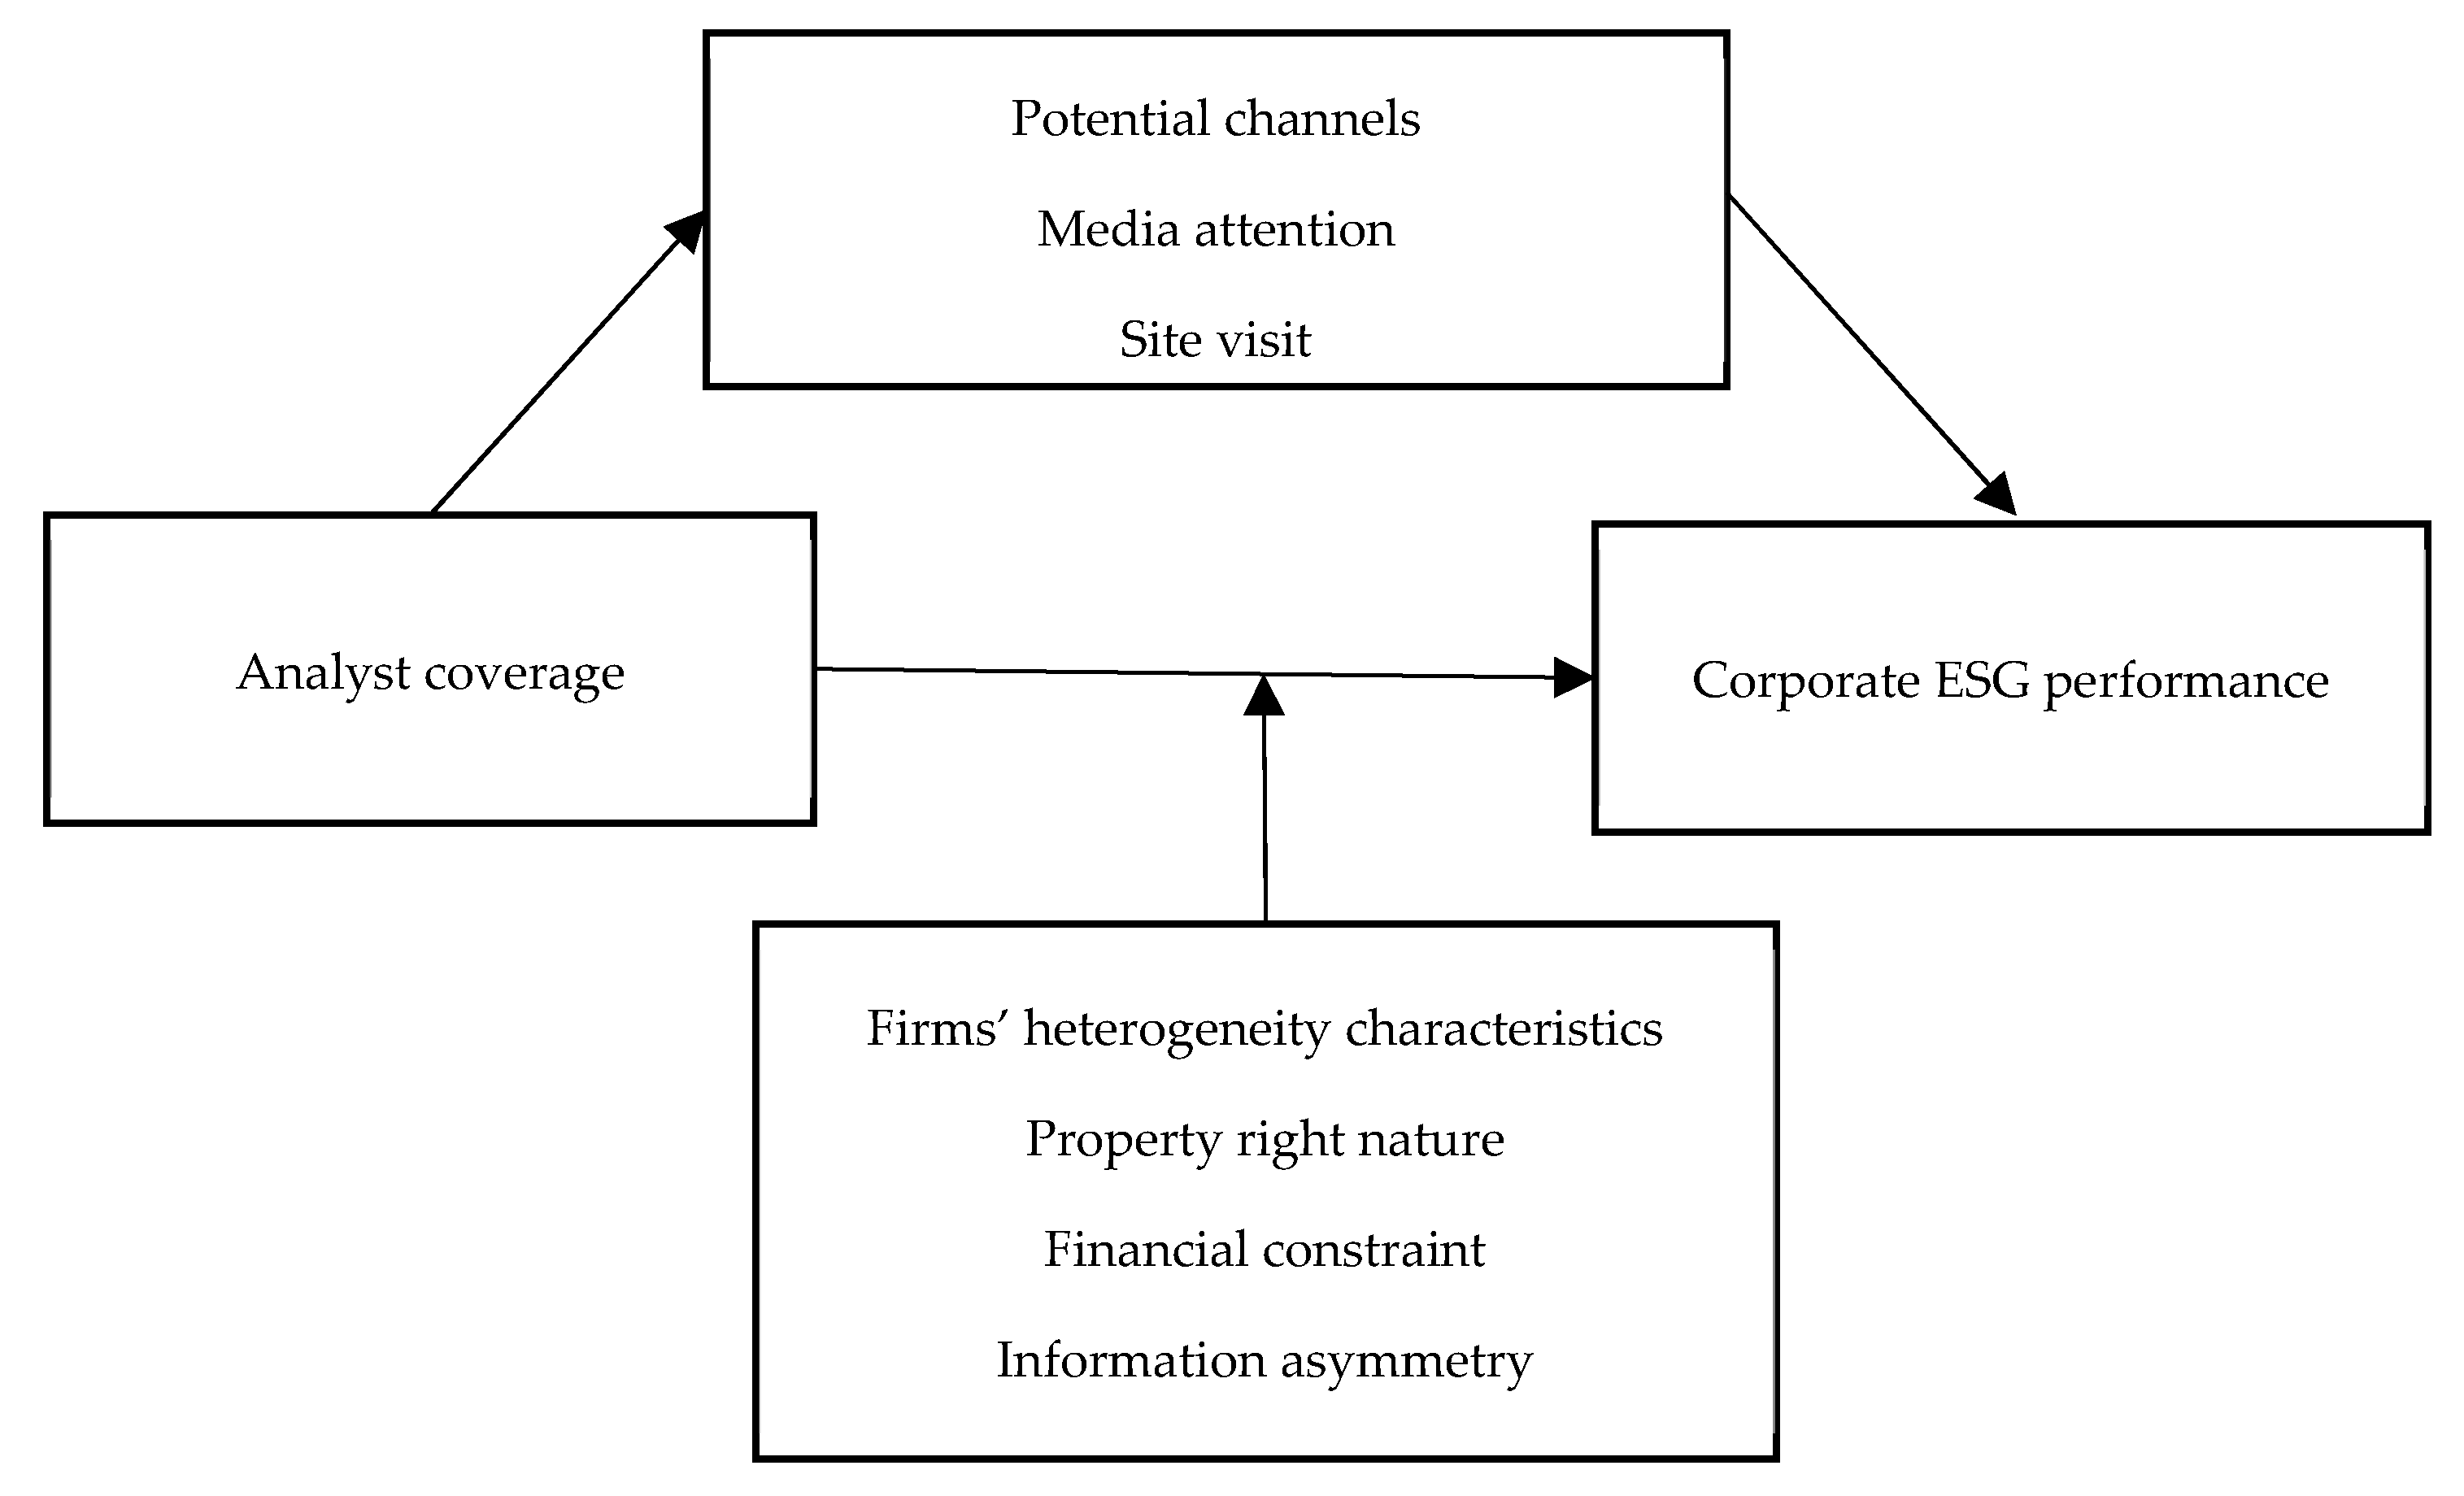
5.1. Test Based on the Firms’ Heterogeneity Characteristics

5.1.1. Test Based on the Firms’ Property Rights

The different nature of property rights leads to differences between state-owned firms and non-state-owned firms in resource endowment and management objectives [38]. In China, state-owned enterprises are burdened with multiple operation objectives. For example, priority is given to ensuring employment and social responsibility. In terms of resource endowment, compared with non-state-owned enterprises, which are faced with difficult and expensive financing, state-owned enterprises have advantages in credit and can obtain low-cost and large-scale loans. Sufficient resources provide strong support for state-owned enterprises to implement ESG. Regarding operation objectives, state-owned firms should support the implementation of national policies and take the lead in fulfilling social responsibilities, so they tend to be more concerned about environmental and social benefits in the production and operation process. Unlike state-owned firms, non-state-owned enterprises are mainly market-oriented, with making profit as their main goal, and their operations are more independent and flexible. In general, the differences in the property right nature between state-owned firms and non-state-owned firms lead to differences in the implementation of ESG. Therefore, the impact of analyst coverage on corporate ESG performance depends on the property rights of firms, wherein non-state-owned firms are more concerned about market reactions [19], and are more susceptible to market forces. Therefore, we expected that the impact of analyst coverage on corporate ESG performance would be more significant in non-state-owned firms.
To verify this argument, we used the state as a proxy variable for firms’ property rights: the value of the state equaled 1 if the firm was state-owned, otherwise it was 0. The coefficient of the interaction terms State*Cov1 and State*Cov2 in columns (1) to (3) in Table 8 were all negative at the 1% significant level. The results indicated that the impact of analyst coverage on corporate ESG performance is more pronounced in state-owned firms, which was in line with expectations.

5.1.2. Test Based on Firms’ Financial Constraints

Engaging in ESG activities is not free of cost, and demands resources [39] such as improving workplace safety and purchasing energy-saving and emission reduction equipment. Therefore, financial constraints restrict the ability of firms to participate in ESG activities. When firms face financial constraints, they may cut investments that yield low returns in the short term, and managers may lack incentives to invest in costly abatement technologies. Less investment in emission reduction leads to an increase in pollutants [40]. Xu and Kim [41] suggested that firms that are financially constrained emit more toxic pollution due to reductions in abatement investments. However, the alleviation of corporate financial constraints promotes investment in pollution abatement activities and increases firms’ compliance with environmental laws [25]. Previous studies have affirmed analysts’ effectiveness in reducing corporate debt and equity costs [42,43], which facilitates external financing opportunities. For example, Hallman et al. [44] documented that analyst coverage increases the syndicated credit supply and reduces loan costs. If analyst coverage facilitates external financing opportunities for firms, we would expect the effect on promoting firms’ ESG performance to be particularly strong for firms faced with more serious financial constraints.
To examine whether analyst coverage improves corporate ESG performance by alleviating financial constraints, following Hadlock and Pierce [45], we used the SA index as a proxy variable for financial constraints. The larger the value of the SA index, the higher the level of financial constraint the firm faced. The coefficients of the interaction terms SA*Cov1 and SA*Cov2 in columns (3) to (4) of Table 8 were 0.057 and 0.022, respectively, and they were all positive at the 1% significant level. The results indicated that analyst coverage improves corporate ESG performance by alleviating corporate financial constraints, in line with our expectations.

5.1.3. Test Based on Firms’ Information Asymmetry

With a high degree of information asymmetry, it is difficult for investors to obtain real information representing corporate ESG. As an important information intermediary in the capital market, previous studies have proven that analyst coverage produces high-quality information [46] and plays the role of reducing information asymmetry between insiders and outsiders [47,48]. By providing independent and valuable information about firms’ ESG-related events through research reports, analysts can inform investors who are concerned about corporate ESG performance beyond information delivered by the firms, which helps to reduce information asymmetry between insiders and outsiders. Therefore, we argued that the improvement effect of analyst coverage on corporate ESG performance would be more pronounced among firms with low information transparency.
To answer this question, following Hutton et al. [49] and Dechow et al. [50], we used Opaque as a proxy variable for measuring firms’ information asymmetry level. Its calculation was based on the absolute value of the abnormal accrual of firms over the past three years. The larger the value of the variable, the higher the firm’s financial information opacity. Columns (5) and (6) of Table 8 report the results; the coefficients of the interaction terms Opaque*Cov1 and Opaque*Cov2 were 0.021 and 0.008, respectively, both of which were significantly positive at the 5% level. The results indicated that, by playing an information role, analyst coverage reduces firms’ information asymmetry and improves corporate ESG performance.

5.2. Potential Channels

5.2.1. Potential Channel—Media Attention

Analyst coverage may improve corporate ESG performance through the channel of attracting media attention. As another important information intermediary in the capital market, the main role of the media is to disseminate corporate information [51] and increase the public’s attention to firm events. Analyst coverage attracts media attention; when there is a lack of professional knowledge of the report’s content, the media will turn to industry experts, including analysts, by referring to reports released by analysts, to increase the credibility and authority of the reporting. In other words, analysts are an important information source for the media. Therefore, an increase in analyst coverage may attract more media attention to firms. Media is also an important indicator by which to measure the public perception of firms’ ESG performance [52], because the public discuss corporate ESG practices on social media [53]. Burke [54] provided evidence that media is a powerful third-party, disseminating a firm’s ESG practice information to reflect the public’s concern. Media reports, especially negative reports, put pressure on companies through attracting public and regulatory attention. For example, Jia et al. [55] and Tang and Tang [56] found that negative news coverage reduces the likelihood of corporate pollution. Lyon and Montgomery [57] also suggested that media attention reduces the probability of greenwashing by increasing the public availability of information about corporate ESG performance and the risk of scrutiny that companies face. In addition, the media is used by investors as a tool for monitoring management; a negative atmosphere created by the media will damage the management’s reputation and affect the CEO’s job security and executive compensation [58]. Firms that have experienced negative ESG media reports have subsequently seen CEO dismissals [54]. However, positive media reports about corporate ESG performance can improve firms’ reputations and establish a good public image. Therefore, we predicted that media attention would be one channel by which analyst coverage improves corporate ESG performance.
To test whether media attention has a mediator effect between analyst coverage and corporate ESG performance, we used the natural logarithm of the total number of corporate news items that appeared in the financial media of the firm plus one as the measurement of media attention. The data were from the Chinese Research Data Services Platform (CNRDS) database, which is a widely used database for measuring media attention. In Column (1) of Table 9, the coefficient of Co1 on media was 0.010, significant at the 1% level, suggesting that media attention towards firms increases as analyst coverage rises, which indicates that analyst coverage attracts more media attention. In Column (2) of Table 9, the coefficient of Cov1 and media were both significantly positive, suggesting that analyst coverage boosts ESG performance by increasing media attention. We found similar results when we replaced Cov1 with Cov2. Furthermore, a bootstrap method was used to test the effectiveness of the mediation mechanism, and a 95% confidence interval did not contain 0 in 500 repeats, proving the mediation model’s effectiveness.

5.2.2. Potential Channel—Site Visit

Analyst coverage may improve corporate ESG performance through the channel of participating in site visits. In a market environment with weak institutions and regulations, analysts, through particular activities like site visits, can obtain corporate information and exert influence [59]. In a typical site visit, an analyst not only increases their understanding of the firm’s strategic direction by talking to management, but observes the firm’s actual operation by going into the factory. This allows the analyst to collect both hard information [60] and valuable soft information, such as employee morale, that is difficult to obtain from financial reports [24]. Chen et al. [61] showed the importance of soft information in the generation of unique analyst information. Cheng, Du, Wang and Wang [23] provided evidence that the forecast accuracy of analysts who participated in site visits was increased, consistent with the notion that site visits facilitate information acquisition. Furthermore, site visits provide incremental information about firms that may be reflected in a firm’s stock price, suggesting that the market reaction around corporate site visits is stronger [59]. In addition, analysts interpret and disseminate the firm’s first-hand information after the site visit through research reports [62], which effectively increase the external scrutiny of the firm. Site visits serve as an effective mechanism for analysts to monitor firms’ behaviors; existing research found that site visits affect corporate governance by enhancing corporate innovation [63], reducing corporate fraud [18], decreasing corporate tax avoidance [64], and reducing earnings management [24]. Regarding corporate ESG performance, as an industry expert, analysts can exchange views with management on energy conservation, emission reduction, green investments, and employee ethics during the site visit, which is conducive to improving corporate ESG performance. In addition, a site visit is a convenient way for analysts to understand the true ESG situation and monitor management behaviors. Thus, we hypothesized that the site visit is one of the possible channels through which analyst coverage improves corporate ESG performance.
To test the mediator effect of site visits between analyst coverage and corporate ESG performance, following Cheng, Du, Wang, and Wang [23] and Gao, Quan, and Xu [24], we used the natural logarithm of one plus the number of analyst site visits per year to measure the impact of analyst site visits. Column (5) of Table 9 presents the test results. The coefficient of Co1 on the visit was 0.012, significant at the 1% level, indicating that there was a significant positive correlation between analyst coverage and site visits. The number of site visits increased with increased analyst coverage. In column (6) of Table 9, the coefficients of Co1 and Visit for ESG were 0.050 and 0.018, respectively, both of which were significant at the 1% level. The results indicated that analyst coverage increases ESG performance through site visits that obtain detailed information of a firm’s ESG. Furthermore, a bootstrap method was used to test the effectiveness of the mediation mechanism, and the 95% confidence interval did not contain 0 in 500 repeats, proving the mediation model’s effectiveness.

6. Conclusions and Implications

6.1. Main Conclusions

As the micro foundation for the development of a sustainability economy, in order to achieve the Chinese government’s commitment of the “dual-carbon goal” and to promote energy conservation and emission reduction, firms are encouraged to engage in ESG activities. With the vigorous development of ESG, much research has emerged to explore the determinants of corporate ESG performance. In this paper, we examined how a third-party information intermediary—an analysts—can affect firms’ sustainable development under the ESG framework.
We used Chinese A-share listed firms from 2011 to 2021 as a sample and Bloomberg ESG rating scores as a measurement of corporate ESG performance to explore the relationship between analyst coverage and corporate ESG performance. Our main conclusions were as follows: analyst coverage improves corporate total ESG performance, proving that analyst coverage is an important driving force behind corporate ESG engagement. Analyst coverage mainly promotes the performance of the environmental (E) and social (S) dimensions, and has a less obvious impact on the governance dimension. A possible reason for this is that, in our sample, the score of the corporate G pillar was much higher than that of the E pillar and S pillar; therefore, the improvement effect of analysts was not obvious. In additional tests, we first tested the heterogeneity of corporate characteristics, and found that analyst coverage mainly improves non-state-owned firms’ ESG performance, because non-state-owned firms are more market-oriented and pay more attention to market responses. Analyst coverage improves the corporate ESG performance among firms with higher financial constraints by facilitating external financing opportunities and reducing financing costs; this effect is more significant among firms with low information transparency, mainly because analyst coverage reduces the information asymmetry between insiders and outsiders. Furthermore, we examined the potential channels through which analyst coverage improves corporate ESG performance, and found that attracting media attention and participating in site visits are two channels by which analyst coverage improves corporate ESG performance. Our results remained valid after a series of endogeneity and robustness checks, including using the instrumental variable, Heckman two-stages method, entropy balance matching, alternative variable measures, and change samples.

6.2. Implications

Our research highlighted the role analysts play in corporate non-financial performance from the perspective of enterprise ESG performance, enriching research on the effect of analyst coverage on corporate governance. Our findings have the following implications:
(1)
The role analysts play in corporate governance should be fully valued. Analyst attention to corporate non-financial information should not be ignored, and although analyst coverage may put pressure on management, our findings proved that analyst coverage plays a positive role in promoting firms’ sustainability development in an emerging markets scenario.
(2)
Firms should pay attention to and improve their ESG performance by establishing a sound ESG framework and making more investments in ESG activities, thereby promoting their sustainable development. Furthermore, good information transparency provides an opportunity for outsiders to understand the real ESG performance of enterprises. Companies should increase the degree of ESG information disclosure to the authoritative ESG framework and show details of the real ESG performance of the company to outsiders.
(3)
For investors, the non-financial information of an enterprise also has value and contains information. Investors should take the ESG performance of enterprises into account when selecting investment targets. This can not only reduce investment risks and increase investment return, but can also promote the sustainable development of society.
(4)
From the perspective of regulators, policy makers should create favorable policies and laws for ESG construction in firms, and encourage firms to actively participate in ESG development within the formal system. First, regulated policy should consider firms’ property rights and financing constraints, use market incentives to guide non-state-owned enterprises to participate in ESG construction, and carry out financing reform and expand financing channels for enterprises to address the difficulty and high cost of financing for non-state-owned enterprises. Regulators should have a rational view of the role analysts play in influencing the development of corporate ESG as an informal institution, strengthen the supervision of analysts, and guide analysts to participate more effectively in corporate governance.

6.3. Limitations and Future Research

Although our study complements existing research on the driving factors of corporate ESG performance, and may have potential implications for other developing markets, there are limitations to consider. First, this study was based on Chinese A-share listed firms, and although the number of Chinese firms publishing corporate ESG reports is growing rapidly, Chinese corporate ESG is still in its infancy, and it is still a minority of firms that publish well-developed corporate ESG reports. Due to limited data availability, the generalizability of the conclusions of this paper to mature markets remains to be tested. Future research could explore the relationship between analysts and corporate ESG performance in diverse contexts.
Second, following the existing literature [32], this paper used the annual number of analysts as a proxy variable to measure analyst coverage. This is a common measurement of analyst coverage; however, it ignores the possible impact of analyst heterogeneity. In this paper, we focused on the relationship between analyst coverage and corporate ESG performance and the potential firm-level characteristics that may influence this relationship, and did not address the possible impact of analyst characteristics on this relationship. Therefore, future research could consider the impact of the heterogeneity of analysts, such as career focus, effort allocation, and expertise, on corporate ESG performance.
Finally, we studied the impact of analyst coverage on the three dimensions of corporate ESG performance, and explored the possible channels by which analysts affect the overall ESG performance of firms. However, we did not distinguish whether there are different impact mechanisms of analyst coverage on the three dimensions of corporate ESG performance. Future research could further explore the different potential mechanisms by which analyst coverage affects these three dimensions.

Author Contributions

Conceptualization, C.Z.; methodology, C.Z.; software, C.Z.; validation, C.Z.; formal analysis, C.Z.; investigation, C.Z.; resources, C.Z.; data curation, C.Z.; writing—original draft preparation, C.Z.; writing—review and editing, C.Z.; visualization, C.Z.; supervision, X.W.; project administration, X.W.; funding acquisition, X.W. All authors have read and agreed to the published version of the manuscript.

Funding

This research received no external funding.

Institutional Review Board Statement

Not applicable.

Informed Consent Statement

Not applicable.

Data Availability Statement

The data presented in this study are available upon request from the corresponding author.

Acknowledgments

We would like to thank the editors and reviewers for their comments and suggestions, which greatly improved our study.

Conflicts of Interest

The authors declare no conflict of interest.

References

  1. Husted, B.W.; de Sousa, J.M. Board structure and environmental, social, and governance disclosure in Latin America. J. Bus. Res. 2019, 102, 220–227. [Google Scholar] [CrossRef]
  2. Wang, L.; Le, Q.Q.; Peng, M.R.; Zeng, H.X.; Kong, L.Y. Does central environmental protection inspection improve corporate environmental, social, and governance performance? Evidence from China. Bus. Strategy Environ. 2022. [Google Scholar] [CrossRef]
  3. Shu, H.; Tan, W.Q. Does carbon control policy risk affect corporate ESG performance? Econ. Model. 2023, 120, 106148. [Google Scholar] [CrossRef]
  4. Cambrea, D.R.; Paolone, F.; Cucari, N. Advisory or monitoring role in ESG scenario: Which women directors are more influential in the Italian context? Bus. Strategy Environ. 2023, 122125. [Google Scholar] [CrossRef]
  5. Kim, I.; Wan, H.; Wang, B.; Yang, T.N. Institutional Investors and Corporate Environmental, Social, and Governance Policies: Evidence from Toxics Release Data. Manag. Sci. 2019, 65, 4901–4926. [Google Scholar] [CrossRef]
  6. Dhaliwal, D.S.; Radhakrishnan, S.; Tsang, A.; Yang, Y.G. Nonfinancial Disclosure and Analyst Forecast Accuracy: International Evidence on Corporate Social Responsibility Disclosure. Account. Rev. 2012, 87, 723–759. [Google Scholar] [CrossRef]
  7. Bos, K.; Gupta, J. Stranded assets and stranded resources: Implications for climate change mitigation and global sustainable development. Energy Res. Soc. Sci. 2019, 56, 101215. [Google Scholar] [CrossRef]
  8. Luo, K.; Wu, S.R. Corporate sustainability and analysts’ earnings forecast accuracy: Evidence from environmental, social and governance ratings. Corp. Soc. Resp. Env. Manag. 2022, 29, 1465–1481. [Google Scholar] [CrossRef]
  9. Umar, M.; Mirza, N.; Rizvi, S.K.A.; Naqvi, B. ESG scores and target price accuracy: Evidence from sell-side recommendations in BRICS. Int. Rev. Financ. Anal. 2022, 84, 102389. [Google Scholar] [CrossRef]
  10. Schiemann, F.; Tietmeyer, R. ESG Controversies, ESG Disclosure and Analyst Forecast Accuracy. Int. Rev. Financ. Anal. 2022, 84, 102373. [Google Scholar] [CrossRef]
  11. Baldini, M.; Dal Maso, L.; Liberatore, G.; Mazzi, F.; Terzani, S. Role of Country- and Firm-Level Determinants in Environmental, Social, and Governance Disclosure. J. Bus. Ethics 2018, 150, 79–98. [Google Scholar] [CrossRef]
  12. Huang, Q.P.; Li, Y.J.; Lin, M.M.; McBrayer, G.A. Natural disasters, risk salience, and corporate ESG disclosure*. J. Corp. Financ. 2022, 72, 102152. [Google Scholar] [CrossRef]
  13. Barko, T.; Cremers, M.; Renneboog, L. Shareholder Engagement on Environmental, Social, and Governance Performance. J. Bus. Ethics 2022, 180, 777–812. [Google Scholar] [CrossRef]
  14. McBrayer, G.A. Does persistence explain ESG disclosure decisions? Corp. Soc. Resp. Env. Manag. 2018, 25, 1074–1086. [Google Scholar] [CrossRef]
  15. Kind, F.L.; Zeppenfeld, J.; Lueg, R. The impact of chief executive officer narcissism on environmental, social, and governance reporting. Bus. Strategy Environ. 2023. [Google Scholar] [CrossRef]
  16. To, T.Y.; Navone, M.; Wu, E. Analyst coverage and the quality of corporate investment decisions. J. Corp. Financ. 2018, 51, 164–181. [Google Scholar] [CrossRef]
  17. Kim, J.B.; Kim, Y.; Lee, J. Analyst reputation and management earnings forecasts. J. Account. Public Pol. 2021, 40, 106804. [Google Scholar] [CrossRef]
  18. Su, F.; Feng, X.; Tang, S.L. Do site visits mitigate corporate fraudulence? Evidence from China. Int. Rev. Financ. Anal. 2021, 78, 101940. [Google Scholar] [CrossRef]
  19. Zhang, M.; Tong, L.J.; Su, J.; Cui, Z.P. Analyst coverage and corporate social performance: Evidence from China. Pac.-Basin Financ. J. 2015, 32, 76–94. [Google Scholar] [CrossRef]
  20. Bradley, D.; Mao, C.X.; Zhang, C. Does Analyst Coverage Affect Workplace Safety? Manag. Sci. 2022, 68, 3464–3487. [Google Scholar] [CrossRef]
  21. Jing, C.; Keasey, K.; Lim, I.; Xu, B. Analyst Coverage and Corporate Environmental Policies. J. Financ. Quant. Anal. Forthcom. 2022, 1–34. [Google Scholar] [CrossRef]
  22. Jiang, Y.H.; Wang, C.; Li, S.; Wan, J. Do institutional investors’ corporate site visits improve ESG performance? Evidence from China. Pac.-Basin Financ. J. 2022, 76, 101884. [Google Scholar] [CrossRef]
  23. Cheng, Q.; Du, F.; Wang, X.; Wang, Y.T. Seeing is believing: Analysts’ corporate site visits. Rev. Account. Stud. 2016, 21, 1245–1286. [Google Scholar] [CrossRef]
  24. Gao, Z.; Quan, X.F.; Xu, X.M. Under watchful eyes: Analyst site visits and firm earnings management. Int. Rev. Financ. Anal. 2022, 83, 102269. [Google Scholar] [CrossRef]
  25. Goetz, M.R. Financing Conditions and Toxic Emissions; SAFE Working Paper No. 254; Leibniz Institute for Financial Research SAFE: Frankfurt, Germany, 2019. [Google Scholar]
  26. Gentry, R.J.; Shen, W. The impacts of performance relative to analyst forecasts and analyst coverage on firm R&D intensity. Strategy Manag. J. 2013, 34, 121–130. [Google Scholar]
  27. Dyck, A.; Morse, A.; Zingales, L. Who Blows the Whistle on Corporate Fraud? J. Financ. 2010, 65, 2213–2253. [Google Scholar] [CrossRef]
  28. Chen, T.; Harford, J.; Lin, C. Do analysts matter for governance? Evidence from natural experiments. J. Financ. Econ. 2015, 115, 383–410. [Google Scholar] [CrossRef]
  29. Yu, F. Analyst coverage and earnings management. J. Financ. Econ. 2008, 88, 245–271. [Google Scholar] [CrossRef]
  30. Irani, R.M.; Oesch, D. Analyst Coverage and Real Earnings Management: Quasi-Experimental Evidence. J. Financ. Quant. Anal. 2016, 51, 589–627. [Google Scholar] [CrossRef]
  31. Wan-Hussin, W.N.; Qasem, A.; Aripin, N.; Ariffin, M.S.M. Corporate Responsibility Disclosure, Information Environment and Analysts’ Recommendations: Evidence from Malaysia. Sustainability 2021, 13, 3568. [Google Scholar] [CrossRef]
  32. Ali, U.; Hirshleifer, D. Shared analyst coverage: Unifying momentum spillover effects. J. Financ. Econ. 2020, 136, 649–675. [Google Scholar] [CrossRef]
  33. Al Amosh, H.; Khatib, S.F.A.; Ananzeh, H. Terrorist attacks and environmental social and governance performance: Evidence from cross-country panel data. Corp. Soc. Resp. Env. Manag. 2023. [Google Scholar] [CrossRef]
  34. Sulimany, H.G.H. Ownership structure and audit report lag of Saudi listed firms: A dynamic panel analysis. Cogent Bus. Manag. 2023, 10, 2229105. [Google Scholar] [CrossRef]
  35. Zhang, Y. Analyst coverage and corporate social responsibility decoupling: Evidence from China. Corp. Soc. Resp. Env. Manag. 2022, 29, 620–634. [Google Scholar] [CrossRef]
  36. Hu, M.; Xiong, W.F.; Xu, C. Analyst coverage, corporate social responsibility, and firm value: Evidence from China. Glob. Financ. J. 2021, 50, 100671. [Google Scholar] [CrossRef]
  37. Hainmueller, J. Entropy balancing for causal effects: A multivariate reweighting method to produce balanced samples in observational studies. Political Anal. 2012, 20, 25–46. [Google Scholar] [CrossRef]
  38. Wei, C.Y. State Ownership and Target Setting: Evidence from Publicly Listed Companies in China. Contemp. Account. Res. 2021, 38, 1925–1960. [Google Scholar] [CrossRef]
  39. Orlitzky, M.; Siegel, D.S.; Waldman, D.A. Strategic Corporate Social Responsibility and Environmental Sustainability. Bus. Soc. 2011, 50, 6–27. [Google Scholar] [CrossRef]
  40. Li, Y.W.; Gong, M.F.; Zhang, X.Y.; Koh, L. The impact of environmental, social, and governance disclosure on firm value: The role of CEO power. Br. Account. Rev. 2018, 50, 60–75. [Google Scholar] [CrossRef]
  41. Xu, Q.P.; Kim, T. Financial Constraints and Corporate Environmental Policies. Rev. Financ. Stud. 2022, 35, 576–635. [Google Scholar] [CrossRef]
  42. Moyer, R.C.; Chatfield, R.E.; Sisneros, P.M. Security Analyst Monitoring Activity—Agency Costs and Information Demands. J. Financ. Quant. Anal. 1989, 24, 503–512. [Google Scholar] [CrossRef]
  43. Derrien, F.; Kecskes, A.; Mansi, S.A. Information asymmetry, the cost of debt, and credit events: Evidence from quasi-random analyst disappearances. J. Corp. Financ. 2016, 39, 295–311. [Google Scholar] [CrossRef]
  44. Hallman, N.; Howe, J.S.; Wang, W. Analyst coverage and syndicated lending. Rev. Account. Stud. 2022. [Google Scholar] [CrossRef]
  45. Hadlock, C.J.; Pierce, J.R. New Evidence on Measuring Financial Constraints: Moving beyond the KZ Index. Rev. Financ. Stud. 2010, 23, 1909–1940. [Google Scholar] [CrossRef]
  46. Kelly, B.; Ljungqvist, A. Testing Asymmetric-Information Asset Pricing Models. Rev. Financ. Stud. 2012, 25, 1366–1413. [Google Scholar] [CrossRef]
  47. Ellul, A.; Panayides, M. Do financial analysts restrain insiders’ informational advantage? J. Financ. Quant. Anal. 2018, 53, 203–241. [Google Scholar] [CrossRef]
  48. Derrien, F.; Kecskes, A. The Real Effects of Financial Shocks: Evidence from Exogenous Changes in Analyst Coverage. J. Financ. 2013, 68, 1407–1440. [Google Scholar] [CrossRef]
  49. Hutton, A.P.; Marcus, A.J.; Tehranian, H. Opaque financial reports, R2, and crash risk. J. Financ. Econ. 2009, 94, 67–86. [Google Scholar] [CrossRef]
  50. Dechow, P.; Ge, W.L.; Schrand, C. Understanding earnings quality: A review of the proxies, their determinants and their consequences. J. Account. Econ. 2010, 50, 344–401. [Google Scholar] [CrossRef]
  51. Dai, L.L.; Parwada, J.T.; Zhang, B.H. The Governance Effect of the Media’s News Dissemination Role: Evidence from Insider Trading. J. Account. Res. 2015, 53, 331–366. [Google Scholar] [CrossRef]
  52. Deephouse, D.L. Media reputation as a strategic resource: An integration of mass communication and resource-based theories. J. Manag. 2000, 26, 1091–1112. [Google Scholar] [CrossRef]
  53. Liu, M.Y.; Luo, X.W.; Lu, W.Z. Public perceptions of environmental, social, and governance (ESG) based on social media data: Evidence from China. J. Clean. Prod. 2023, 387, 135840. [Google Scholar] [CrossRef]
  54. Burke, J.J. Do Boards Take Environmental, Social, and Governance Issues Seriously? Evidence from Media Coverage and CEO Dismissals. J. Bus. Ethics 2022, 176, 647–671. [Google Scholar] [CrossRef]
  55. Jia, M.; Tong, L.; Viswanath, P.V.; Zhang, Z. Word Power: The Impact of Negative Media Coverage on Disciplining Corporate Pollution. J. Bus. Ethics 2016, 138, 437–458. [Google Scholar] [CrossRef]
  56. Tang, Z.; Tang, J.T. Can the Media Discipline Chinese Firms’ Pollution Behaviors? The Mediating Effects of the Public and Government. J. Manag. 2016, 42, 1700–1722. [Google Scholar] [CrossRef]
  57. Lyon, T.P.; Montgomery, A.W. Tweetjacked: The Impact of Social Media on Corporate Greenwash. J. Bus. Ethics 2013, 118, 747–757. [Google Scholar] [CrossRef]
  58. Bednar, M.K. Watchdog or Lapdog? A Behavioral View of the Media as a Corporate Governance Mechanism. Acad. Manag. J. 2012, 55, 131–150. [Google Scholar] [CrossRef]
  59. Cheng, Q.; Du, F.; Wang, B.Y.T.; Wang, X. Do Corporate Site Visits Impact Stock Prices? Contemp. Account. Res. 2019, 36, 359–388. [Google Scholar] [CrossRef]
  60. Roberts, J.; Sanderson, P.; Barker, R.; Hendry, J. In the mirror of the market: The disciplinary effects of company/fund manager meetings. Account. Org. Soc. 2006, 31, 277–294. [Google Scholar] [CrossRef]
  61. Chen, D.Q.; Ma, Y.J.; Martin, X.M.; Michaely, R. On the fast track: Information acquisition costs and information production. J. Financ. Econ. 2022, 143, 794–823. [Google Scholar] [CrossRef]
  62. Huang, A.H.; Lehavy, R.; Zang, A.Y.; Zheng, R. Analyst Information Discovery and Interpretation Roles: A Topic Modeling Approach. Manag. Sci. 2018, 64, 2833–2855. [Google Scholar] [CrossRef]
  63. Jiang, X.Y.; Yuan, Q.B. Institutional investors’ corporate site visits and corporate innovation. J. Corp. Financ. 2018, 48, 148–168. [Google Scholar] [CrossRef]
  64. Guo, Y.W.; Li, J.J.; Lin, B.X. Corporate site visit and tax avoidance: The effects of monitoring and tax knowledge dissemination. J. Corp. Financ. 2023, 79, 102385. [Google Scholar] [CrossRef]
Figure 1. Conceptual research model.
Sustainability 15 12763 g001
Table 1. Sample industrial distribution.
Industry NameIndustry
Classification Code
FrequencyPercentage (100%)
Agriculture, forestry, animal husbandry, and fisheriesA1451.38
Extractive industryB4584.37
Textiles, clothing, furC17276.93
Wood, furnitureC2178917.05
Papermaking and printingC3349433.30
Petroleum, chemicals, plastics, and plasticsC41081.03
Electricity, gas, and water production and supply industryD5375.12
Construction industryE3012.87
Transportation, storage industryF6225.93
Information technology industryG4914.68
Wholesale and retail tradeH280.27
Information transmission, software, and information technology servicesI6075.79
Real estate K5885.60
Leasing and business serviceL1271.21
Scientific research and technical servicesM610.58
Water, environment, and utilities managementN840.80
Total 10,491100
Note: The primary industry classification issued by the China Securities Regulatory Commission (CSRC) in 2002 was used, and the secondary classification was used because of the large number of manufacturing firms.
Table 2. Definitions and measurement of the main variables.
Variable
Category
Variable SymbolMeasure
Dependent variablesESGThe firm’s ESG disclosure score from Bloomberg
EThe firm’s environment disclosure score from Bloomberg
SThe firm’s social disclosure score from Bloomberg
GThe firm’s governance disclosure score from Bloomberg
Independent variablesCov1The annual analyst coverage number for firm i in year t
Cov2The annual number of earning forecasts for firm i in year t
Control
variables
SizeNatural log of total assets
LevTotal liabilities divided by total assets
InstThe percentage of institutional ownership
ROANet income divided by total assets in year t
GrowthThe annual revenue growth rate
AgeNatural log of the years since the firm listing year to fiscal year t
State1 if a company is state-owned, otherwise 0
Big1The percentage of the largest shareholder holdings
Dual1 if the chairman and CEO are the same, otherwise 0
IndepThe percentage of independent directors
Table 3. Descriptive statistics.
VariableNMeanSDMinMedianMax
ESG10,28928.6818.8736.19827.64368.917
Cov110,28911.61612.3310.0007.00051.000
Cov210,28925.55831.1500.00013.000141.000
E10,24412.5807.0090.00010.39954.386
S10,1949.29112.5440.0002.41673.815
G10,25964.71213.68226.78669.29696.117
Size10,28923.2331.31120.48423.11526.973
Lev10,2890.4780.1990.0670.4900.886
Inst10,2890.5050.2170.0010.5240.885
ROA10,2890.0440.059−0.1840.0380.219
Growth10,2890.1660.370−0.4980.1072.238
state10,2890.5090.5000.0001.0001.000
Age10,28913.4097.1460.00014.00031.000
Big110,2890.3700.1610.0830.3560.774
Dual10,2890.7820.4130.0001.0001.000
Indep10,2890.3760.0570.1820.3640.800
Table 4. Correlation analysis.
ESGESGCov1Cov2SizeLevInstROAGrowthStateAgeBig1DualIndep
ESG1
E0.607 ***1
S0.844 ***0.610 ***1
G0.764 ***0.213 ***0.352 ***1
Cov10.177 ***0.180 ***0.196 ***0.073 ***1
Cov20.180 ***0.179 ***0.194 ***0.079 ***0.954 ***1
Size0.456 ***0.291 ***0.361 ***0.345 ***0.221 ***0.225 ***1
Lev0.072 ***0.021 **0.043 ***0.050 ***−0.117 ***−0.102 ***0.504 ***1
Inst0.203 ***0.127 ***0.163 ***0.145 ***0.196 ***0.189 ***0.387 ***0.139 ***1
ROA0.051 ***0.064 ***0.072 ***0.0030.439 ***0.417 ***−0.085 ***−0.463 ***0.112 ***1
Growth0.044 ***−0.0080.036 ***0.029 ***0.137 ***0.137 ***0.018 *−0.005−0.040 ***0.237 ***1
State0.078 ***0.074 ***0.046 ***0.038 ***−0.150 ***−0.150 ***0.276 ***0.216 ***0.319 ***−0.179 ***−0.126 ***1
Age0.174 ***−0.030 ***0.060 ***0.220 ***−0.226 ***−0.202 ***0.221 ***0.231 ***0.137 ***−0.199 ***−0.106 ***0.355 ***1
Big10.026 ***0.051 ***0.051 ***−0.019 **−0.005−0.006000.222 ***0.080 ***0.499 ***0.086 ***−0.027 ***0.255 ***−0.054 ***1
Dual−0.0080.021 **−0.015−0.020 **−0.105 ***−0.095 ***0.101 ***0.086 ***0.150 ***−0.086 ***−0.068 ***0.296 ***0.186 ***0.097 ***1
Indep0.074 ***0.049 ***0.048 ***0.070 ***0.056 ***0.063 ***0.081 ***0.016 *0.031 ***0.0150.0010.008−0.0100.071 ***−0.084 ***1
Notes: t statistics in parentheses; * p < 0.1, ** p < 0.05, *** p < 0.01.
Table 5. Main regression results.
(1)(2)(3)(4)(5)(6)(7)(8)
ESGESGESGESG
Cov10.052 ***0.051 ***0.111 ***−0.006
(5.401)(5.163)(5.651)(−0.445)
Cov2 0.018 ***0.018 ***0.039 ***−0.002
(5.240)(4.955)(5.701)(−0.449)
Size1.176 ***1.409 ***1.902 ***0.0771.217 ***1.450 ***1.986 ***0.073
(5.377)(6.793)(4.828)(0.230)(5.563)(7.000)(5.062)(0.219)
Lev−2.555 ***−1.893 ***−3.020 *−2.752 **−2.612 ***−1.950 ***−3.141 **−2.745 **
(−3.441)(−2.649)(−1.960)(−2.124)(−3.517)(−2.724)(−2.040)(−2.119)
Inst0.4150.3871.657 *−0.9170.4820.4551.798 *−0.923
(0.879)(0.743)(1.721)(−1.213)(1.021)(0.871)(1.873)(−1.221)
ROA2.140 *1.6605.233 *−0.0772.325 *1.8475.576 **−0.090
(1.651)(1.272)(1.959)(−0.038)(1.803)(1.407)(2.114)(−0.045)
Growth−0.057−0.172−0.2040.182−0.075−0.189 *−0.2440.184
(−0.444)(−1.537)(−0.844)(0.898)(−0.584)(−1.692)(−1.010)(0.910)
State−0.0090.1020.184−0.6160.0060.1160.219−0.618
(−0.021)(0.262)(0.205)(−0.683)(0.015)(0.298)(0.247)(−0.686)
Age1.835 ***0.461 ***1.727 ***2.612 ***1.820 ***0.445 ***1.695 ***2.614 ***
(48.967)(12.867)(22.981)(47.807)(49.290)(12.668)(23.047)(48.673)
Big11.7120.4561.8293.310 *1.6760.4081.7583.314 *
(1.379)(0.372)(0.794)(1.735)(1.346)(0.333)(0.760)(1.736)
Dual−0.0620.243−0.311−0.092−0.0640.242−0.315−0.092
(−0.281)(1.260)(−0.672)(−0.307)(−0.287)(1.246)(−0.679)(−0.306)
Indep3.582 **3.366 **7.708 ***−1.1283.516 **3.323 **7.550 **−1.123
(2.548)(2.084)(2.621)(−0.474)(2.492)(2.056)(2.572)(−0.472)
Constant−24.103 ***−28.182 ***−59.588 ***25.658 ***−24.678 ***−28.760 ***−60.718 ***25.715 ***
(−5.099)(−6.201)(−6.989)(3.559)(−5.209)(−6.323)(−7.129)(3.585)
N10,28910,24410,19410,25910,28910,24410,19410,259
Year and Firm FEYESYESYESYESYESYESYESYES
Adj_R20.6910.2740.3620.7310.6910.2730.3620.731
Note: t-values are in parentheses and were estimated using robust standard errors that were adjusted for firm clustering. Statistical significance at the 10%, 5%, and 1% levels is indicated by *, **, and ***, respectively.
Table 6. Robustness tests.
(1)(2)(3)(4)(5)(6)
Cov1ESGCov2ESGESGESG
IV 2slsEntropy Balance
Ind_Cov0.417 *** 0.941 ***
(11.675) (9.768)
Cov1 0.327 ***
(6.015)
Cov2 0.145 ***
(5.729)
Treat1 0.459 ***
(3.338)
Treat2 0.574 ***
(4.109)
Size3.996 ***0.0879.064 ***0.0791.220 ***1.192 ***
(19.801)(0.344)(16.659)(0.299)(6.903)(6.723)
Lev0.080−2.681 ***3.330−3.138 ***−1.757 **−1.701 **
(0.088)(−4.641)(1.356)(−5.113)(−2.420)(−2.340)
Inst9.222 ***−2.022 ***22.291 ***−2.238 ***−0.176−0.201
(15.231)(−3.278)(13.658)(−3.304)(−0.401)(−0.457)
ROA44.288 ***−10.275 ***115.010 ***−12.466 ***4.262 ***4.669 ***
(23.818)(−3.770)(22.945)(−3.883)(2.819)(3.144)
Growth0.006−0.0691.021 *−0.2150.1140.109
(0.030)(−0.532)(1.840)(−1.539)(0.641)(0.616)
State−2.062 ***0.633−6.848 ***0.951 **−0.052−0.047
(−3.442)(1.581)(−4.241)(2.157)(−0.146)(−0.133)
Age−1.592 ***2.083 ***−3.802 ***2.037 ***
(−5.655)(37.424)(−5.009)(39.507)
Big1−7.397 ***3.804 ***−19.015 ***4.142 ***2.711 **2.669 **
(−5.651)(4.106)(−5.390)(4.141)(2.320)(2.287)
Dual0.036−0.0800.232−0.102−0.182−0.191
(0.135)(−0.479)(0.326)(−0.581)(−0.975)(−1.022)
Indep−0.5013.625 ***2.2163.141 **3.731 **3.743 **
(−0.256)(2.917)(0.420)(2.405)(2.304)(2.312)
Constant−63.732 ***−4.760−144.281 ***−3.336−0.3500.171
(−9.600)(−0.999)(−8.062)(−0.641)(−0.084)(0.041)
N10,28410,28410,28410,28410,24310,243
Year and Firm FEYESYESYESYESYESYES
Adj_R20.08250.03470.8470.847
Note: t-values are in parentheses and were estimated using robust standard errors that were adjusted for firm clustering. Statistical significance at the 10%, 5%, and 1% levels is indicated by *, **, and ***, respectively.
Table 7. Change variable measurement and sample selection.
(1)(2)(3)(4)(5)(6)(7)(8)
ESGESGESG_HZESG_HZF.ESGF.ESGESGESG
Cov10.503 *** 0.009 *** 0.062 *** 0.052 ***
(5.597) (5.548) (6.237) (5.250)
Cov2 0.389 *** 0.003 *** 0.021 *** 0.018 ***
(5.492) (5.092) (5.800) (5.143)
Size1.134 ***1.147 ***0.244 ***0.252 ***0.894 ***0.954 ***0.912 ***0.955 ***
(5.099)(5.153)(6.925)(7.143)(3.665)(3.903)(3.269)(3.422)
Lev−2.348 ***−2.361 ***−0.953 ***−0.962 ***−1.499 *−1.579 *−2.542 ***−2.607 ***
(−3.170)(−3.188)(−6.506)(−6.552)(−1.732)(−1.830)(−2.916)(−2.993)
Inst0.4860.4890.249 ***0.262 ***0.4080.5110.2450.309
(1.029)(1.030)(2.732)(2.889)(0.867)(1.086)(0.478)(0.603)
ROA2.448 *2.437 *0.685 **0.728 **4.380 ***4.762 ***2.3482.516
(1.880)(1.863)(2.347)(2.505)(2.918)(3.209)(1.389)(1.492)
Growth−0.074−0.088−0.076 ***−0.079 ***−0.007−0.027−0.045−0.070
(−0.579)(−0.685)(−2.748)(−2.847)(−0.048)(−0.198)(−0.293)(−0.462)
State0.0100.0210.227 **0.229 **0.1700.1850.0230.052
(0.023)(0.050)(2.380)(2.401)(0.388)(0.425)(0.044)(0.100)
Age1.851 ***1.845 ***−0.016 ***−0.018 ***2.064 ***2.045 ***1.973 ***1.957 ***
(47.386)(47.457)(−2.580)(−3.058)(48.730)(48.825)(40.978)(41.059)
Big11.5171.4970.0930.0852.391 *2.3122.426 *2.403 *
(1.217)(1.200)(0.396)(0.360)(1.648)(1.593)(1.761)(1.738)
Dual−0.040−0.0400.0360.036−0.041−0.042−0.149−0.148
(−0.183)(−0.180)(0.832)(0.825)(−0.170)(−0.175)(−0.581)(−0.576)
Indep3.707 ***3.679 ***1.803 ***1.792 ***3.184 **3.103 **4.275 ***4.202 ***
(2.641)(2.617)(6.339)(6.269)(2.270)(2.211)(2.671)(2.616)
Constant−23.819 ***−23.970 ***−1.624 **−1.738 **−20.872 ***−21.752 ***−18.848 ***−19.434 ***
(−4.978)(−5.001)(−2.126)(−2.267)(−3.967)(−4.118)(−3.129)(−3.220)
N10,28910,28910,28710,2878828882885908590
Year and Firm FEYESYESYESYESYESYESYESYES
Adj_R20.6900.6900.0530.0530.6730.6720.6880.688
Note: t-values are in parentheses and were estimated using robust standard errors that were adjusted for firm clustering. Statistical significance at the 10%, 5%, and 1% levels is indicated by *, **, and ***, respectively.
Table 8. Test based on the firms’ heterogeneity characteristics.
(1)(2)(3)(4)(5)(6)
ESGESGESGESGESGESG
State*Cov1−0.039 **
(−2.315)
State*Cov2 −0.014 **
(−2.257)
SA*Cov1 0.057 **
(2.000)
SA*Cov2 0.022 **
(2.123)
Opaque*Cov1 0.021 **
(2.099)
Opaque*Cov2 0.008 **
(2.032)
SA −9.896 ***−9.815 ***
(−4.192)(−4.140)
Opaque −0.131−0.096
(−0.863)(−0.667)
(5.488) (−1.515) (3.293)
Cov2 0.025 *** −0.066 * 0.012 ***
(5.499) (−1.658) (2.723)
Size1.171 ***1.215 ***0.603 ***0.643 ***1.211 ***1.266 ***
(5.383)(5.584)(2.915)(3.130)(5.131)(5.353)
Lev−2.580 ***−2.640 ***−2.366 ***−2.414 ***−2.895 ***−2.937 ***
(−3.486)(−3.564)(−3.298)(−3.364)(−3.549)(−3.600)
Inst0.3170.4090.2650.3350.9871.105 *
(0.669)(0.867)(0.570)(0.719)(1.560)(1.741)
ROA1.9762.161 *2.259 *2.403 *1.7942.087
(1.527)(1.683)(1.783)(1.904)(1.368)(1.605)
Growth−0.055−0.073−0.011−0.030−0.063−0.079
(−0.428)(−0.570)(−0.086)(−0.233)(−0.486)(−0.603)
State0.3300.277−0.0130.006−0.100−0.095
(0.742)(0.635)(−0.031)(0.015)(−0.228)(−0.218)
Age1.832 ***1.818 ***2.184 ***2.171 ***2.030 ***2.019 ***
(48.932)(49.303)(25.996)(25.863)(51.006)(51.151)
Big11.6491.6061.9541.9190.6000.516
(1.333)(1.294)(1.596)(1.567)(0.435)(0.372)
Dual−0.055−0.057−0.004−0.006−0.166−0.167
(−0.249)(−0.260)(−0.016)(−0.025)(−0.717)(−0.725)
Indep3.557 **3.488 **3.317 **3.278 **3.488 **3.426 **
(2.543)(2.488)(2.423)(2.389)(2.421)(2.366)
Constant−24.030 ***−24.651 ***22.163 **21.263 **−29.861 ***−30.852 ***
(−5.117)(−5.236)(2.409)(2.312)(−5.865)(−6.039)
N10,28910,28910,28910,28985958595
Year and Firm FEYESYESYESYESYESYES
Adj_R20.6910.6910.6960.6960.6770.676
Note: t-values are in parentheses and were estimated using robust standard errors that were adjusted for firm clustering. Statistical significance at the 10%, 5%, and 1% levels is indicated by *, **, and ***, respectively.
Table 9. Potential channels.
(1)(2)(3)(4)(5)(6)(7)(8)
MediaESGMediaESGVisitESGVisitESG
Cov10.010 ***0.052 *** 0.012 ***0.050 ***
(4.504)(5.378) (10.536)(5.115)
Cov2 0.004 ***0.018 *** 0.004 ***0.018 ***
(3.937)(5.223) (9.126)(4.980)
Media 0.029 * 0.031 *
(1.864) (1.917)
Visit 0.162 * 0.181 *
(1.948) (1.724)
Size0.0571.177 ***0.066*1.219 ***0.044 **1.172 ***0.057 **1.211 ***
(1.486)(5.331)(1.734)(5.517)(1.979)(5.314)(2.548)(5.482)
Lev0.481 ***−2.646 ***0.470 ***−2.706 ***0.018−2.573 ***0.006−2.628 ***
(2.887)(−3.576)(2.822)(−3.655)(0.195)(−3.464)(0.060)(−3.537)
Inst−0.0480.446−0.0330.5130.233 ***0.3890.256 ***0.449
(−0.415)(0.941)(−0.288)(1.081)(3.607)(0.820)(3.971)(0.944)
ROA0.869 ***2.158 *0.915 ***2.342 *0.913 ***1.9650.995 ***2.123
(2.619)(1.660)(2.716)(1.809)(5.077)(1.510)(5.484)(1.637)
Growth0.018−0.0310.014−0.0490.024−0.0650.021−0.082
(0.495)(−0.239)(0.396)(−0.383)(1.402)(−0.499)(1.181)(−0.634)
State0.0230.0740.0260.089−0.1090.009−0.1080.025
(0.225)(0.173)(0.249)(0.210)(−1.507)(0.021)(−1.468)(0.060)
Age−0.102 ***1.844 ***−0.105 ***1.829 ***0.025 ***1.831 ***0.021 ***1.816 ***
(−12.575)(48.277)(−13.192)(48.542)(6.613)(49.002)(5.578)(49.371)
Big1−0.2031.873−0.2121.8380.2021.6830.1871.645
(−0.859)(1.504)(−0.897)(1.473)(1.605)(1.357)(1.481)(1.323)
Dual0.065−0.0920.065−0.0940.026−0.0640.026−0.066
(1.329)(−0.415)(1.319)(−0.422)(1.090)(−0.290)(1.070)(−0.300)
Indep0.6653.590 **0.6533.525 **−0.1383.621 **−0.1533.560 **
(1.538)(2.537)(1.511)(2.483)(−0.830)(2.578)(−0.920)(2.526)
Constant2.696 ***−24.329 ***2.567 ***−24.918 ***−1.139 **−23.988 ***−1.331 ***−24.516 ***
(3.219)(−5.101)(3.077)(−5.213)(−2.301)(−5.025)(−2.678)(−5.121)
N10,19710,19710,19710,19710,27210,27210,27210,272
Year and Firm FEYESYESYESYESYESYESYESYES
Adj_R20.0600.6910.0600.6910.0940.6910.0890.690
Note: t-values are in parentheses and were estimated using robust standard errors that were adjusted for firm clustering. Statistical significance at the 10%, 5%, and 1% levels is indicated by *, **, and ***, respectively.
Disclaimer/Publisher’s Note: The statements, opinions and data contained in all publications are solely those of the individual author(s) and contributor(s) and not of MDPI and/or the editor(s). MDPI and/or the editor(s) disclaim responsibility for any injury to people or property resulting from any ideas, methods, instructions or products referred to in the content.

