1. Introduction
Due to rapid economic development and the increase in the traditional high-carbon energy consumption, China has become the world’s largest carbon emitter, accounting for about 34% of the world’s carbon emissions in 2021. Under the constraints of the carbon neutrality goal of carbon peaking, China expects its carbon emissions to peak before 2030, and relevant studies predict that the peak of carbon emissions will be about 10.5–11 billion tons of carbon dioxide [
1,
2]. To effectively cope with the growth of carbon emissions, China has adopted market-based trading methods, such as carbon emissions rights trading. From 2013 to 2014, the carbon trading markets in the seven pilot carbon emissions trading regions have been launched one after another. In July 2021, the national carbon market officially opened, including the first batch of more than 2000 electric power enterprises. The above measures have played a positive role in controlling carbon emissions in key industries and key areas, improving the economic benefits and production efficiency of related companies. At present, since the carbon emissions of the power and heating sector account for about 70% of China’s total carbon emissions, the low-carbon transformation of electric power enterprises is under enormous pressure. Therefore, promoting low-carbon development and energy transformation is the only way to achieve China’s carbon neutrality [
3].
As a market-based trading method, carbon emissions trading can make up for the limitations of mandatory intervention methods and policies to a certain extent. Carbon trading has the advantage of market-based transactions; that is, to help enterprises minimize costs and maximize profits, and to minimize the total cost of social emissions reduction under the constraints of reducing the total amount of social carbon emissions.
At the same time, carbon emissions trading can get over the restrictions and constraints of external factors, such as administrative intervention, promoting the development of electric power enterprises and other energy industries. On the one hand, the market-oriented trading of carbon emissions rights can reflect the market supply and demand of emissions rights, thus demonstrating the economic benefits of corporate emissions reduction technologies; on the other hand, the carbon emissions rights trading market could function as an important transaction and capital platform, facilitating electric power companies to obtain more financing for low-carbon technology innovation and renewable energy development. By promoting the technological innovation and development level of electric power companies, more carbon reduction would be realized and more carbon emissions trading income would be gained, thus forming a virtuous circle [
4].
Since 2013, China’s carbon emissions trading pilot program has been carried out for nearly 10 years, whose positive effect has been tested by a large number of theories and practices. However, there is still a lack of in-depth research in the academic field on the impact of carbon emissions trading on the total factor productivity of China’s electric power companies. This paper creatively puts forward the question of whether carbon emissions trading, in addition to bringing direct economic benefits to power enterprises, can further have marginal impact on their total factor productivity improvement. This paper further explains what the impact mechanism is, and tests it through heterogeneity analysis and intermediary effect analysis. At the same time, suggestions are put forward to further optimize the carbon emissions trading market and improve the total factor productivity of China’s electric power companies, which has significant theoretical and practical value.
2. Past Research Summary and This Research Focus
As a market-based trading mechanism and means, carbon emissions trading can help achieve emissions reduction goals, reduce the total cost of emissions reduction, and achieve the unification of environmental benefits and economic benefits. A large number of scholars have studied the carbon emissions trading mechanism and its impact on the economy, environment, and enterprises.
2.1. Research on Carbon Trading Market Mechanism
The design of China’s carbon trading mechanism mainly refers to the construction experience of the European Union’s carbon emissions trading market (EU ETS), and has been adjusted and optimized according to the actual situation in China by launching pilot projects in seven regions in 2013, and then opening the national carbon trading market in 2021. As for the research of the carbon trading market itself, Munnings et al. (2016) analyzed and studied the actual operating efficiency of carbon trading by using the actual operating data of the Shanghai Energy and Environment Exchange over the years, and summarized the existing problems and shortcomings of the operating mechanism and management system of the carbon trading market. Therefore, suggestions are put forward for the further improvement of local and national carbon trading markets [
5].
Xiong et al. (2017) compared the major carbon emissions trading markets in China and abroad and their operations, specifically quantified the operating costs, transaction efficiency, and impact on renewable energy installations of each market, and concluded with the unique characteristics of the operating efficiency of China’s pilot carbon trading market [
6]. In view of the coverage of the carbon trading market, Lin and Jia (2019) mainly studied the scientific rationality of the industries involved, and empirically explored the impact of the carbon trading market on the actual economic development and market entities by comprehensively analyzing the actual economic scale and carbon emission level of relevant industries [
7].
In terms of carbon quota allocation, Calel and Dechezlepretre (2018) pointed out that, at present, there are mainly the historical emissions method, the baseline method, and the auction method, etc. China’s carbon trading system adopts all free allocation methods, but different calculation methods and allocation methods of total carbon emission control will affect enterprises’ expectations. Therefore, it is necessary to determine the scientific method of the total amount setting and quota allocation according to the actual situation [
8]. At the regional level, Fang (2011), based on the economic scale, energy structure, and carbon emission levels of different pilot provinces, believed that each region should set its own emissions reduction target according to the overall carbon emissions reduction target. Fang further pointed out that the eastern region should take the initiative to carry out carbon emissions reduction and shoulder greater responsibilities, and at the same time pay attention to the problem of carbon transfer among provinces [
9].
2.2. Research on the Impact of Carbon Emissions Rights Trading on Electric Power Enterprises
The impact of carbon emissions rights trading on electric power enterprises is also the focus of scholars at home and abroad, whose researches include countries, regions [
10], industries, enterprises, and other levels. Wang et al. (2015) investigated two different carbon trading mechanisms on the basis of determining the carbon emission reduction targets in Guangdong Province, and the empirical results showed that carbon emissions rights trading significantly reduced the emission reduction costs of the overall and electric power enterprises [
11]. Zhao et al. (2016) horizontally compared the operation and efficiency of China’s pilot carbon trading market and pointed out that the current problems and deficiencies in the design of trading system and market mechanism may have a significant impact on market efficiency [
12]. Some scholars also used the CGE model to empirically analyze the impact of carbon trading policies, and came to the conclusion that the carbon emissions, carbon intensity, and energy intensity in the pilot area decreased by about 3–6% [
13]. Based on the DEA model, Wang et al. (2019) pointed out that carbon trading can significantly improve the actual output of relevant industries and enterprises, and the possible mechanism is that carbon trading improves the total factor productivity of enterprises, and the potential income gradually increases [
14]. Rubashkina et al. (2021) conducted a study based on China’s carbon emissions trading pilot and pointed out that carbon emissions trading can effectively improve the level of green innovation and increase the output of power enterprises. Compared with the historical intensity method, the benchmark method had a more significant promoting effect [
4]. Lu and Yu (2022), on the basis of distinguishing and analyzing the progressive innovation mode and the breakthrough innovation mode, pointed out that enterprises would adopt different innovation strategies when participating in the carbon trading market, and the carbon emissions trading market would encourage power enterprises to make more high-level investments in both workers and technology, which would greatly improve the level of innovation of enterprises [
15].
2.3. Literature Evaluation
It can be seen that there are a large number of studies on the testing of carbon emissions trading in the academic field. The existing literature investigate multiple dimensions, such as the country, region, industry, and enterprise, and focus on the analysis of new energy industries and carbon emission-intensive industries. However, the existing studies still have the following shortcomings: First, due to the early launch of carbon emissions trading in developed countries, especially the large scale of the EU carbon trading market, relevant studies are mostly based on the situation and research paradigm of developed countries, while few studies can be closely combined with the latest operation of China’s carbon trading market. Second, there is a lack of research studying from the enterprise level and using relevant data. Most of the existing studies use provincial or industry data, and there are few comprehensive and in-depth studies researching power enterprises, which are important participants and subjects of the carbon trading market. Third, the research on the mechanism and approach of carbon emissions trading’s impact on enterprises’ low-carbon technological innovation, green innovation, and low-carbon development needs to be further studied. Relevant studies usually focus on the discussion of the overall impact of enterprises, and the measurement methods of enterprises’ total factor productivity and green total factor productivity should be more scientific and reasonable, whose heterogeneity should be explored as well.
3. Theoretical Analysis and Research Hypothesis
In essence, carbon emissions trading provides a market trading platform for carbon credits, CCERs, and other carbon assets of enterprises. The government usually allocates carbon allowances to companies free of charge, while companies can also buy CCERs, etc. If the actual carbon emission of the enterprise is greater than the carbon quota allocated by the government, it will form negative carbon assets, and the enterprise needs to purchase carbon quotas in the carbon market to complete the implementation of the agreement, so the enterprise will pay the cost of high carbon emissions. On the contrary, enterprises will become positive carbon assets that can be sold, so as to obtain additional benefits. Under this driving and incentive–constraint mechanism, enterprises will weigh the cost of reducing carbon emissions and purchasing quotas. Therefore, the price of the carbon trading market will reflect the cost of reducing carbon emissions by enterprises, thus showing the economic value of emissions control.
From the analysis above, it can be concluded that carbon trading policy can promote the low-carbon technological innovation of emissions control enterprises, and the environmental cost generated by carbon emissions can be compensated through innovation; that is, the innovation–compensation effect. If the cost per unit of carbon emission is lower than the price of carbon quotas for enterprises to carry out technological innovation, enterprises tend to invest resources in low-carbon technology innovation and may promote the improvement of total factor productivity [
16]. In reality, unlike traditional electric power enterprises, such as coal electric power enterprises, electric power enterprises are more likely to become carbon emissions rights suppliers due to the natural carbon reduction advantages of new energy power generation. The main purpose of technological innovation and carbon emissions trading is to obtain more quotas, CCERs, or green certificates, so as to sell them in the carbon trading market for profits. Therefore, the carbon trading pilot policy can theoretically reflect the economic and environmental benefits of enterprises’ low-carbon technology innovation and promote the development of enterprises’ investment sources [
17,
18].
Further, the impact of the carbon emissions rights trading system on enterprises is mainly reflected in the following two aspects: First, carbon market trading promotes the transfer of carbon emissions rights, carbon assets flow to enterprises with lower emission reduction costs, and, at the same time, promotes the flow of production materials and factors. Enterprises with higher emission reduction efficiency will obtain more resources and technical input, forming a virtuous cycle; the second is the flow of resources within enterprises. Under the long-term constraints of realizing the dual-carbon goal, enterprises are more likely to pursue long-term economic benefits, constantly adjust resource allocation, eliminate high-carbon technology and production equipment, and increase investment in clean and low-carbon production and low-carbon technology innovation. As a result, enterprise production efficiency and total factor productivity are improved [
19].
Based on the above analysis, hypothesis 1 is proposed in this paper:
Hypothesis 1. The carbon emissions trading pilot policy can encourage power enterprises to invest more resources in low-carbon technology innovation, reduce carbon emissions, and improve the total factor productivity of enterprises.
The above analysis is based on the enterprise level. By specifically examining the resource allocation adjustment strategies and behaviors of enterprises, it can be found that power enterprises are more likely to obtain resource support and input under the carbon trading system. On the one hand, the electric power and heat industry is a typical energy-intensive industry, accounting for a relatively large amount of carbon emissions, which is the industry that most needs to reduce carbon. On the other hand, the regional carbon trading pilot policy has set a cap on carbon emissions, while energy transformation is more urgent and it is necessary to increase the demand for renewable energy, which also brings opportunities for the innovation and development of power enterprises. Under the long-term carbon emissions constraint, the marginal cost of carbon reduction for enterprises has been gradually declining as well, and they are more motivated to carry out low-carbon technology innovation and improve carbon efficiency [
20]. However, it also requires a sound carbon trading system and a reasonable level of environmental regulation. China has conducted carbon emissions trading pilot programs in seven provinces and cities. Different regions have different levels of carbon emission reduction, different market mechanism soundness, and different carbon emission verification efforts, among which carbon emission verification efforts are more critical and should be examined in detail.
Based on the above analysis, hypothesis 2 is proposed in this paper:
Hypothesis 2. The results of the carbon trading pilot policies’ impact vary with the intensity of carbon verification. Regional market mechanisms with more stringent carbon emission verification are more complete and fairer, and under this situation power enterprises are more sensitive to carbon trading pilot policies.
In addition, technological innovation, marginal emission reduction cost, and the resource allocation ability of enterprises are related to the size and nature of enterprises as well. State-owned enterprises are usually larger in scale and have a lower marginal emission reduction cost curve due to the scale effect. Meanwhile, they may have a stronger resource allocation ability, but weak technological innovation strength. In general, state-owned enterprises are more likely to be sellers in carbon markets; private enterprises have weak resource allocation ability and may have a low level of resource investment, but they attach more significance to green and low-carbon technologies. Having a higher marginal emission reduction cost curve, private enterprises are more likely to buy carbon quotas. Furthermore, due to the strong financial strength and high management level, state-owned enterprises benefit more from the economies of scale effect of innovation. Therefore, faced with the pressure of carbon emissions regulation, state-owned enterprises are more likely to increase research and development investment and more quickly improve the level of technological innovation, thus improving the market competitiveness. On the other hand, private enterprises are more likely to purchase carbon emission allowances in the carbon emissions trading market due to low competitiveness of resource base, high cost of research and development investment, and high risk of innovation. Moreover, private enterprises are already in a state of market competition, and the impact of the carbon trading mechanism is not caused by the introduction of market trading mechanisms. Therefore, the third hypothesis to be tested is proposed as follows:
Hypothesis 3. Compared with market-oriented private power enterprises, the carbon emissions trading policy has a more significant role in promoting the low-carbon technology innovation of state-owned power enterprises.
4. Model Setting and Data Processing
4.1. Benchmark Differences-in-Differences Model
At present, the differences-in-differences (DID) has become the main method of policy evaluation [
21], and PSM–DID and difference-in-difference-in-difference [
22] have been developed. In the operation of the differences-in-differences method, the samples are divided into the experimental group and the control group (such as enterprises in the pilot area and enterprises in the nonpilot area), and the difference between the two groups of samples before and after the implementation of the policy is assessed to reflect the causal effect, while effectively avoiding endogeneity. This paper constructs a differential model of the impact of pilot carbon trading policies on the total factor productivity of enterprises:
The subscript i represents the province and city, and t represents the time. The explained variable lnTFP is the total factor productivity of China’s electric power enterprises under investigation, and testi represents the virtual variable of the carbon trading pilot. Here, 1 is taken for the enterprises in the pilot provinces and cities (that is, enterprises affected by the pilot policies), and 0 is taken for the others; timet represents the virtual variable of the implementation time of the policy. According to the implementation of the pilot policy, this paper selects 2013 as the year when the carbon trading policy begins to be implemented; that is, when t < 2013, time = 0; when t ≥ 2013, time = 1. Xit represents the control variable of total factor productivity. In this paper, the control variables mainly include: the enterprise age, ageit (unit: year); the enterprise nature, ownerit; the enterprise return on assets, RAit (unit: ten thousand yuan); the enterprise fixed asset investment, lnFAit (unit: ten thousand yuan); technological innovation, lntechit (unit: pieces); the carbon emissions regulation, CEVCMit. Here, δi and ρt represent the firm individual-fixed effect and time-fixed effect, respectively; δi × ρt represents the firm time trend term, and εit represents the random error term. The influence of carbon emissions trading policies on the total factor productivity of power enterprises in the seven provinces and cities studied in this paper is reflected in the coefficient α1 in the model. If α1 is significantly regular in the estimation results, it means that the carbon trading pilot has a positive impact on the total factor productivity of enterprises.
4.2. Model Robustness Test
A robustness test was conducted to further test the results of the baseline regression. Although the DID model can cope with the endogeneity of variables well, this paper carries out the parallel trend hypothesis test of the DID model to ensure the reliability of the results. The parallel trend hypothesis assumes that the sample change trend in the two study groups should be the same in the absence of the influence of investigated factors, such as the implementation of the carbon trading pilot policy. The following parallel trend hypothesis test model is constructed to analyze whether the two groups of samples meet the parallel trend hypothesis:
In this equation, timet is the year dummy variable (t = 2010, 2011, …, 2018); if the year is 2013, then time2013 = 1, otherwise it is 0. In the above formula, it is necessary to focus on the change in coefficient βt. Theoretically, when β2010, β2011, and β2012 are not significant, the DID model can satisfy the parallel trend hypothesis test.
In addition, the placebo test can also be conducted by random sampling. If the empirical results show that none of them are significant, the rationality and reliability of the grouping can be further explained, and the conclusion that the benchmark regression results are caused by external factors, such as the carbon trading pilot policy, can be obtained.
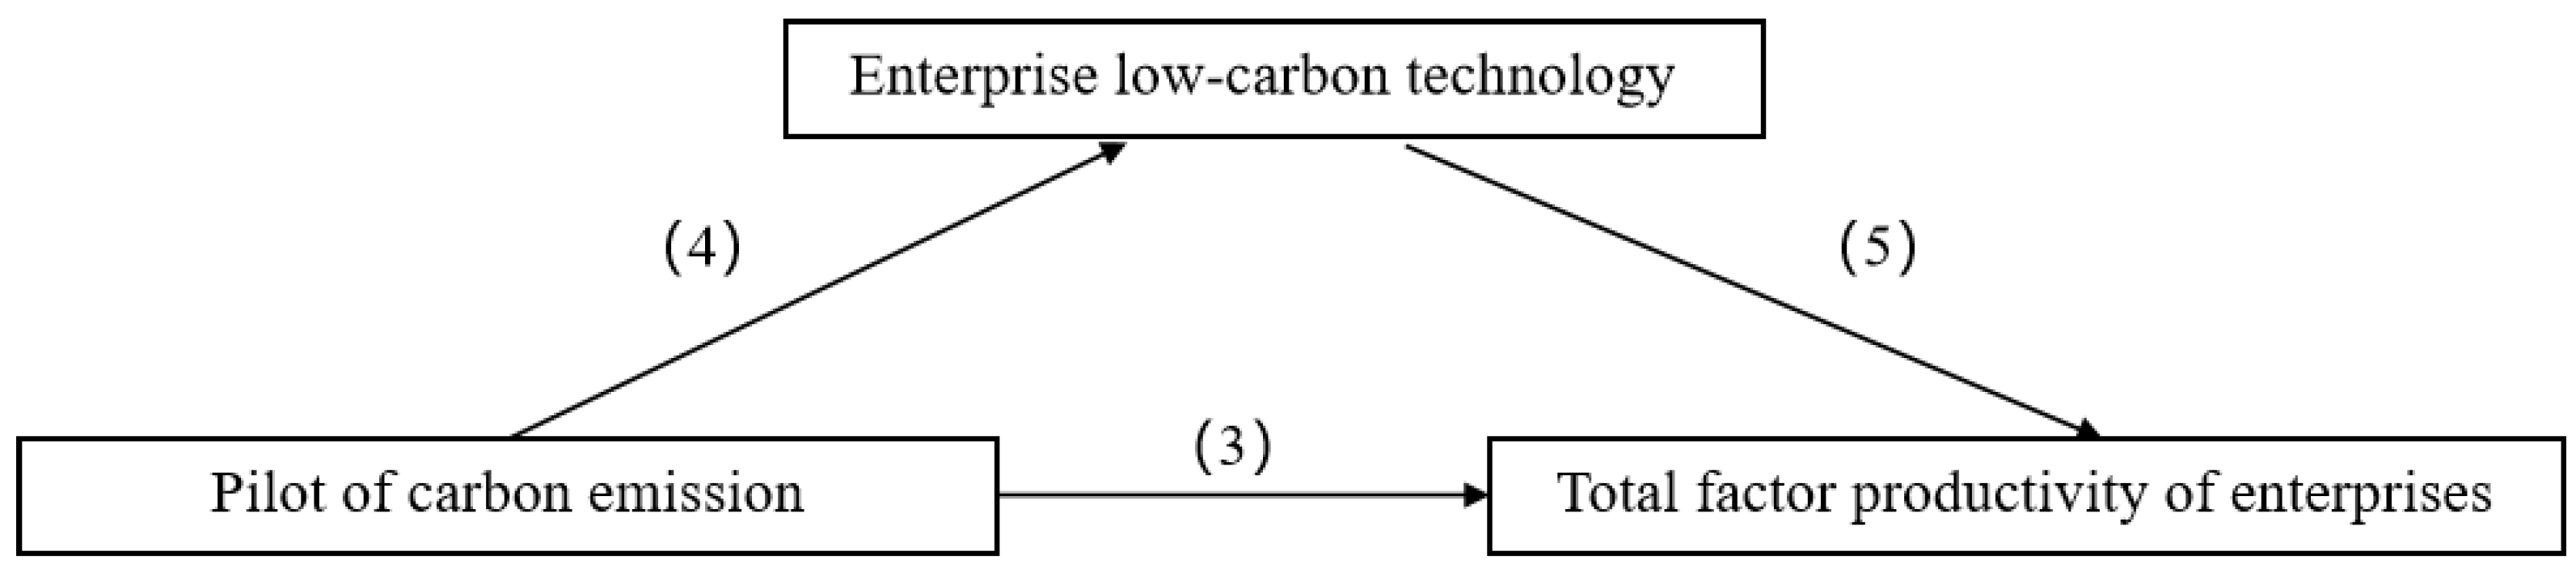
4.3. Mediating Effect Model
According to the above theoretical and institutional analysis, the carbon trading pilot policy may accelerate the low-carbon transformation by promoting power enterprises to obtain excess income, accelerating low-carbon technology innovation, adjusting resource allocation and other channels, and have an impact on the total factor productivity of enterprises. In order to verify this hypothesis, the mediation effect analysis is conducted on the carbon trading pilot policy to promote the low-carbon technology innovation of sample enterprises, and thus improving the total factor productivity of enterprises. This paper draws on the research of Rabe (2019) [
23] and establishes the following mediation effect model, the principle of which is shown in
Figure 1.
Formula (3) is the baseline differential model, the explained variable lnTEINiit in Formula (4) is the low-carbon technology innovation of electric power enterprises, and Formula (5) adds lnTEINiit on the basis of Formula (3) and adopts the stepwise regression method to test the intermediary effect, which is specifically explained as follows: If α1 in Equation (3) is not significant, it indicates that the significance of the relationship between the carbon trading pilot policy and the low-carbon economic transformation of power enterprises is weak, and it can be inferred that there is no intermediary effect. If α1 is significant, the regression of Formula (4) is continued to test whether the carbon trading pilot policy affects the low-carbon technology innovation of power enterprises; if β1 is not significant, it indicates that the significance of the relationship between the carbon trading pilot policy and the low-carbon technology innovation of power enterprises is weak, and it can be judged that there is no intermediary effect. If β1 is significant, the regression of Formula (5) is continued to test whether the intermediary effect of low-carbon technology innovation exists. If λ1 and λ2 are both significant, λ1 is more significantly close to 0 than α1, indicating that low-carbon technology innovation is the intermediary variable for the carbon trading pilot policy to improve the total factor productivity of power enterprises. It has a partial mediating effect. If λ1 is not significant, but λ2 is significant, it indicates that low-carbon technology innovation has a complete mediating effect on the carbon trading pilot policy to promote the improvement of the total factor productivity of electric power enterprises.
4.4. Sample Selection and Index Selection
4.4.1. Data Source and Processing
In order to explore the impact of the carbon emissions trading pilot on the total factor productivity of electric power enterprises, this paper takes some listed electric power enterprises from 2009 to 2018 as samples for empirical analysis. The data come from the China Stock Market & Accounting Research Database and Wind Database, which mainly includes coal power, gas power, new energy power generation, hydropower, and nuclear power enterprises. Being less involved in the carbon trading market, the number of biomass power generation enterprises and the development scale is small. Therefore, they are not used as research objects. In the specific data processing, enterprises with poor operating conditions (such as ST and ST* enterprises) and samples with serious missing data values were eliminated; a total of 360 enterprises located in the pilot area were finally selected, and the data time range was 2009–2018. It should be noted that, different from previous studies, the enterprises included in this study are all power production enterprises, excluding all kinds of equipment manufacturers (the equipment manufacturing has cross-regional supply characteristics, while power generation, especially new energy power generation, has typical regional characteristics, and power generation and equipment manufacturing are significantly different).
4.4.2. Indicator Selection
- (1)
Explained variables
Total Factor Productivity (lnTFP):
When measuring the total factor productivity of enterprises, most scholars adopt the semiparameter method, which can be called the OP method and LP method, respectively. The Olley–Pakes method (OP method) assumes that enterprises make investment decisions based on the current productivity situation of the enterprise. Therefore, the current investment of the enterprise is used as a proxy variable for unobservable productivity shocks, thus solving the problem of simultaneity bias. The Levinsohn and Petin method (LP method) can provide a consistent estimate of the production function at the enterprise level under a series of assumptions. One assumption is that the proxy variable (investment) is required to maintain a monotonic relationship with the total output, which means that samples with zero investment cannot be estimated. Comparing the two methods, it can be seen that the OP method has sample loss problem in the process of processing, while the LP method adds replacement variables to solve this problem. Therefore, this paper chooses the LP method and draws on the method (Song and Wang, 2018) [
24] to measure the total factor productivity of electric power enterprises.
Enterprise low-carbon technology innovation (lnTeIn): Scholars generally use patent-related data to reflect the level of technological innovation of enterprises, which has good objectivity and stability. For low-carbon technology innovation, enterprises can refer to the definition of green low-carbon technology patents in Chinese patents and green technology, or the application concepts on the mitigation or adaptation to climate change issued by foreign patent offices. This paper further integrates the above patent concept definition, selects the low-carbon innovation-related patents, and takes their authorized number as the low-carbon technology innovation index of the power enterprises, and provinces and cities. The data came from the Baiteng network, and we carried out a logarithmic processing of the data.
- (2)
Control variables
This paper analyzes the main control variables from the characteristics of power enterprises and the external factors related to carbon emissions. The characteristics of the enterprises include the age (
age), scale (
staff), ownership (
owner), return on assets (
RA), and fixed asset investment (
FA), where age = year of the current year–year of enterprise registration +1; the enterprise scale is mainly represented by the asset scale and the number of employees, and the return on assets measures the financial status of the enterprises. Enterprise ownership is divided into state-owned enterprises (
owner = 1) and nonstate-owned enterprises (
owner = 0). External factors include the market share of the company in the power industry of the province and city (
mark), and carbon emission verification and compliance monitoring rigor (
CEVCM). Carbon emission verification and compliance supervision can enhance the intervention and influence of policies on enterprises, adjust the direction of resource allocation of enterprises, reduce carbon emissions, and promote the development of renewable energy. In addition, the strict verification of carbon emissions reduces the behavior of enterprises, such as cheating, making enterprises more likely to increase investment in technological innovation. The specific variables are described in
Table 1.
5. Empirical Analysis and Test
5.1. Baseline Regression Results
The benchmark regression results are shown in
Table 2, and the explained variable is the total factor productivity of enterprises. Control variables were gradually increased, and variables related to enterprise age and other internal characteristics, low-carbon technology innovation indicators, and carbon emission verification were successively included in the regression. The results are shown in columns (1)–(4). It can be seen that the coefficient of
test × time in the regression analysis results of each model is significant and positive, with a significance of 1% or 5%, and the coefficient value does not fluctuate significantly. The preliminary judgment results are stable, and it can be shown that the carbon trading pilot policy plays a positive role in promoting the improvement of the total factor productivity of power enterprises in the pilot area.
In terms of the control variables, the enterprise duration (age), enterprise ownership (owner), and return on assets (RA) all show certain significance in models (1)–(4), and the regression coefficient is basically unchanged. Fixed asset investment (lnFA) and market share (mark) are not significant above the 10% significance level. The possible reason for the above results is that the power enterprises that have been established for a longer time tend to be larger in scale, have more layout and accumulation in the installed capacity of power generation, as well as the research and development and innovation of various technologies, and have richer resources. Therefore, after the carbon trading pilot, there is a greater possibility to obtain additional benefits. The influence of enterprise ownership on the total factor productivity of enterprises is significantly positive, which may be because state-owned power generation enterprises tend to be large in scale and have strong self-strength, and the carbon trading market first includes large state-owned power generation enterprises as emission control enterprises. Meanwhile, it may be due to the different technological innovation levels of the two types of enterprises. Therefore, the impact of the carbon trading pilot on state-owned and nonstate-owned enterprises is different. The return on assets and the total number of employees also reflects the operating conditions and actual scale of enterprises. Enterprises with a higher return on assets have good financial conditions and are more likely to increase investment in low-carbon technology innovation, so their competitiveness is improved quickly and they occupy a certain competitive advantage.
5.2. Robustness Test
5.2.1. Parallel Trend Hypothesis Test
The parallel trend hypothesis is further tested by regression, and the results are shown in
Table 3. The cross-terms of the 1–4 periods in advance were added to the benchmark regression model, respectively.
Table 3 (1) shows the parallel trend test results of the impact of the carbon emissions trading pilot on the total factor productivity of power enterprises. It can be seen that, before the formal operation of the carbon trading markets in the seven provinces and cities, the coefficients of the interaction terms (
tt-1,
tt-2,
tt-3,
tt-4) are not significant, and the coefficient (
tt) obtained by the rememory regression after the implementation of the pilot policy is significantly positive, which is similar to the above conclusion. This indicates that the total factor productivity of the emission control enterprises (electric power enterprises) studied was not significantly affected before the implementation of the carbon trading pilot policy in 2013, so a conclusion consistent with the parallel trend hypothesis can be obtained. At the same time, the explained variables also showed a good consistent trend before the implementation of the carbon trading policy, which verified the robustness and reliability of the baseline regression results and provided more empirical evidence for verifying hypothesis 1; that is, the carbon emissions trading pilot significantly promoted the improvement of the total factor productivity of power enterprises.
5.2.2. Placebo Test
To further verify the baseline conclusion, a placebo test was performed. Unlike the parallel trend test, which is mainly based on the time dimension, the placebo test is mainly based on the horizontal dimension (sample grouping), which is also a guarantee to verify the reliability of the grouping and the robustness of the regression results. Seven provincial administrative units were randomly selected as the experimental group, and the rest as the control group. Due to the characteristics of random sampling, it can be reasonably inferred that the influence of cross-terms in the experimental group on the total factor productivity of electric power enterprises should not be significant; otherwise, it indicates that the baseline regression results are biased to a certain extent.
Table 4 reports the results of a parallel analysis of 4 random samples (180 samples each). Among them,
ttw is a new cross-term introduced, and the results in columns (1)–(4) are not significant, indicating that the randomly selected provincial and municipal samples do not show that carbon trading policies have a significant impact on the total factor productivity of enterprises, which further verifies the reliability of the benchmark regression results.
5.3. Heterogeneity Analysis
Through the regression analysis and robustness test, this paper has verified the effectiveness of carbon trading pilot policies in promoting the improvement of the total factor productivity of power enterprises in seven provinces and cities. However, there are still several questions to be solved, such as whether the opening of the carbon emissions trading market has the same impact on all sample enterprises; that is, whether there is sample heterogeneity in this impact. In order to solve this problem, this paper selects the heterogeneity analysis index from the aspects of internal characteristics and the external influencing factors of enterprises, and focuses on two aspects: enterprise ownership, and carbon emission data monitoring and the strict degree of compliance supervision.
(1) Enterprise ownership. This paper studies whether the impact of pilot carbon trading policies on the total factor productivity of enterprises is different between state-owned enterprises and nonstate-owned enterprises.
Table 5 (1) and (2) show the regression results of the two groups of samples, and report the significance of cross-terms of the subsamples of nonstate-owned enterprises and state-owned enterprises. The results show that the cross-term regression coefficients are significant and the results are generally robust; that is, carbon trading can promote the total factor productivity of nonstate-owned and state-owned enterprises. However, the regression coefficient is different. The possible reason is that state-owned enterprises are more likely to be affected by the carbon emissions trading system, and their asset-heavy mode makes their carbon emission reduction pressure greater and their demand for low-carbon technological innovation more urgent, thus vigorously promoting the improvement of total factor productivity.
(2) The severity of carbon verification supervision. In fact, in order to give full play to the role of total carbon emissions control and the free trading of the carbon trading market, it is necessary to build a complete MRV (carbon emission monitoring, reporting, and verification) system, strengthen the collection and management of carbon emissions information, and punish those who do not fulfill the agreement in time or even falsify data. This paper comprehensively evaluates the strictness of carbon emission data monitoring and compliance supervision in seven pilot regions, mainly based on the average amount of penalties (annual penalties in a market/number of market entities). Finally, Shenzhen, Beijing, Hubei, and Guangdong were selected as the regions with strong supervision, while Shanghai, Tianjin, and Chongqing were selected as the regions with weak supervision.
Table 5 (3) and (4) report the regression results of the two groups of samples. The cross-items of the two subsamples are significant, and there is no obvious difference. The possible reason is that there is no obvious difference in the intensity of carbon emission verification, but the tt coefficients of the samples from the two types of regions are different, which may be due to the different sensitivity of different types of samples to the implementation of carbon trading.
5.4. Impact Mechanism Test
We further explore the impact mechanism of the carbon trading pilot to promote the improvement of the total factor productivity of power enterprises. Based on Formulas (3)–(5), the stepwise regression method is used to estimate the intermediary effect model, and its impact mechanism is discussed from the overall sample level. The regression results at the overall level are shown in
Table 6. From the results in columns (1) and (2) of
Table 6, it can be seen that the double interaction terms are significantly positive, indicating that the carbon trading pilot policy has promoted the growth of the enterprise total factor productivity and the improvement of the low-carbon technology innovation level. In column 6 (3), the double interaction terms are significantly positive, but the innovation coefficient of low-carbon technology is not significant. This shows that there is no intermediate effect at the population sample level.
On the basis of the mediating effect test for all samples, the samples of different enterprise natures are tested, and the results are shown in
Table 7. As can be seen from (1) and (2), although the carbon trading pilot policy had a significant promotion effect on the total productivity of nonstate-owned enterprises, it has not had a significant impact on enterprises’ low-carbon technology innovation, so it does not show an intermediary effect. From
Table 7 (3) to (5), it can be seen that the
tt coefficient and low-carbon technology innovation coefficient are both significantly positive, indicating that there is an intermediary effect in state-owned enterprises, but only a partial intermediary effect. This indicates that the carbon trading pilot policy can improve the total factor productivity of state-owned enterprises by promoting low-carbon technology innovation to a certain extent, and also indicates that the difference in the total factor productivity growth of power enterprises of different natures is partly due to the different conditions induced by low-carbon technology innovation. Specifically, the implementation of the carbon trading pilot policy leads to the significant increase in low-carbon technology innovation by state-owned enterprises, induces low-carbon technology innovation, and produces an innovation compensation effect, thus promoting low-carbon transformation; however, the implementation of the carbon trading pilot policy has not induced low-carbon technology innovation in nonstate-owned enterprises, and the results of the low-carbon transformation may be less obvious than that of state-owned enterprises. The low-carbon technology innovation induced by the carbon trading pilot policy is more likely to play a role in enterprises with heavy power assets and carbon emission-intensive enterprises (characteristics of state-owned power enterprises), while the low-carbon technology innovation induced by nonstate-owned enterprises participating in the carbon trading market with light assets is not obvious.
6. Conclusions and Implications
Based on the panel data of Chinese electric power enterprises, this paper empirically analyzes the impact of carbon trading pilot policies on the total factor productivity of enterprises, providing new inspiration for China to promote low-carbon technology innovation and renewable energy development through carbon trading. The main conclusions are as follows:
First, the carbon emissions trading pilot has a significant positive impact on the total factor productivity of power (production) enterprises, which has passed the parallel trend test and the placebo test. Further analysis points out that the possible impact paths are external cost compensation and additional benefits, internal low-carbon technology innovation, and resource allocation adjustment.
Second, heterogeneity analysis shows that state-owned enterprises are more likely to be affected by the carbon emissions trading system, and their asset-heavy mode makes carbon emission reduction pressure greater and the demand for low-carbon technological innovation more urgent, thus strongly promoting the improvement of total factor productivity. At the same time, regions with higher carbon verification intensity are more sensitive to the implementation of carbon trading, and a reasonable increase in carbon emission verification intensity can make the role of the carbon trading market play more effective, so as to improve the total factor productivity of enterprises.
Third, the impact mechanism analysis shows that China’s carbon trading pilot policy has different promotion paths and mechanisms for the total factor productivity of state-owned and nonstate-owned power enterprises. The total factor productivity improvement effect of state-owned enterprises is better than that of nonstate-owned enterprises. The reason is that the carbon trading pilot policy has greatly improved the low-carbon technology innovation of state-owned enterprises and brought an innovation compensation effect, which is mainly influenced by the technical path. However, the pilot carbon trading policy has not effectively induced low-carbon technology innovation in nonstate-owned enterprises, and the improvement of their total factor productivity is more likely to come from the cost compensation and intermediate trade benefits obtained through carbon market participation, and the impact is mainly from the market trading path.
Based on the research conclusions above, in order to further improve China’s carbon emissions trading market mechanism, promote low-carbon technology innovation, and the total factor productivity improvement of power enterprises, the following suggestions are put forward:
First, we should speed up the improvement of the national carbon trading market system, and enhance the diversity and richness of market players, covering more industries. In accordance with the principle of “incorporating an industry immediately after its maturity”, more energy-intensive and high-emission industries will continue to be included in the national carbon trading market, and all power production enterprises will be included. Considering that the carbon trading pilot market has a more significant role in promoting the low-carbon transformation of state-owned enterprises and large enterprises, the expansion of the national carbon trading market can focus on state-owned enterprises and large enterprises that are carbon emission-intensive. In addition, the government should also give private enterprises and small enterprises in related industries more channels of financial support to encourage enterprises to undertake low-carbon transformation.
Second, we should improve the liquidity of the carbon trading market and broaden financing channels for power companies. As an important platform, the carbon trading market can explore the connection between financial institutions and power companies, the former providing financial support to the latter through the carbon trading market. We should increase the proportion of financial institutions’ participation in the carbon market and explore more innovative financial methods. We should provide innovative financial services, such as carbon asset mortgage for power enterprises, launch more financial products to support green development, and build a more complete green financial system, which will further enhance the diversity and liquidity of the carbon market, facilitating it to play the important role of the carbon financial market. This paper analyzes the influence mechanism of total factor productivity of electric power enterprises, and points out that enterprises will change the resource allocation structure, and the expansion of financing channels will accelerate this process.
Third, we should improve the carbon market supervision mechanism to ensure the effective operation of the carbon trading market. The research shows that the intensity of carbon emission data monitoring and compliance supervision will profoundly affect the construction and role of the carbon trading market, and the actual impact on participants and subjects will also be different. The MRV system of the carbon trading market is the key, while the quality and authenticity of carbon emission data are the basis for the market to operate and function effectively. It is necessary to further formulate supporting laws and regulations on the carbon trading market to provide legal guarantees for the supervision work. We will effectively enhance the integrity of laws and regulations on the carbon market, effectively prevent and limit carbon trading defaults, increase the willingness and enthusiasm of all entities to participate in the carbon market, clarify the confidence in the development of the carbon market, and guide enterprises to carry out low-carbon technological innovation and low-carbon investment.


