Article

Study on Groundwater Function Zoning and Sustainable Development and Utilization in Jining City Planning Area

1
School of Environmental Studies, China University of Geosciences, Wuhan 430074, China
2
Shandong Provincial Lunan Geology and Exploration Institute, Jining 272100, China
3
Technical Innovation Center for Comprehensive Treatment of Coal Mining Subsidence Area of the Ministry of Natural Resources, Jining 272100, China
*
Author to whom correspondence should be addressed.
Sustainability 2023, 15(17), 12767; https://doi.org/10.3390/su151712767
Submission received: 19 July 2023 / Revised: 14 August 2023 / Accepted: 16 August 2023 / Published: 23 August 2023

Abstract

:
The sustainable development and utilization of groundwater resources are of paramount importance for the progress of society, the economy, and the environment. This study focuses on the planning area of Jining City and establishes an evaluation index system for groundwater functional zoning by analyzing key factors such as resource supply function, geo-environmental stability function, and ecological environmental protection function. To evaluate the groundwater functions, this study employs the barrel effect AHP. Through the overlay analysis of different groundwater functions, the planning area of Jining City is categorized into distinct zones based on their groundwater functions. These zones include centralized development and utilization areas (5.69%), decentralized development and utilization areas (65.67%), fragile geo-environmental areas (10.44%), ecological protection areas (8.38%), and unsuitable development and utilization areas (9.82%). The comprehensive zoning map of groundwater functions in the planning area of Jining City is generated. Taking into account the challenges posed by human activities, such as groundwater pollution, this study proposes recommendations for the sustainable development of groundwater in the planning area of Jining City. By systematically examining the functional zoning and sustainable management of groundwater, this study provides a scientific foundation for the responsible development and protection of groundwater resources.

1. Introduction

Groundwater, as a vital global resource, plays a crucial role in maintaining ecosystem stability [1]. It accounts for 98–99% of available freshwater resources worldwide [2], and approximately one-quarter of global water demand relies on groundwater [3]. However, groundwater resources in China are unevenly distributed, with northern regions experiencing water scarcity despite high levels of groundwater exploitation; challenges such as the concealed nature of groundwater, data limitations, and inadequate monitoring systems hinder the timely detection of groundwater degradation [4]. Unsustainable groundwater development practices have resulted in ecological and environmental issues, including land subsidence, desertification, ecological degradation, and deteriorating water quality, which adversely affect people’s livelihoods and impede local socio-economic sustainable development [5,6,7,8]. Therefore, effective groundwater management is crucial.
The sustainable management and utilization of groundwater are integral processes for environmental, economic, and social development [9]. Groundwater function zoning, as a straightforward groundwater management tool, divides groundwater resources into different zones to facilitate the more efficient management, protection, and sustainable utilization of groundwater [10]. During the early 20th century, a growing awareness of the vital role played by groundwater resources emerged. However, the predominant focus has remained on the exploitation and utilization of groundwater, leading to the emergence of a multitude of groundwater-related issues due to inadequate management [11]. Groundwater reserves have primarily been regarded as a means to cater to the water needs of urban, rural, and industrial areas, with management priorities centered around meeting human demands [12]. Nonetheless, the primary focus on groundwater extraction and utilization has inadvertently given rise to numerous challenges due to inadequate management practices. Historically, groundwater reserves were primarily seen as a means to meet urban, rural, and industrial water needs, prioritizing human demands. By the year 2005, China was grappling with significant groundwater challenges, which could be broadly classified into three main categories: resource depletion, degradation of ecological functions, and heightened environmental geological risks [13,14]. These challenges fundamentally represented outward signs of the erosion and impairment of groundwater’s functional capacities, underscoring a severe impact on the overall integrity of the groundwater system. Through a comprehensive analysis of the interplay between groundwater functions and the array of contemporary challenges it confronts, the notion of partitioning groundwater distribution was introduced [15,16]. This proposition aimed at addressing the water requirements of human populations, concurrently suggesting a precise technical framework for the delineation of groundwater functional zones to facilitate such division [17].
Groundwater function refers to the role and benefits of groundwater in terms of resource supply, geo-environmental stability, and ecological environmental protection. Groundwater sustainability is achieved through the rational use and management of groundwater resources, ensuring a long-term stable supply and environmental protection. Enhancing and realizing groundwater functions contribute to achieving groundwater sustainability, while achieving groundwater sustainability requires considering and optimizing the comprehensive benefits of groundwater functions to ensure the sustainable utilization and protection of groundwater resources. Therefore, there exists a mutually beneficial and interdependent relationship between groundwater function and groundwater sustainability. To achieve sustainable groundwater management, it is essential to adopt approaches that ensure groundwater use can be sustained indefinitely without causing environmental, economic, or social impacts [18]. This involves the effective and equitable development and utilization of groundwater while preserving its quality and environmental diversity [19].
Multiple criteria decision analysis (MCDA) is recognized as an important tool for environmental decision making and addressing competitive decision problems [20,21]. Among the various MCDA methods, the analytic hierarchy process (AHP) is considered one of the most suitable for complex problems and is often combined with MCDA to solve decision-making problems [22,23]. Integrating the AHP with the Geographic Information System (GIS) has been found to be an efficient and effective spatial data management technique [24]. The integrated use of the AHP and GIS can improve the efficiency and decision quality of groundwater management. The GIS enables the management and visualization of relevant groundwater data, while the AHP allows for the comprehensive evaluation of multiple factors. By the rational delineation of groundwater functional zones and formulating extraction plans, it becomes possible to protect groundwater resources effectively [25,26]. This integration brings new possibilities to groundwater management, providing more powerful tools and support, and offering decision makers more comprehensive and accurate information for sustainable groundwater management [27,28,29]. Researchers have effectively utilized the AHP in combination with MCDA by integrating crucial parameters such as slope, land use, and groundwater depth to delineate groundwater zones [30,31,32,33]. For instance, Gautam et al. (2021) employed a multi-criteria decision analysis based on land use, land cover patterns, groundwater levels, and groundwater quality to delineate groundwater regions [34]. However, the AHP has limitations and does not entirely eliminate subjective factors in the weight determination [35]. The determination of weights involves the subjective preferences and judgments of decision makers or experts. Different decision makers may have varying preferences for different criteria or factors, leading to different weight allocations and consequently affecting decision outcomes [36]. To address these issues, researchers have employed various methods to overcome the shortcomings of weight determination in the AHP, such as using fuzzy comprehensive evaluation [37] or combining the AHP with the entropy weight method [38,39]. Integrating the GIS, AHP, and MCDA can provide better support for regional sustainable groundwater management. Khare and Varade studied sustainable management practices of groundwater in India [40]. Li et al. (2015) utilized the analytic hierarchy process (AHP) to determine groundwater function zoning and investigated its role in groundwater risk assessment [17]. Guo et al. (2019) conducted research on the application of groundwater zoning in coastal groundwater management [41]. Suzhou Industrial Park is China’s first standardized industrial park with sustainable water management, further enhancing its capacity to cope with climate change. Australia has successively developed the “Australian National Framework for Improving Groundwater Management” and the “Australian Groundwater Protection Guidelines” to achieve the sustainable management of groundwater in its arid and semi-arid environments in response to drought conditions [42]. In 1980, the state of Arizona in the United States enacted the Groundwater Management Act (Arizona’s Groundwater Management Programs) [43]. In 2014, the state of California introduced dedicated groundwater sustainability management legislation [44]. However, there is a current lack of work related to the global-scale assessment of groundwater sustainability and comprehensive analysis of quantitative composite indicators [45]. Groundwater sustainability is a complex systemic issue, and determining the relevance of indicators during assessment is challenging [46,47]. In addition, errors in weight allocation may arise when employing methods such as weighted linear combination [48], the analytic hierarchy process [49], and the weighted aggregation method [50,51]. Indeed, there are numerous challenges and obstacles in implementing sustainable groundwater management. Issues such as groundwater overexploitation, groundwater pollution, water resource allocation, and conflicts of interests hinder the implementation of sustainable groundwater management [52,53,54]. MCDA is gradually becoming one of the most widely used methods for groundwater management [28]. Integrating these approaches to delineate and map groundwater zones will contribute to the sustainable development, planning, and management of water resources.
This study focuses on the planning area of Jining City as the study area. Based on a comprehensive analysis of regional hydrogeological conditions, groundwater monitoring data, geo-environmental issues, and other relevant data, we have developed an evaluation index system for groundwater function zoning. This index system incorporates the resource supply function, geo-environmental stability function, and ecological environment function. The aim is to promote the sustainable development of groundwater in the study area. The findings of this study provide valuable insights for the planning and management of groundwater resources in the Jining City planning area.

2. Materials and Methods

2.1. Study Area

The study area is located in the central part of Jining City, Shandong Province, spanning from 115°54′ E to 117°06′ E longitude and 34°25′ N to 35°55′ N latitude. It covers a total area of 3561.29 km2. Geologically, the study area is situated at the transition zone between low mountains and hills and the plain, belonging to the North China block depression zone. The topography of the region mainly consists of plains and depressions, with higher elevation in the east and lower elevation in the west. The study area falls within the East Asian temperate monsoon climate zone, characterized by distinct four seasons climatically. In summer, it is influenced by maritime air masses, resulting in high temperatures and abundant rainfall. In contrast, in winter, it is affected by polar continental air masses, leading to dry and cold weather. The average annual temperature ranges from 13.3 °C to 14.1 °C, with an average annual precipitation of around 597–820 mm [55,56]. The eastern part of the study area comprises bedrock mountains, while the central part consists of alluvial plains. The loose rock deposits originate from different transportation and deposition environments, resulting in diverse groundwater occurrences, migration conditions, and hydrochemical environments. Based on the nature of the aquifers and the age of the strata, two major types can be distinguished: Quaternary–Neogene loose rock pore water and Cambrian–Ordovician fractured rock karst water, representing the primary aquifers. The main source of groundwater recharge is atmospheric precipitation, and the main methods of groundwater discharge are artificial extraction and evaporation [57]. Land subsidence is a significant geo-environmental issue in the study area, posing threats to the safety and normal operation of municipal pipelines such as water supply and gas. It can also impact the safety and normal operation of underground transportation engineering facilities such as subways by altering their slope. Land subsidence is widespread in the study area, occurring in most areas (Figure 1).

2.2. Technical Route

This study conducts an assessment of groundwater functional zoning in the study area, considering the resource supply function, geo-environmental stability function, and ecological environment protection function (Figure 2). The basic data used in the study were obtained from different sources (Table 1).

2.3. Analytic Hierarchy Process

The AHP is an analytical method for dealing with multi-objective decision making proposed by Saaty at the University of Pittsburgh [58]. The AHP decomposes complex problems into multiple levels and utilizes a pairwise comparison approach on a 1–9 scale to establish a judgment matrix (Table 2). The consistency index (CI) is calculated using Formula (1), and a smaller CI value indicates higher consistency. N represents the order or size of the matrix. The random index (RI) value is obtained from Table 3. The CR (consistency ratio) is a measure of the consistency of a matrix. λmax is the maximum eigenvalue of the matrix, and n is the unique non-zero eigenvalue. When the CR is less than or equal to 0.10, the inconsistency is considered acceptable. Otherwise, the comparison matrix needs to be revised, and the CR should be recalculated (Formula (2) [59].
C I = λ m a x n n 1
C R = C I R I

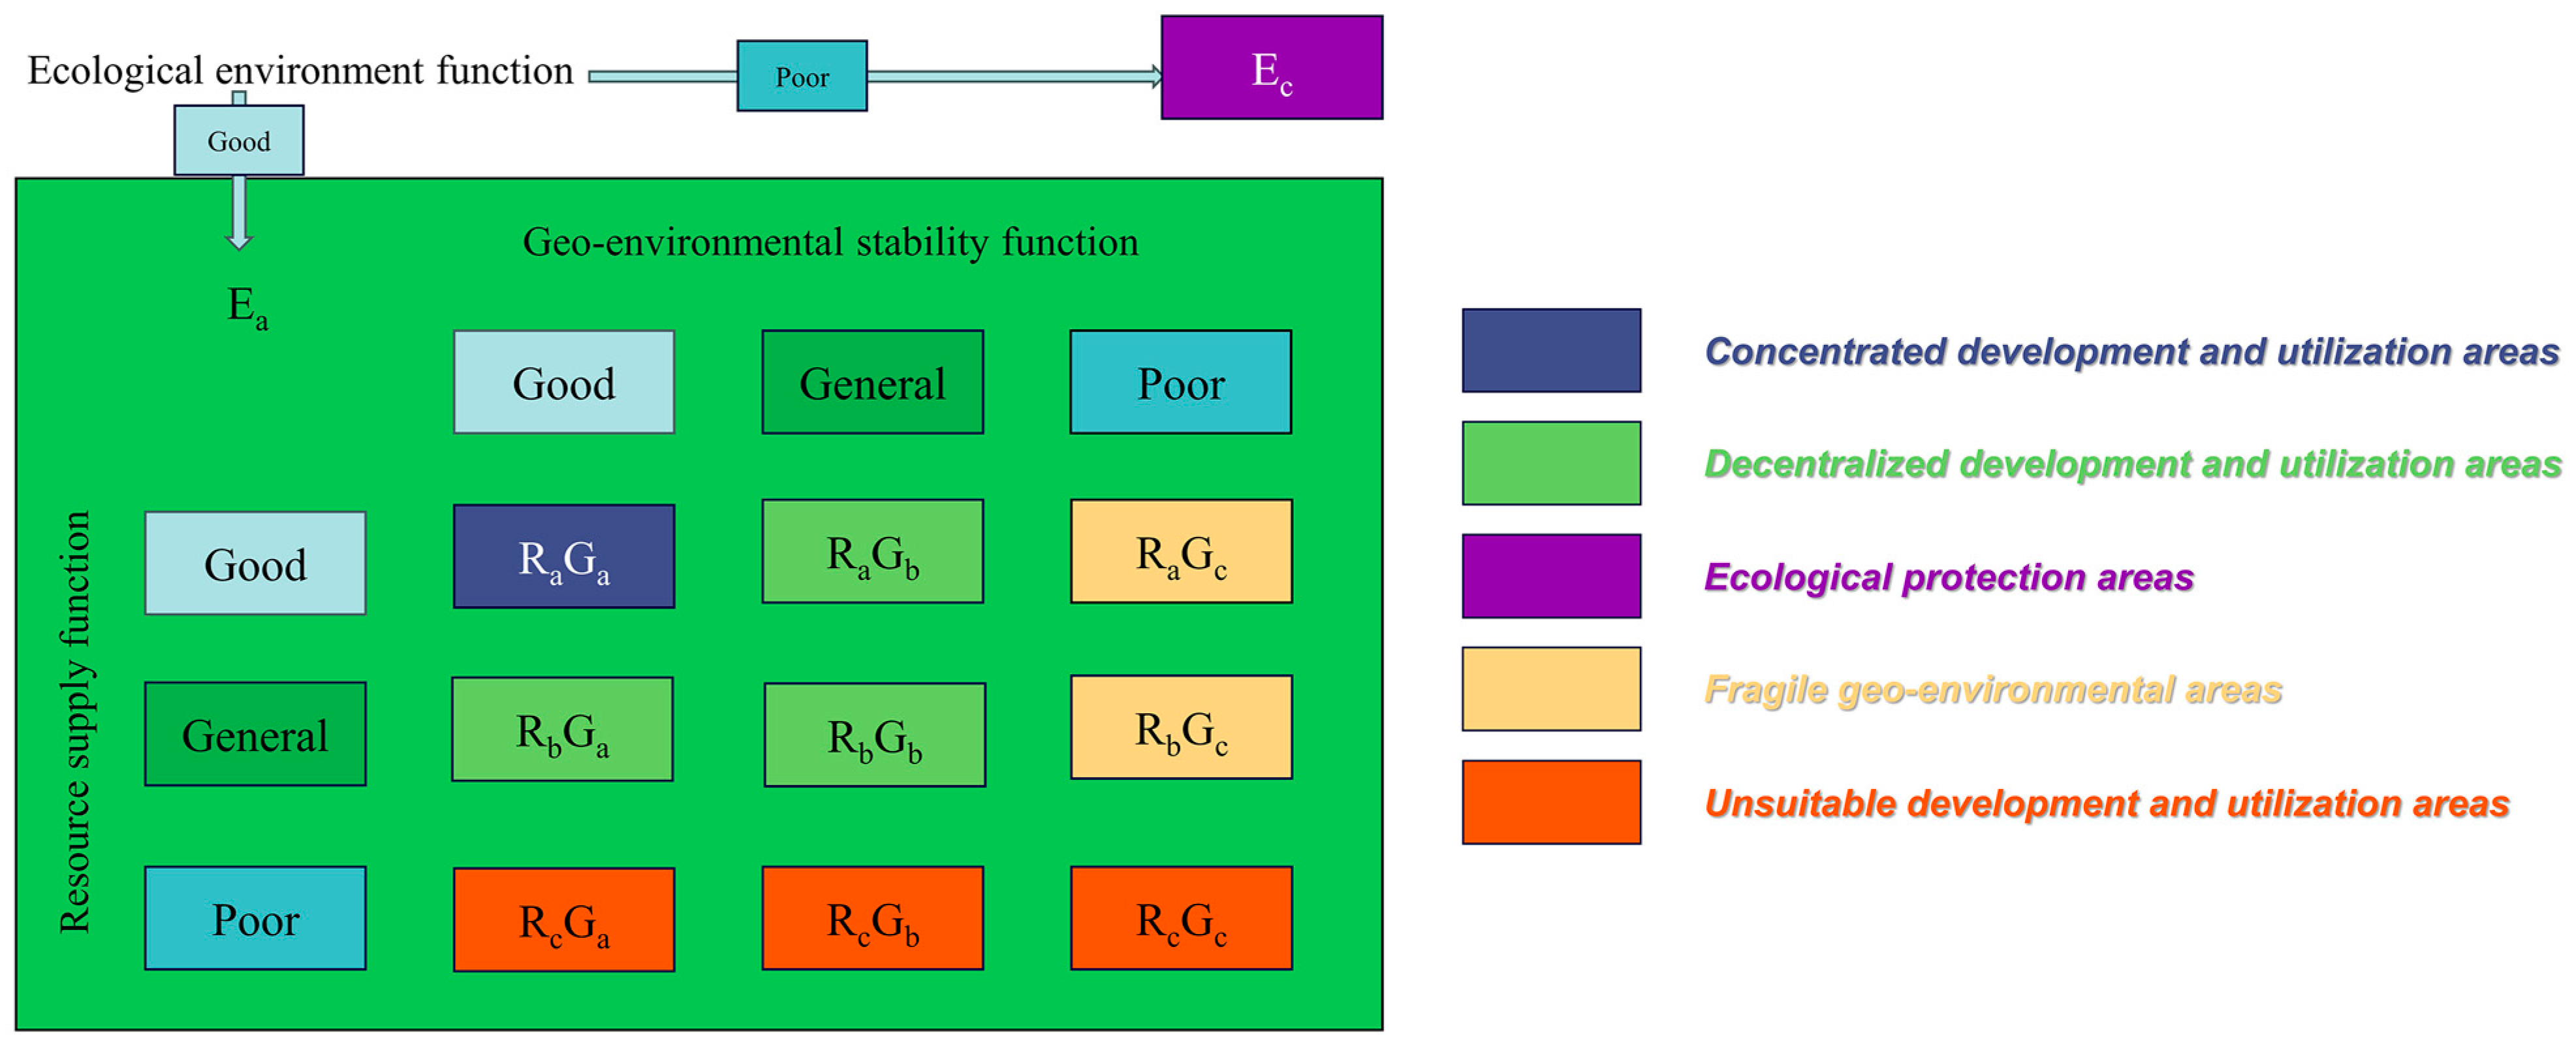
2.4. Principle of Comprehensive Zoning for Groundwater Functions

The functions of groundwater can be categorized into three components: the ecological environment function, geo-environmental stability function, and resource supply function. These components were analyzed through overlay analysis, resulting in the classification of the geo-environmental stability function and resource supply function into three levels: good, general, and poor. The ecological environment function was classified into two levels: good and poor. It is widely recognized that the ecological environment function plays a critical role in the sustainable development and management of groundwater resources. Consequently, areas with a poor ecological environment function were designated as ecological protection areas, while areas with a good ecological environment function were designated as zones for groundwater development and utilization. When both the geo-environmental stability function and resource supply function were classified as “good,” the areas were designated as a concentrated development and utilization areas. When both components were classified as “general,” the areas were designated as a decentralized development and utilization areas. In areas with a poor groundwater resource supply function or inadequate geological environmental stability, the development and utilization of groundwater may result in issues such as groundwater scarcity, geological hazards, and disturbances to the ecological environment. Therefore, if the geo-environmental stability function was classified as “poor,” then the areas were considered a fragile geo-environmental areas. If the resource supply function was classified as “poor,” then the areas were deemed an unsuitable development and utilization areas. When both the resource supply function and geo-environmental stability function were classified as “poor,” the areas were also categorized as an unsuitable development and utilization areas (Figure 3).

2.5. Groundwater Function

2.5.1. Resource Supply Function

The resource supply function of groundwater plays a crucial role in ensuring the availability of groundwater resources under specific conditions of recharge, storage, and renewal. This function encompasses two essential aspects, water quantity and water quality, which are vital for the development and utilization of groundwater. Water quantity refers to the maximum sustainable volume of groundwater that can be extracted, considering the principles of the sustainable development and utilization of groundwater resources. On the other hand, water quality refers to the intrinsic characteristics of the groundwater resource itself, which are instrumental in ensuring the reliability and adequacy of the groundwater supply.

Groundwater Quantity
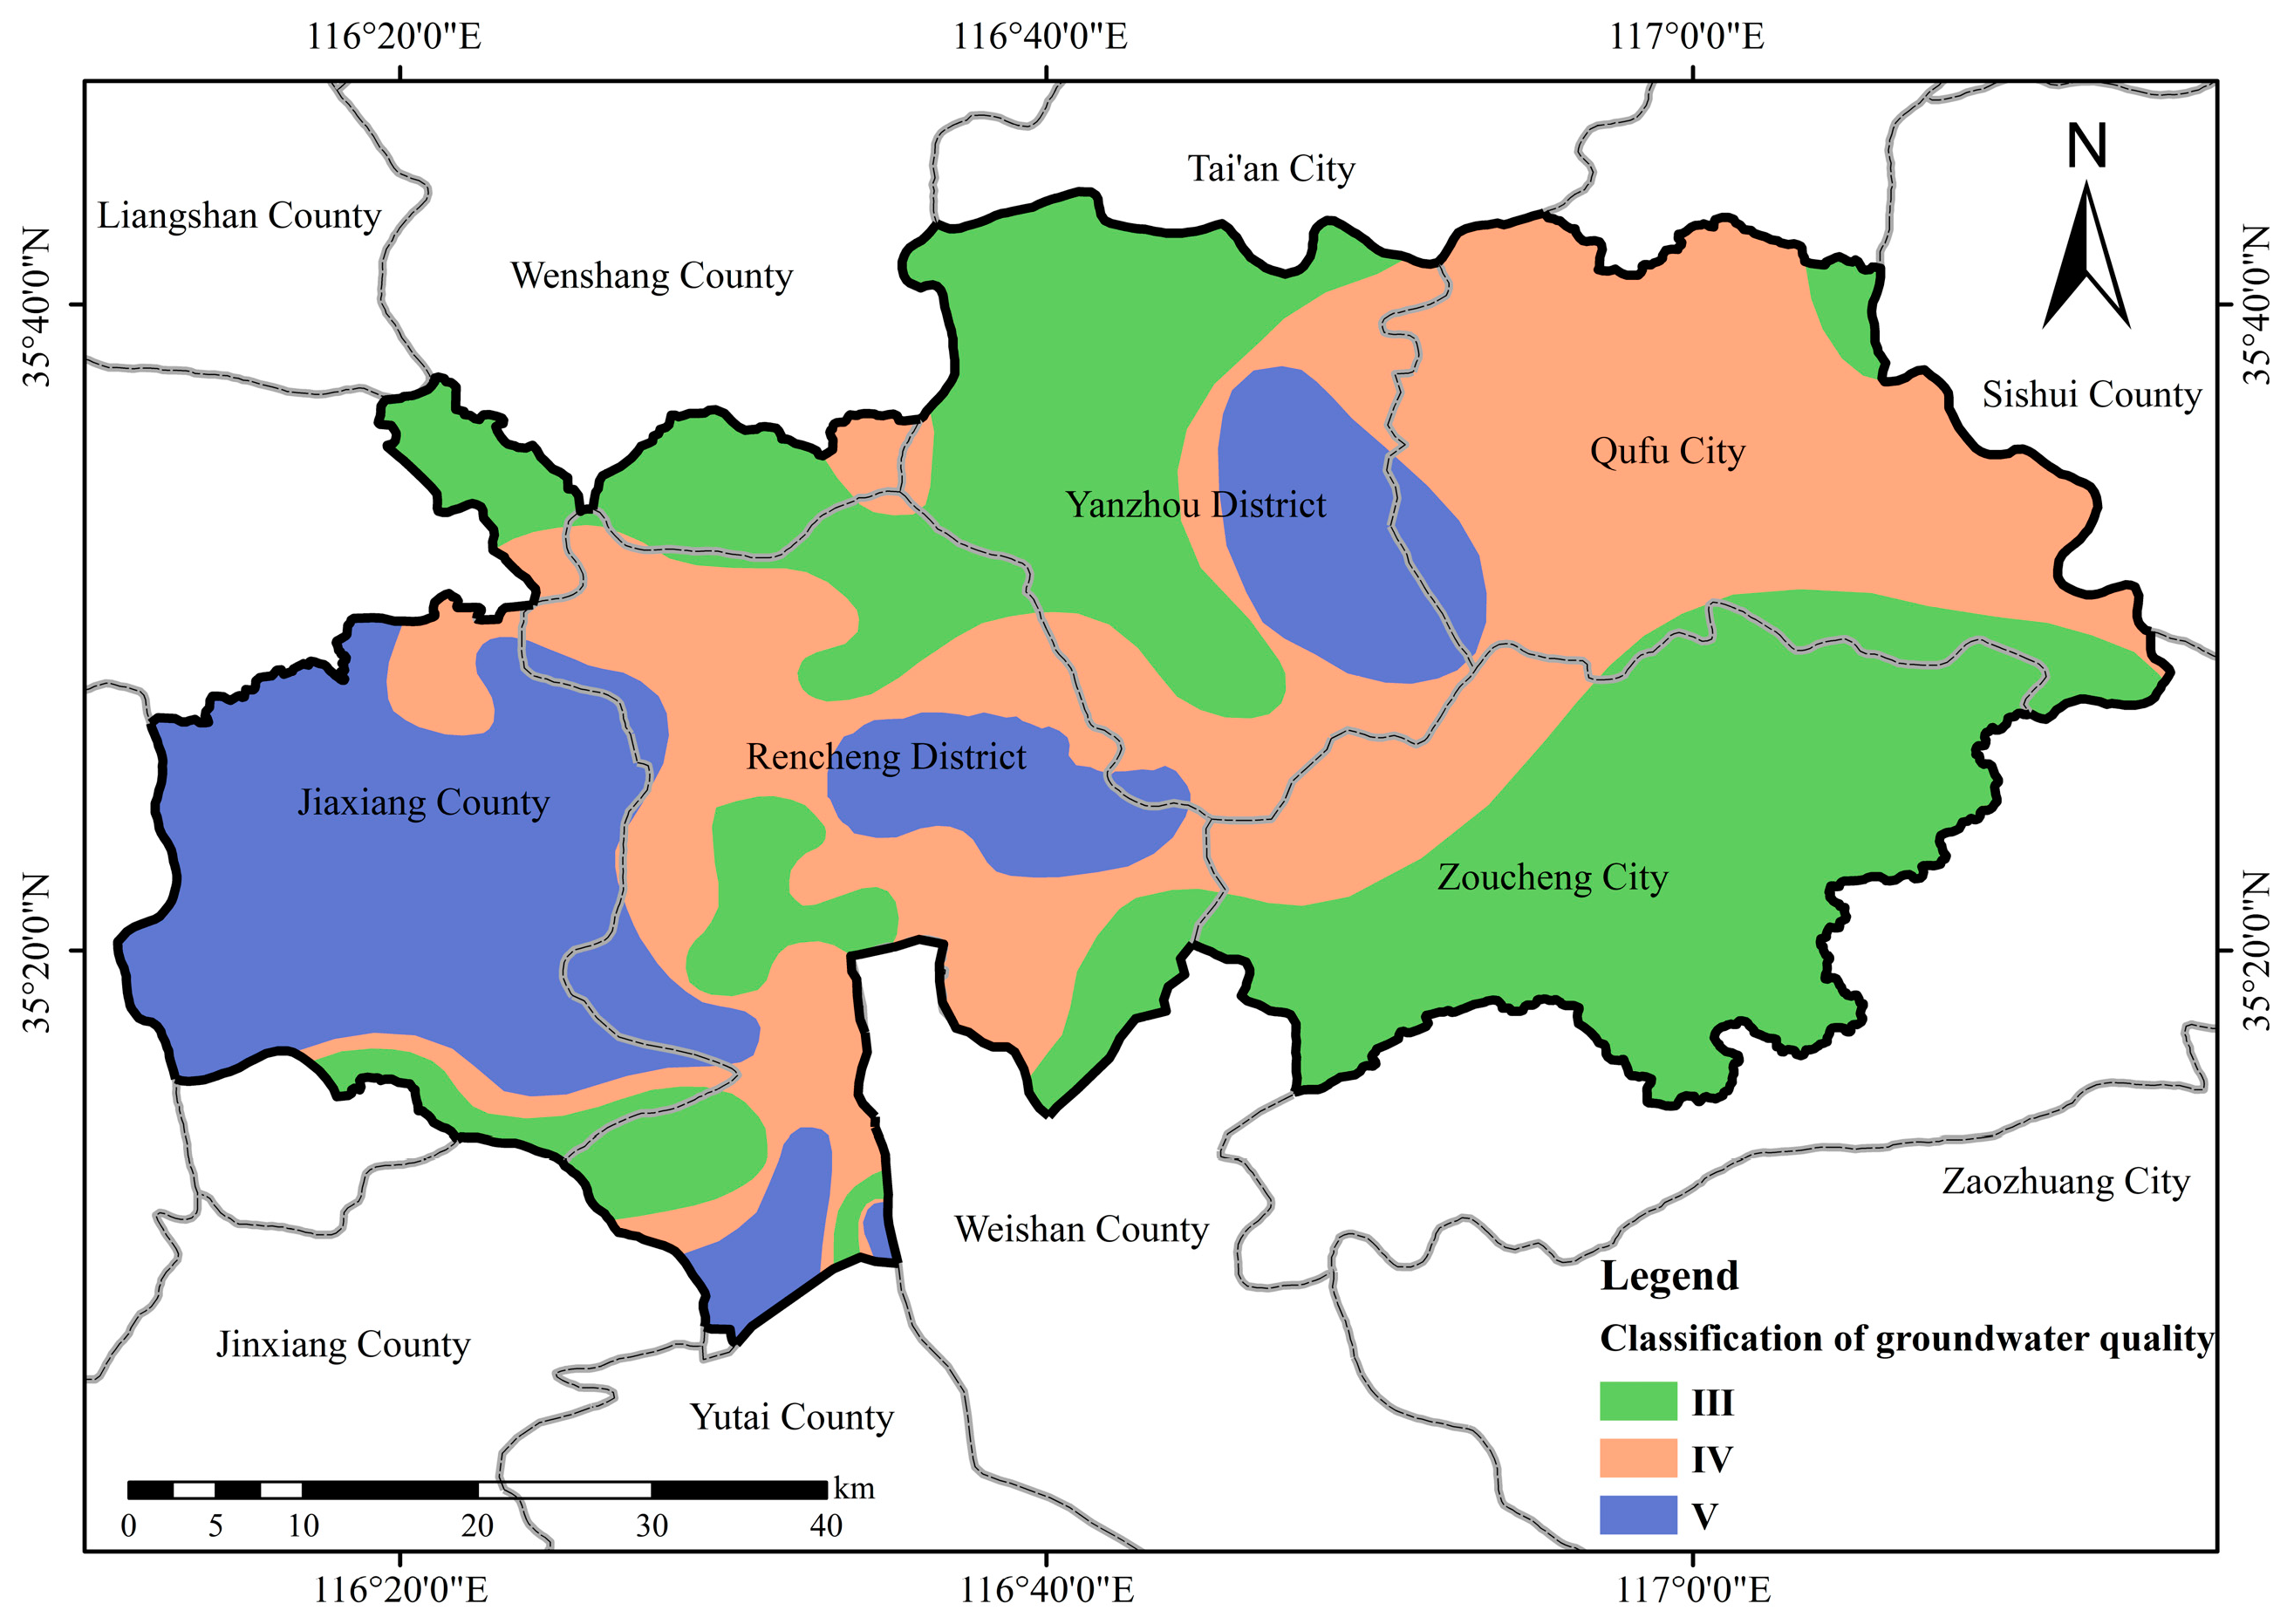
The modulus of groundwater exploitability (MGE) can describe the recoverability of groundwater, which is defined as the allowable abstraction of groundwater per unit area [60]. Based on the amount of shallow groundwater resources, mining technology level, and environmental conditions under the current conditions, and according to the mining conditions of groundwater aquifers in each administrative region, the MGE is calculated using the available coefficient method, as shown in Formula (3).
M G E = ( T R × ρ ) / H A
In the evaluation, TR is the total recharge of a single hydrological unit, including precipitation infiltration recharge, river seepage recharge, irrigation recharge, and overflow recharge; the unit is m3/a [60]. The exploitation coefficient is represented by ρ to estimate the amount of exploitable groundwater. HA represents the area of each hydrological unit, the unit is km2, and the division is based on administrative regions. Based on the calculated exploitable groundwater volume and the corresponding unit area for each hydrological unit, the MGE for each water resource division was derived using Equation (3). The results are summarized in Table 4.
The analysis of the calculation results revealed significant variations in the MGE across different administrative regions. Notably, Yanzhou District and Zoucheng City exhibited high MGE values, exceeding 16 × 104 m3/km2·a, indicating their potential for medium- to high-intensity groundwater exploitation. On the other hand, Rencheng District and other areas showed relatively lower MGE values, ranging between 5 ×  104 and 10 × 104 m3/km2·a. Although these values meet the minimum standards for regional groundwater exploitation, they may not be sufficient for large-scale exploitation (Figure 4).

Groundwater Quality

The key to the groundwater quality assessment lies in determining the groundwater quality indicators and classification standards. Different indicators and classification standards can affect the accuracy of the assessment results. In this study, the water quality data obtained from groundwater sampling points were evaluated using the comprehensive index method, in accordance with the “Standard for groundwater quality”. The groundwater quality assessment was categorized into Class III, Class IV, and Class V, with specific classification criteria detailed in Table 5. The main reason for poor water quality in the study area was the susceptibility of shallow groundwater to human surface activities. Factors such as surface sewage infiltration, pollutants from open rural waste disposal entering the groundwater during rainfall, and the leaching of non-point source pollutants such as pesticides and fertilizers from agricultural activities contributed to the degradation of shallow groundwater quality (Figure 5).

2.5.2. Geo-Environmental Stability Function

The geo-environmental function refers to the role of the groundwater system in supporting and protecting the surrounding geo-environment. In the study area, the Quaternary and Neogene deposits exhibit significant thickness and mainly consist of clayey soils with high compressibility and a large void ratio. Excessive groundwater extraction leads to a decline in the groundwater table, resulting in increased effective stress within the aquifer. This, in turn, causes the compaction of the geological formations and triggers land subsidence. This study focused on identifying the primary factors that influence land subsidence in the study area. Four key factors, namely the thickness of soft soil stratum, depth of groundwater, land use, and distance to the fault were selected as evaluation indicators for assessing the geo-environmental function [61].

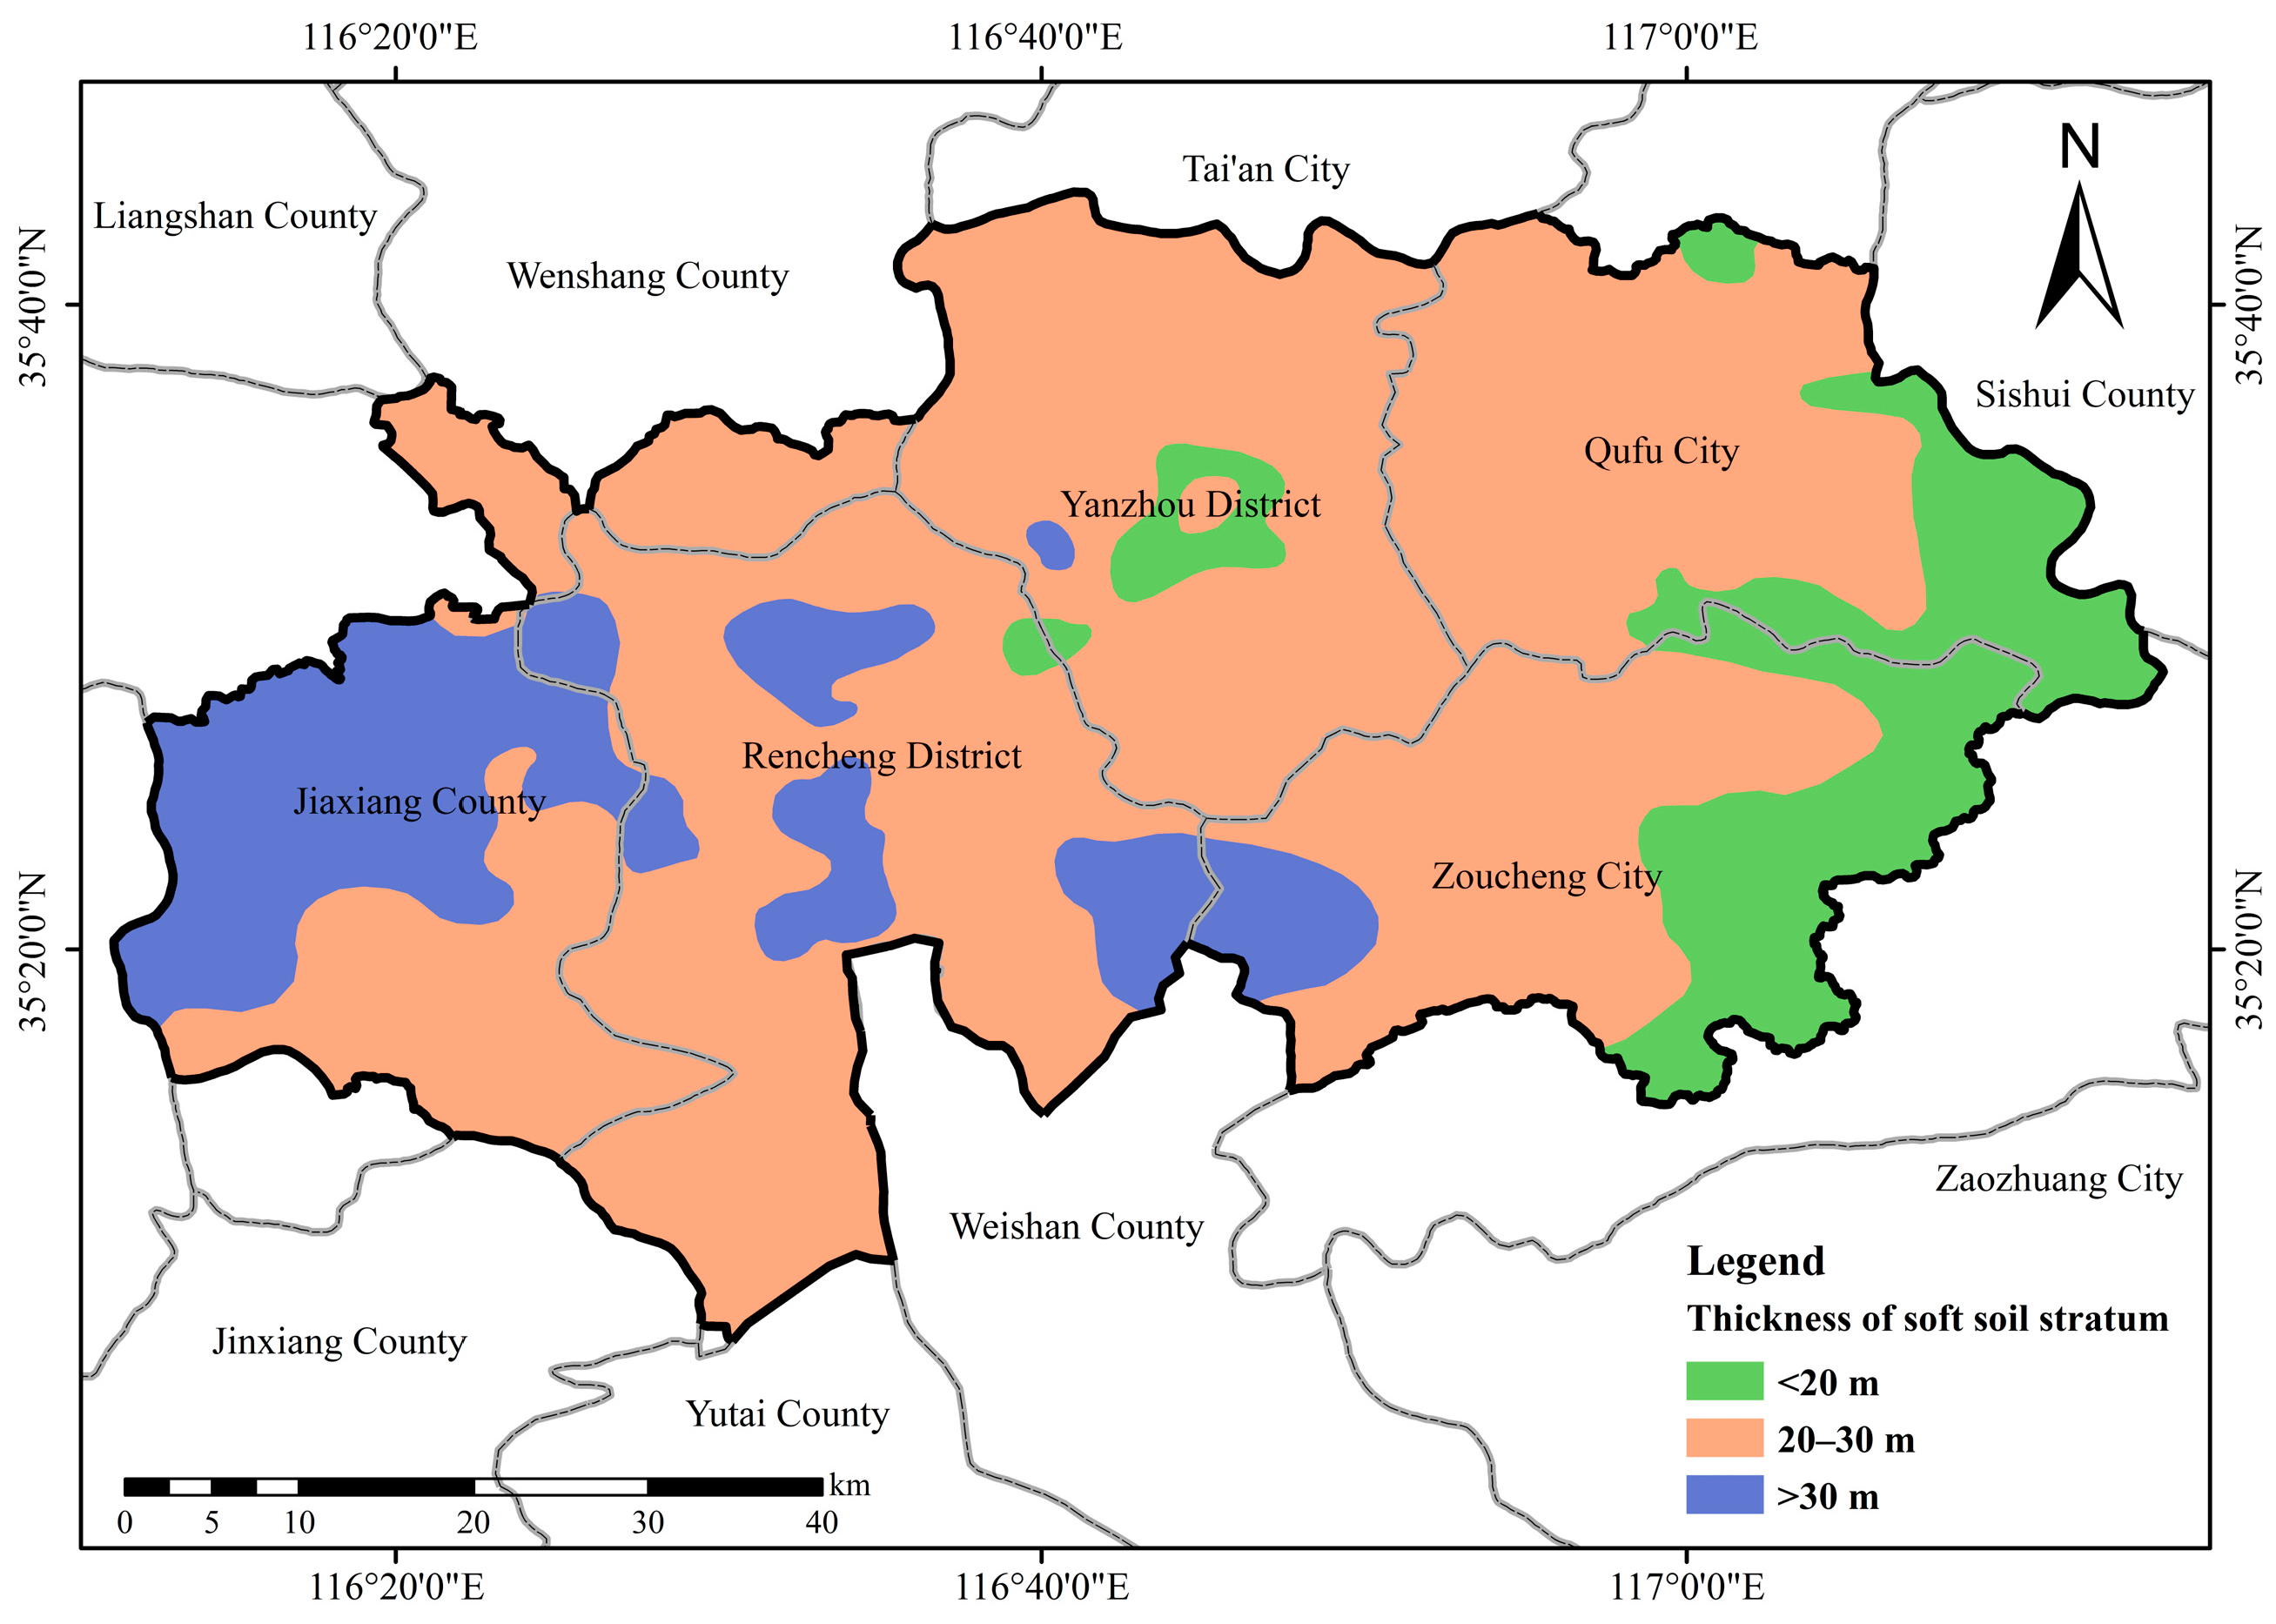
Thickness of Soft Soil Stratum (T)

The term “soft soil stratum” refers to the presence of clay and silty soil with characteristics such as a low consolidation degree, high compressibility, low mechanical strength, and a loose structure. The presence of soft soil is a critical factor contributing to land subsidence. Prolonged excessive groundwater extraction results in the dissipation of interstitial fluid pressure in the upper part of the aquifer, leading to land subsidence. The risk of land subsidence is higher when the soft soil stratum is thicker (Figure 6). In this study, the thickness of the soft soil stratum was classified into three grades: >30 m, 20–-30 m, and <20 m.

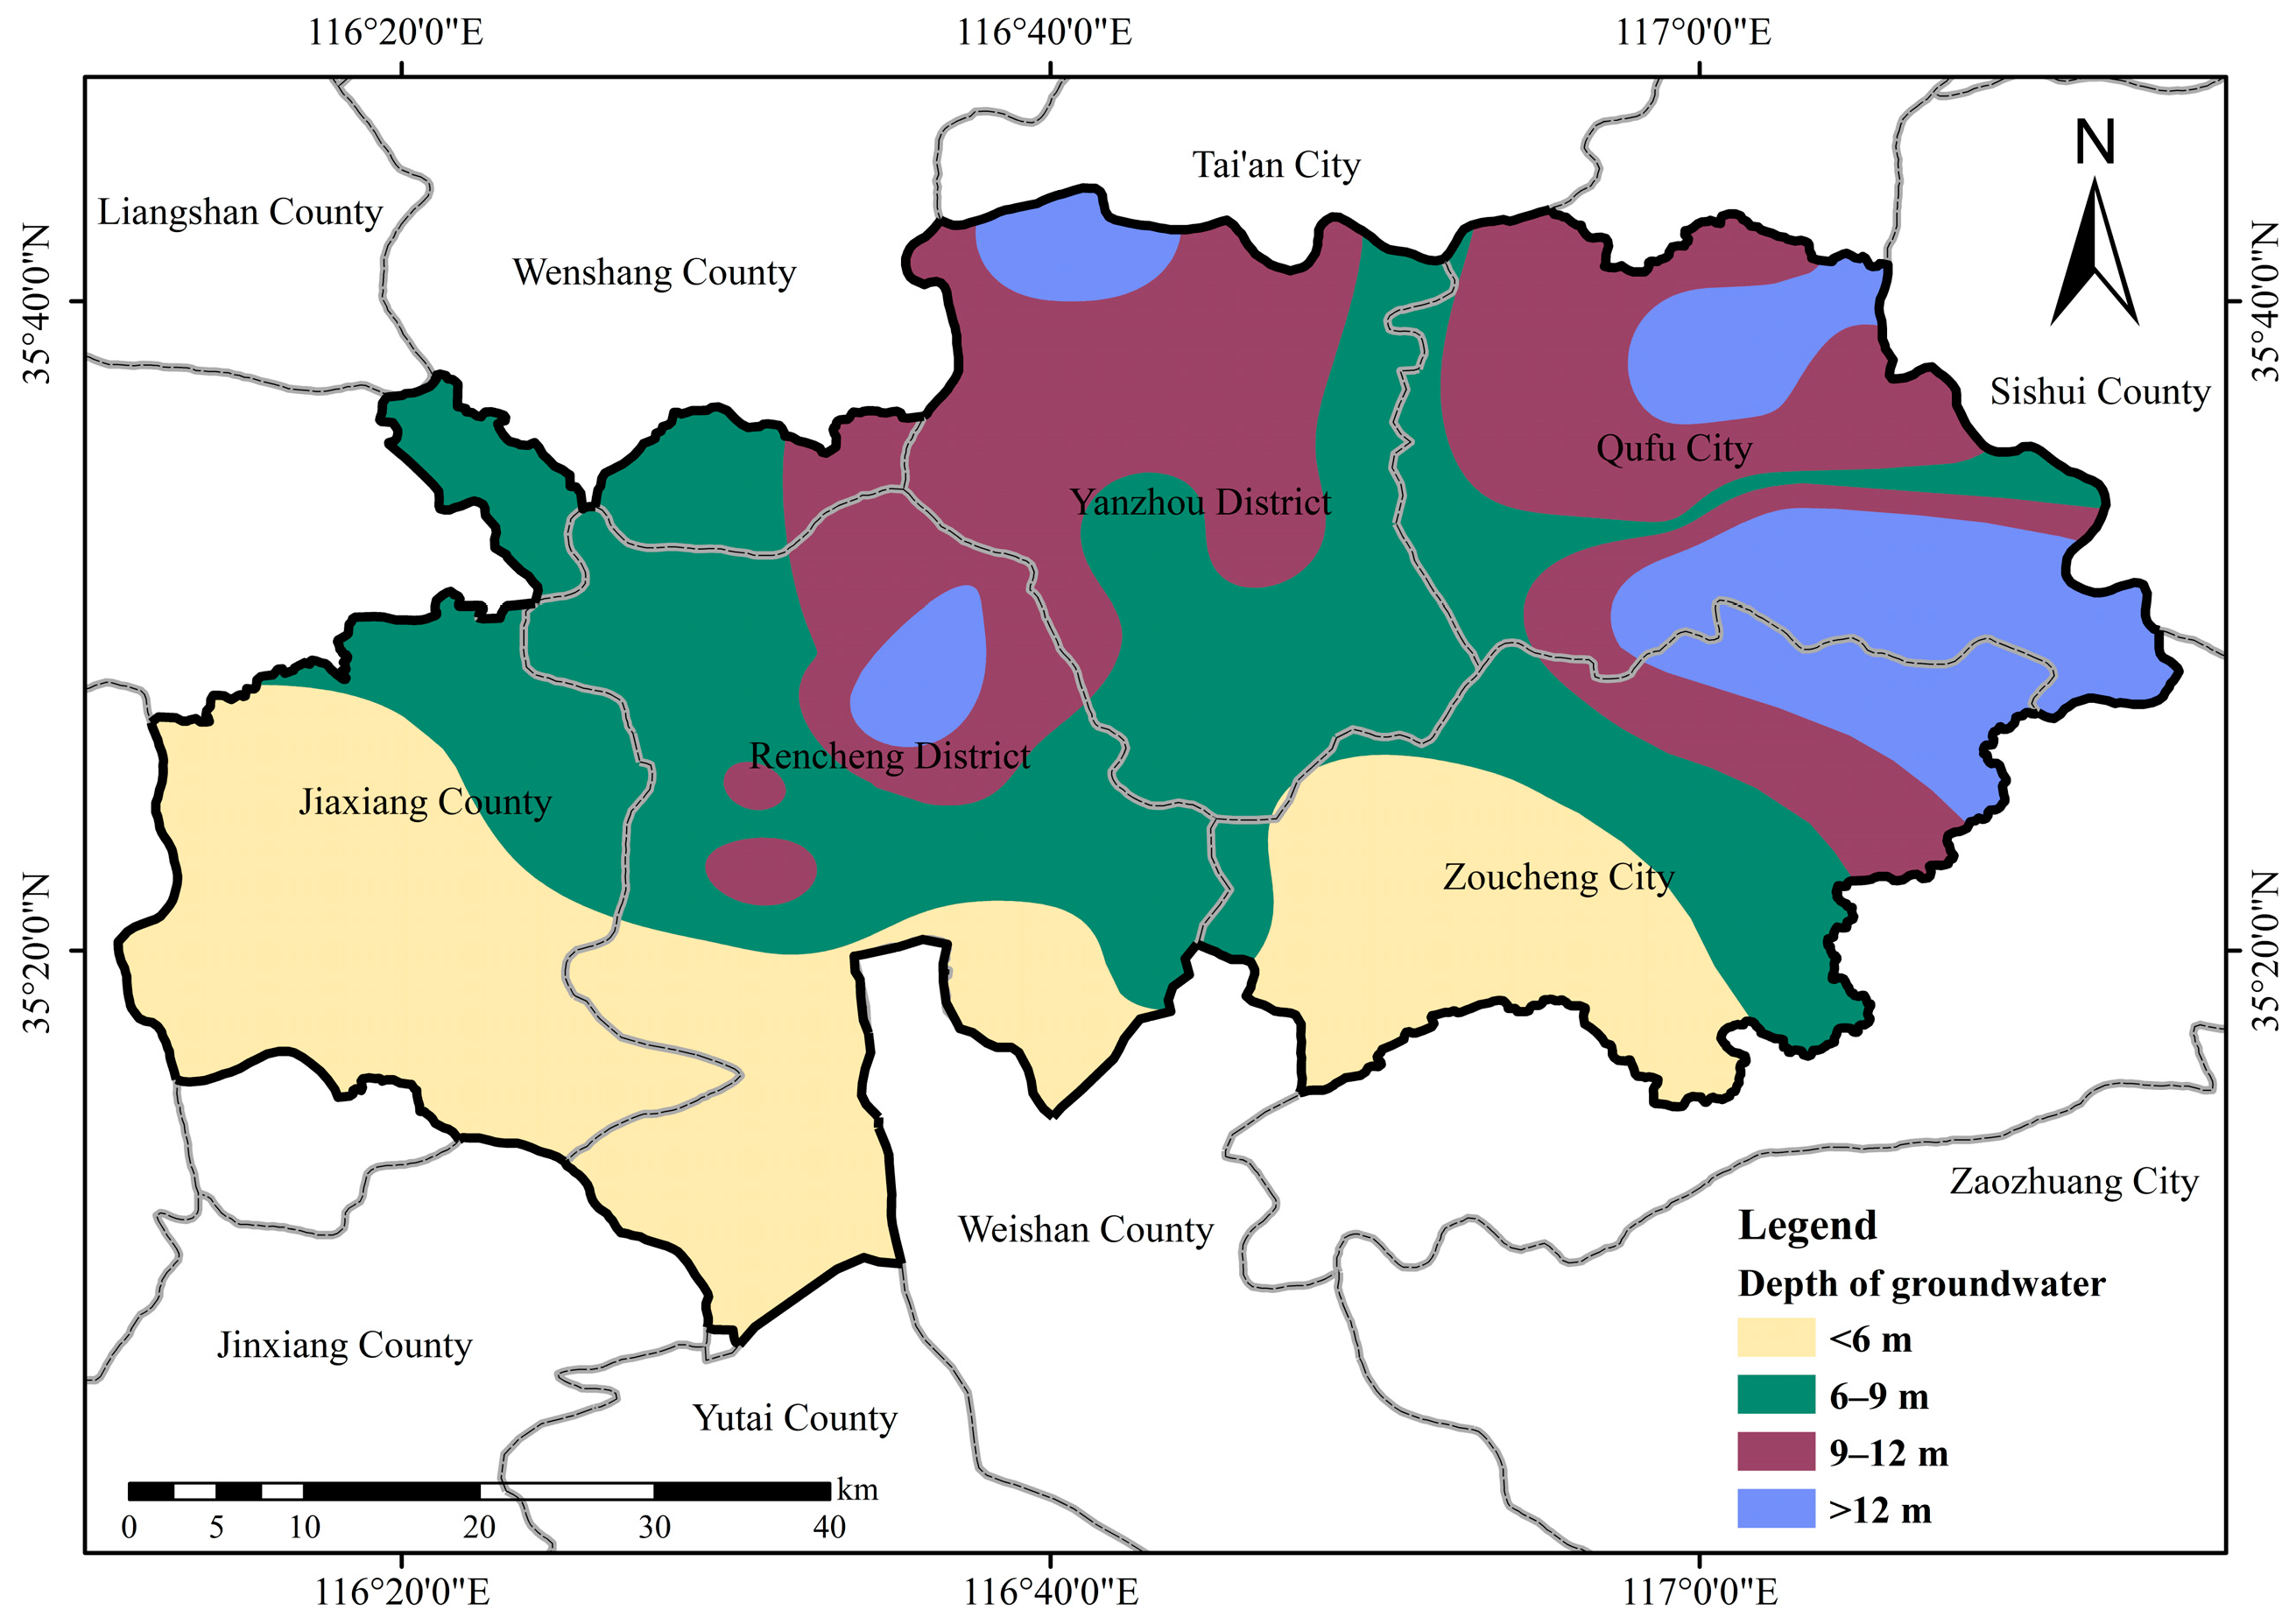
Depth of Groundwater (D)

Pore water pressure plays a vital role in mitigating external stress on the aquifer, thereby indicating the groundwater’s support capacity to the aquifer. A greater depth of groundwater indicates a higher susceptibility to land subsidence. In this study, the depth of groundwater was categorized into four grades: >12 m, 9–12 m, 6–9 m, and <6 m (Figure 7).

Land Use (U)

The land use status provides insights into the intensity of surface loading. Urban areas, characterized by a higher concentration of buildings and population, are more susceptible to land subsidence during groundwater pumping. In this study, land use types in the study area were categorized into three groups based on the distinction between urban and rural land uses: concentrated urban construction areas, dispersed town construction areas, and no-construction areas (Figure 8).

Distance to Fault (F)

Ground subsidence is strongly influenced by geological faults, as faults can impact the strength and permeability of rocks and soils. Fault zones, being active tectonic areas, are more susceptible to ground subsidence, particularly when they are in close proximity to faults. To assess the impact of faults on ground subsidence, the distances to faults were classified into four levels using the Euclidean distance method: <200–500 m, 500–1000 m, 1000–1500 m, and >1500 m. Areas within 200–500 m of the fault were categorized as areas with low stability. For faults of the third level, the areas within 500 m of the fault were considered areas with low stability. In urban areas, the areas within 300 m of the fault were designated as low-stability areas, while for other major structural units, the zone within 200 m of the fault was classified as low-stability areas. The areas within 1000 m of the fault were considered areas with lower stability, while the areas within 2000 m of the fault were categorized as areas with relatively stable conditions. The remaining areas in the study area were classified as stable areas (Figure 9).

2.5.3. Ecological Environment Function

The ecological environment function encompasses the crucial role and impact of the groundwater system in preserving the integrity of surface vegetation, lakes, wetlands, and land quality. Groundwater, as an integral component of the ecological environment system, exhibits a mutually dependent relationship with ecosystems [62]. The unsustainable exploitation of groundwater can result in a decline or even loss of vital ecosystem services. The maintenance of ecosystem structure, composition, and functionality relies on an adequate supply of groundwater, while surface water acts as a vital support and recharge source for groundwater [63,64]. Water resources are a crucial component of ecosystems, playing a key role in maintaining ecological balance, safeguarding biodiversity, and promoting sustainable development. Ecological protection indicators are used to assess the integrity, stability, and biodiversity of ecosystems, aiding in the protection and maintenance of their natural state and biodiversity. The application of indicators for water conservation and ecological protection in ecological environment assessments can provide a better understanding of and protection for the water resources and ecological functions of ecosystems, serving as a basis for environmental conservation and sustainable development. Therefore, in this study, we selected water conservation and ecological protection as the evaluation indicators for ecological environmental protection functions. By selecting water sources such as rivers and lakes related to water conservation and ecological protection, and categorizing them based on their different attributes, we established zones for water conservation and ecological protection.

Water Conservation

The water conservation indicators are specifically defined for rivers, lakes, and reservoir-type drinking water sources. The process of identifying and integrating upstream tributaries is based on geographic spatial data and GIS (Geographic Information System) technology. It involves analyzing hydro-geographical features within the watershed to determine the tributaries that merge with the main river. The establishment of specific lengths and distances for the primary and secondary protection zones of river and reservoir-type drinking water sources is based on the principles of safeguarding water source security and ensuring the quality of drinking water. These protection zones are designed to minimize the potential impact of pollution sources on water bodies and to ensure the safety and reliability of the water supply. This determination is specifically guided by the “Technical guideline for delineating source water protection areas”. In the case of river origins and reservoir-type drinking water sources, the first-level protection zone is established along the watercourse, with a minimum length of 1000 m upstream of the water intake and 100 m downstream. The second-level protection zone extends from the upstream boundary of the first-level protection zone, including any merging upstream tributaries, with a minimum length of 2000 m. The outer boundary of the second-level protection zone must be at least 200 m away from the boundary of the first-level protection zone. For first-level surface reservoir drinking water sources and their buffer zones, the delineation method involves a radius of 500 m from the water intake. The second-level protection zone for reservoirs is defined as the area above the normal water level, outside the first-level protection zone, within a horizontal distance of 2000 m (Figure 10).

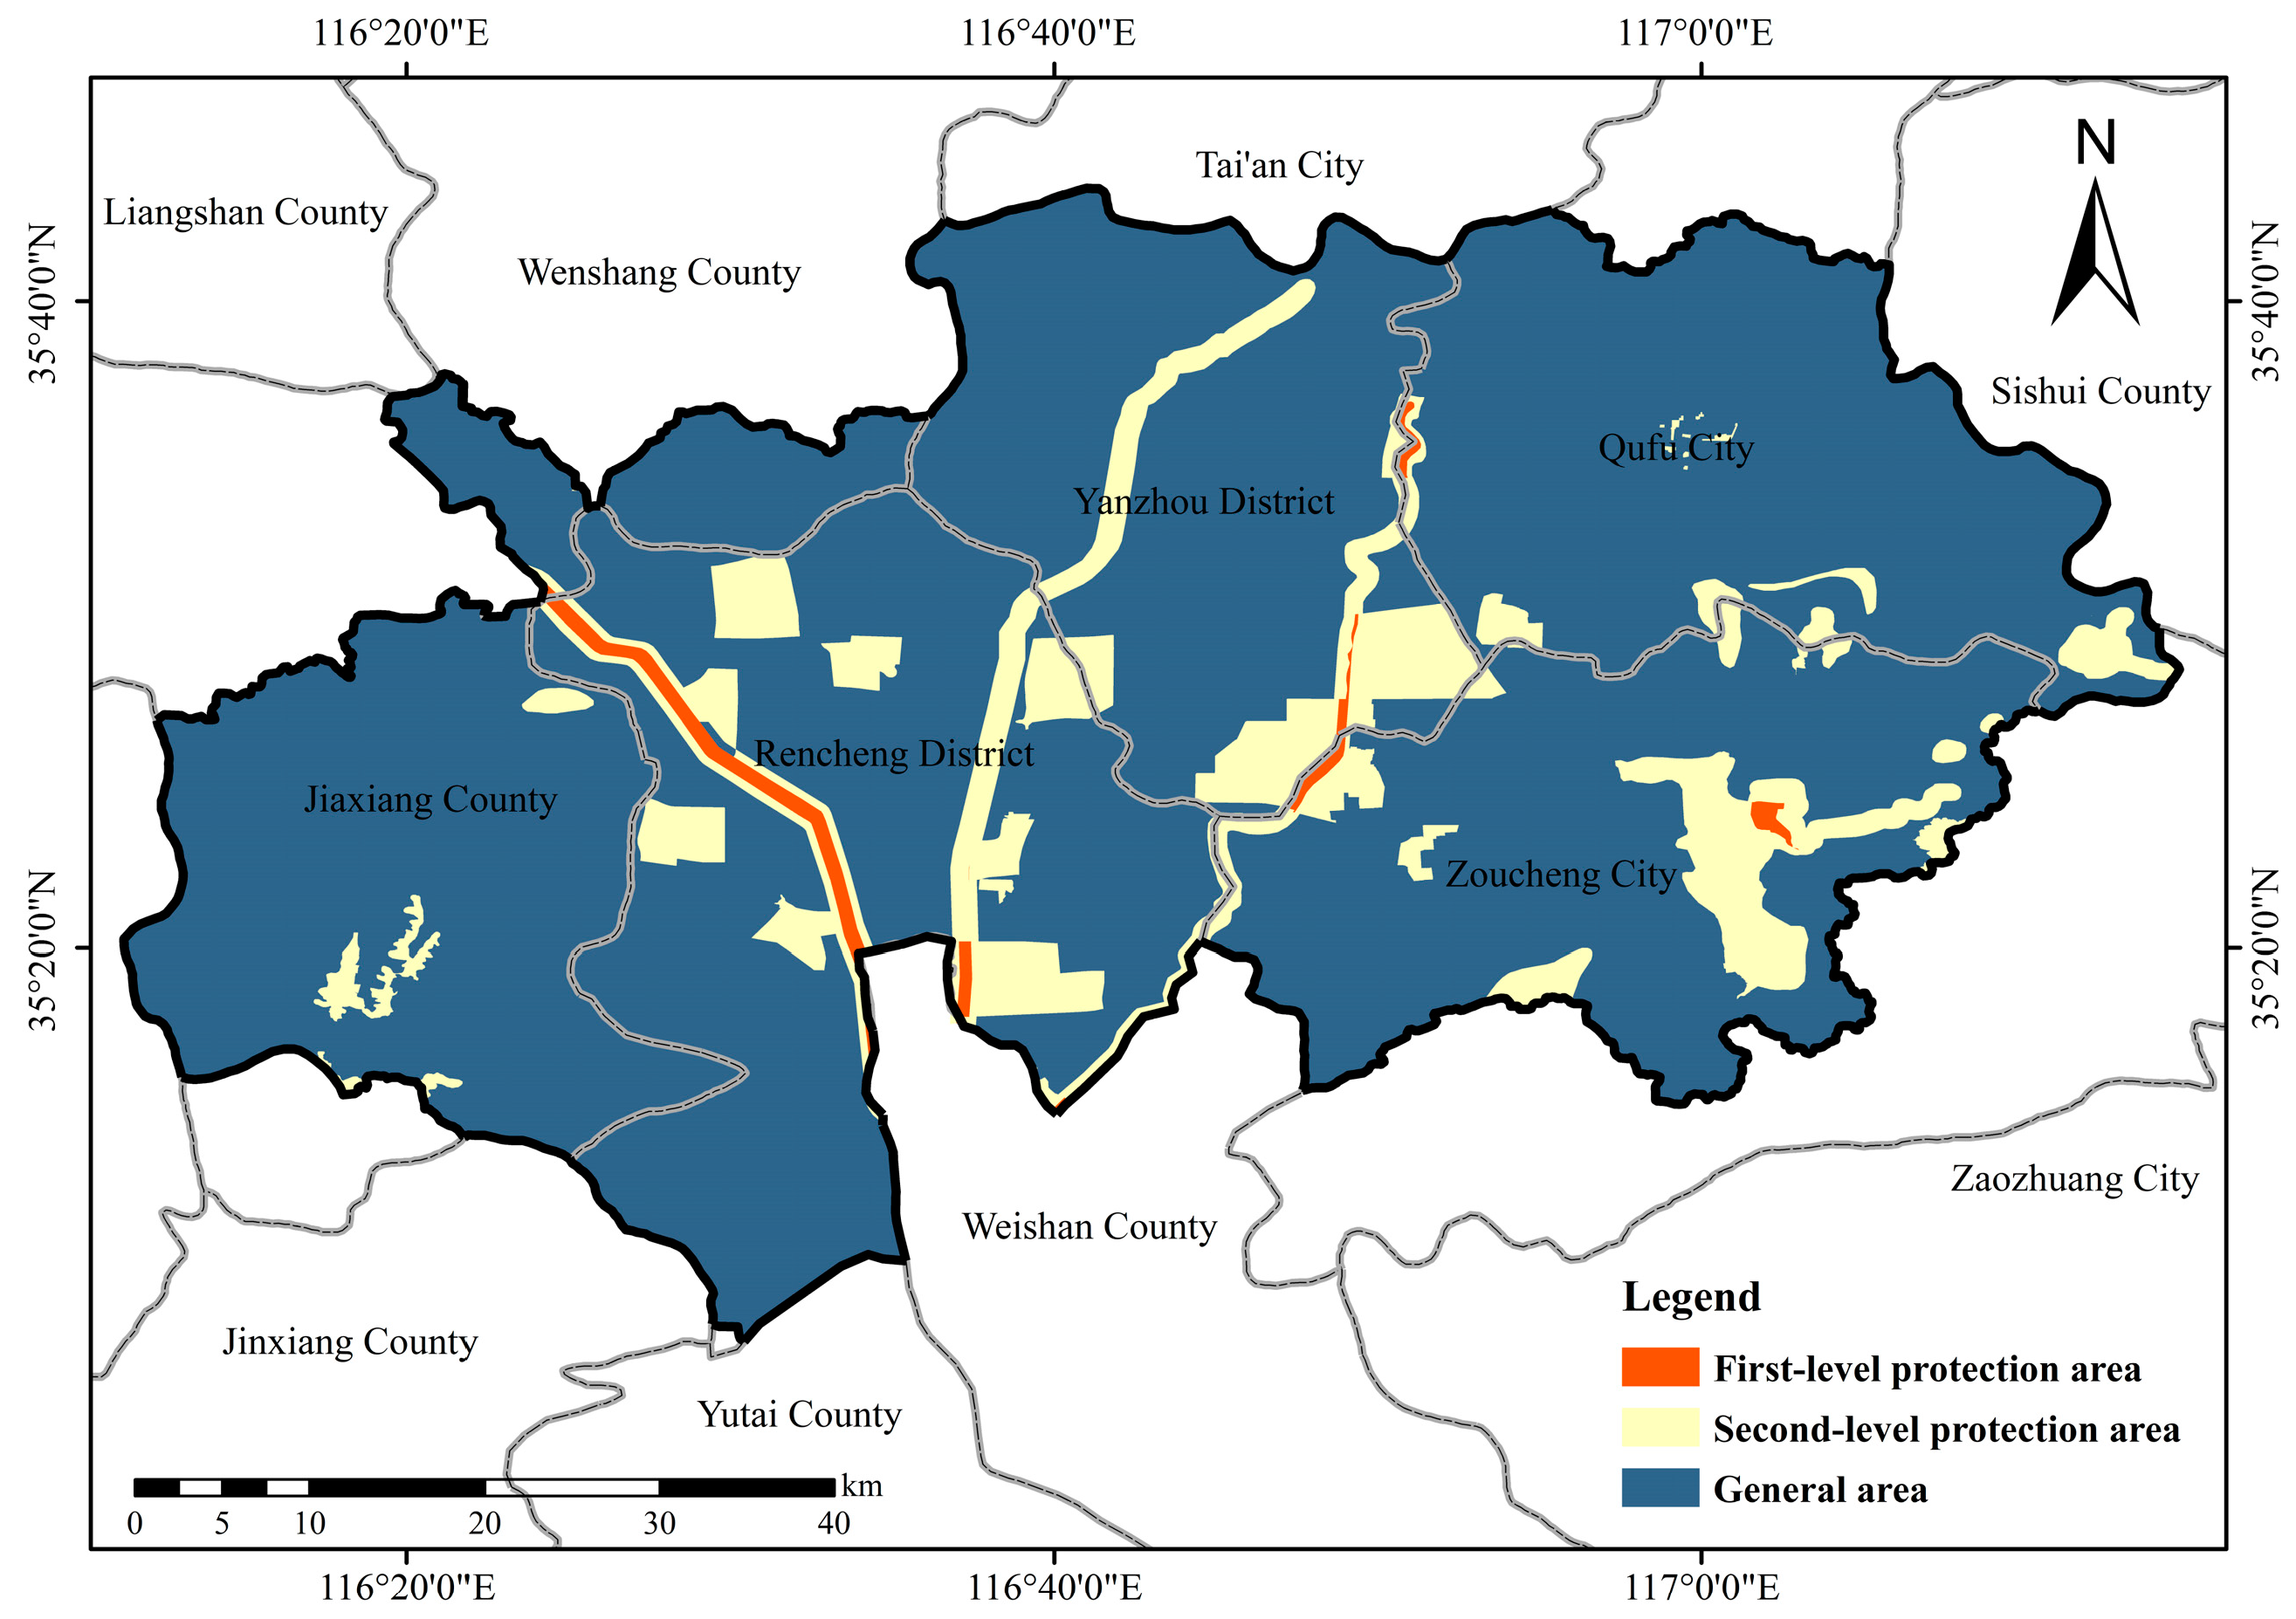
Ecological Protection

Ecological protection areas are established by national, provincial, and municipal authorities to safeguard exceptional natural environments, preserve valuable natural resources, and conserve essential ecosystems that serve specific and significant ecological functions. In this study, the ecological protection area within the study site was designated as an important zone, while the remaining areas were classified as general zones (Figure 11).

3. Results

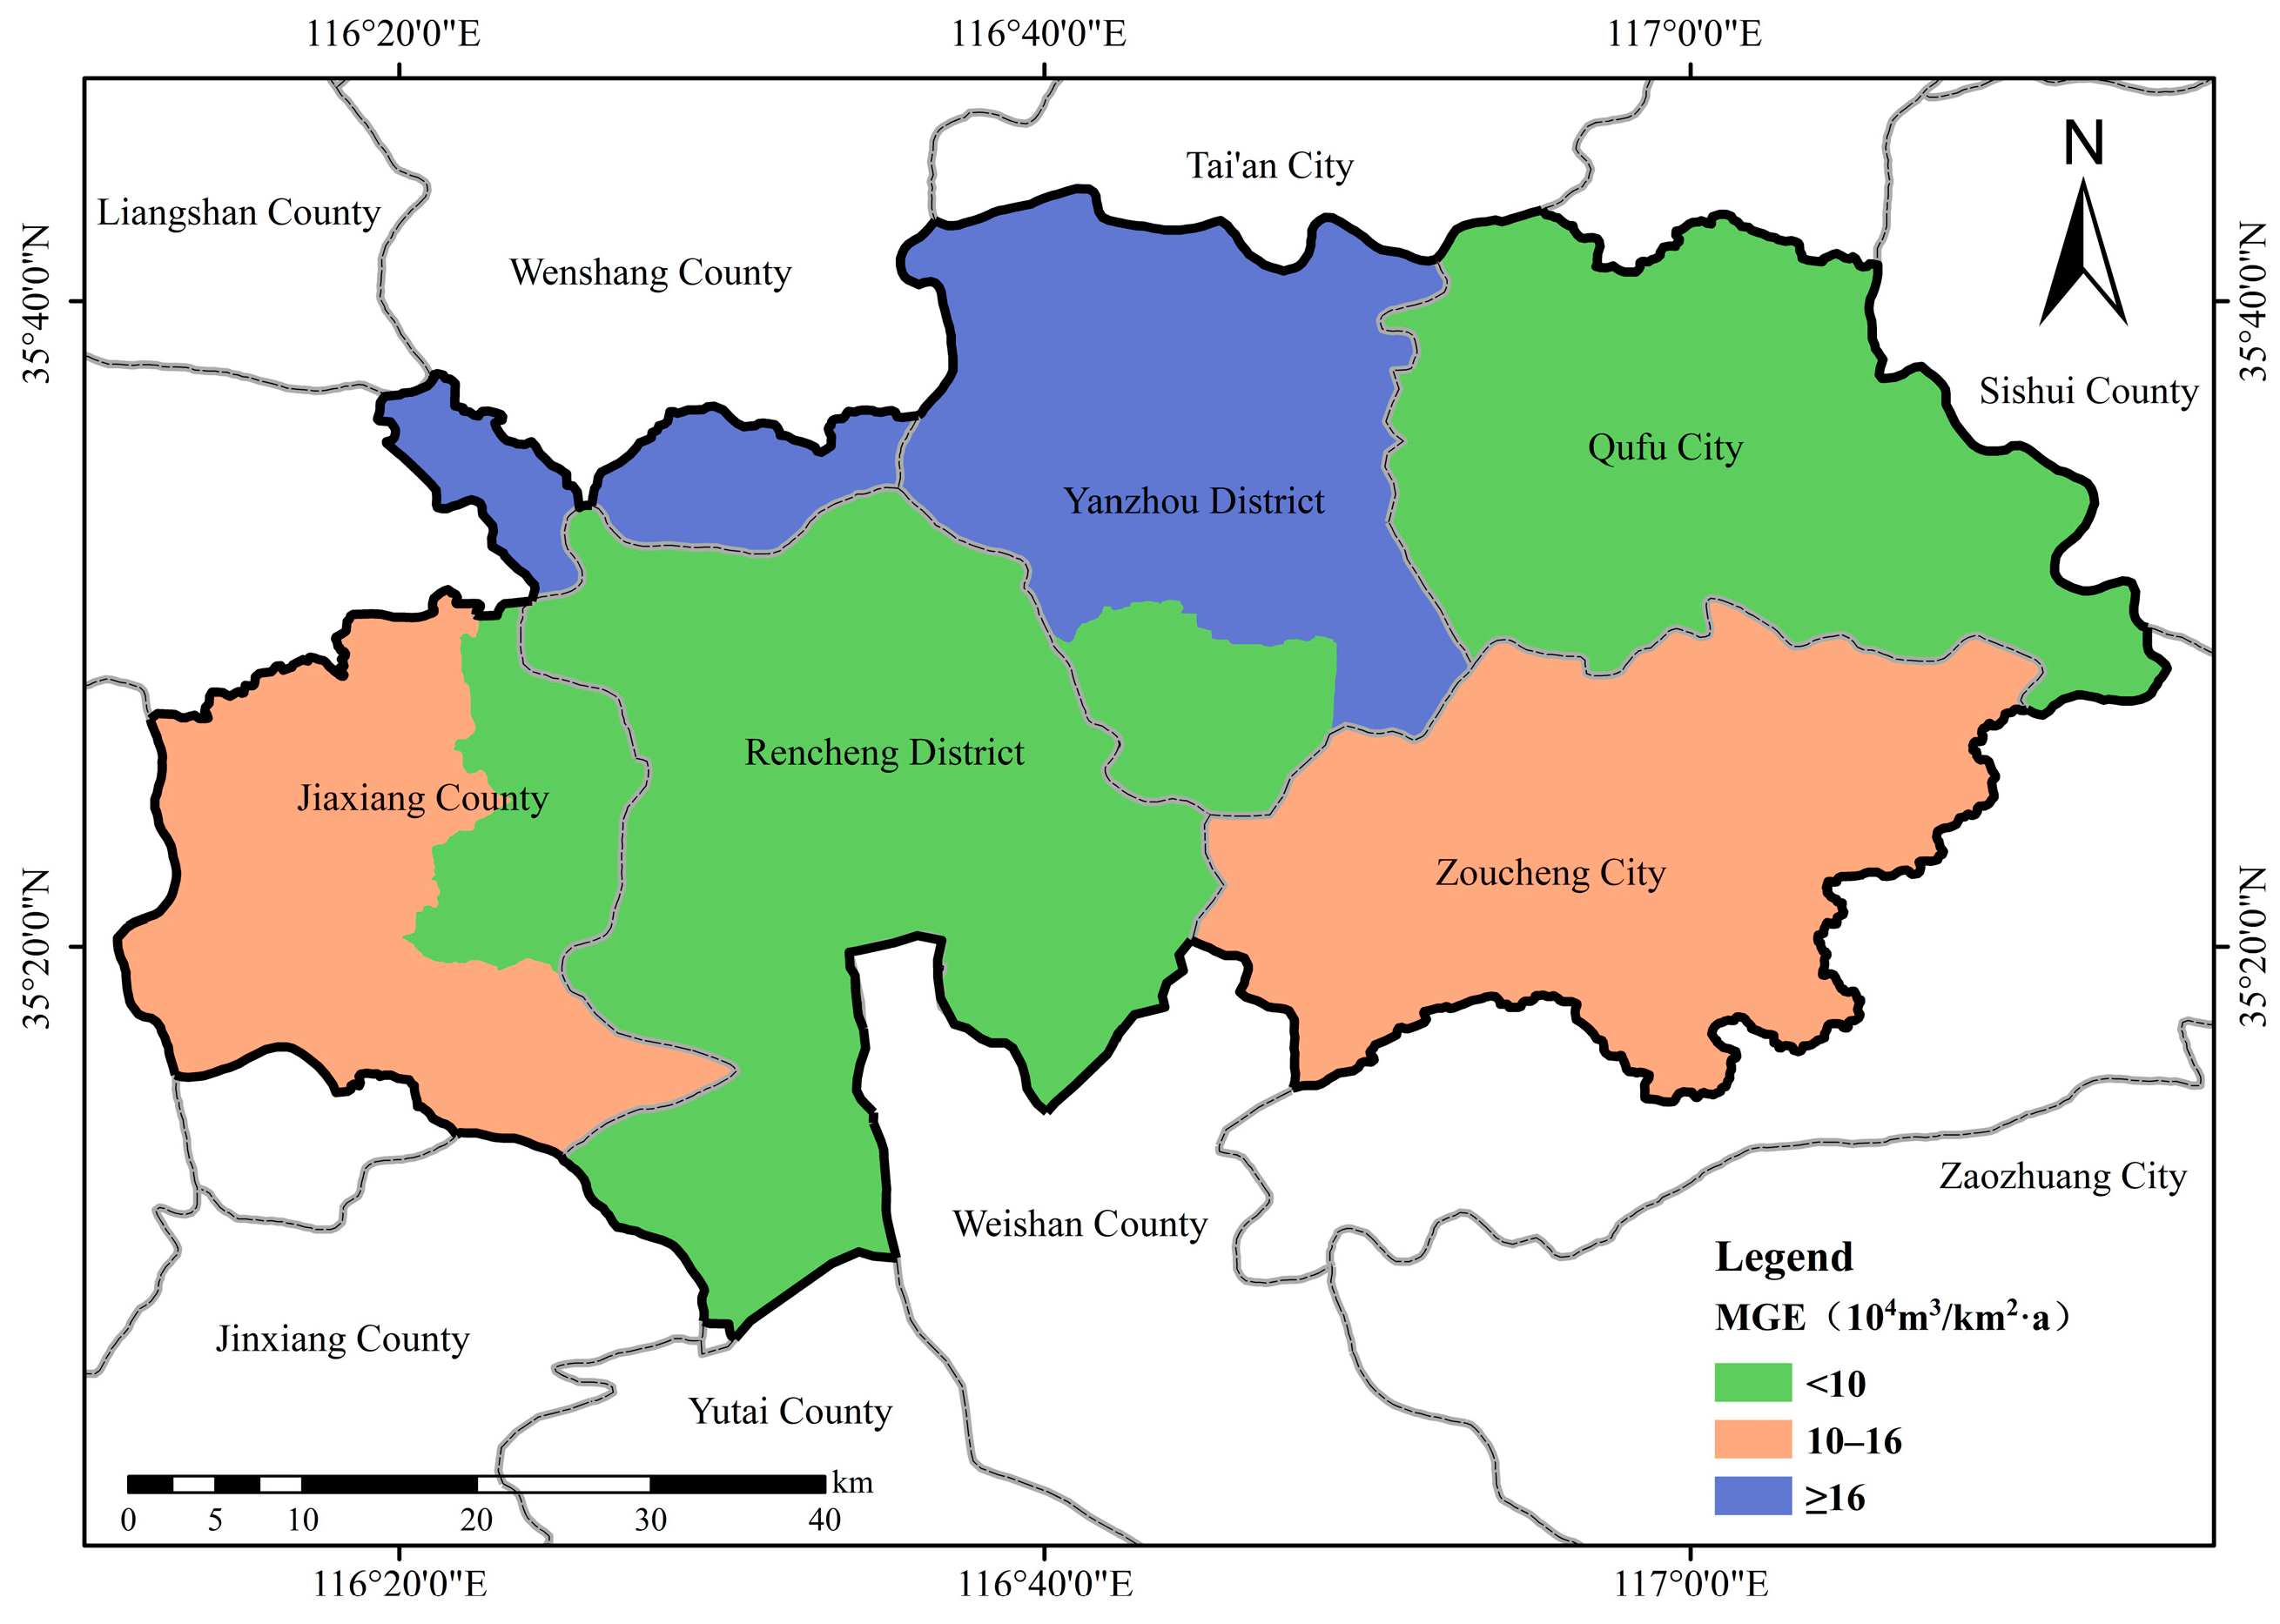
3.1. Resource Supply Function

By applying the “barrel effect” methodology, the assessment results of groundwater quantity and groundwater quality in the study area were integrated and visualized, leading to the subdivision of the study area into centralized development areas, decentralized development areas, and prohibited development areas (Figure 12).

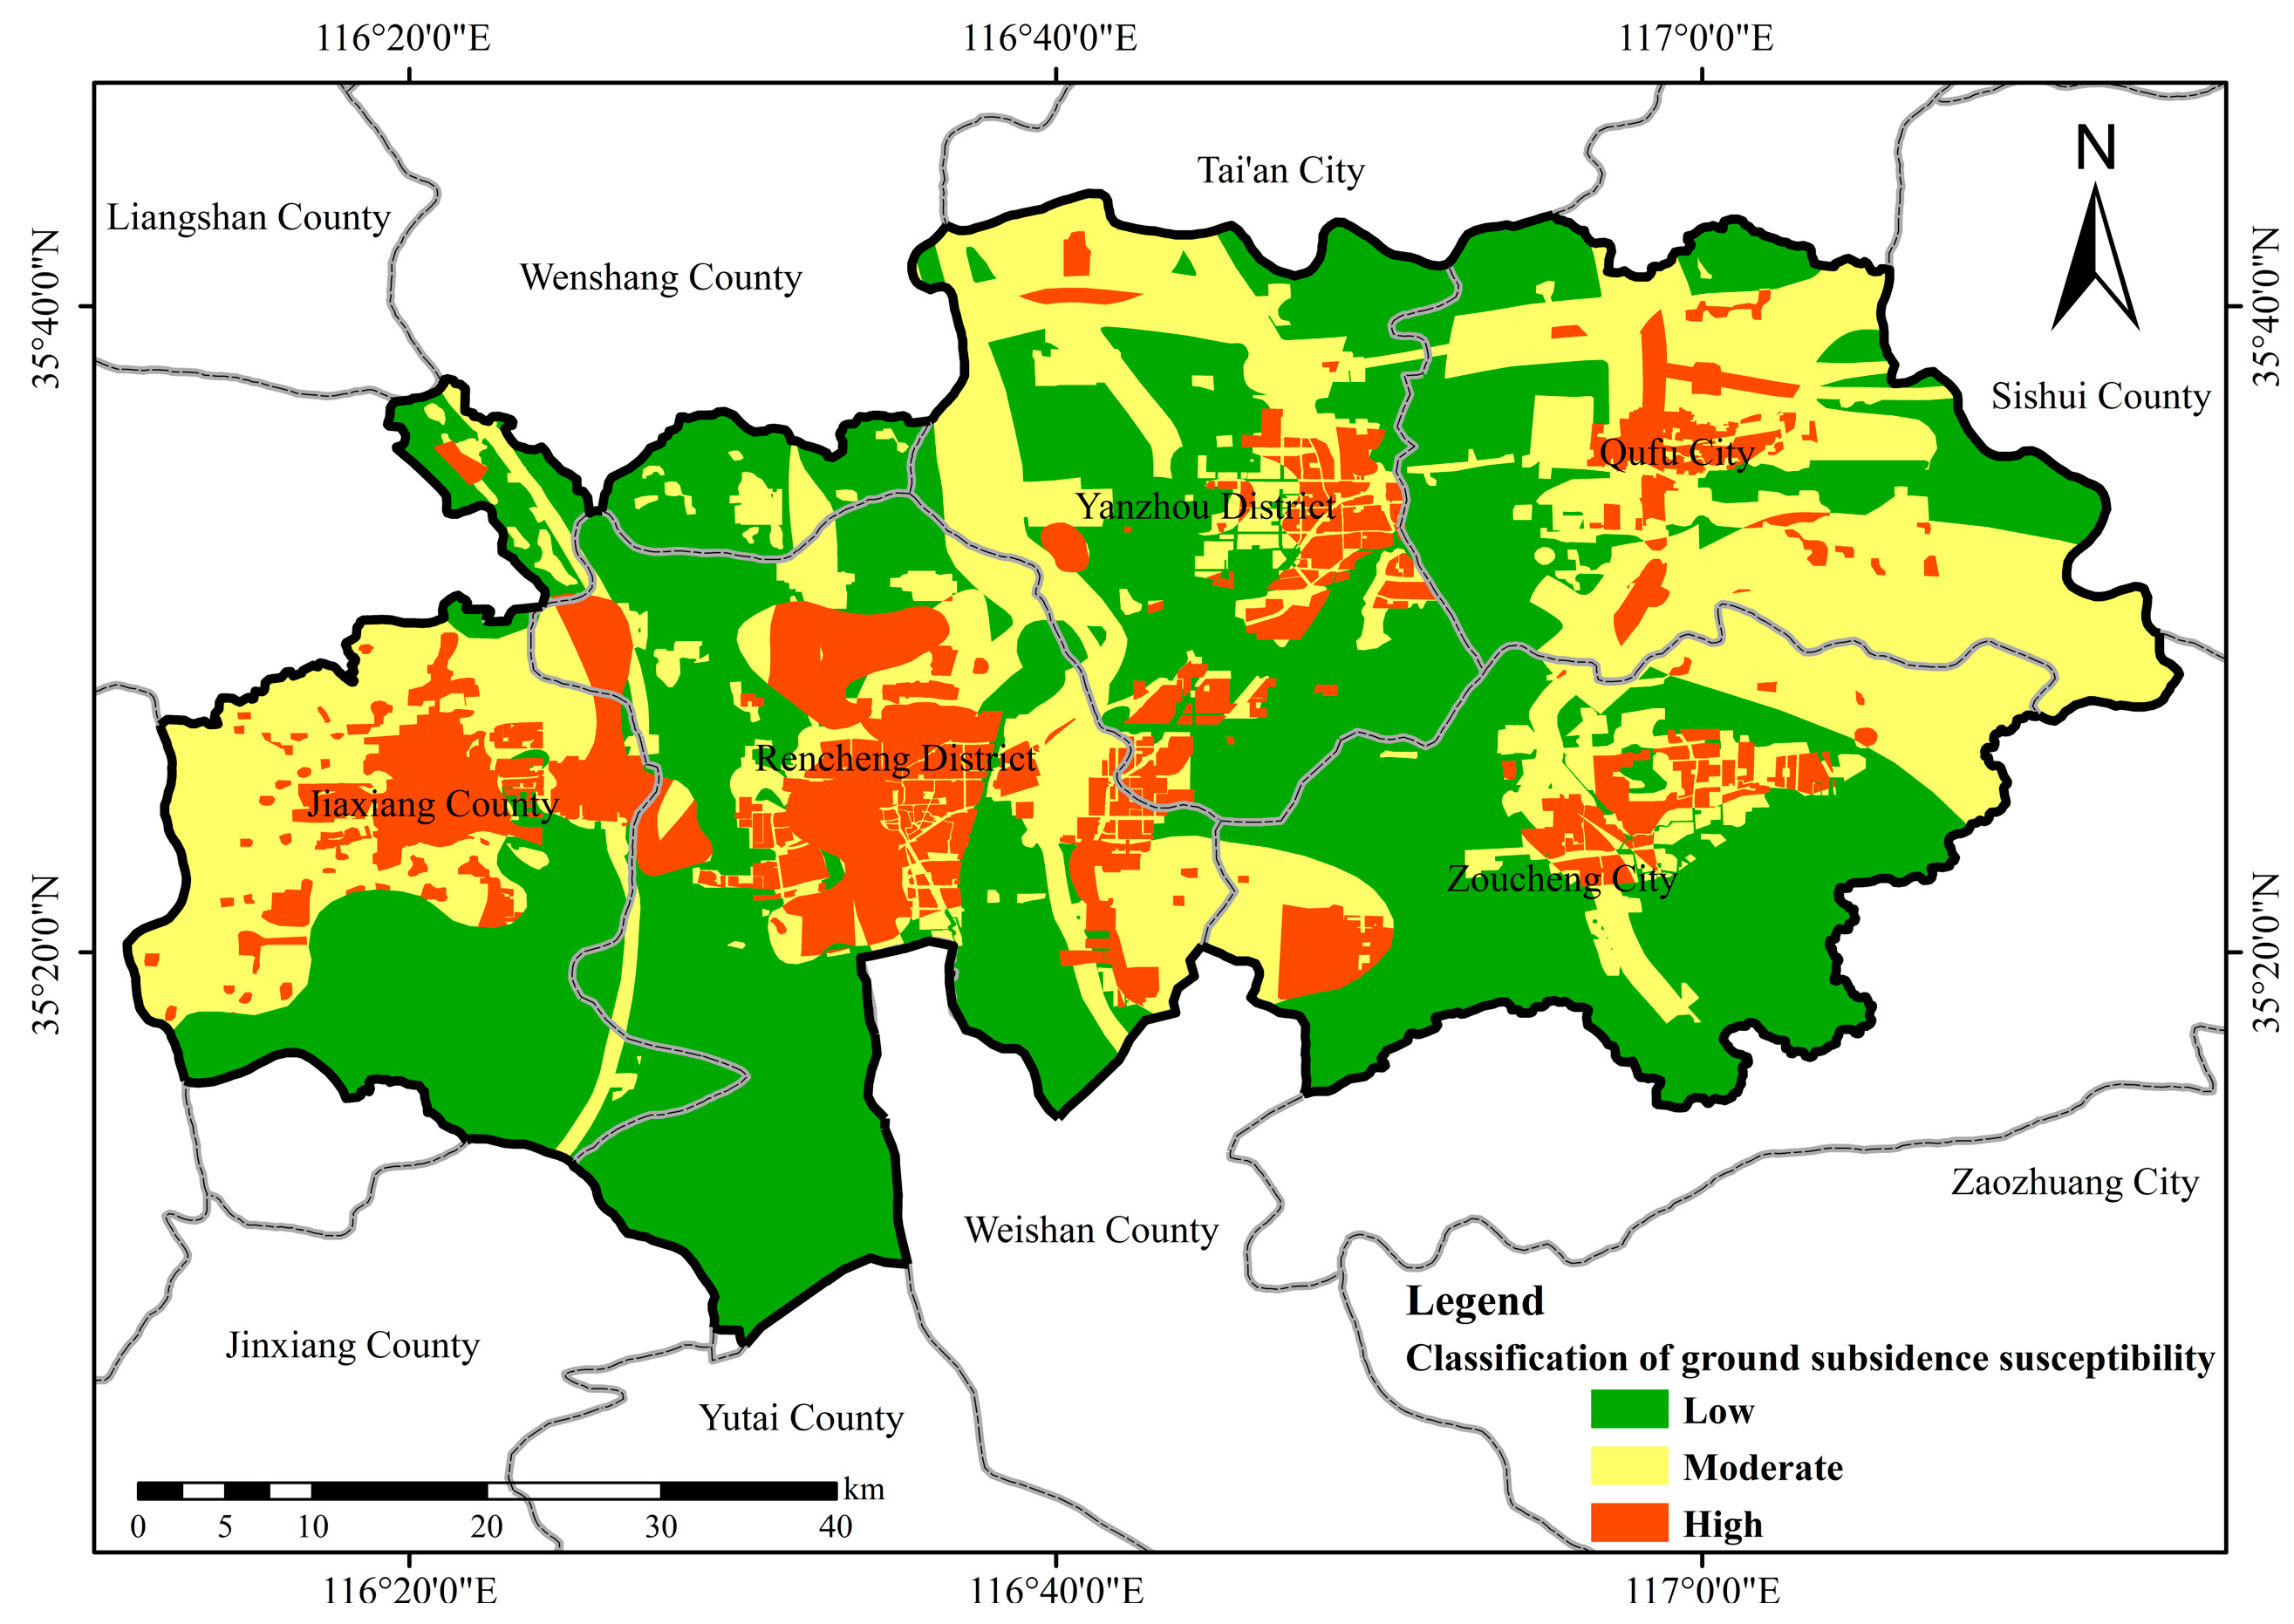
3.2. Geo-Environmental Stabilization Function

Initially, the AHP was utilized to calculate the constant weights for each evaluation index, while simultaneously ensuring the consistency of the judgment matrix. In this study, the calculated consistency ratio (CR) value was 0.0171 (<0.1), indicating a satisfactory consistency of the judgment matrix and reasonable weight values obtained [65] (Table 6). However, due to the significant influence of subjective factors in the AHP model, utilizing fixed weights for indicators was deemed unreasonable [66]. To address this, the variable weight theory was introduced in this study, allowing for weight adjustments based on the index value. This approach aimed to enhance the evaluation results to better reflect the actual situation.
Based on the classification of various indicators related to the geo-environmental stability function, specific values were assigned to the evaluation indicators (Table 7). Subsequently, the results of each indicator were combined to generate a zoning map illustrating the evaluation outcomes of the geo-environmental stability function in the study area (Figure 13).

3.3. Ecological Environment Function

Applying the “barrel effect”, the evaluation results of the ecological environment protection function were utilized to create a zoning map. The study area was categorized into three levels: first-level protection area, second-level protection area, and general area (Figure 14).

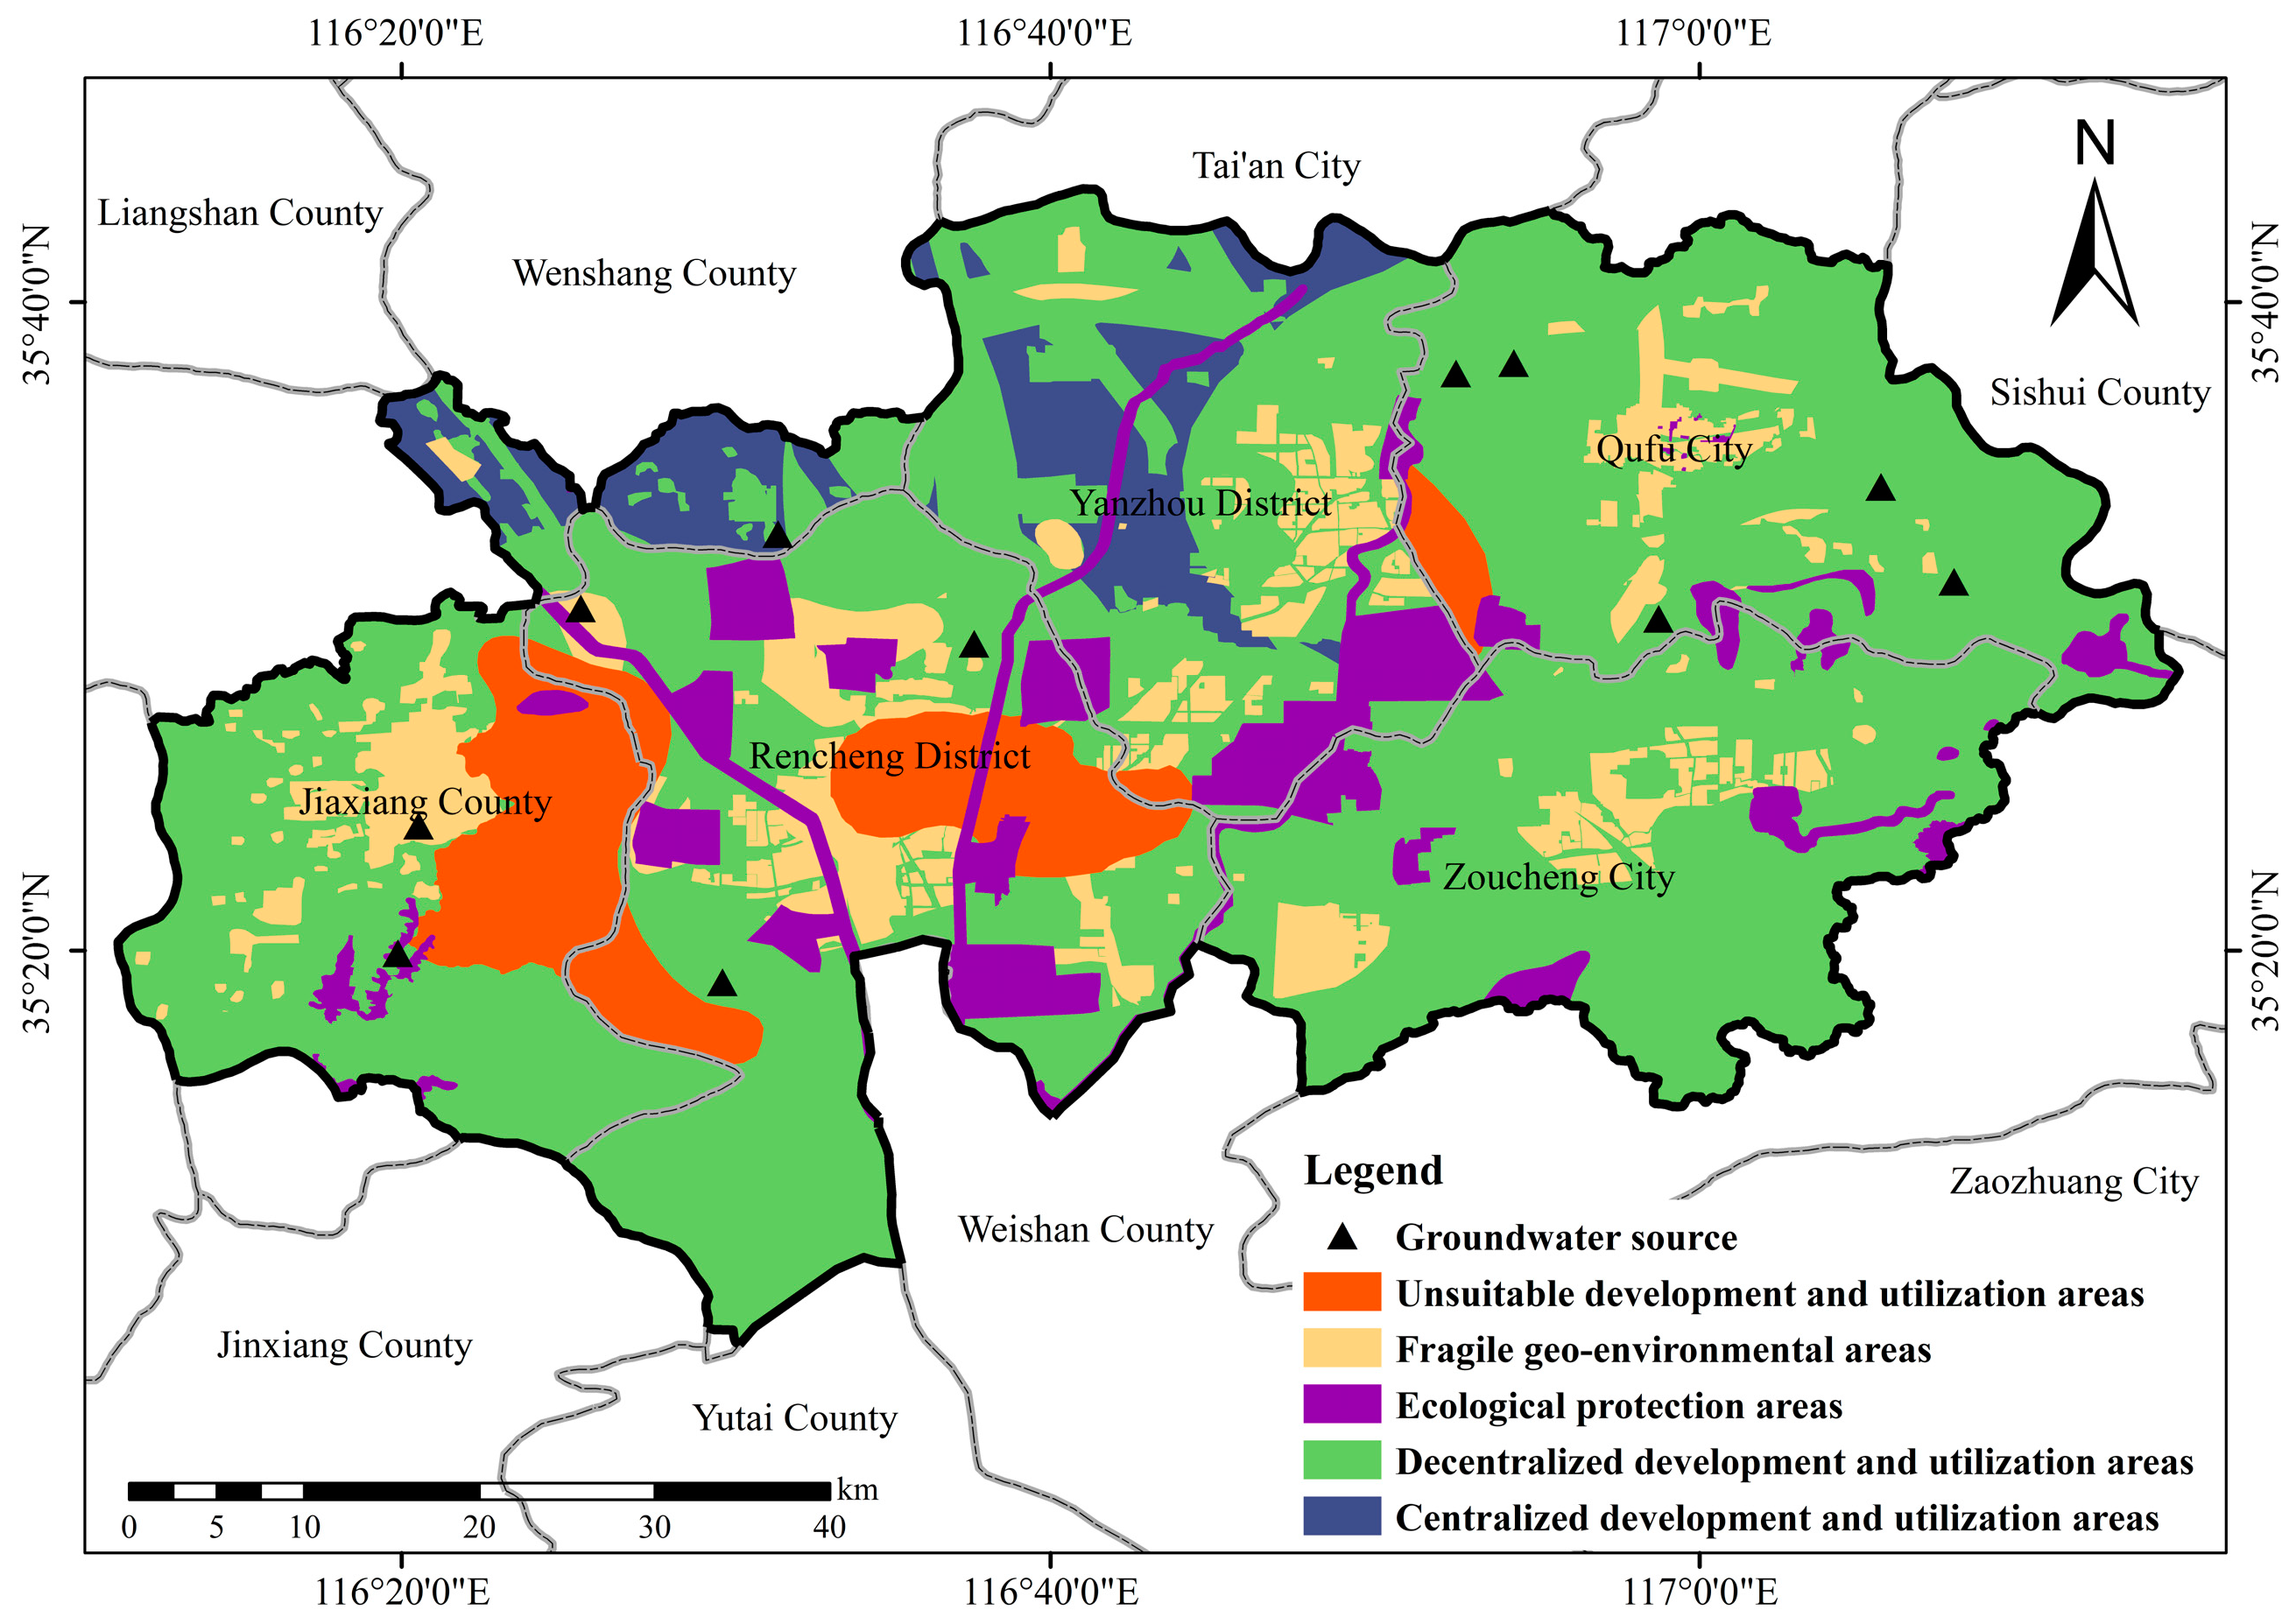
3.4. Comprehensive Zoning of Groundwater Functions

Prior to assessing the sustainable development of groundwater, the functions of groundwater were classified into three levels: good, moderate, and poor for the resource supply function, geo-environmental stability function, and ecological environment function in the study area (Table 8).
The development and utilization of groundwater should prioritize the preservation of geo-environmental stability and the protection of the ecological environment, while taking into consideration regional groundwater quality and quantity [67]. Based on the classification of groundwater functions in the study area and their various combinations, this study proposed a comprehensive zoning framework for groundwater functions in the study area. The groundwater functions were categorized into five types of functional areas: concentrated development and utilization area, decentralized development and utilization areas, ecological protection areas, fragile geo-environmental areas, and unsuitable development and utilization areas (Figure 3).
Groundwater resource planning plays a vital role in ensuring the sustainable development and utilization of groundwater [68]. In this study, an overlay analysis was performed on the groundwater function layers within the study area. By applying the principles of groundwater function zoning, a comprehensive zoning map for groundwater function assessment in the study area was generated (Figure 15).

4. Discussion

4.1. Characteristics of Comprehensive Zoning of Groundwater Functions

The centralizeddevelopment and utilization areas of groundwater in the study area are mainly distributed in the northern part of the study area and the central part of Yanzhou District, with a total area of 202.64 km2 (5.69%). This area has abundant groundwater resources, good water quality, and a well-functioning ecological and geo-environment. Under reasonable groundwater extraction practices, it can adequately meet the regional water supply demand. The decentralized development and utilization areas of groundwater in the study area are widely distributed, covering a total area of 2338.70 km2 (65.67%). The resource supply function and geo-environmental stability function are the main influencing factors for groundwater functions in this area. In this area, the groundwater in the eastern part of Yanzhou District and Jiaxiang County is classified as Class V in terms of water quality, mainly suitable for some agricultural and general landscape water requirements. In other areas, the water quality is mainly classified as Class III or IV and the geo-environmental stability function is moderate. The fragile geo-environmental areas in the study area are mainly distributed in the urban area, with a total area of 371.80 km2 (10.44%). The geo-environmental stability function in this area is poor, and improper development and utilization of groundwater resources can lead to geo-environmental issues such as land subsidence. The ecological protection areas in the study area are mainly distributed in the western, southern, and northern parts of Rencheng District and the southern part of Yanzhou District, with scattered distribution in the eastern part of the study area, covering a total area of 298.44 km2 (8.38%). The dominant function in this area is ecological environment protection, with a focus on ecological protection and water conservation protection areas. The main utilization direction of groundwater resources is to support or compensate for surface water input, thereby maintaining the stability of the ecology and geo-environment in the region. The unsuitable development and utilization area of groundwater in the study area is mainly distributed in Jiaxiang, the eastern part of Rencheng District, the eastern part of Yanzhou District, and the southwestern part of Qufu City, with a total area of 349.72 km2 (9.82%). The main limiting factor for groundwater resource development in this area is groundwater quality, and due to concentrated urban development, there is limited groundwater recharge due to surface sealing.

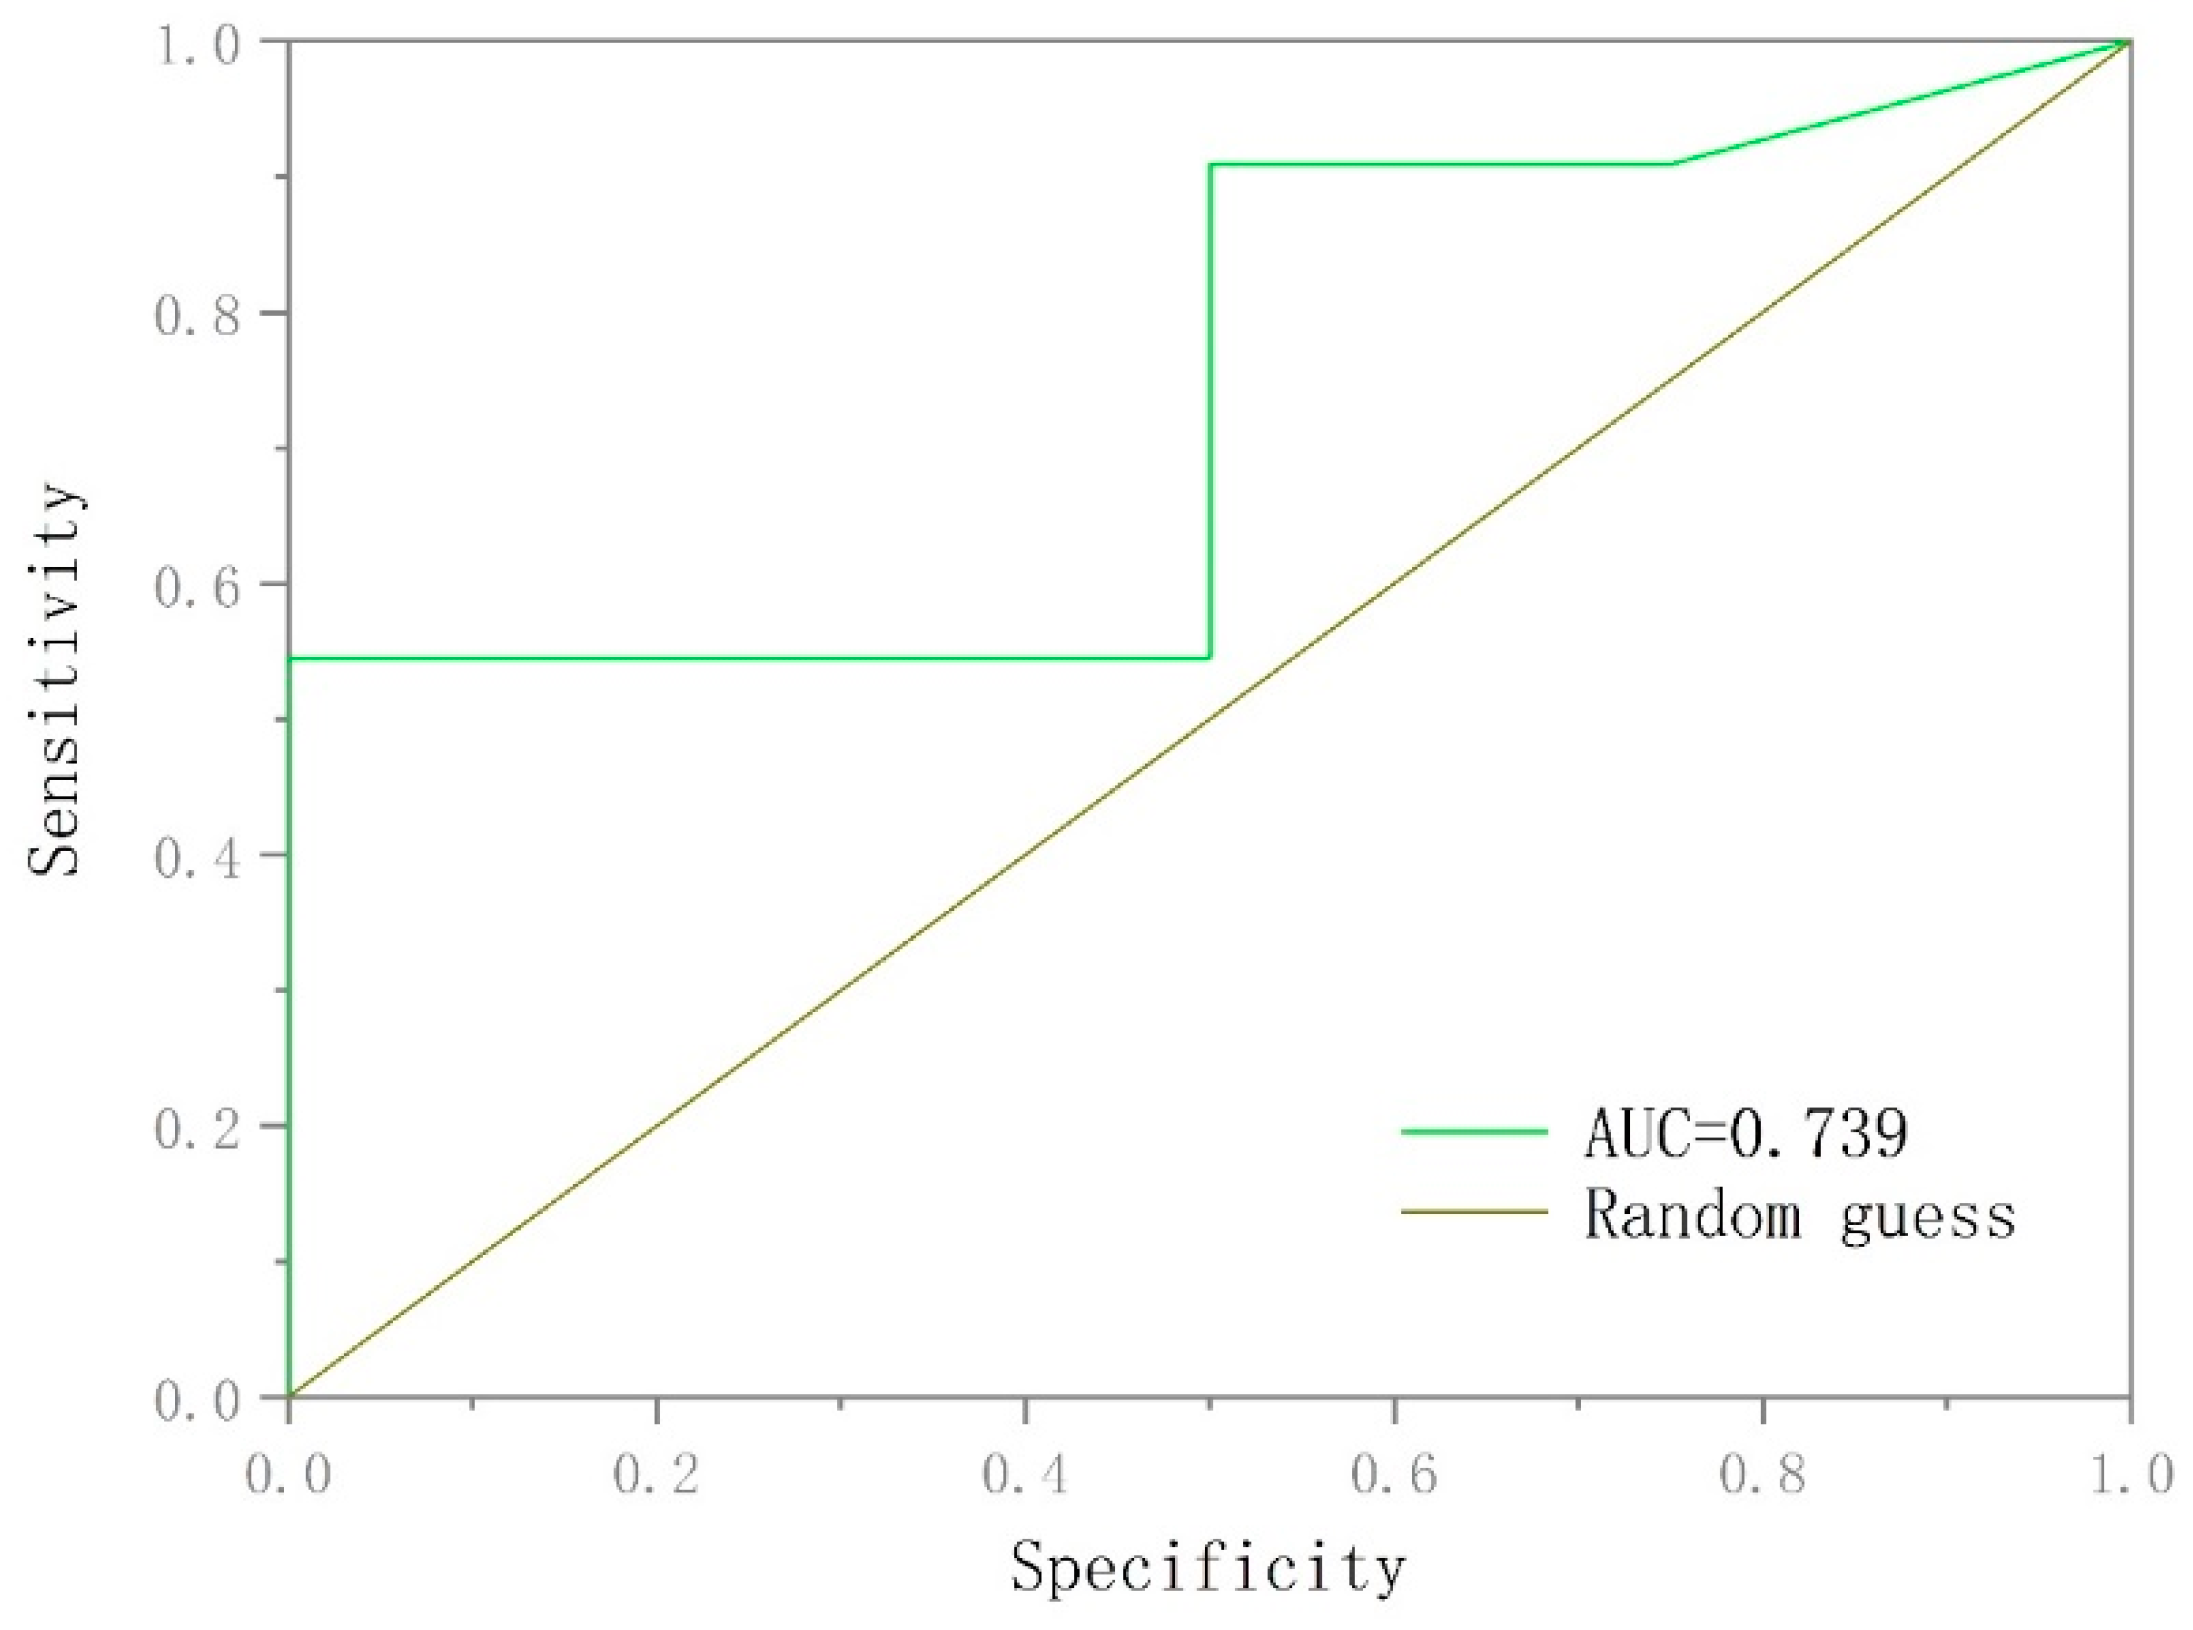
4.2. Verification of Groundwater Functional Zoning

A comparison was conducted between the results of the comprehensive groundwater functional zoning and the existing 11 groundwater extraction sources in the study area. Among these, one groundwater extraction source is located in the centralized development and utilization areas, seven are situated in the decentralized development and utilization areas, two are in the fragile geo-environmental areas, and one is within the ecological protection areas. The verification of the groundwater comprehensive zoning was performed by constructing a receiver operating characteristic (ROC) curve (Figure 16), yielding an AUC value of 0.739. The ROC validation results indicated the model’s rationality, demonstrating its ability to accurately delineate groundwater functional zones within the study area.

4.3. Suggestions for Sustainable Groundwater Development

Based on the distribution of groundwater resources in various groundwater function zones within the study area, corresponding development and utilization recommendations, as well as protection strategies, are proposed.
(1)
Unsuitable development and utilization zones: These zones are primarily located in the eastern part of Jiaxiang County, the southern part of Rencheng District, and the bordering areas with Yanzhou District. These areas have poor groundwater quality with significant pollutant exceedances. Most areas, except for Yanzhou District, also face low groundwater quantity and limited groundwater recharge due to surface sealing caused by concentrated urban development. Therefore, the extraction of shallow groundwater resources should be prohibited in these areas, and corresponding measures for ecological environment restoration should be implemented.
(2)
Ecological protection zones: These zones are mainly distributed within national (provincial, municipal) ecological protection areas, wetland parks, and lake–reservoir-type drinking water sources, representing typical ecological protection areas. To maintain ecological and geo-environmental stability in these areas, the large-scale exploitation and utilization of groundwater resources should be avoided. It is recommended to control the intensity of extraction during development and utilization, ensuring the relative stability of groundwater levels, maintaining a reasonable ecological water level, and avoiding ecosystem degradation. For areas with good water quality, the aim is to maintain the existing water quality, while for areas affected by pollution, protection and restoration measures should be prioritized.
(3)
Fragile geo-environmental zones: It is recommended to control the intensity of extraction during development and utilization, ensuring the relative stability of groundwater levels and avoiding geo-environmental issues. For areas with good water quality, the aim is to maintain the existing water quality, while for areas affected by pollution, the target is to restore the natural water quality before contamination.
(4)
Groundwater supply zones: These zones include concentrated development and utilization areas as well as scattered development areas, where groundwater can meet the demands for drinking, agricultural, and industrial water use. It is recommended to control the volume of groundwater extraction and ensure that groundwater levels do not continuously decline during extraction, avoiding ecosystem degradation and environmental geological issues. These zones can be considered reliable groundwater supply areas.
The groundwater functional zoning comprehensively considers various factors, including the geological characteristics, hydrogeological conditions, water quality, and land use, achieving the comprehensive management of groundwater resources. The zoning divides groundwater resources into different functional zones, including concentrated development and utilization areas, decentralized development and utilization areas, ecological protection areas, fragile geo-environmental areas, and unsuitable development and utilization areas. Such a delineation facilitates the rational development and utilization of groundwater, preventing over-exploitation and waste, and ensuring the sustainability of groundwater resources. Groundwater functional zoning takes into account the groundwater quality status, categorizing water sources into ecological protection areas and enhancing protective measures to prevent pollution sources from affecting groundwater quality. This approach aids in reducing the risk of groundwater pollution. Through groundwater functional zoning, challenges in sustainable groundwater management can be better addressed, ensuring the sustainable utilization and protection of groundwater resources. It serves as an important means to achieve the sustainable utilization and protection of groundwater resources.
In the domain of groundwater functional zoning, there remain numerous potential research directions that merit further exploration and in-depth investigation. Through research in related fields, such as multi-scale and multi-dimensional zoning approaches, the nexus between climate change and groundwater functional zoning, studies on groundwater-surface water interactions, the application of emerging technologies, and economic benefit assessments, new perspectives and solutions can be provided for the rational management and preservation of groundwater resources. These research directions encompass various facets of groundwater resource management and stand as crucial domains driving the advancement of sustainable groundwater management. There are also many challenges and obstacles in implementing sustainable groundwater management, such as issues related to groundwater overexploitation, groundwater pollution, water resource allocation, and balancing conflicting interests. All these hinder the implementation of sustainable groundwater management. It requires joint efforts from the government, society, research institutions, and the public to formulate scientifically sound policies and measures, and to establish a comprehensive groundwater management system. By doing so, we can promote the sustainable utilization of groundwater resources.

4.4. Limitation

Given the complexity of groundwater occurrence conditions, groundwater function zoning necessitates extensive data support. Although this study incorporated various data sources, future study could consider including additional evaluation indicators that accurately reflect the local conditions. Furthermore, the subjectivity associated with the judgment matrix construction process cannot be completely eliminated. The groundwater system is affected by a range of unpredictable factors, including climate change and evolving human activities. Not considering these influencing factors may lead to some differences in the results. Future research can explore the application of various weighting methods and further optimize and compare their evaluation results in addressing such issues. Additionally, it is essential to consider the integration of model considerations and variable factors to enhance the accuracy of regionalization. By combining multiple approaches and taking into account different influencing factors, we can achieve more comprehensive and reliable outcomes in the assessment process.

5. Conclusions

This study conducted a comprehensive analysis to delineate groundwater function zones in the study area by examining the distribution of groundwater resources and integrating hydrogeological, geological engineering, geological, and ecological environmental data. The evaluation focused on the functions of groundwater resource supply, geo-environmental stability, and ecological environment protection, resulting in the development of a detailed and easily understandable set of evaluation indicators. By establishing principles of comprehensive zoning for groundwater functions and considering the resource supply function, geo-environmental stability function, and ecological environment function as influential factors, as well as comprehensively considering factors related to sustainable groundwater development, the study area was divided into the following zones: concentrated development and utilization areas (5.69%), decentralized development and utilization areas (65.67%), ecological protection areas (8.38%), fragile geo-environmental areas (10.44%), and unsuitable development and utilization areas (9.82%). Moreover, this study provided recommendations for the sustainable development, protection, and utilization of groundwater resources, considering the existing pollution issues in the study area. The study findings offer valuable insights for guiding the sustainable management and utilization of groundwater resources in the study area. Delineating groundwater functional zones contributes to a more comprehensive and systematic understanding and assessment of the groundwater system. By categorizing groundwater into different functional zones, it clarifies the water supply function, water quality status, and geological environmental characteristics of each area. This aids decision makers in formulating rational development and utilization policies, enhancing the quality and efficiency of decisions, and ensuring the sustainable use of groundwater resources. Additionally, it facilitates the identification of geological environmental risks, thereby enhancing environmental protection capabilities.

Author Contributions

H.C. contributed to conceptualization, original draft preparation, formal analysis, and writing review & editing. Y.Z. (Yawei Zhang) contributed to data curation and visualization, methodology, and supervision. X.T., B.H. and Y.Z. (Yan Zhang) contributed to data curation and visualization, writing, review & editing, and formal analysis. S.X., Z.D., Z.Z. and Z.W. contributed to writing, review & editing. All authors have read and agreed to the published version of the manuscript.

Funding

This research was funded by the National Natural Science Foundation of China (No. 41572212).

Institutional Review Board Statement

Not applicable.

Informed Consent Statement

Not applicable.

Data Availability Statement

Not applicable.

Acknowledgments

The author thanks the Project of Urban Geological Survey of Jining City for its support.

Conflicts of Interest

The author declares no conflict of interest.

References

  1. Gholami, V.; Yousefi, Z.; Zabardast Rostami, H. Modeling of Ground Water Salinity on the Caspian Southern Coasts. Water Resour. Manag. 2010, 24, 1415–1424. [Google Scholar] [CrossRef]
  2. Margat, J.; Van der Gun, J. Groundwater around the World: A Geographic Synopsis; CRC Press: Boca Raton, FL, USA, 2013. [Google Scholar]
  3. Hao, A.; Zhang, Y.; Zhang, E.; Li, Z.; Yu, J.; Huang, W.; Yang, J.; Wang, Y. Groundwater resources and related environmental issues in China. Hydrogeol. J. 2018, 26, 1325–1337. [Google Scholar] [CrossRef]
  4. Jakeman, A.J.; Barreteau, O.; Hunt, R.J.; Rinaudo, J.-D.; Ross, A. Integrated Groundwater Management; Springer Nature: Berlin/Heidelberg, Germany, 2016. [Google Scholar]
  5. Saidi, S.; Bouri, S.; Dhia, H.B.; Anselme, B. Assessment of groundwater risk using intrinsic vulnerability and hazard mapping: Application to Souassi aquifer, Tunisian Sahel. Agric. Water Manag. 2011, 98, 1671–1682. [Google Scholar] [CrossRef]
  6. Yazdian, M.; Rakhshandehroo, G.; Nikoo, M.R.; Mooselu, M.G.; Gandomi, A.H.; Honar, T. Groundwater sustainability: Developing a non-cooperative optimal management scenario in shared groundwater resources under water bankruptcy conditions. J. Environ. Manag. 2021, 292, 112807. [Google Scholar] [CrossRef] [PubMed]
  7. Li, J.; Liu, H.; Su, Z.; Fan, X. Changes in wind activity from 1957 to 2011 and their possible influence on aeolian desertification in northern China. J. Arid. Land 2015, 7, 755–764. [Google Scholar] [CrossRef]
  8. Xiong, H.; Wang, Y.; Guo, X.; Han, J.; Ma, C.; Zhang, X. Current status and future challenges of groundwater vulnerability assessment: A bibliometric analysis. J. Hydrol. 2022, 615, 128694. [Google Scholar] [CrossRef]
  9. Ahmad, A.Y.; Al-Ghouti, M.A. Approaches to achieve sustainable use and management of groundwater resources in Qatar: A review. Groundw. Sustain. Dev. 2020, 11, 100367. [Google Scholar] [CrossRef]
  10. Choudhary, S.; Pingale, S.M.; Khare, D. Delineation of groundwater potential zones of upper Godavari sub-basin of India using bi-variate, MCDM and advanced machine learning algorithms. Geocarto Int. 2022, 37, 15063–15093. [Google Scholar] [CrossRef]
  11. Konikow, L.F.; Kendy, E. Groundwater depletion: A global problem. Hydrogeol. J. 2005, 13, 317–320. [Google Scholar] [CrossRef]
  12. Shyam, M.; Meraj, G.; Kanga, S.; Sudhanshu; Farooq, M.; Singh, S.K.; Sahu, N.; Kumar, P. Assessing the Groundwater Reserves of the Udaipur District, Aravalli Range, India, Using Geospatial Techniques. Water 2022, 14, 648. [Google Scholar] [CrossRef]
  13. Zhang, J. Discussion on Several Problems in the Development and Utilization of Water Resources in Groundwater Excessive Exploitation Areas. Groundwater 2005, 27, 118–120. [Google Scholar]
  14. Gao, X.; Wang, S.; Liu, P. Discussion on Groundwater Problems and Countermeasures. Shanxi Water Conserv. 2005, 21, 23. [Google Scholar]
  15. Lin, X.; Liao, Z. The essential attributes and functions of groundwater resources and the significance of hydrogeological research. J. Tianjin Univ. Soc. Sci. Ed. 2004, 6, 193–195. [Google Scholar]
  16. Tang, K.; Du, Q. Discussion on the Division of Groundwater Functional Areas. Water Resour. Prot. 2004, 20, 16–19. [Google Scholar]
  17. Li, F.; Zhao, Y.; Feng, P.; Zhang, W.; Qiao, J. Risk assessment of groundwater and its application. Part I: Risk grading based on the functional zoning of groundwater. Water Resour. Manag. 2015, 29, 2697–2714. [Google Scholar] [CrossRef]
  18. Alley, W.M.; Reilly, T.E.; Franke, O.L. Sustainability of Ground-Water Resources; US Department of the Interior, US Geological Survey: Reston, VA, USA, 1999.
  19. Raghavendra, N.S.; Deka, P.C. Sustainable development and management of groundwater resources in mining affected areas: A review. Procedia Earth Planet. Sci. 2015, 11, 598–604. [Google Scholar] [CrossRef]
  20. Steele, K.; Carmel, Y.; Cross, J.; Wilcox, C. Uses and misuses of multicriteria decision analysis (MCDA) in environmental decision making. Risk Anal. Int. J. 2009, 29, 26–33. [Google Scholar] [CrossRef]
  21. Janssen, R. Multiobjective Decision Support for Environmental Management; Kluwer Academic Publishers: Dordrecht, The Netherlands, 1992; p. 232. [Google Scholar]
  22. Vaidya, O.S.; Kumar, S. Analytic hierarchy process: An overview of applications. Eur. J. Oper. Res. 2006, 169, 1–29. [Google Scholar] [CrossRef]
  23. Swetha, T.; Gopinath, G.; Thrivikramji, K.; Jesiya, N. Geospatial and MCDM tool mix for identification of potential groundwater prospects in a tropical river basin, Kerala. Environ. Earth Sci. 2017, 76, 428. [Google Scholar] [CrossRef]
  24. Shekhar, S.; Pandey, A.C. Delineation of groundwater potential zone in hard rock terrain of India using remote sensing, geographical information system (GIS) and analytic hierarchy process (AHP) techniques. Geocarto Int. 2015, 30, 402–421. [Google Scholar] [CrossRef]
  25. Scheihing, K.W.; Kübeck, C.; Sütering, U. GIS-AHP Ensembles for Multi-Actor Multi-Criteria Site Selection Processes: Application to Groundwater Management under Climate Change. Water 2022, 14, 1793. [Google Scholar] [CrossRef]
  26. Shao, Z.; Huq, M.E.; Cai, B.; Altan, O.; Li, Y. Integrated remote sensing and GIS approach using Fuzzy-AHP to delineate and identify groundwater potential zones in semi-arid Shanxi Province, China. Environ. Model. Softw. 2020, 134, 104868. [Google Scholar] [CrossRef]
  27. Neshat, A.; Pradhan, B.; Dadras, M. Groundwater vulnerability assessment using an improved DRASTIC method in GIS. Resour. Conserv. Recycl. 2014, 86, 74–86. [Google Scholar] [CrossRef]
  28. Singh, L.K.; Jha, M.K.; Chowdary, V.M. Assessing the accuracy of GIS-based Multi-Criteria Decision Analysis approaches for mapping groundwater potential. Ecol. Indic. 2018, 91, 24–37. [Google Scholar] [CrossRef]
  29. Farhat, B.; Souissi, D.; Mahfoudhi, R.; Chrigui, R.; Sebei, A.; Ben Mammou, A. GIS-based multi-criteria decision-making techniques and analytical hierarchical process for delineation of groundwater potential. Environ. Monit. Assess. 2023, 195, 285. [Google Scholar] [CrossRef]
  30. Tweed, S.O.; Leblanc, M.; Webb, J.A.; Lubczynski, M.W. Remote sensing and GIS for mapping groundwater recharge and discharge areas in salinity prone catchments, southeastern Australia. Hydrogeol. J. 2007, 15, 75–96. [Google Scholar] [CrossRef]
  31. Yeh, H.-F.; Lee, C.-H.; Hsu, K.-C.; Chang, P.-H. GIS for the assessment of the groundwater recharge potential zone. Environ. Geol. 2009, 58, 185–195. [Google Scholar] [CrossRef]
  32. Mukherjee, S. Targeting saline aquifer by remote sensing and geophysical methods in a part of Hamirpur-Kanpur, India. Hydrogeol. J. 1996, 19, 53–64. [Google Scholar]
  33. Xiong, H.; Ma, C.; Li, M.; Tan, J.; Wang, Y. Landslide susceptibility prediction considering land use change and human activity: A case study under rapid urban expansion and afforestation in China. Sci. Total Environ. 2023, 866, 161430. [Google Scholar] [CrossRef] [PubMed]
  34. Gautam, A.; Rai, S.C.; Rai, S.P. Assessment of Groundwater Quality beneath Agriculturally Advanced Region of Northern Alluvial Plain, India. Sustainability 2021, 13, 7053. [Google Scholar] [CrossRef]
  35. Lee, S. Determination of Priority Weights under Multiattribute Decision-Making Situations: AHP versus Fuzzy AHP. J. Constr. Eng. Manag. 2015, 141, 05014015. [Google Scholar] [CrossRef]
  36. Mudashiru, R.B.; Sabtu, N.; Abdullah, R.; Saleh, A.; Abustan, I. A comparison of three multi-criteria decision-making models in mapping flood hazard areas of Northeast Penang, Malaysia. Nat. Hazards 2022, 112, 1903–1939. [Google Scholar] [CrossRef]
  37. Yu, C.-S. A GP-AHP method for solving group decision-making fuzzy AHP problems. Comput. Oper. Res. 2002, 29, 1969–2001. [Google Scholar] [CrossRef]
  38. Chen, C.-H. A Novel Multi-Criteria Decision-Making Model for Building Material Supplier Selection Based on Entropy-AHP Weighted TOPSIS. Entropy 2020, 22, 259. [Google Scholar] [CrossRef] [PubMed]
  39. Feng, G.; Lei, S.; Guo, Y.; Meng, B.; Jiang, Q. Optimization and Evaluation of Ventilation Mode in Marine Data Center Based on AHP-Entropy Weight. Entropy 2019, 21, 796. [Google Scholar] [CrossRef] [PubMed]
  40. Khare, Y.D.; Varade, A.M. Approach to Groundwater Management towards Sustainable Development in India. Acque Sotter.-Ital. J. Groundw. 2018, 7. [Google Scholar] [CrossRef]
  41. Guo, X.; Ma, C.; Hu, X.; Hu, X.; Yan, W. Application of groundwater functional zoning to coastal groundwater management: A case study in the plain area of Weifang City, China. Environ. Earth Sci. 2019, 78, 525. [Google Scholar] [CrossRef]
  42. Wang, S.; Liu, H.; Zhao, W.; Li, Z. Groundwater Sustainability in Arid and Semi-arid Environments: A Review2. Adv. Earth Sci. 2019, 34, 210. [Google Scholar]
  43. Jacobs, K.L.; Holway, J.M. Managing for sustainability in an arid climate: Lessons learned from 20 years of groundwater management in Arizona, USA. Hydrogeol. J. 2004, 12, 52–65. [Google Scholar] [CrossRef]
  44. Brown, M. Managing California’s Water: A Look at the Sustainable Groundwater Management Act of 2014. Hastings W.-Nw. J. Envt’l L. Pol’y. 2017, 23, 1. [Google Scholar]
  45. Hosseini, S.M.; Parizi, E.; Ataie-Ashtiani, B.; Simmons, C.T. Assessment of sustainable groundwater resources management using integrated environmental index: Case studies across Iran. Sci. Total Environ. 2019, 676, 792–810. [Google Scholar] [CrossRef]
  46. Mititelu-Ionuş, O. Watershed Sustainability Index Development and Application: Case Study of the Motru River in Romania. Pol. J. Environ. Stud. 2017, 26, 2095–2105. [Google Scholar] [CrossRef] [PubMed]
  47. Kang, M.G.; Lee, G.M. Multicriteria Evaluation of Water Resources Sustainability in the Context of Watershed Management 1. JAWRA J. Am. Water Resour. Assoc. 2011, 47, 813–827. [Google Scholar] [CrossRef]
  48. Jha, M.K.; Chowdhury, A.; Chowdary, V.; Peiffer, S. Groundwater management and development by integrated remote sensing and geographic information systems: Prospects and constraints. Water Resour. Manag. 2007, 21, 427–467. [Google Scholar] [CrossRef]
  49. Haile, M.M.; Tafesse Yadeta, J.; Amena Gambe, L. Delineation of groundwater potential zones using geo-spatial and AHP techniques: Ambo area, Blue Nile Basin, Ethiopia. Sustain. Water Resour. Manag. 2022, 8, 36. [Google Scholar] [CrossRef]
  50. Prasad, R.; Mondal, N.; Banerjee, P.; Nandakumar, M.; Singh, V. Deciphering potential groundwater zone in hard rock through the application of GIS. Environ. Geol. 2008, 55, 467–475. [Google Scholar] [CrossRef]
  51. Gupta, D.S.; Biswas, A.; Ghosh, P.; Rawat, U.; Tripathi, S. Delineation of groundwater potential zones, groundwater estimation and recharge potentials from Mahoba district of Uttar Pradesh, India. Int. J. Environ. Sci. Technol. 2022, 19, 12145–12168. [Google Scholar] [CrossRef]
  52. Soleimani-Motlagh, M.; Ghasemieh, H.; Talebi, A.; Abdollahi, K.; Dragoni, W. Groundwater budget deficit caused by drought and overexploitation. Water Supply 2020, 20, 621–632. [Google Scholar] [CrossRef]
  53. Wu, Y.; Zhao, S. Status quo and change characteristics of groundwater resources pollution in the Hami region based on sustainable development strategies. Water Supply 2023, 23, 1478–1494. [Google Scholar] [CrossRef]
  54. Lu, H.; Li, H.; Wang, J.; Zheng, H.; Cao, X.; Tong, C. Optimal water and land resource allocation in pastoral areas based on a water–land forage–livestock balance: A case study of Otog Front Banner, Inner Mongolia, China. Environ. Sci. Pollut. Res. 2020, 27, 10328–10341. [Google Scholar] [CrossRef]
  55. Ling, M.; Han, H.; Wei, X.; Lv, C. Temporal and spatial distributions of precipitation on the Huang-Huai-Hai Plain during 1960–2019, China. J. Water Clim. Change 2021, 12, 2232–2244. [Google Scholar] [CrossRef]
  56. Zhou, C.; Zhang, R.; Ning, X.; Zheng, Z. Spatial-Temporal Characteristics in Grain Production and Its Influencing Factors in the Huang-Huai-Hai Plain from 1995 to 2018. Int. J. Environ. Res. Public Health 2020, 17, 9193. [Google Scholar] [CrossRef] [PubMed]
  57. Ong′or, B.T.I.; Shu, L.C.; Liu, P.G. Environmental impact assessment of risk associated with groundwater overdraft remediation in cone of depression, Jining, China. Environ. Geol. 2007, 53, 751–762. [Google Scholar] [CrossRef]
  58. Saaty, T.L. The Analytical Hierarchy Process, Planning, Priority; Resource Allocation; RWS Publications: Pittsburgh, PA, USA, 1980. [Google Scholar]
  59. Wu, X.; Li, B.; Ma, C. Assessment of groundwater vulnerability by applying the modified DRASTIC model in Beihai City, China. Environ. Sci. Pollut. Res. 2018, 25, 12713–12727. [Google Scholar] [CrossRef] [PubMed]
  60. Zhao, J.-W.; Peng, F.-L.; Wang, T.-Q.; Zhang, X.-Y.; Jiang, B.-N. Advances in master planning of urban underground space (UUS) in China. Tunn. Undergr. Space Technol. 2016, 55, 290–307. [Google Scholar] [CrossRef]
  61. Arabameri, A.; Saha, S.; Roy, J.; Tiefenbacher, J.P.; Cerda, A.; Biggs, T.; Pradhan, B.; Ngo, P.T.T.; Collins, A.L. A novel ensemble computational intelligence approach for the spatial prediction of land subsidence susceptibility. Sci. Total Environ. 2020, 726, 138595. [Google Scholar] [CrossRef]
  62. Bekesi, G.; Hodges, S. The protection of groundwater dependent ecosystems in Otago, New Zealand. Hydrogeol. J. 2006, 14, 1696–1701. [Google Scholar] [CrossRef]
  63. Münch, Z.; Conrad, J. Remote sensing and GIS based determination of groundwater dependent ecosystems in the Western Cape, South Africa. Hydrogeol. J. 2007, 15, 19–28. [Google Scholar] [CrossRef]
  64. Erostate, M.; Huneau, F.; Garel, E.; Ghiotti, S.; Vystavna, Y.; Garrido, M.; Pasqualini, V. Groundwater dependent ecosystems in coastal Mediterranean regions: Characterization, challenges and management for their protection. Water Res. 2020, 172, 115461. [Google Scholar] [CrossRef]
  65. Sun, L.; Ma, C.; Li, Y. Multiple geo-environmental hazards susceptibility assessment: A case study in Luoning County, Henan Province, China. Geomat. Nat. Hazards Risk 2019, 10, 2009–2029. [Google Scholar] [CrossRef]
  66. Yu, H.; Wu, Q.; Zeng, Y.; Zheng, L.; Xu, L.; Liu, S.; Wang, D. Integrated variable weight model and improved DRASTIC model for groundwater vulnerability assessment in a shallow porous aquifer. J. Hydrol. 2022, 608, 127538. [Google Scholar] [CrossRef]
  67. Arshad, A.; Zhang, Z.; Zhang, W.; Dilawar, A. Mapping favorable groundwater potential recharge zones using a GIS-based analytical hierarchical process and probability frequency ratio model: A case study from an agro-urban region of Pakistan. Geosci. Front. 2020, 11, 1805–1819. [Google Scholar] [CrossRef]
  68. Jothibasu, A.; Anbazhagan, S. Hydrogeological assessment of the groundwater aquifers for sustainability state and development planning. Environ. Earth Sci. 2018, 77, 88. [Google Scholar] [CrossRef]
Figure 1. Location map of the study area.
Sustainability 15 12767 g001
Figure 2. Technical route map.
Sustainability 15 12767 g002
Figure 3. Principles for the integrated zoning of groundwater functions.
Sustainability 15 12767 g003
Figure 4. Distribution map of MGE.
Sustainability 15 12767 g004
Figure 5. Distribution map of groundwater quality.
Sustainability 15 12767 g005
Figure 6. Distribution map of the thickness of soft soil stratum.
Sustainability 15 12767 g006
Figure 7. Distribution map of groundwater depth.
Sustainability 15 12767 g007
Figure 8. Distribution map of land use types.
Sustainability 15 12767 g008
Figure 9. Distribution map of faults.
Sustainability 15 12767 g009
Figure 10. Distribution map of water conservation.
Sustainability 15 12767 g010
Figure 11. Distribution map of ecological protection.
Sustainability 15 12767 g011
Figure 12. Zoning map of resource supply function.
Sustainability 15 12767 g012
Figure 13. Zoning map for the geo-environmental stability function.
Sustainability 15 12767 g013
Figure 14. Zoning map for the ecological environment protection function.
Sustainability 15 12767 g014
Figure 15. Zoning map of groundwater function assessment.
Sustainability 15 12767 g015
Figure 16. ROC curve and AUC values of the models.
Sustainability 15 12767 g016
Table 1. Data types and sources.
Conditional FactorsSourcesFormat
Thickness of soft soil stratumLunan Geological Engineering Survey Institute of Shandong ProvinceTiff
Distance to faultLunan Geological Engineering Survey Institute of Shandong ProvinceTiff
Groundwater quantityLunan Geological Engineering Survey Institute of Shandong ProvinceTiff
Groundwater qualityLunan Geological Engineering Survey Institute of Shandong ProvinceTiff
Water conservationGeographical Information Monitoring Cloud Platform (www.dsac.cn accessed on 10 January 2022.)Tiff
Ecological protectionGeographical Information Monitoring Cloud Platform (www.dsac.cn accessed on 10 January 2022.)Tiff
Depth of groundwaterJining Urban and Rural Water BureauTiff
Land useJining Natural Resources and Planning BureauTiff
Table 2. The scale of the AHP judgment matrix.
Intensity of ImportanceDefinitionExplanation
1Equal importanceTwo activities contribute equally to the objective
3Moderate importance of one over anotherExperience and judgment moderately favor one activity over another
5Essential or strong importanceExperience and judgment strongly favor one activity over another
7Very strong importanceAn activity is very strongly favored and its dominance is demonstrated in practice
9Extreme importanceThe evidence favoring one activity over another is of the highest possible order of affirmation
2, 4, 6, 8Intermediate valuesWhen compromise is needed
ReciprocalsIf the importance of Ai compared to Aj is aij, then the
importance of Aj compared to Ai is aji = 1/aij.
Table 3. Consistency Index (R.I). Value Table.
N12345678910
RI000.520.891.111.241.351.401.451.49
Table 4. MGE of hydrological unit in the study area.
Hydrogeological UnitMGE(104 m3/km2·a)
Rencheng8.09
Yanzhou19.91
Qufu10.87
Jiaxiang14.07
Zoucheng12.69
Wenshang27.4
Table 5. Standard for groundwater quality classification.
IndicatorsClass-IIIClass-IVClass-V
pH6.5–8.55.5–6.5, 8.5–9<5.5, >9
Total Hardness (mg/L)≤450≤550>550
TDS (mg/L)≤1000≤2000>2000
Sulfate (mg/L)≤250≤350>350
Cl (mg/L)≤250≤350>350
Fe (mg/L)≤0.3≤2.0>2.0
Mn (mg/L)≤0.1≤1.5>1.5
Cu (mg/L)≤1.0≤1.5>1.5
Zn (mg/L)≤1.0≤5.0>5.0
Al (mg/L)≤0.20≤0.50>0.50
Hg (mg/L)≤0.001≤0.002>0.002
As (mg/L)≤0.01≤0.05>0.05
Phenol (mg/L)≤0.002≤0.01>0.01
Sulfide (mg/L)≤0.2≤0.1>0.1
NO (mg/L)≤20≤30>30
NO2 (mg/L)≤0.02≤0.1>0.1
Ammonia Nitrogen (mg/L)≤0.50≤1.50>1.50
F (mg/L)≤1.0≤2.0>2.0
Table 6. Judgment matrix for the evaluation indicators of geo-environmental stability function.
Assessment indicatorsTDUFWeight
T11230.3647
D1/21120.2771
U11120.233
F1/31/21/210.1252
CR = 0.0171
Table 7. Classification and assignment criteria for evaluation indicators of geo-environmental function in groundwater resources.
Assessment IndicatorsIndex Classification and Assignment
0.10.40.71
Distance to faultStability AreasRelatively Stable AreasLower-Stability AreasLow-Stability Areas
Depth of groundwater<6 m6–8 m8–10 m>12 m
0.10.551
Land useNon-construction areasDispersed town construction areasConcentrated urban construction areas
Thickness of soft soil stratum<20 m20–30 m>30 m
Table 8. Criteria for the classification of groundwater functions.
FunctionAttributeGoodModeratePoor
Resource supply functionGroundwater resource quantityMGE ≥ 16 × 104 m3/km2·aOtherMGE < 10 × 104 m3/km2·a
Groundwater qualityClass IIIClass V
Geo-environmental stability functionLand subsidenceLow-vulnerability zoneModerate-vulnerability zoneHigh-vulnerability zone
Ecological
environment function
Water conservationOther/Water
conservation zone
Ecological protectionEcological protection zone
Disclaimer/Publisher’s Note: The statements, opinions and data contained in all publications are solely those of the individual author(s) and contributor(s) and not of MDPI and/or the editor(s). MDPI and/or the editor(s) disclaim responsibility for any injury to people or property resulting from any ideas, methods, instructions or products referred to in the content.

