Article

Response of the Anchoring Performance at Betula platyphylla’s Root–Soil Interface to Cyclic Loading

1
Department of Civil Engineering, Beijing Forestry University, Beijing 100083, China
2
Key Laboratory of State Forestry Administration on Soil and Water Conservation, Beijing Forestry University, Beijing 100083, China
3
China Academy of Building Research, Beijing 100013, China
4
National Center for Quality Inspection & Test of Building Engineering, Beijing 100013, China
*
Author to whom correspondence should be addressed.
Sustainability 2023, 15(17), 12791; https://doi.org/10.3390/su151712791
Submission received: 11 July 2023 / Revised: 21 August 2023 / Accepted: 22 August 2023 / Published: 24 August 2023
(This article belongs to the Special Issue Slope Stability Analysis and Landslide Disaster Prevention)

Abstract

:
In dealing with issues such as soil erosion and slope instability, plant roots enhance the shear strength of the soil mass through their anchoring effect. However, in nature, cyclic loads such as flash floods and blizzards indirectly impose fatigue effects on plant root systems. To explore the impact of cyclic loads on the anchoring capacity of plant roots, this paper selects the roots of Betula platyphylla as the research object and uses a monotonic load and cyclic load as two loading modes. Under different loading amplitudes (25%, 50%, and 75%), root diameters and burial depths (50 mm, 100 mm, and 150 mm), and soil moisture contents (11.85%, 13.85%, and 15.85%), the effects of each factor on the anchoring capacity of the roots under cyclic loading are analyzed. The results showed that the root–soil interface exhibited two failure modes under different cyclic load amplitudes, and the cyclic load significantly reduced the maximum friction of the root–soil interface. As the cyclic load amplitude increased (from 25% to 75%), the hysteretic curve envelope area increased, and the growth rate of cumulative residual slip changed from decreasing to decreasing and then increasing. A good correlation was found between cumulative residual slip and the number of loading cycles, and the three characteristic slips were correlated with loading amplitude but not significantly with diameter. The increase in soil moisture content, root embedment depth, and diameter led to an increase in the ratio of the two maximum friction forces. It was shown that a certain degree of plasticity exists at the root–soil interface to resist environmental stresses in nature. At high fatigue stress levels, the root–soil interface is more nonlinear, and as the load amplitude increases, more energy is dissipated, and bond damage between the root–soil interface becomes more pronounced. The root–soil interface gradually degraded under long-term cyclic loading, whereas the increase in root depth and soil water content could resist the negative effect of cyclic loading on anchorage capacity, and the resistance effect became more and more obvious with the increase in diameter.

1. Introduction

With the current demand for sustainable development, plant measures are considered a prominent environmentally friendly approach compared to traditional engineering methods [1,2]. Soil erosion and landslides lead to the destruction of soil structure, causing problems related to downstream pollution and increased flooding, which leads to the deterioration of the ecological environment and has a huge impact on the stability of the ecosystem. When facing issues such as soil erosion and slope instability, utilizing plant root systems to reinforce soil has become a sustainable and eco-friendly engineering solution [3,4,5]. In soil mechanics, plant root systems are recognized as enhancers that can increase soil strength while reducing soil settlement and deformation [6]. Plants enhance the mechanical stability of soil through shallow root reinforcement, deep root anchoring, and lateral root traction [7,8,9]. When shear stress is present, relative movement occurs in the root–soil composite material, resulting in frictional forces at the interface between roots and soil. These forces transform the shear stress applied to the soil into tensile stress applied to the roots, thereby playing an anchoring role [10]. Therefore, studying the frictional properties of the root–soil interface can lead to a better understanding of the underlying mechanisms behind how plants respond to environmental stresses and root–soil anchoring in nature, which is of great significance in researching and responding to natural disaster problems such as soil erosion and landslides.
The anchorage performance of the root–soil interface is primarily validated using numerical simulations and root pull-out tests [11,12]. Currently, widely studied models for root–soil interaction include the Wu–Waldron Model, RipRoot Model, and Root Bundle Model, where the Root Bundle Model has been developed to address the limitations of the Wu–Waldron model [13,14,15,16,17]. It incorporates displacement as the fundamental variable to control the loading process and considers various factors such as the root diameter, length, bending deformation, root strength, soil properties, and frictional effects at the root–soil interface. This model provides a more accurate simulation and has gained significant attention in root–soil interaction research [18,19,20]. Furthermore, due to the reliance on numerical simulations on data obtained from field or laboratory experiments, the inherent complexity of the natural system involving the root–soil interface makes the quantification of root–soil interactions at this interface relatively complex. Scholars typically quantify the frictional characteristics of the root–soil interface by measuring the pull-out resistance of roots in the soil [21,22]. Research indicates that the frictional characteristics of the root–soil interface are influenced by multiple factors, including soil conditions, root parameters, and loading forms [23,24,25]. Studies have shown that for soils with larger particles, such as sandy soil, the contact area and contact force between roots and soil particles are larger, resulting in greater root–soil interface friction [26,27]. Meanwhile, the soil’s moisture content determines the stiffness and friction of soil aggregates, with a higher soil moisture content causing the soil to become loose and reducing the resistance to pulling forces and the frictional characteristics of the root–soil interface [28,29]. Additionally, the material properties and morphological parameters of the roots, such as the length, diameter, and surface area, also affect the frictional characteristics of the root–soil interface. Research indicates that roots with greater rigidity and larger diameters can withstand higher tensile forces. Increasing the length of the roots contributes to an increased contact area between roots and soil, thereby enhancing the frictional force at the root–soil interface [30,31,32,33].
However, in natural environments, root systems are not only subjected to tensile and shear forces but also experience cyclic loads such as floods, wind, and snow pressure [34]. These cyclic loads indirectly induce fatigue effects on forest root systems. The existing research on the frictional anchorage performance at the root–soil interface primarily focuses on monotonic loading conditions, while studies on cyclic loading conditions predominantly concentrate on the uniaxial fatigue mechanical properties of roots themselves, with relatively less emphasis on investigating the root–soil interface. Based on the principle of force equilibrium under quasi-static and uniform motion conditions, this paper argues that the root system slips at a constant velocity under constant loading, and the anchorage force at the root–soil interface is equal to the tension force. In the pull-out test of reinforced concrete, it is shown that the stress-slip curves of the reinforced concrete interface under cyclic loading exhibit different characteristics. The frictional anchoring effect between the roots and soil under cyclic loading is similar to the interfacial bonding performance of reinforced concrete under fatigue loading; fatigue loading can lead to failure of the bond interface between steel reinforcement and concrete, as well as slippage of steel reinforcement within the concrete. This can result in the degradation and accumulation of damage in both the concrete and steel reinforcement materials [35,36,37,38]. Drawing an analogy to the changes in bond characteristics between steel reinforcement and concrete under fatigue loading, this study analyzes the frictional anchorage characteristics at the root–soil interface under cyclic loading from a similar theoretical perspective, considering the evolution of hysteretic curves, the mechanisms of interface bond failure, and energy dissipation.
Northwest Hebei is a typical ecologically fragile area in China, and since the 1970s, a variety of vegetation growth patterns have been formed as a result of the implementation of reforestation projects to prevent soil erosion. Betula platyphylla, a deciduous tree belonging to the birch family Betulaceae, is a widespread species in eastern Asia. Its morphological characteristics are up to 25 m high, 50 cm in diameter at breast height, born on mountain slopes or in forests at an altitude of 400–4100 m, with great adaptability and wide distribution. It is a pioneer species for secondary forests in ecological restoration after environmental disturbances. B. platyphylla, as the main afforestation tree species, is widely distributed in the study area, which has a huge main root system and is windproof, drought-resistant, sun-loving, cold-resistant, and adaptable to various soil types. However, at present, the role of B. platyphylla’s root system in soil fixation in northwestern Hebei is not clear, and there are fewer related studies. In order to study the effect of environmental stress in nature on the anchoring effect between the root system and the soil, this study focuses on the root systems of B. platyphylla in the northwest region of Hebei Province, China. Factors such as the root’s diameter, soil’s moisture content, and cyclic load amplitude were considered. By referring to the bonding theory and analytical methods used in reinforced concrete interfaces, a root pull-out test was conducted under cyclic loading to quantitatively analyze the frictional anchorage characteristics between tree roots and soil. This research investigates the effect of cyclic loading on the anchorage performance of B. platyphylla’s root–soil interface, provides a theoretical basis and data support for the study of the anchorage characteristics of B. platyphylla’s root–soil interface, and has a certain reference value for the development of the related finite element model and the construction of the theory of root–soil consolidation.

2. Materials and Methods
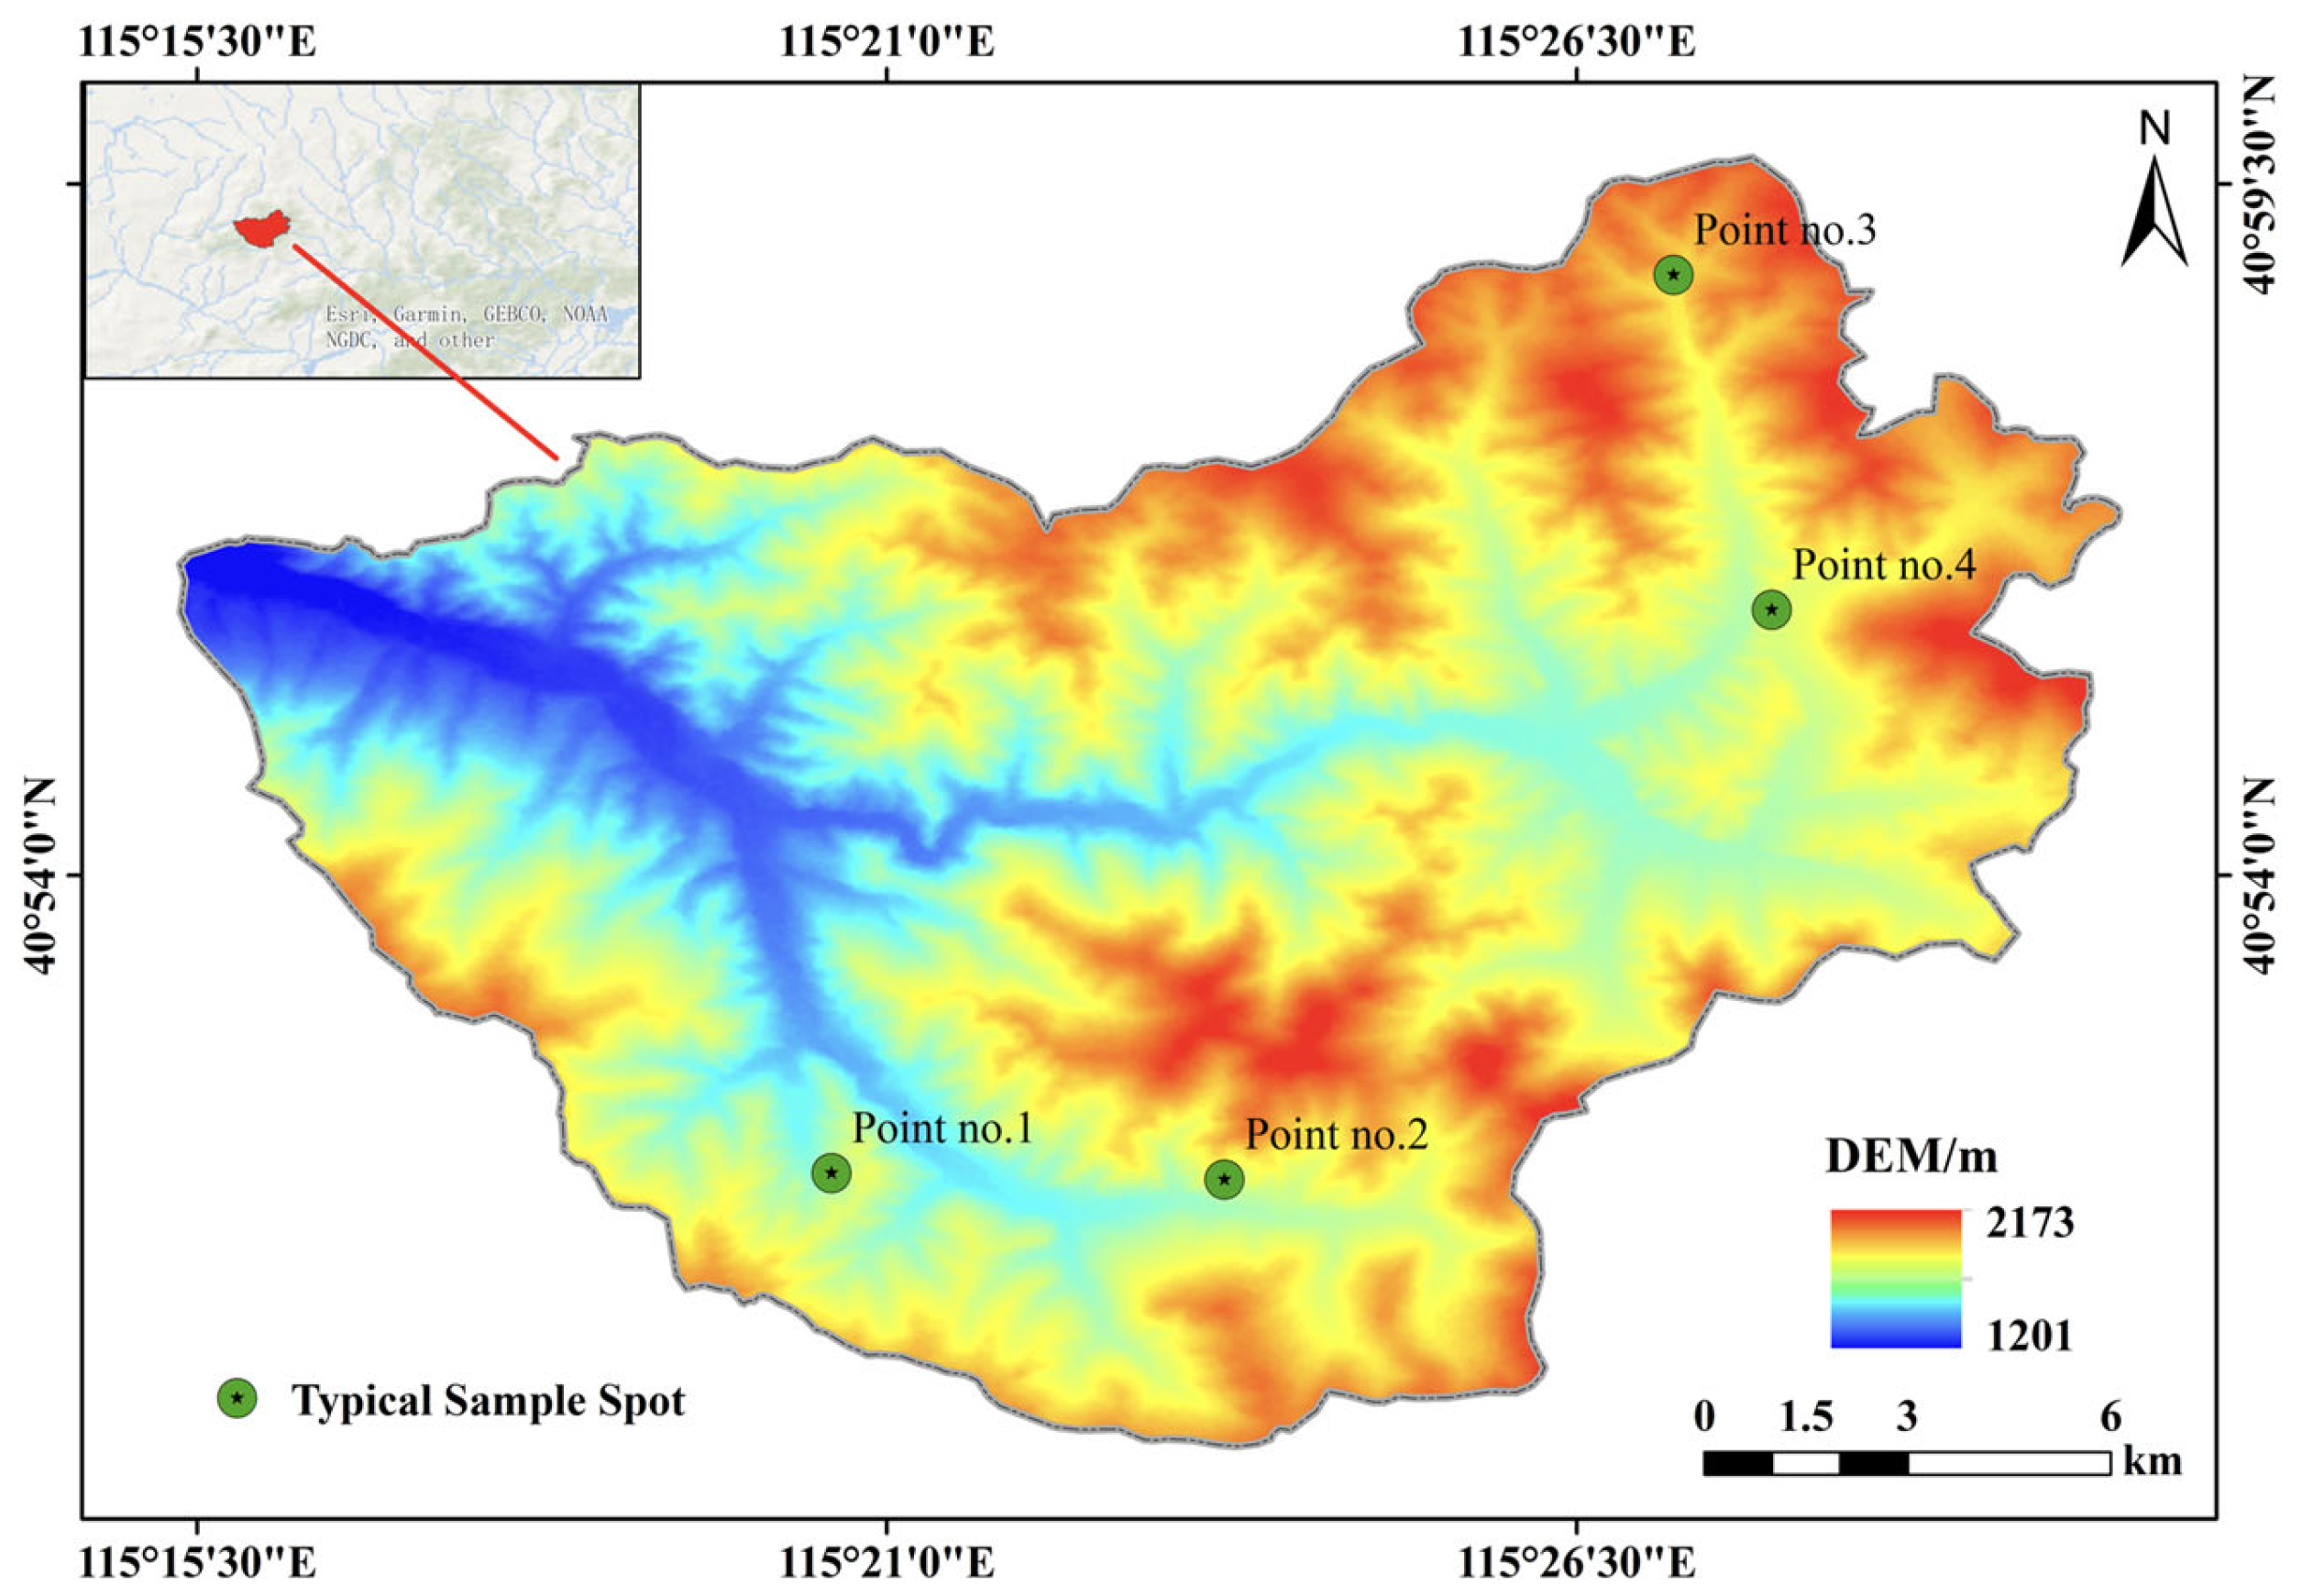
2.1. Study Area

The test roots and soil were collected from the Taizicheng River basin, Chongli District (40°50′–41°00′ N, 115°16′–115°31′ E), in Hebei province in northeastern China. The location map of the study area is shown in Figure 1. The study area is part of the East Asian continental monsoon climate zone, covering an area of 232.94 km2. The annual average temperature is 3.3 °C, and the annual average precipitation is 483.3 mm, with uneven distribution of precipitation, mainly concentrated from June to September, accounting for 75% to 80% of the total annual precipitation. The annual average sunshine hours are 2708.4 h. The soil in the forest area of the region is mainly brown. The vegetation type is mainly natural secondary forest vegetation, dominated by B. platyphylla, with some Populus davidiana, Betula albo-sinensis, Larix gmelinii, and Pinus tabulaeformis.

2.2. Soil and Root Collection

The roots of B. platyphylla, a primary natural secondary forest species in the study area, were selected as the research subject. Four healthy B. platyphylla trees aged 20 years were selected within the experimental area, all located on sunny slopes with a slope angle ranging from 23° to 28°. The entire root system was sampled using the complete excavation method. The selected trees were cut down 30 cm above the ground, and the soil around the trunk was carefully removed to expose the root system completely, as shown in Figure 2. After the roots were carefully selected, the diameters of the fresh roots with normal growth, no pests or diseases, and intact epidermis were measured using a Vernier caliper. Roots with diameters less than 10 mm were cleaned and placed in sealed bags, which were then transported back to the laboratory and stored in a refrigerator at 4 °C. To minimize root moisture loss, the root materials were tested within one week of sampling.
Four in situ soil samples were collected using the cutting ring method within a 1 m radius of four B. platyphylla trees. The top 20 cm of soil was removed, and soil samples were taken from a depth range of 20–100 cm. The soil was screened on-site to remove large soil clumps and stones and then placed in sealed plastic bags and transported back to the laboratory for measurement of the soil’s water content and density. These calculations were performed to prepare for the subsequent experimental variations in gradient changes. The soil water content ranged from 12.92% to 14.67%, and the soil’s dry density ranged from 1.54 to 1.61 g/cm3 across the four sampling sites, as calculated. Table 1 shows the soil properties near different B. platyphylla trees.

2.3. Test Device

The test device is a self-developed root drawing testing machine, as shown in Figure 3. The test apparatus consists of a specimen system, a drive system, a loading system, and a data acquisition system. The specimen system consists of a specimen box and a platform with displacement sensors fixed on both sides using magnetic bases. The 200 mm × 200 mm × 200 mm steel box has one wall-less side for filling and compacting soil samples and a movable surface fixed with bolts next to it. A 42 mm × 10 mm gap in the middle is for inserting and pulling roots. Additionally, a 4 kg iron hammer is provided for soil compaction. The drive system consists of two synchronous self-servo motors and vertical linear motion units. The loading system includes a movable motion beam (with a maximum thrust of 10 kN, a movement speed of 0.01–5 mm/s, and a positioning accuracy of ±0.05) and a clamp for securing roots (with a load sensor above it). The data acquisition system includes a 10 kN load cell (0–5 V), a precise LVDT displacement transducer (150 mm range, 0.0001 mm accuracy), a data acquisition instrument (model WS-5921/U60104, manufactured by Beijing Wavespectrum Science and Technology, Beijing, China), data acquisition and analysis software, and a computer.

2.4. Test Methods

The experimental procedure can be divided into the following four steps:
  • First, an appropriate amount of soil samples is taken and prepared as samples with different gradients of water content according to the specified experimental design. Once prepared, the different soil samples are divided into five layers in the specimen box and compacted to avoid soil stratification. When filling the third layer of soil, a portion of the soil is added first, and then the roots are buried into the pre-arranged gaps in the specimen box, adjusting the depth of the roots. After, a second filling and compaction are performed to ensure even stress distribution on the roots;
  • The reserved length for all roots outside the specimen box is 150 mm, including 50 mm of free length and 100 mm for clamping. The root part buried in the soil is divided into three sections of equal length, marked with a red marker pen, and the diameter of each section is measured using a caliper and averaged. If the diameter discrepancy among the three segments exceeds 0.5 mm, the root should be replaced. After completing the preparation of the specimens, allow them to stand for 24 h to reach a relatively stable state of contact between the roots and the soil. Seal the specimens with plastic wrap to prevent moisture loss from the soil in the specimen box, which may affect the experimental results;
  • After 24 h, fix the specimen box on the loading platform with the gap surface facing upwards and secure the roots with the clamp connected to the crossbeam. Then, pull the roots out of the soil at a constant speed of 10 mm/min while simultaneously collecting the force and displacement data of the root during the pulling process. Table 2 shows the experimental design and root physical parameters under monotonic loading;
  • Select the roots fully pulled out in the above steps without damage to the outer layer and are suitable for a second pull-out test. Clean the roots and prepare the specimens using the same method described above. After 24 h of standing, pull the roots out repeatedly for 100 cycles using a maximum cyclic pull-out force set at 25%, 50%, and 75% of the peak pull-out force. Once the preset force is reached, unload the roots until the load drops to approximately zero. Table 3 shows the experimental design under cyclic loading and the statistical number of roots under two failure modes.

3. Results

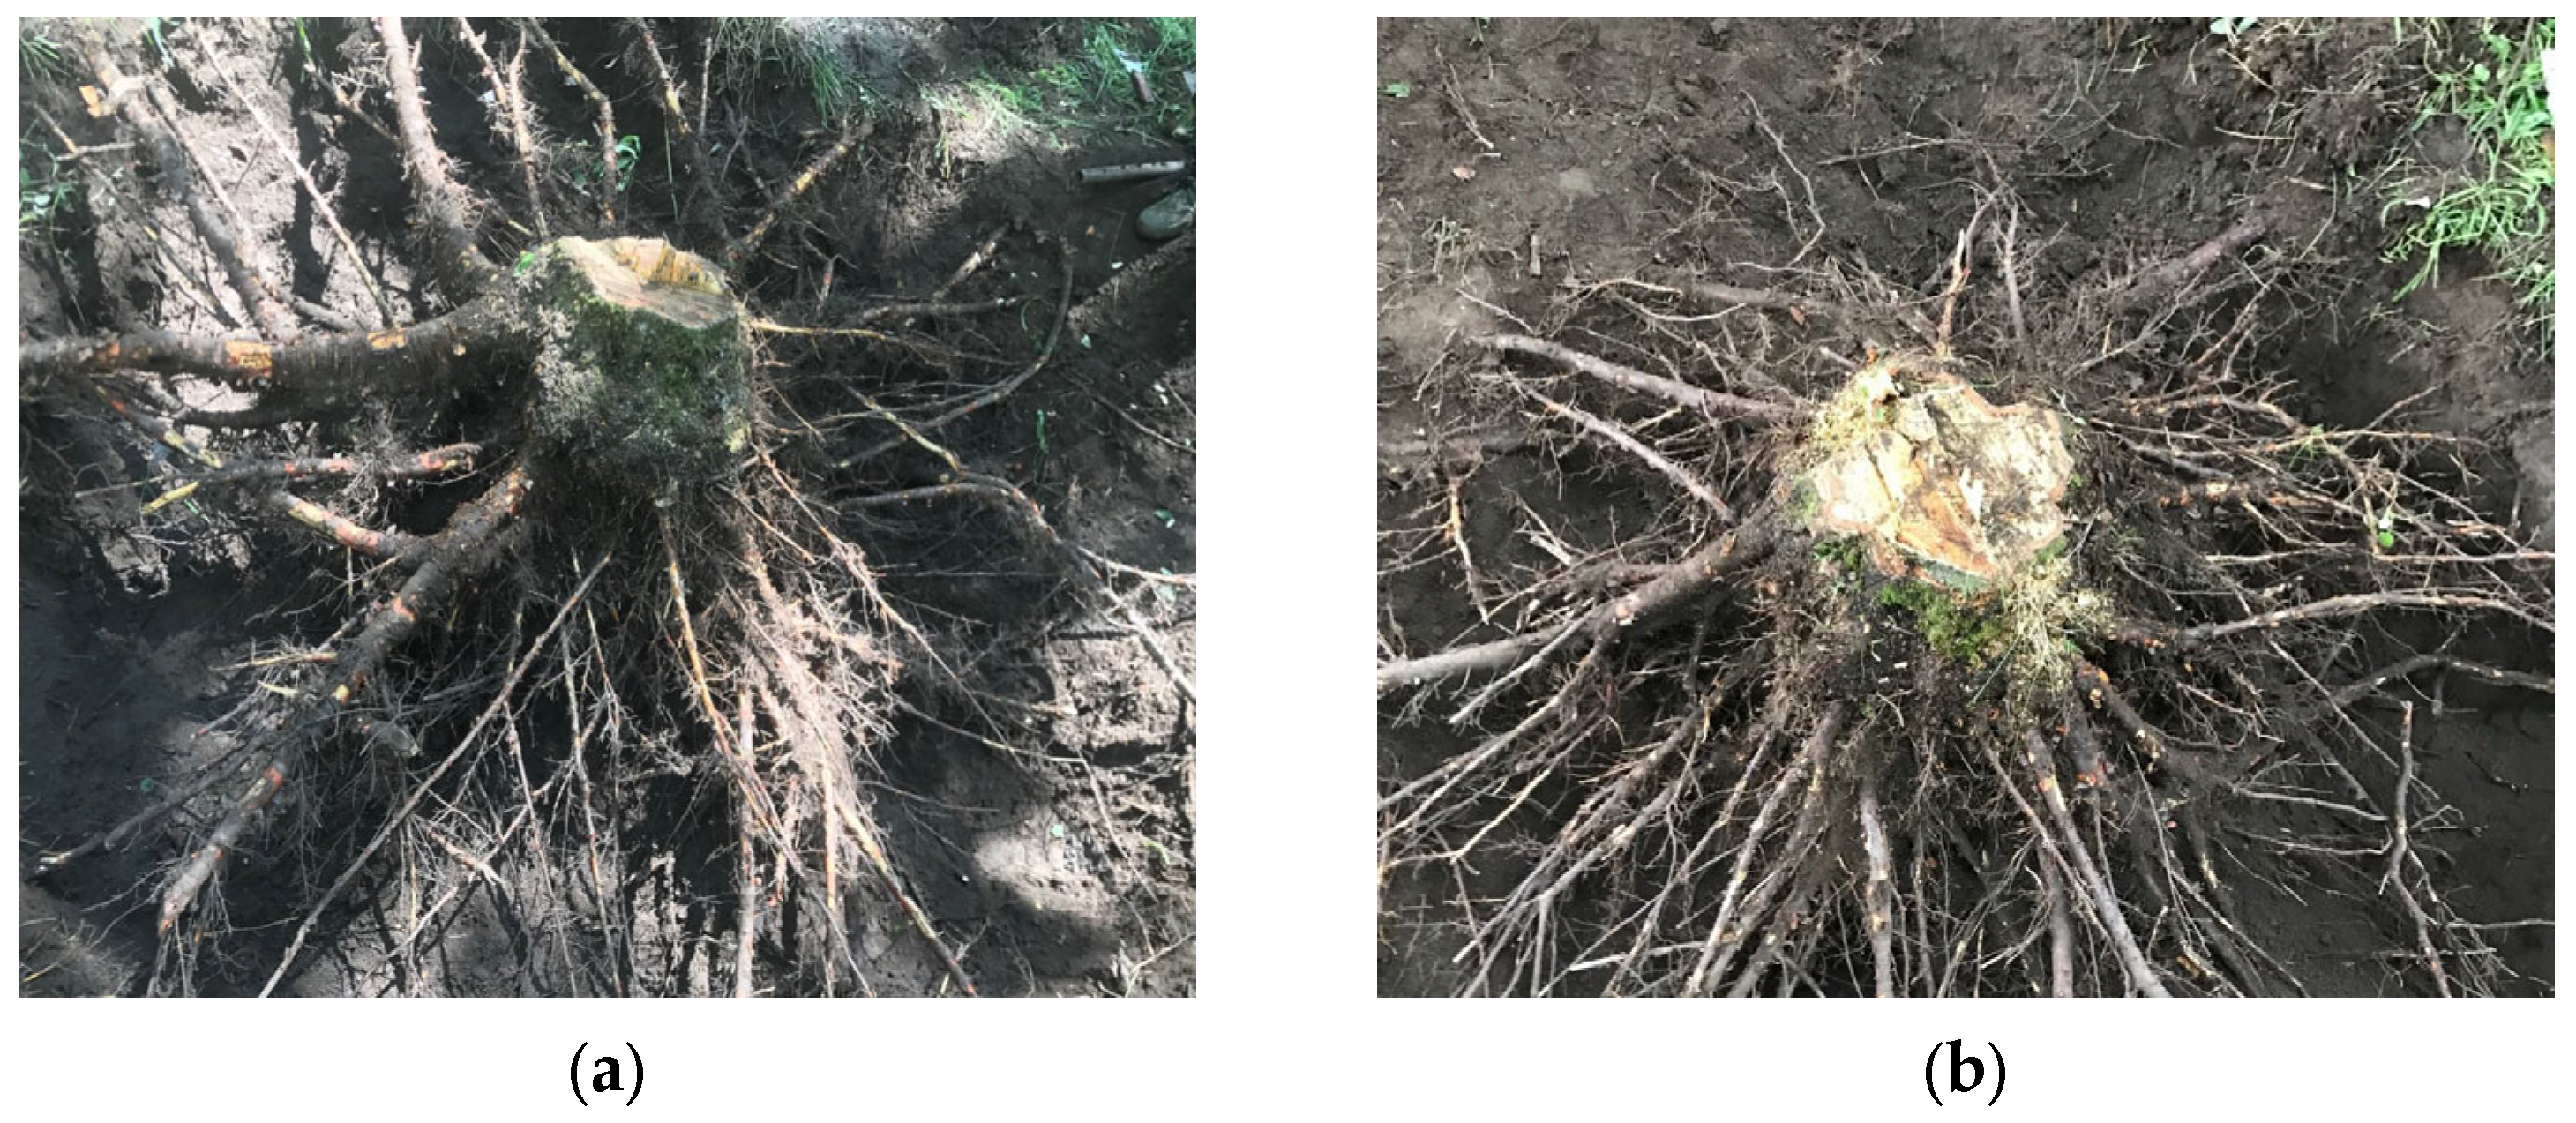
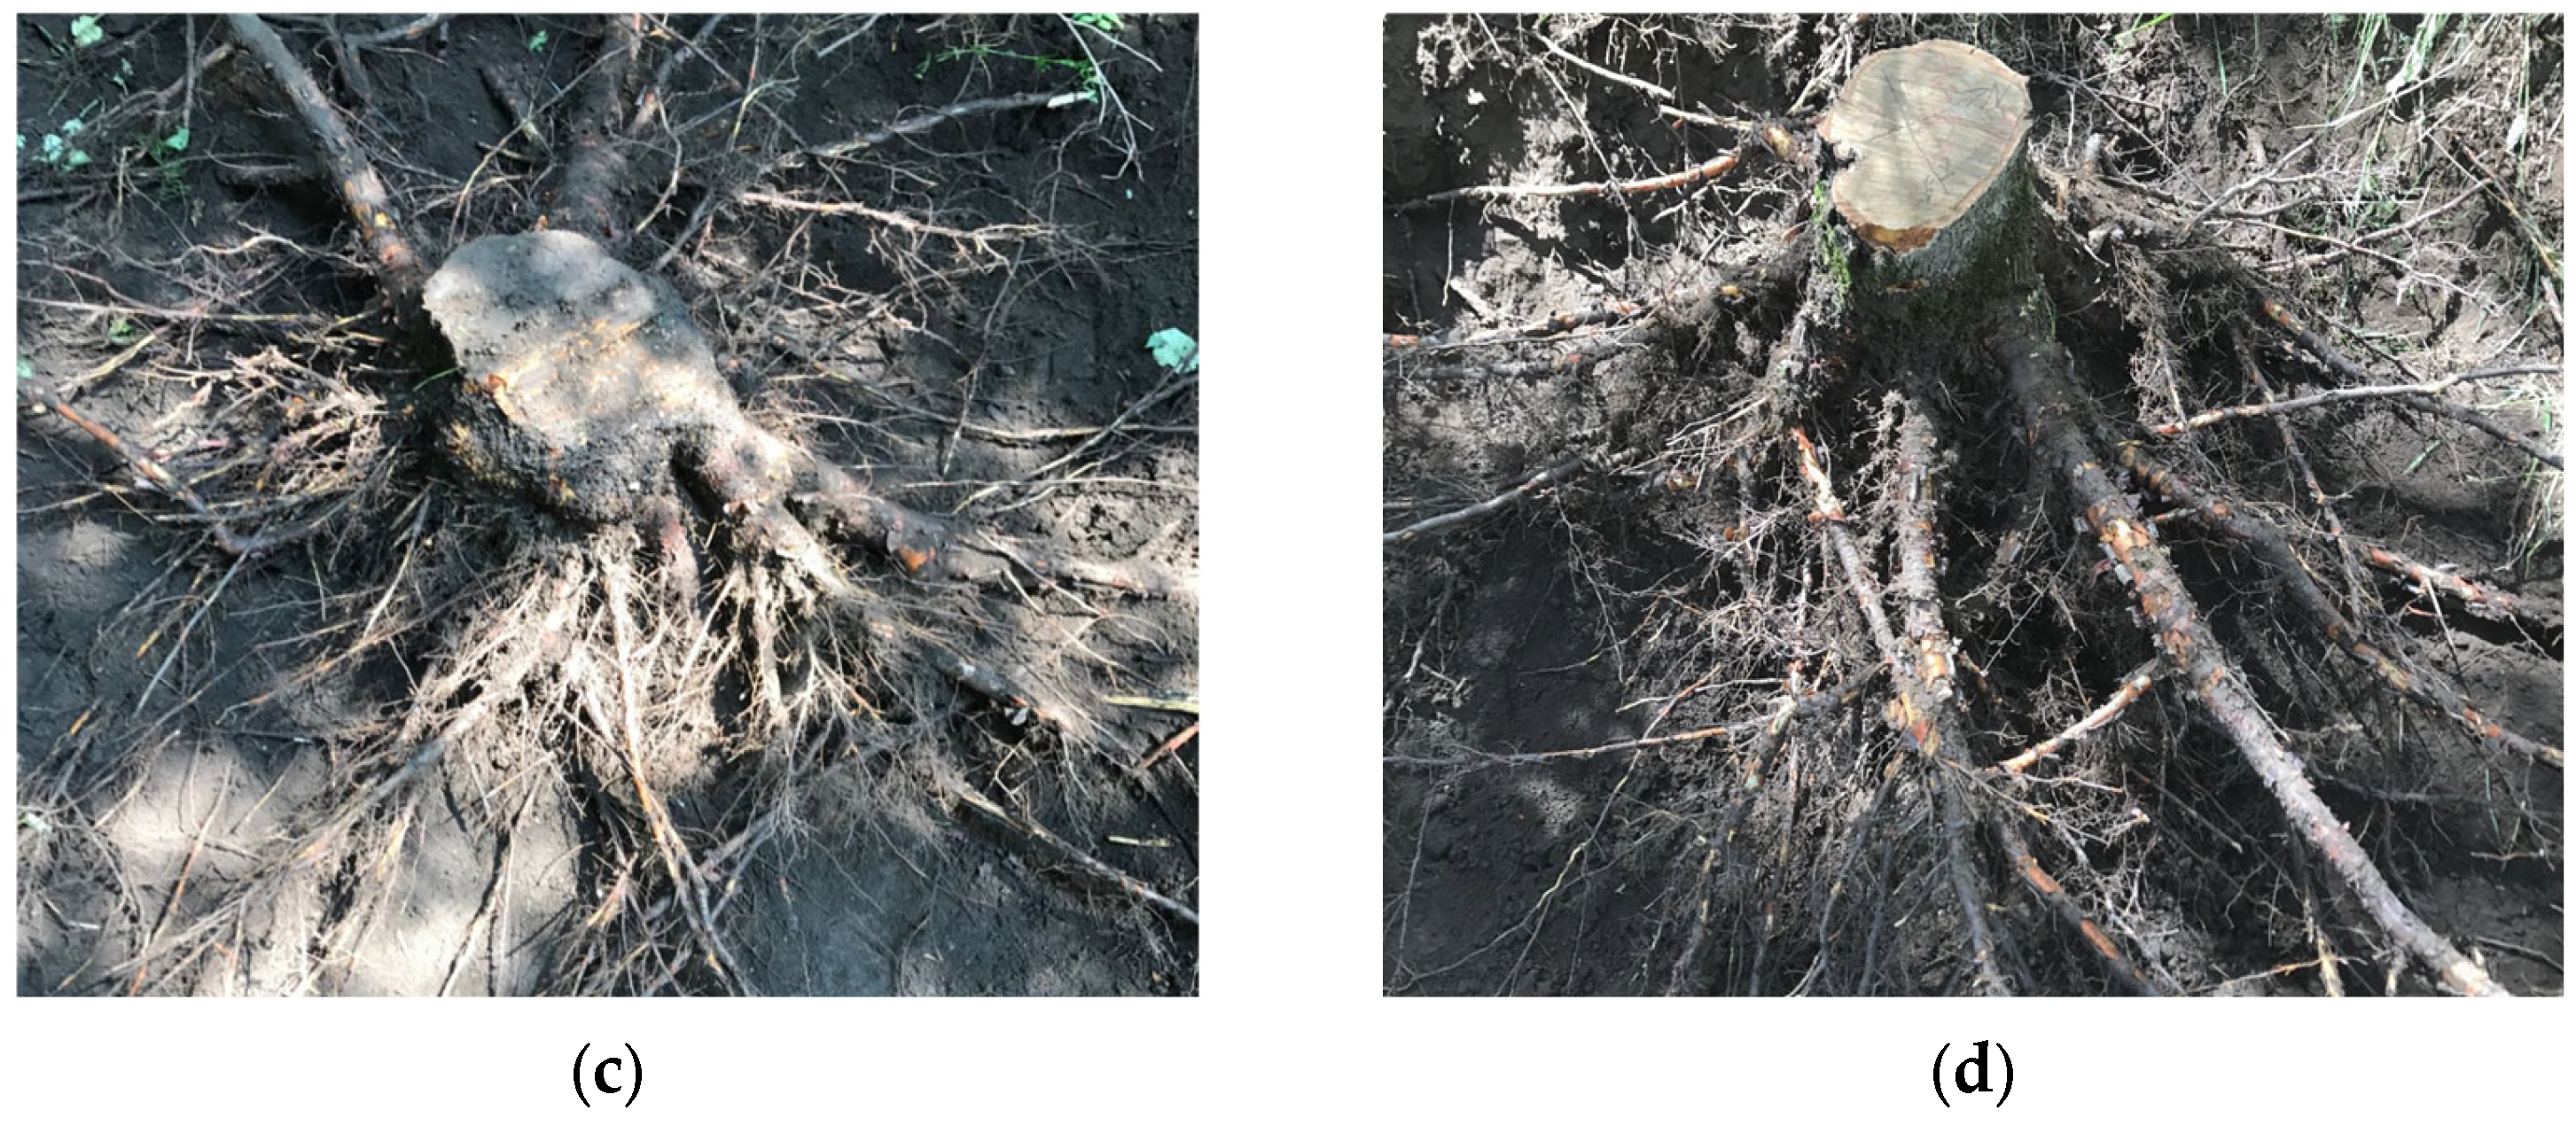
3.1. Failure Mode Analysis of Pull-Out after Cyclic Loading

During the pull-out process, there are two failure modes of roots in the soil—namely, pull-out failure and breakage failure. Pull-out failure occurs between the roots and the soil; when the external pull-out force is greater than the frictional force between the roots and the soil, the roots are pulled out. In this study, there are two cases of pull-out failure: one is when the number of root cycles in the soil reaches 100 under different cyclic loading amplitudes (25%, 50% of all roots, and 75% of some roots), and the roots are completely pulled out at a loading rate of 10 mm/min after 100 cycles, which is referred to as failure mode 1; the other is when the interface frictional force has decayed to the maximum value of the set load under the condition of 75% load amplitude, and the roots are pulled out at a rate of 10 mm/min before the number of cycles of some roots reaches 100, which is referred to as failure mode 2. Breakage failure is the internal failure of the roots; when the external pull-out force is greater than the tensile strength of the roots, the roots break. Breakage failure occurred only in the roots of the K group with a diameter of 2.02 mm, where the experimental data was minimal. Subsequent result analysis did not involve breakage failure; hence, no analysis was carried out on its failure mode. The number of roots under each failure mode is shown in Table 3. The pull-out force–slip curve of the root under cyclic loading exhibits obvious periodic characteristics, and the pull-out force–slip curves under different failure modes have different stage characteristics. The specific stage characteristics are as follows.
Failure mode 1 occurred at 25%, 50%, and, to a lesser extent 75% cyclic loading amplitudes. In this failure mode, after each cyclic loading and unloading, the root system generates a certain amount of unrecoverable slip on the soil contact surface (residual slip), and the existence of residual slip causes the paths of the force–slip curves of the loading and unloading segments to fail to coincide, resulting in a nearly closed loop curve, which is known as the ‘hysteretic curve’. In the cyclic loading process, the hysteretic curve along the positive direction of the transverse coordinate is constantly advancing and has the characteristics of cyclic change; the residual slip is larger when the first cycle of loading and unloading is completed. As the number of cycles increases, the residual slip generated by each individual cycle segment decreases, resulting in a denser and denser hysteretic curve. After completing 100 cycles of loading, the root system was not pulled out, and the tensile force at this point did not reach the maximum interfacial friction. In order to investigate the effect of cyclic loading on the maximum friction at the root–soil interface, the tensile force was continued to be increased beyond the maximum tensile force setting until the maximum interfacial friction was reached and the roots were pulled out at a uniform rate. The cyclic loading process is accompanied by the accumulation of continuous bond damage at the root–soil interface (the presence of residual slip is one of the forms of damage), resulting in the maximum pull-out force after cyclic loading being smaller than that under monotonic loading. The pull-out force–slip curves before and after cyclic loading are shown in Figure 4.
Failure mode 2 occurs at 75% cyclic loading amplitude. In this failure mode, the number of cyclic loading could not reach the preset value (100 times), and the first half of the pull-out force and slip curves were similar to that of failure mode 1, with the hysteretic curves evolving from sparse to dense. The difference is that in the second half of the curve, the residual slip increases, and the hysteretic curve evolves from dense to sparse. In general, the hysteretic curve in failure mode 2 is fuller, and the spacing between neighboring curves decreases and then increases. In the last loading process, the roots were pulled out before the maximum pull-out force was reached, and the maximum pull-out force after cyclic loading was still smaller than the maximum pull-out force under monotonic loading. An increase in the spacing of the hysteretic curves implies an increase in the residual slip, which represents an increase in the plastic deformation of the root system as well as an increase in the irrecoverable slip, thus affecting the original steady state of the root–soil interface, both in terms of stronger bond damage between the root–soil interface. The pull-out force–slip curves before and after cyclic loading are shown in Figure 5.

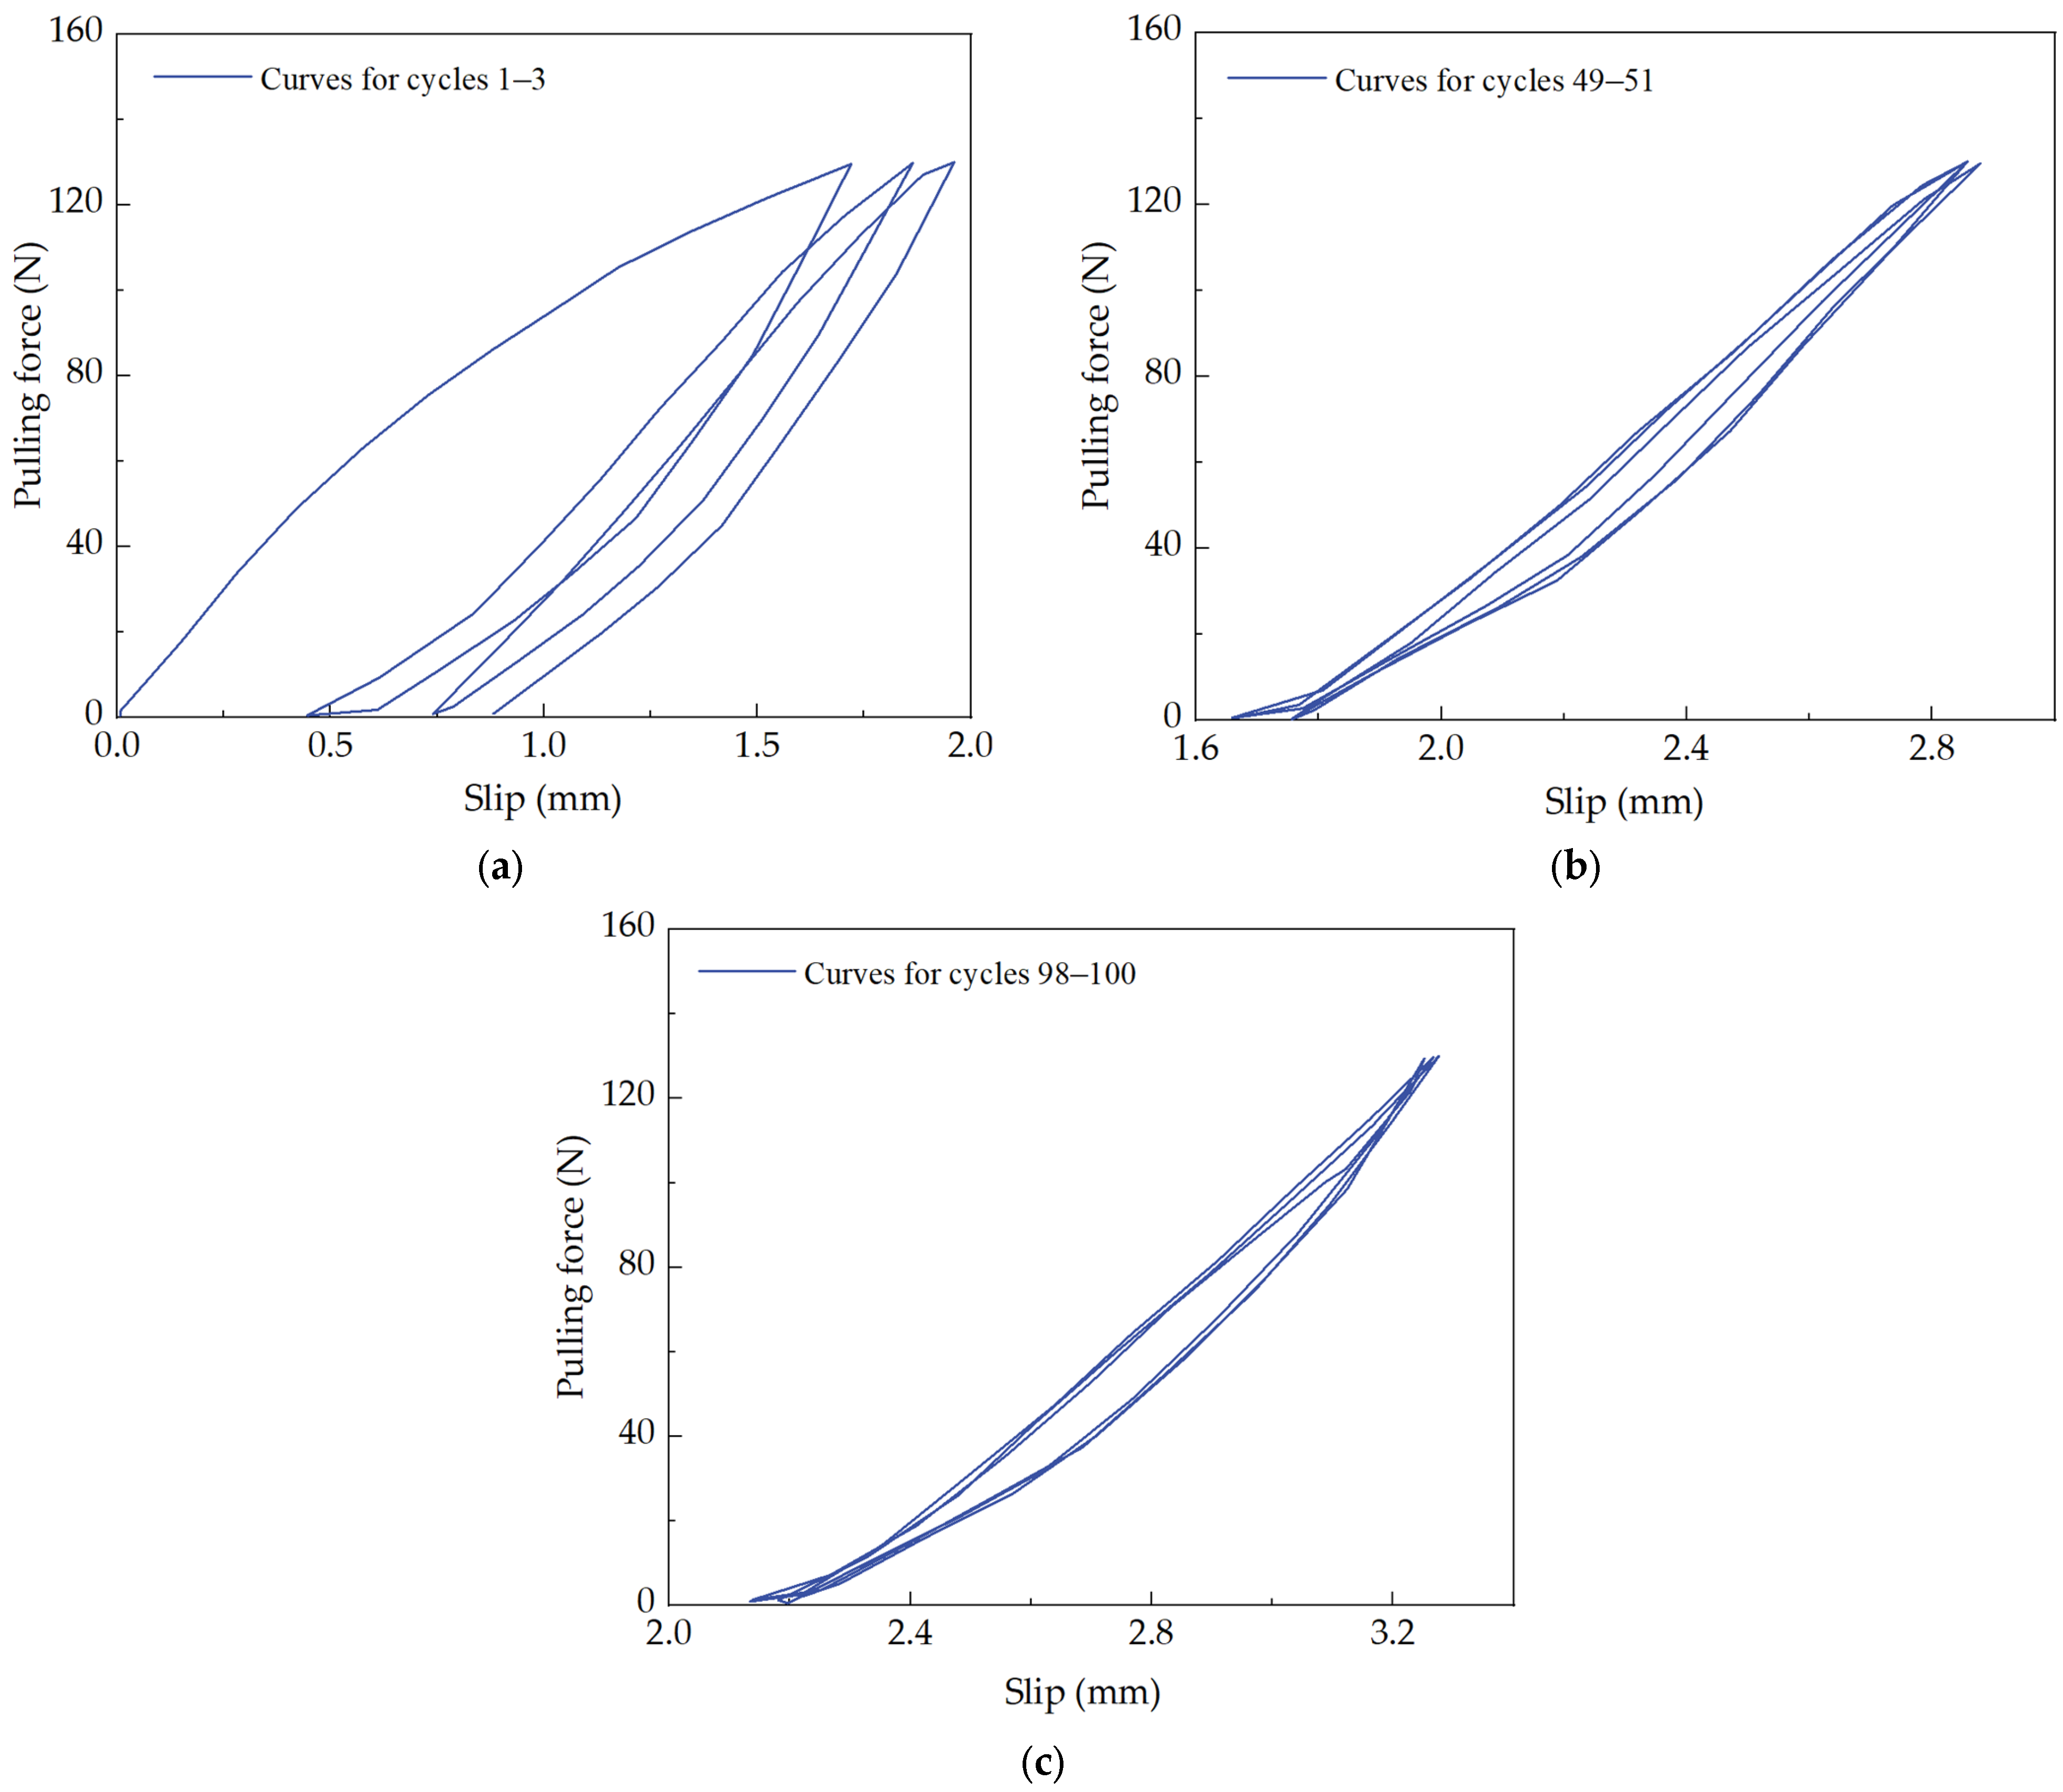
3.2. Evolution Characteristics of Root Pull-Out Force–Slip Curve under Cyclic Load

Just as the interface bonding characteristics of reinforced concrete manifest under cyclical loads, root systems subjected to repeated loads in the soil also elicit cumulative effects of interfacial bond damage. This process is influenced by many factors, including the roughness of the root surface, the stochastic distribution of soil particles, and the variable bonding conditions between root and soil. These elements collectively determine the distinct morphologies of pull-out force–slippage curves under various cyclic loading conditions and across diverse root systems. A universal characteristic across all these scenarios is the formation of hysteretic curves bearing cyclical traits, as loading and unloading paths do not coincide throughout the cyclic process.
Under the influence of cyclic loads, root systems, as elastoplastic materials, exhibit certain degrees of elastic and plastic deformation, with the latter accumulating persistently. Once each load–unload cycle is completed, the hysteretic curve, encompassing both phases, shifts rightward. Consequently, the horizontal length of the unloading curve can be regarded as elastic slippage, which includes the elastic displacement between the root and soil as well as the root’s inherent elastic deformation. Moreover, the discrepancy in the horizontal coordinates of the load and unload curves signify the residual slippage generated from a single load–unload cycle. This part of the slippage primarily consists of the root’s plastic deformation and the irrecoverable slippage caused by the disruption of the root–soil bonding interface. Upon the final unloading, a certain amount of elastic slippage emerges, while the cyclic process induces the accumulation of plastic slippage and root deformation, referred to as residual slippage, as depicted in Figure 6.
From an energy perspective, the work performed using cyclic loading mainly facilitates relative slippage between the root and the soil. Part of this energy results in elastic slippage of the root within the soil, which can be recovered after unloading. On the other hand, the rest of the energy dissipates in other forms, leading to plastic slippage (or residual slippage) within the root, a unidirectional and irreversible process. Due to the energy dissipation during the cyclic pulling process of the root, the unloading segment of the pull-out force–slippage curve does not follow the original loading path and instead slightly falls below the loading curve. As illustrated in Figure 7, the area enclosed by the curve ACD represents the work on the root system during a single load, including the resultant elastic slippage and the elastic deformation caused by root stretching. Meanwhile, the area enclosed by the curve BCD represents the elastic strain energy released by the root during unloading. The difference in these two areas, denoted as SD, represents the energy consumed during this cyclic loading–unloading process. As this process repeats, residual slippage continuously occurs between the root and soil, accompanied by sustained energy dissipation.
To contrast the phase changes in hysteretic curves under different cyclic loading amplitudes, we can take 50% and 75% of cyclic loading amplitudes as examples (the overall trend of hysteretic curves under 25% and 50% cyclic loading amplitude is similar): under these two conditions, the offsets and residual slippage of the hysteretic curves exhibit different evolutionary rules. Under the 50% condition, after each loading cycle, the hysteretic curve shifts to the right and produces slippage, but this slippage gradually diminishes, which in turn gradually increases the slope of the tangent line of subsequent hysteretic curves, causing them to become steeper and increasingly crowded. However, under the 75% condition, the irreversible slippage generated after the first cycle is greater, and the subsequent hysteretic curves shift to the right, leaving residual slippage. This trend first decreases and then increases, with the curves initially becoming denser and then sparser until the root system is pulled out.
The trend changes, and characteristics of the hysteretic curves under these two conditions are shown in Figure 8 and Figure 9. When the cyclic loading amplitude is larger, the hysteretic curve is more abundant, the envelope area is larger, and more energy is consumed in a single cycle. At the same time, the amount of slippage generated by a single load is relatively larger, and the recoverable slippage is also relatively larger. This implies that under higher cyclic loading amplitudes, the damage to the root–soil interface adhesion is more severe.

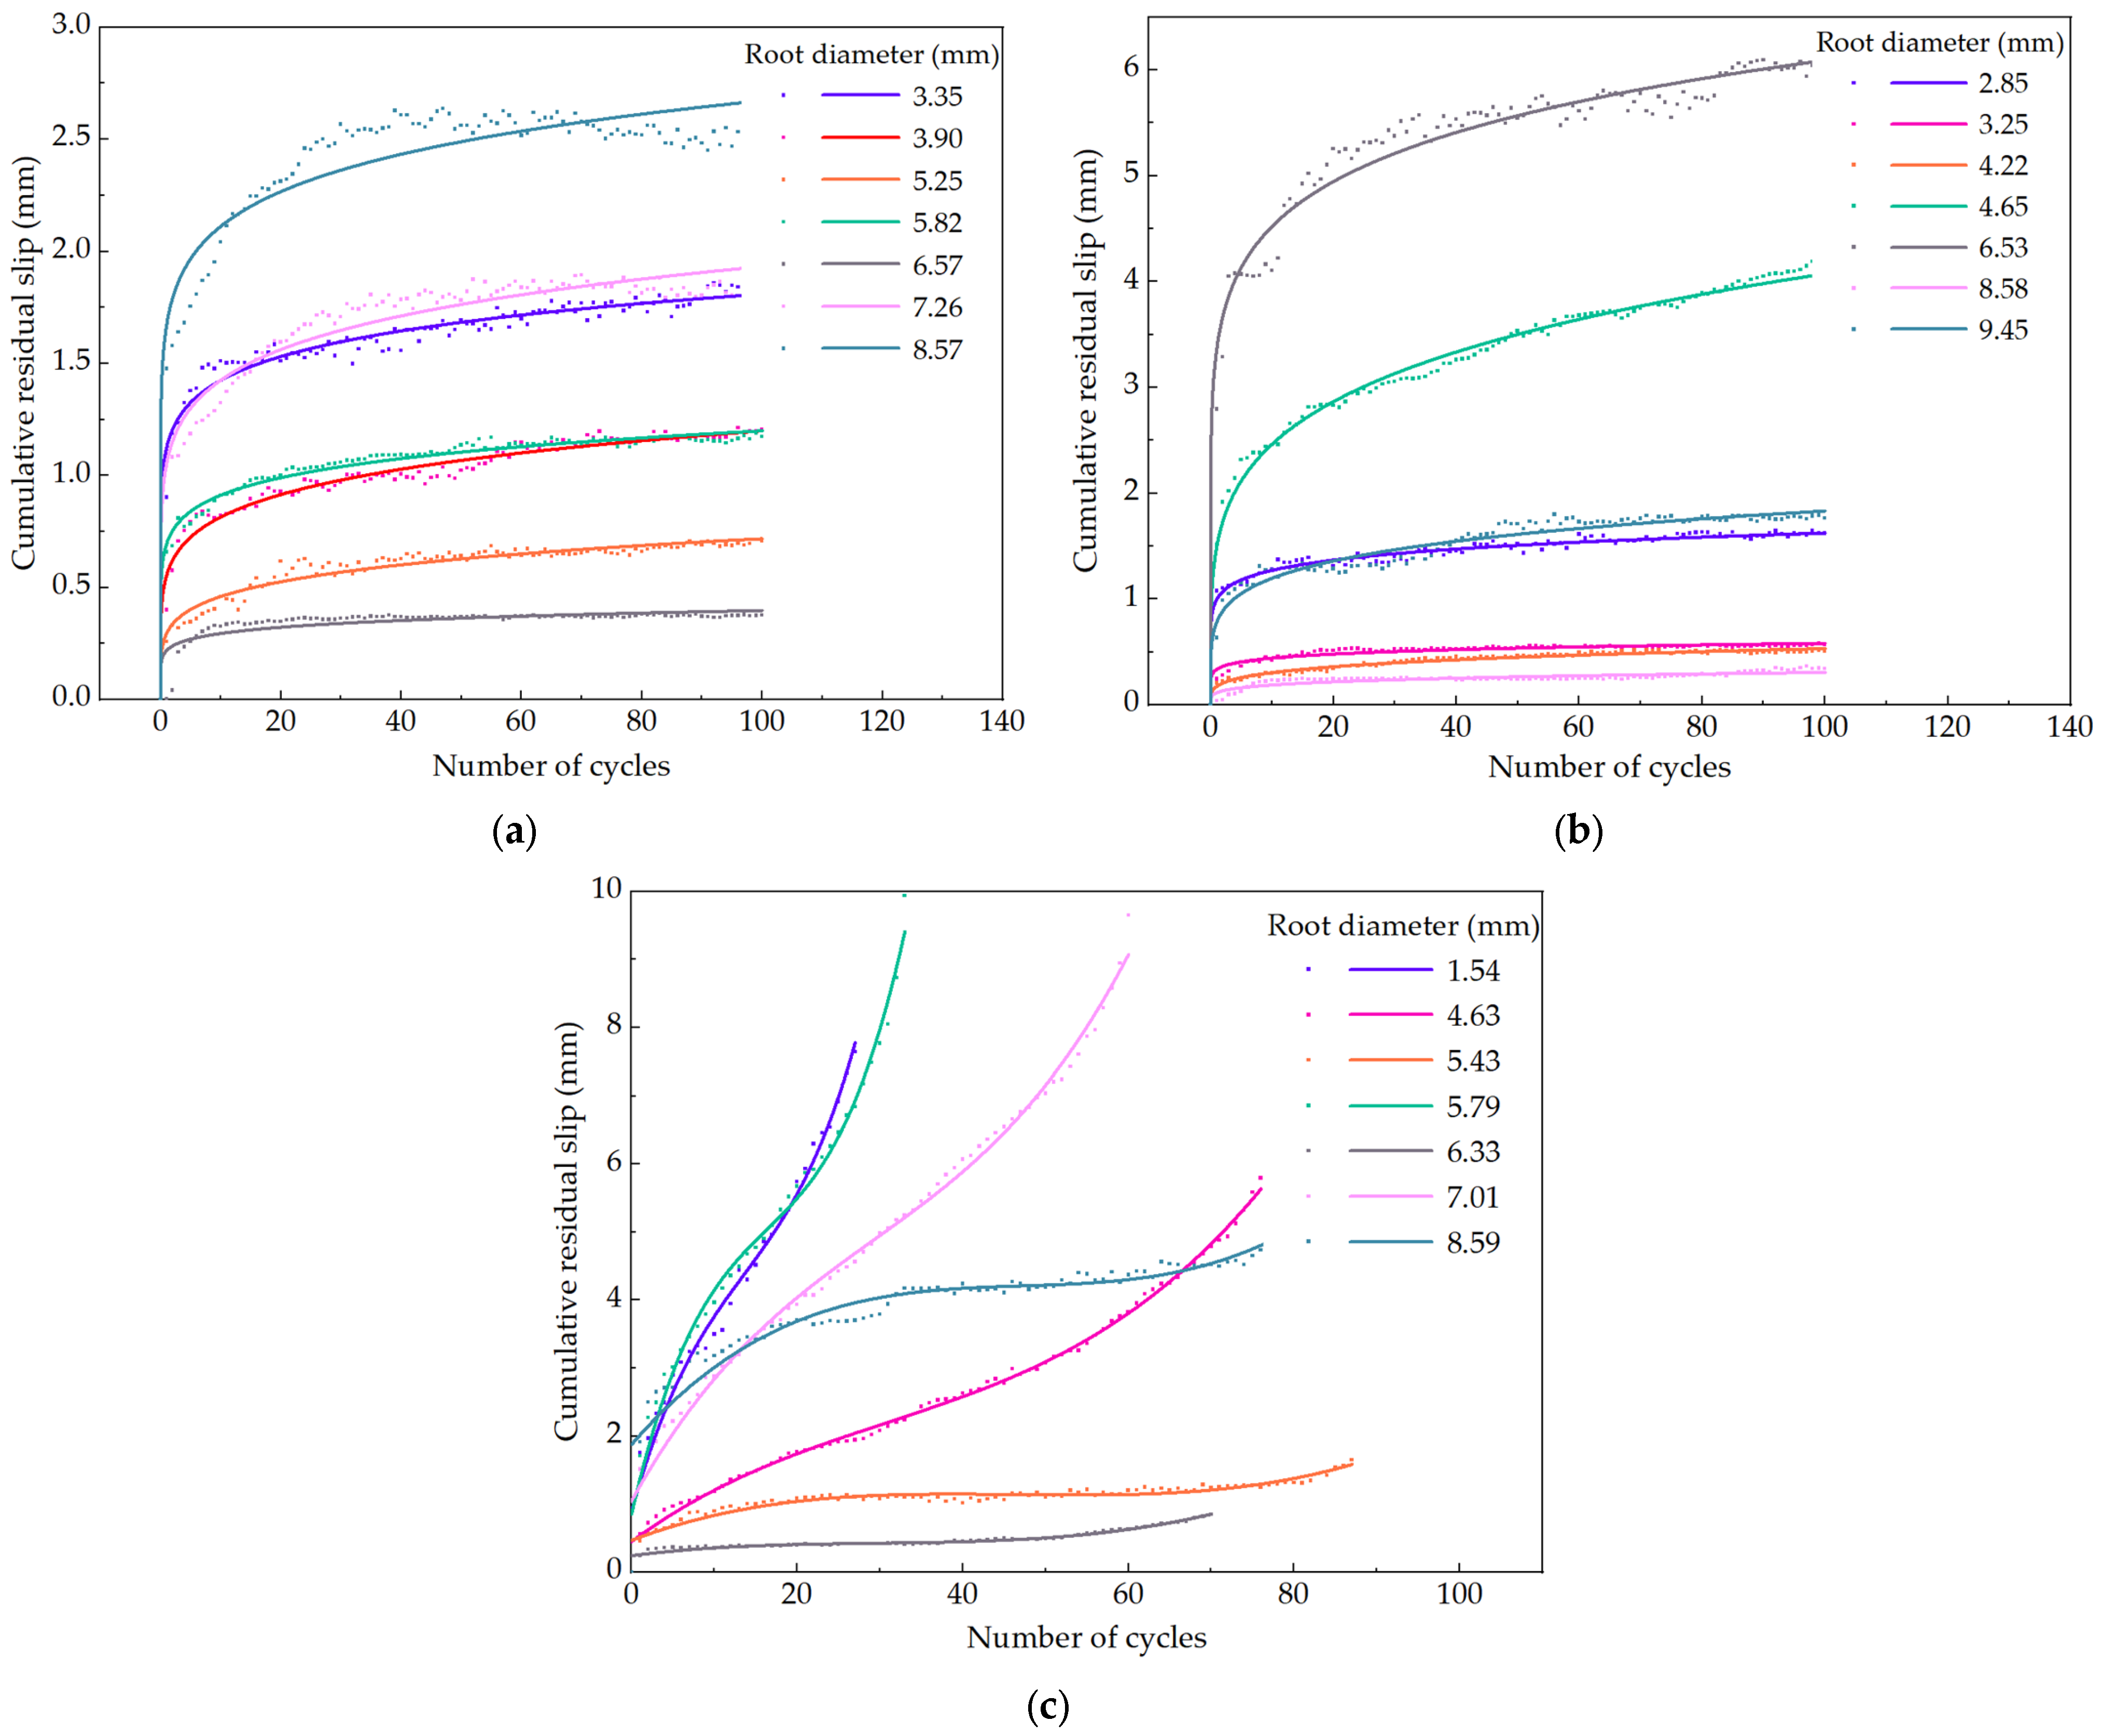
3.3. Trends in Cumulative Residual Slip at Different Loading Amplitudes

The denser the hysteretic curve, the smaller the residual slip, and the trend of cumulative residual slip can reflect the trend of the hysteretic curve to a certain extent. To more intuitively display the trend of the hysteretic curve, the cumulative residual slip after each cyclic loading under different cyclic amplitude conditions was analyzed (selecting groups H–J from Table 3), as shown in Figure 10.
In the figure, we can see that under the conditions of 25% and 50% amplitude loading, the number of cyclic loading times reached 100, and as the number of cycles increased, the growth rate of cumulative residual slip became smaller and smaller, which is consistent with the previously analyzed trend of the hysteretic curve (from sparse to dense, the envelope area decreases from large to small). Under the 75% condition, the number of cycles did not reach 100, and the growth rate of cumulative residual slip was slow at first and then fast, which is also consistent with the previous analysis. In addition, the growth rate of cumulative residual slip can reflect the stability of the root anchoring in the soil to a certain extent.
Under the three load amplitude conditions, the growth rate of the slip went through a stage from fast to slow. We can assume that in the slow stage (when the curve becomes almost straight), the root is in a relative ‘equilibrium state’. At this stage, the cyclic load on the root does not have a significant impact on the actual anchoring ability because the change in residual slip is very small. However, under higher cyclic load amplitudes, this state is quickly disrupted, manifesting as the growth rate of cumulative residual slip begins to increase, resulting in the number of cyclic loadings not reaching the preset value.

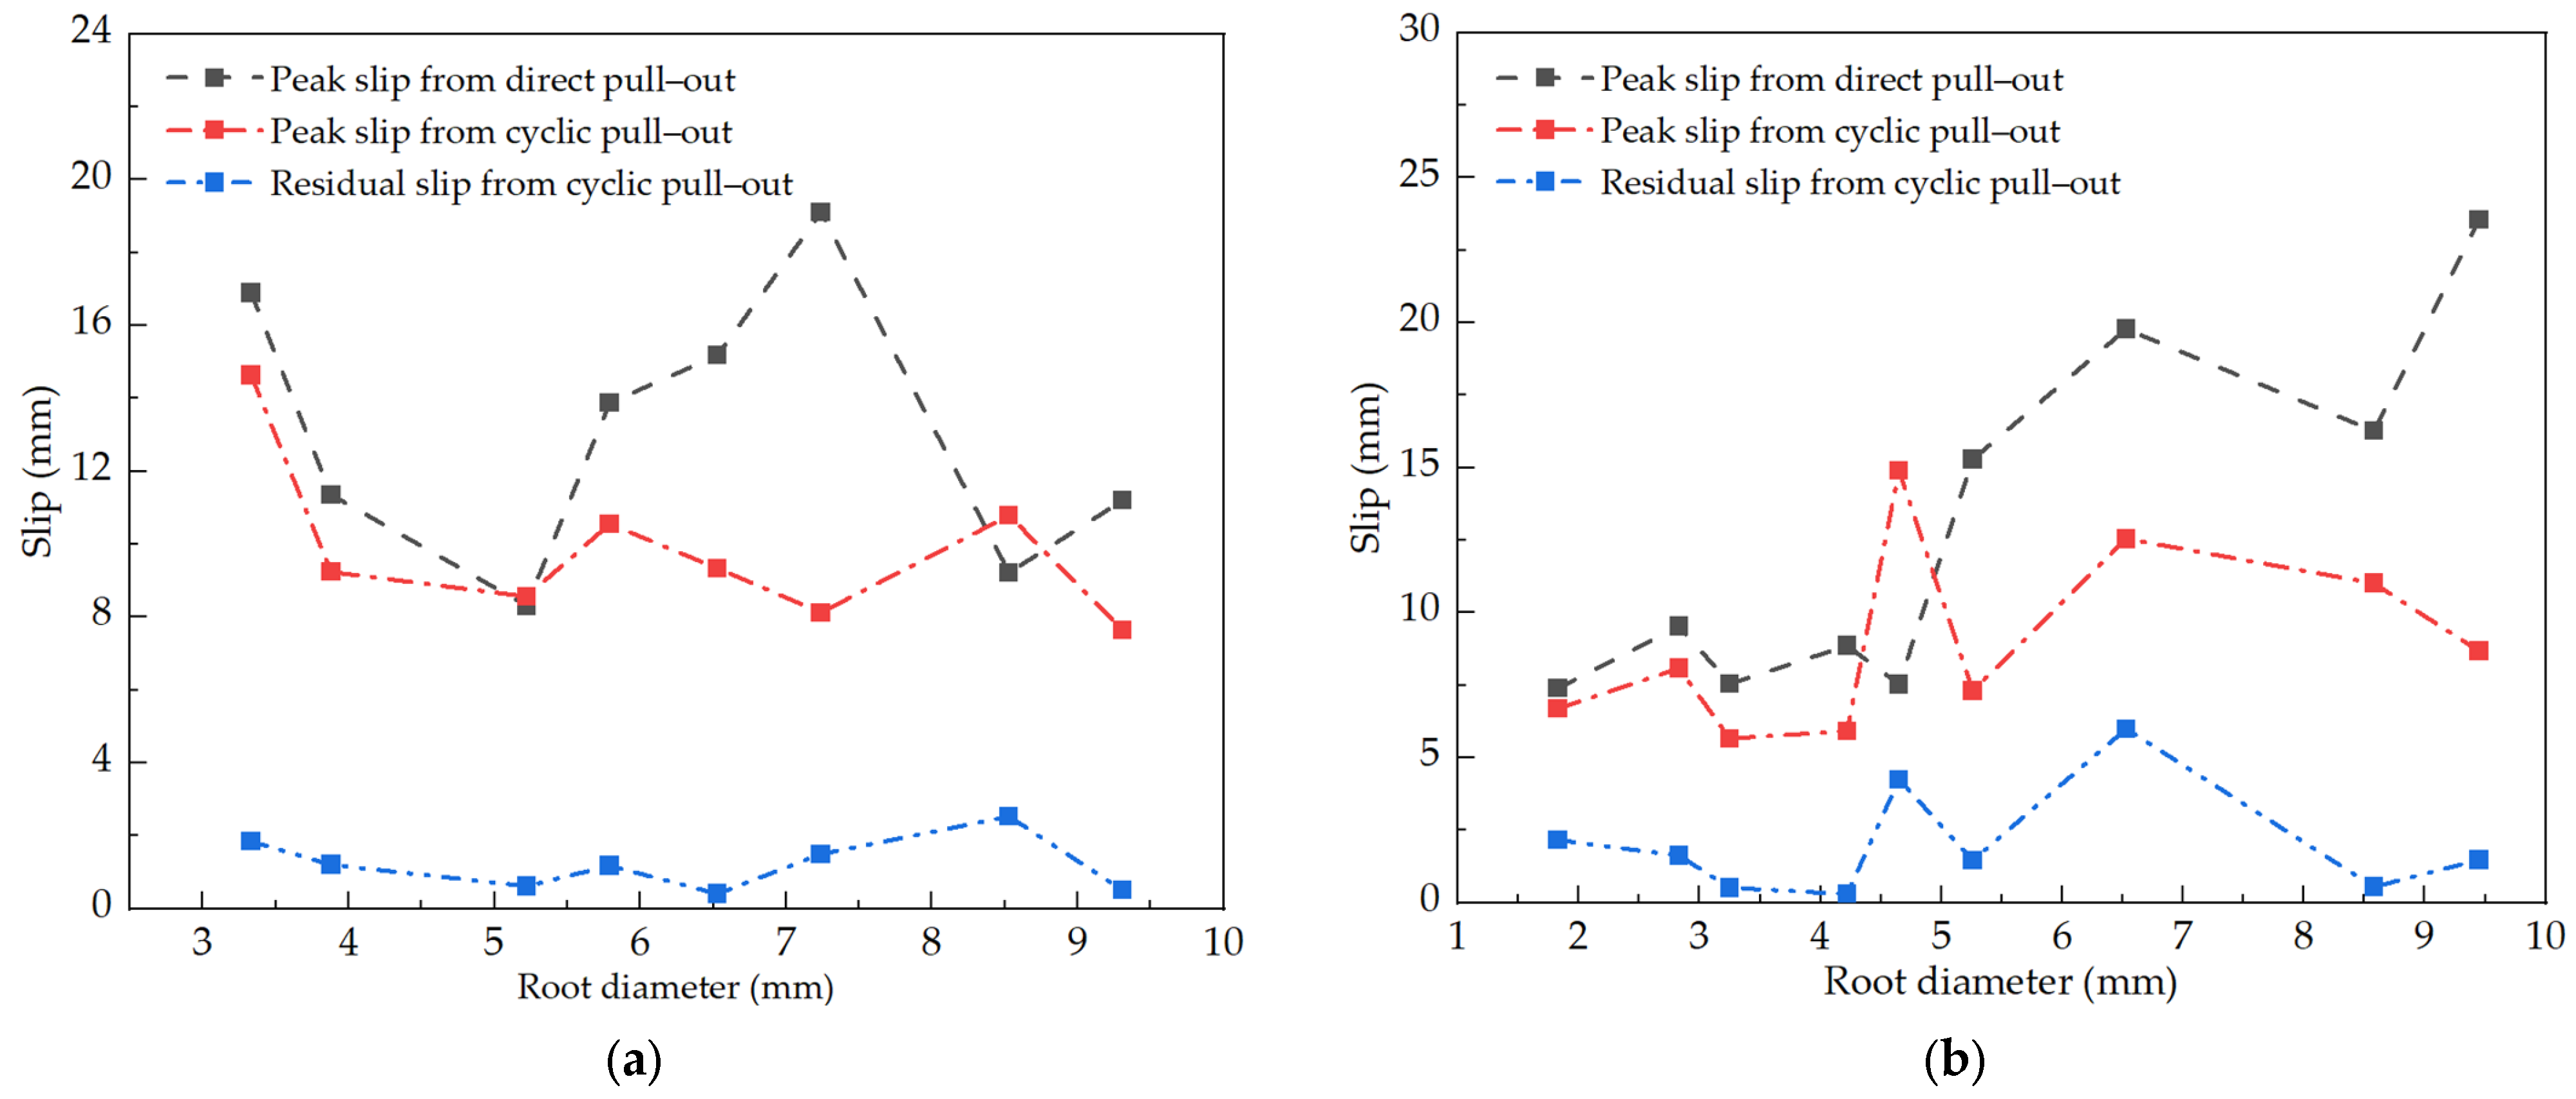
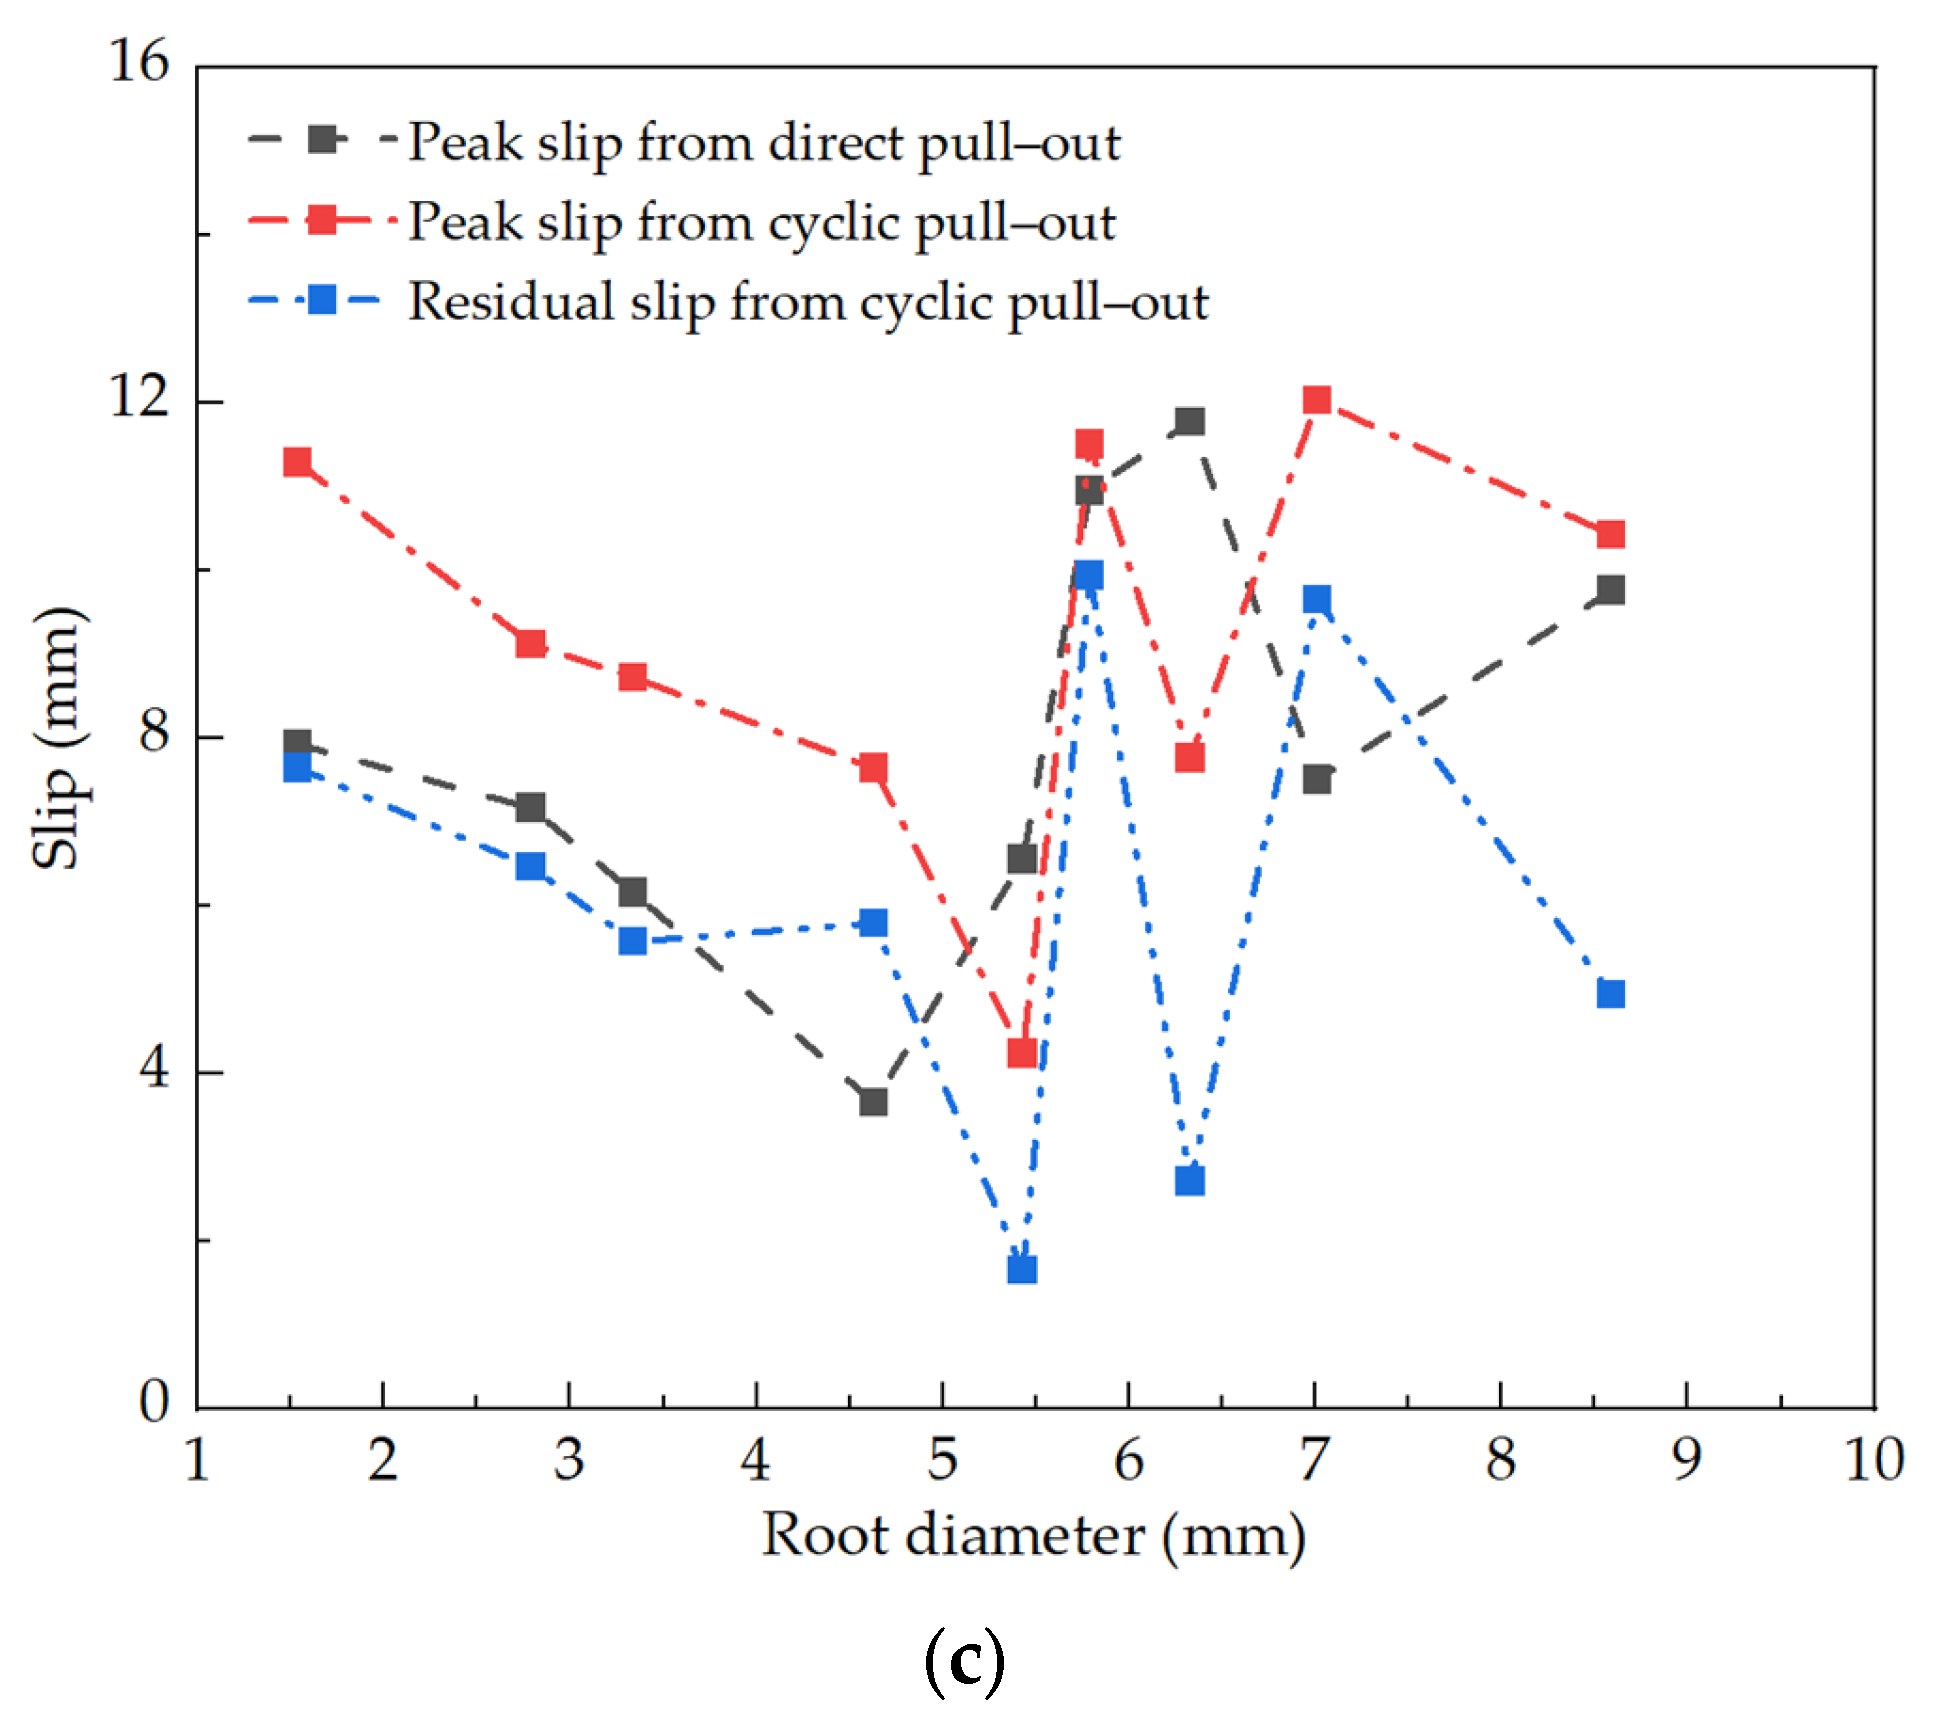
3.4. Comparison of Characteristic Slip under Different Load Amplitudes

Under monotonic load conditions, the root undergoes a direct pulling process, during which the frictional force at the root–soil interface rises to its maximum, forming the maximum pull-out force. The displacement caused by this force is defined as the direct pull-out peak slip. However, when the root moves under the cyclic loads, the values of the slip and residual slip continue to increase. After cyclic loading and unloading, a certain amount of residual slip accumulates, which we call the residual slip after cyclic loading. In the final pull-out process of the root, the slip corresponding to the maximum pull-out force is defined as the peak slip after cycling.
According to different cyclic loading amplitudes (refer to groups H to J in Table 3), we can observe various changes in these three characteristic slips, as shown in Figure 11. The figure shows that under the influence of cyclic loads, all roots demonstrate a certain amount of residual displacement. However, these three characteristic slips did not show a significant correlation with the diameter of the root. For cyclic loading amplitudes of 25% and 50%, after a series of loading and unloading cycles, due to the decrease in the adhesive performance of the root–soil interface, the maximum pull-out force of the root decreases, thereby causing the peak slip after cycling to be less than the direct pull-out peak slip, as shown in Figure 11a,b. Under a cyclic loading amplitude of 75%, the residual slip after cyclic loading significantly increases, approaching the peak slip of direct pull-out. Additionally, when the root diameter is greater than 4 mm, due to the increase in root diameter causing a larger epidermal area and more complex soil contact area, the situation where the residual slip is greater than the peak slip of direct pull-out appears, as shown in Figure 11c.
Overall, cyclic loading leads to a decrease in the adhesion performance of the root–soil interface and the anchoring performance of the root in the soil, so the peak slip after cyclic loading is generally less than the peak slip after direct pull-out. However, at higher cyclic loading amplitudes, the dispersion of residual slip is greater, which is due to the emergence of more irreversible nonlinear effects at higher fatigue stress levels, leading to greater residual slips.

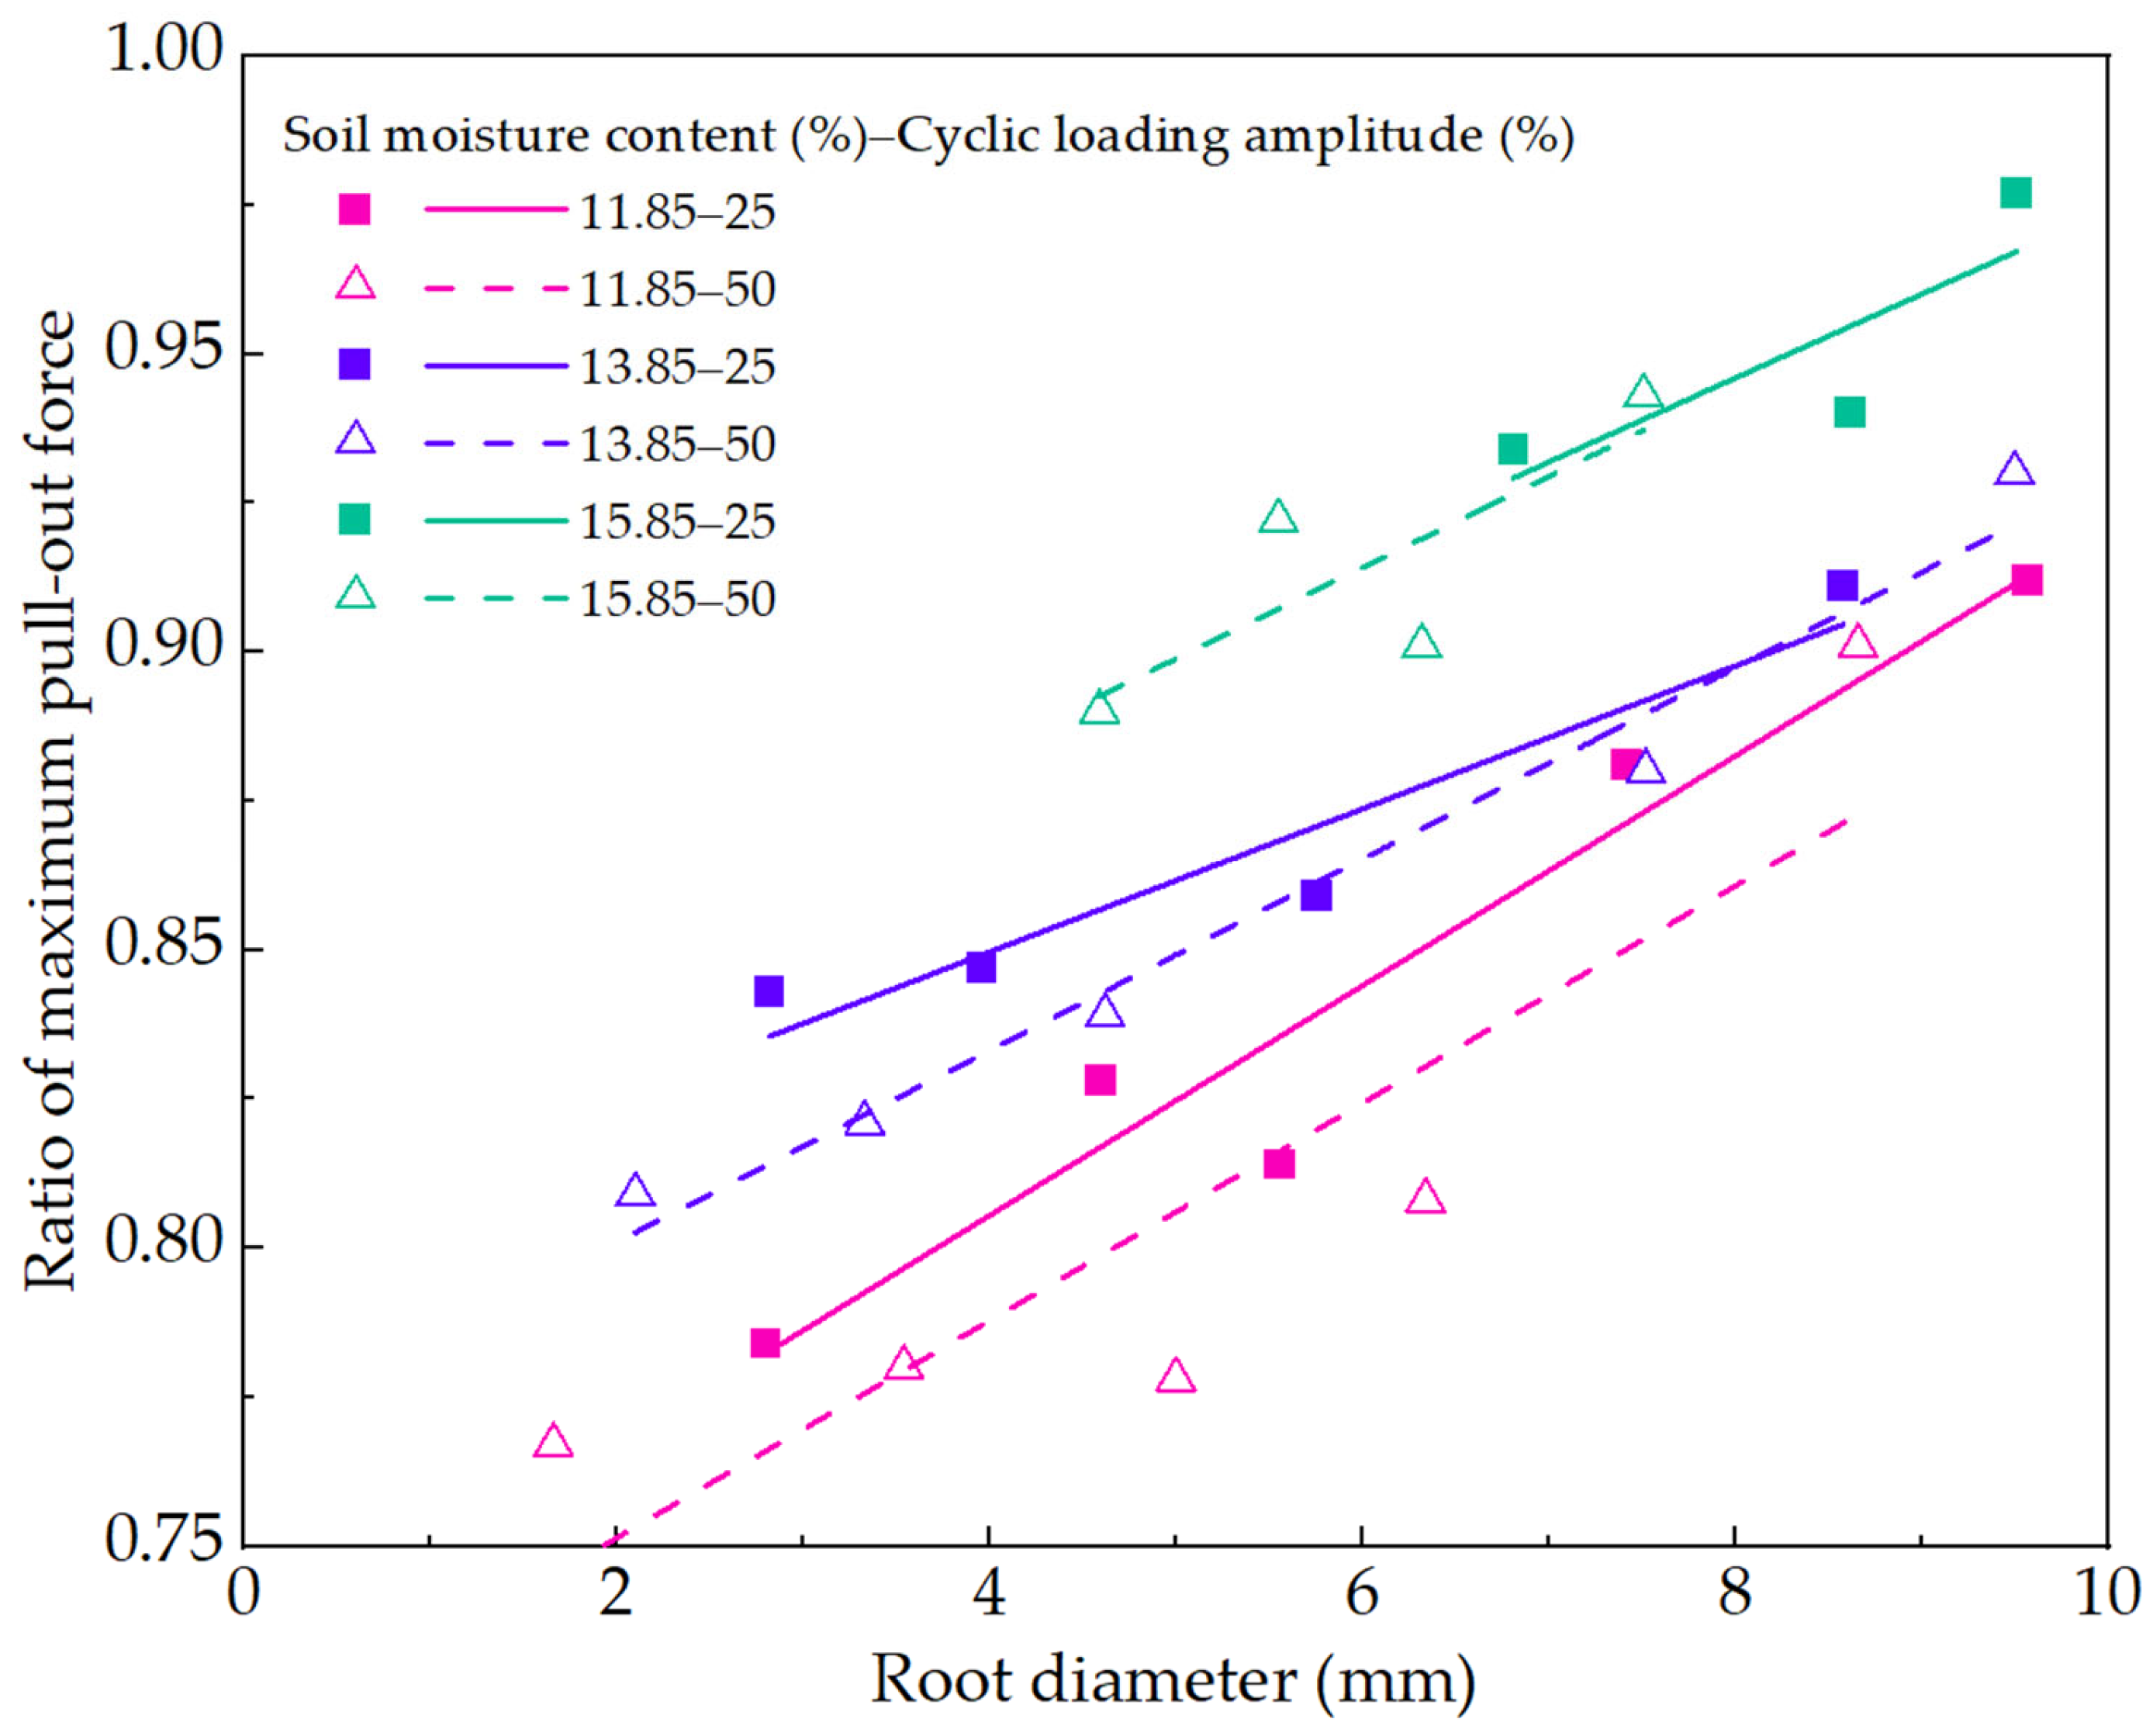
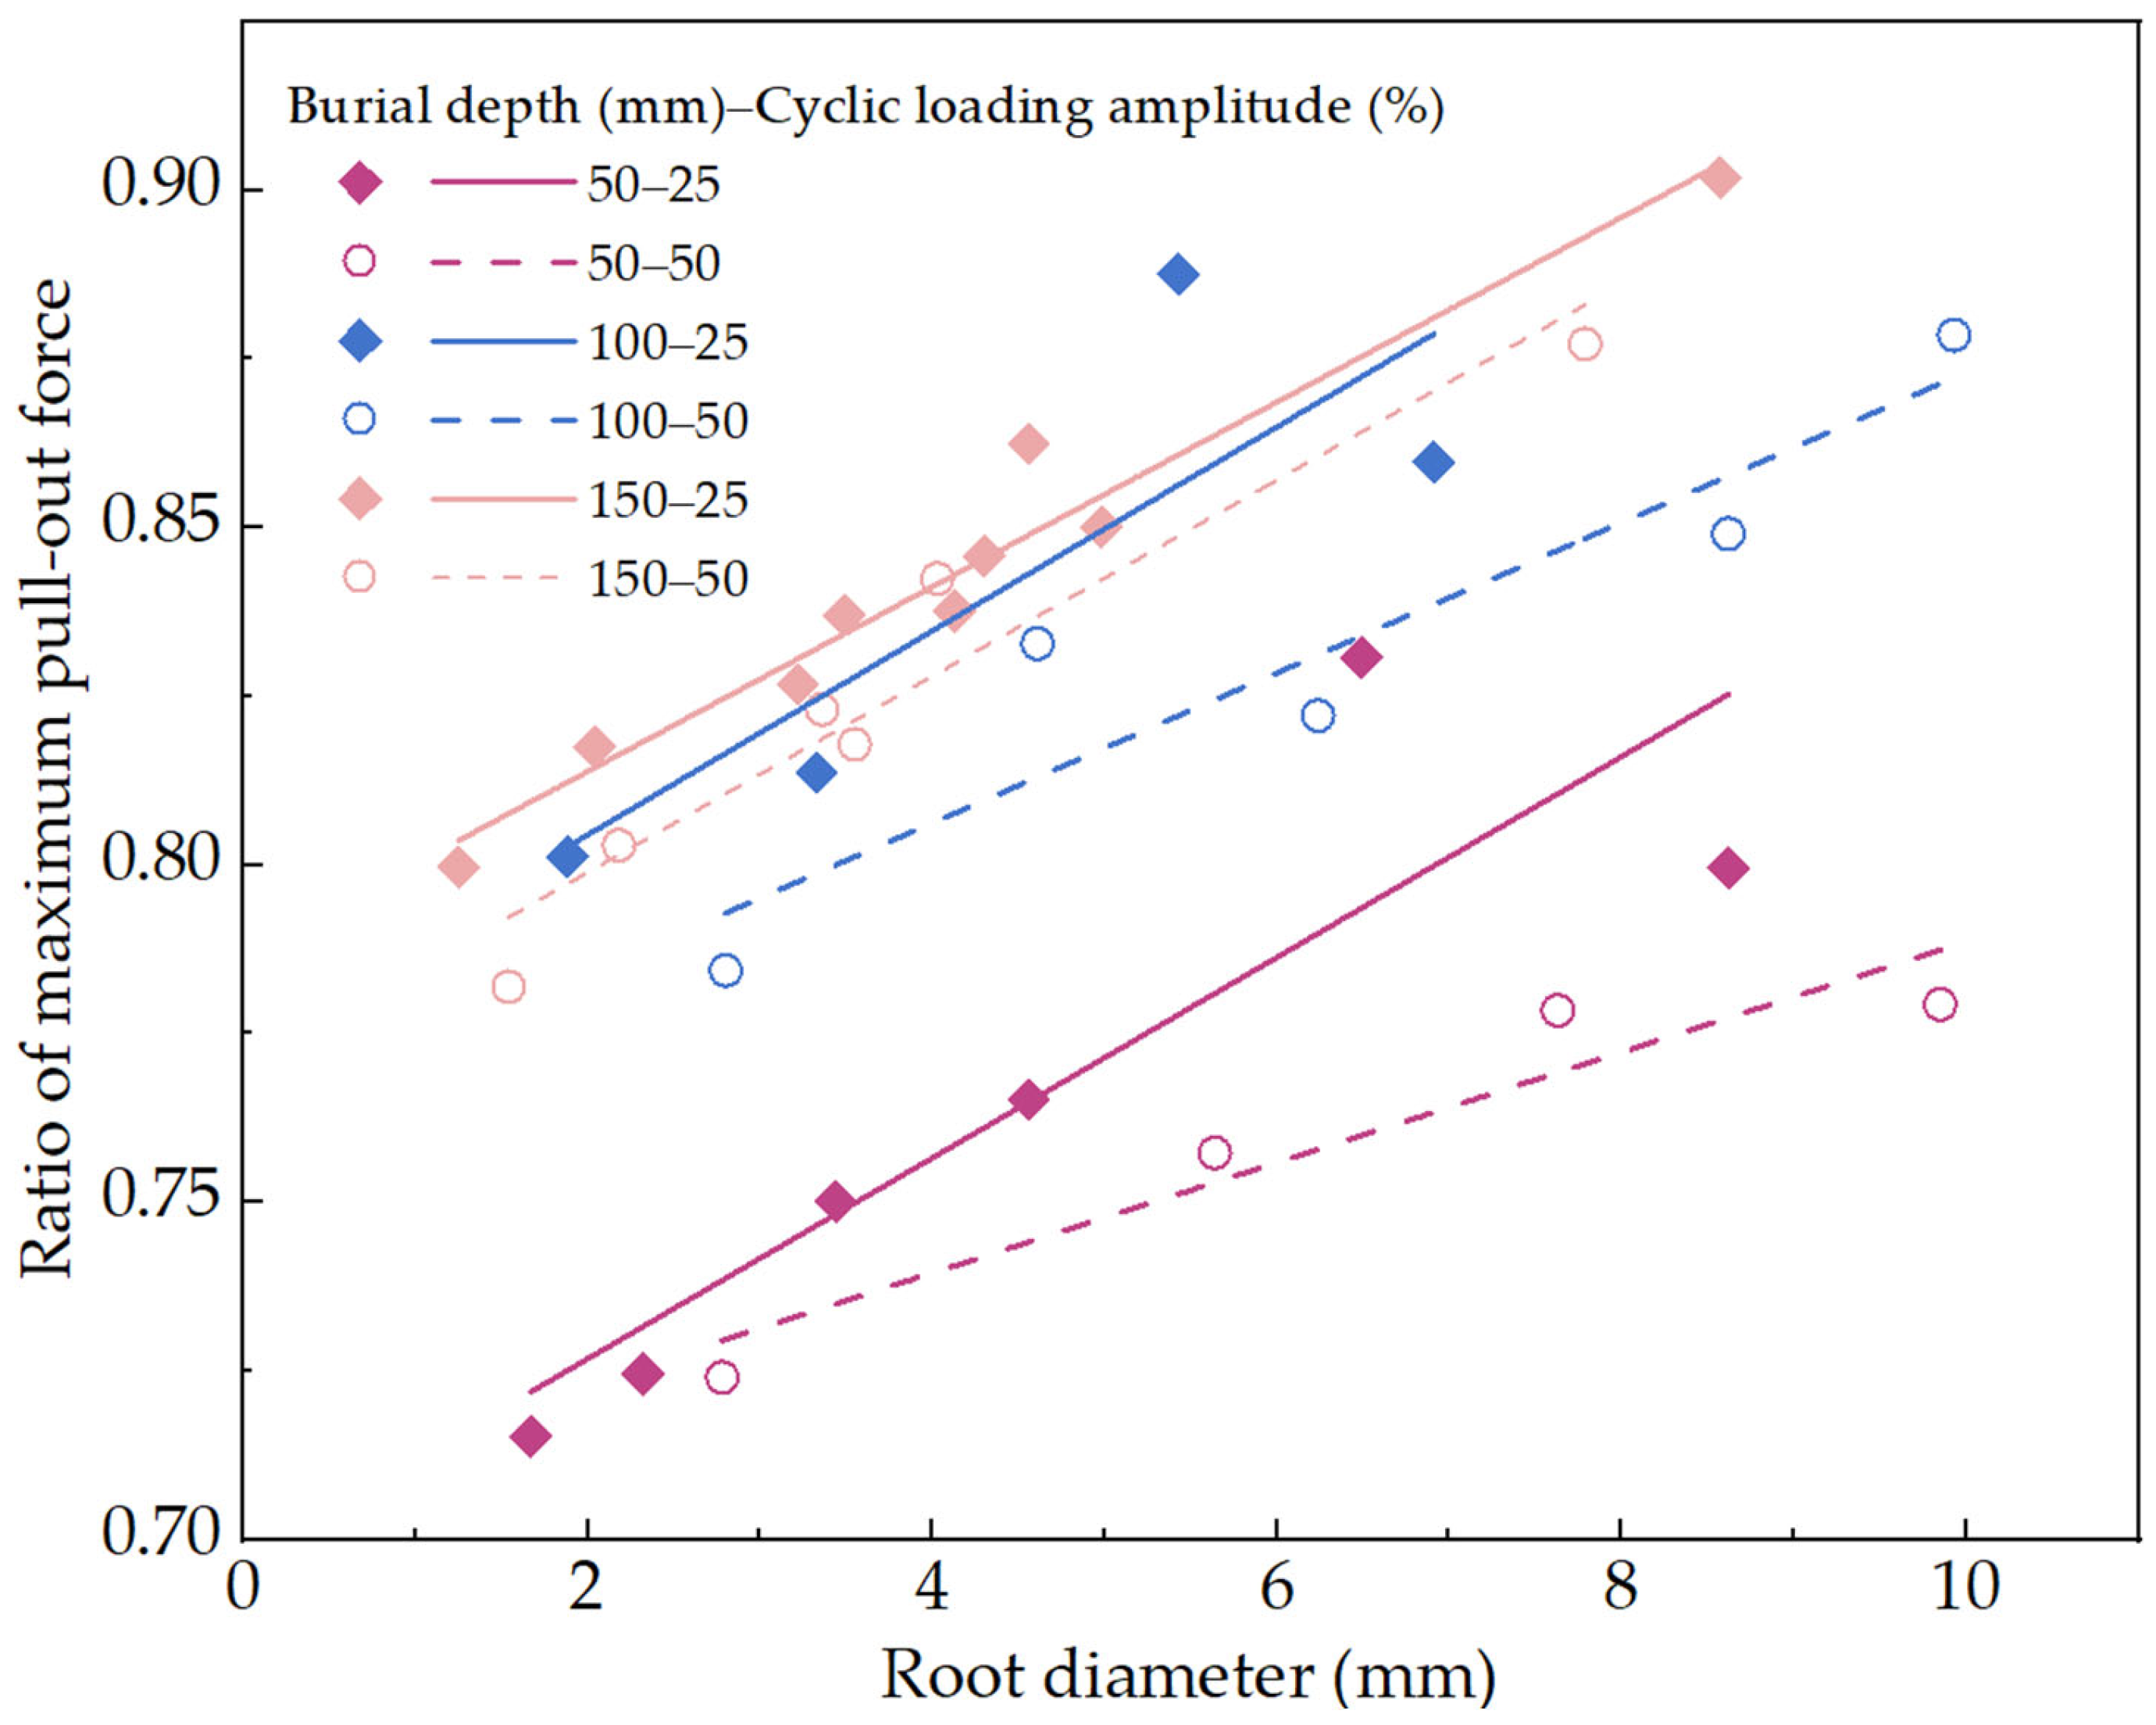
3.5. Effects of Diameter, Moisture Content, and Burial Depth on the Friction Anchoring Performance of the Root–Soil Interface under Cyclic Loading

As can be seen in the previous chapters, cyclic loading causes a decrease in the friction anchoring performance of the root–soil interface. In order to conveniently explore the friction anchoring ability of the interface, the maximum pull-out force in the balanced state is used as the value quantifying the friction anchoring ability of the interface, and the ratio of the maximum pull-out force after cyclic loading to the maximum pull-out force before cyclic loading is used as the quantifying impact factor value. This allows us to compare the influence of various factors under different conditions on the friction anchoring performance of the interface before and after cyclic loading. To control the variables so that the number of cycles reaches 100 and is fully pulled out, we only consider the cyclic load amplitude of 25% and 50% for analysis.
The moisture content of the soil can change the cohesive force between soil particles, determining the adhesive characteristics of the root–soil interface and affecting the anchoring performance of the root system during the pull-out process. The ratio of the maximum pull-out force of the root after and before cyclic loading under different soil moisture contents will vary with the root diameter and moisture content. With a root burial depth of 150 mm and cyclic load amplitudes of 25% and 50%, we set the soil’s moisture content to 11.85%, 13.85%, and 15.85% (groups L–Q in Table 3). Figure 12 shows the relationship between the ratio of the maximum pull-out force after cyclic pulling to the maximum pull-out force before direct pulling and the soil’s moisture content.
As shown in Figure 12, under certain conditions, as the soil’s moisture content increases, the ratio of the pull-out force before and after the cycle continues to increase. This indicates that within a certain range, the higher the soil’s moisture content, the less the cyclic load affects the anchoring ability of the root in the soil. As the diameter continues to increase, the ratio also increases, suggesting that the larger the root diameter, the stronger its ability to resist the effects of cyclic loading.
Under the same soil moisture conditions, as the cyclic load amplitude increases, the ratio continues to decrease. This suggests that the larger the cyclic load amplitude, the greater the impact on the anchoring ability of the root in the soil. Furthermore, this impact decreases as the root diameter increases (difference in ratios tends to decrease), indirectly verifying that the larger the root diameter, the stronger its anchoring ability. The fitting function is shown in Table 4.
The burial depth of roots in the soil determines the frictional contact area between roots and soil. Under the effect of monotonic load, the maximum pull-out force increases with the depth of roots in the soil. Similarly, under different burial depths and different cyclic load amplitudes, the friction anchoring performance of the root–soil interface also varies. Under the condition that the soil’s moisture content is 13.85% and the cyclic load amplitude is 25% and 50%, we set the burial depth of roots in the soil to be 50 mm, 100 mm, and 150 mm (Groups A~F in Table 3). Figure 13 shows the relationship between the ratio of the maximum pull-out force of the root after cyclic pulling to the maximum pull-out force before direct pulling and the diameter of the root.
As shown in Figure 13, as the diameter of the root system increases, the ratio of the pull-out force before and after the cycle continues to increase. This shows that the impact amplitude of the cyclic load is continuously reduced. Additionally, when the diameter is large, the difference between each group of line segments decreases as the length of the burial depth increases. This might be because when the diameter value is in a lower range, the disturbance of the cyclic load has a greater effect among the factors affecting the friction performance of the root–soil interface. However, as the diameter continues to increase, with the increase in the tensile strength of the root system itself and the increase in the surface area of the contact surface, the destructive effect of the cyclic load on the interface adhesion is somewhat mitigated.
Similarly, as the burial depth continues to increase, the ratio of the pull-out force before and after the cycle under each diameter becomes closer to 1, which also indicates that the impact of the cyclic load is continuously reduced. When the cyclic load amplitude changes from 25% to 50%, it can be seen that as the cyclic load amplitude increases, the ratio decreases, indicating that the greater the cyclic load amplitude, the weaker the anchoring ability of the root system in the soil. The fitting function is shown in Table 5.

4. Discussion

In our experiment, we analyzed the different failure modes of the B. platyphylla’s root–soil interface under cyclic loading, interpreting the causes of the changes in hysteretic curves from an energy perspective. This is similar to the scholars’ hysteretic curve changes in reinforced concrete pull-out tests, both of which showed different hysteretic curve characteristics [37]. We noted a correlation between cumulative residual slip and the number of load cycles, suggesting a degree of plasticity at the root–soil interface. This plasticity could be a key factor in how trees such as B. platyphylla withstand repeated environmental stresses in the natural world. In addition, our analysis of the trend in cumulative residual slip revealed reasons for the progressive degradation of the root–soil interface under prolonged cyclic loading. Analogously, in the problem of bond deterioration at the reinforced concrete interface, in comparison with the results of previous scholars on fatigue loading of reinforced concrete [36,38], this result can be viewed as a reduction in the fatigue life of the system, thus leading to bond breakage at the interface, and the experimental results are in line with expectations. This information could offer a deeper understanding of the long-term impacts of cyclic loads. Furthermore, we compared the anchorage performance between roots and soil before and after cyclic loading and found that the effects of soil moisture content, root diameter, and burial depth on the anchorage performance under the two loading modes were consistent with the conclusions of previous studies [25,26,27,28], which were that the anchorage performance was stronger with the increase in diameter and burial depth, and weaker with the increase in moisture content. The difference is that we introduced the factor of loading amplitude and compared the strength of different factors in resisting the effects of cyclic loading under cyclic loading; it allowed us to analyze the influence of root diameter, root burial depth, and soil moisture content on the anchoring ability of roots under cyclic loading. These results, under the multidisciplinary cross-study, provide new ideas for the study of root–soil interface anchorage performance. Meanwhile, data support is provided in numerical simulation, which provides a theoretical basis for the study of slope stability and root–soil structure interaction aspects.
One potential limitation of this study is the equipment used, which was developed in-house and lacked sophisticated automated loading and unloading functions. This confines the number of cyclic loading to a lower magnitude, which may introduce some discreteness when considering certain factors. Given the complexity of quantifying root–soil interface interactions, this paper selected diameter, burial depth, and soil moisture content as reference factors. Future research can be improved in several ways by considering the use of more environmental factors and material properties as variables, such as introducing altitude, material cellulose, and so on. It is also possible to improve the experimental conditions by using servo fatigue testers to increase the sample size to increase the persuasive power or to simulate more realistic experimental environments, such as wind tunnel tests or in situ tests. The combination of experimental results and numerical simulation can also be used for research and analysis.

5. Conclusions

In this paper, the friction characteristics of the root–soil interface of Betula platyphylla under cyclic loading were investigated and analyzed by means of indoor pulling tests, taking into account the effects of diameter, burial depth, and soil moisture content. The main conclusions of this study are as follows:
(1)
During the cyclic loading process, the root system exhibits two failure modes, and the root pull-out force–slip curves exhibit different phase characteristics under different failure modes. The cyclic loading process is accompanied by the accumulation of bonding damage between the root system and soil interface, resulting in a maximum interface friction force after cyclic loading that is smaller than the maximum interface friction force during direct pull-out.
(2)
The hysteretic curve demonstrates varying evolutionary patterns under different cyclic loading magnitudes. As the amplitude of the cyclic load increases, more energy is dissipated, the residual slip becomes greater, and the damage to the root–soil interface intensifies.
(3)
The root reaches a relative ‘equilibrium state’ under a certain extent of cyclic load, wherein the cyclic load has less impact on anchoring capacity. However, this state is rapidly disrupted under high amplitudes.
(4)
Cyclic loading reduces the adhesion performance at the root–soil interface, resulting in a peak slip after cyclic loading that is less than the peak slip during direct pull-out. Under higher cyclic loads, a stronger nonlinear effect occurs due to high fatigue stress levels, resulting in a significant increase in residual slip.
(5)
Increases in soil moisture content, root burial depth, and diameter reduce the effect of cyclic loading on the anchoring capacity of the root system in the soil. With the increase in the amplitude of cyclic load, the anchoring ability of roots in soil is more significantly affected.

Author Contributions

Conceptualization, S.Y. and X.J.; methodology, S.Y., D.Z. and S.L.; analysis, S.Y. and D.Z.; writing—original draft preparation, S.Y.; writing—review and editing, X.J. and S.L.; supervision, X.J.; funding acquisition, X.J. All authors have read and agreed to the published version of the manuscript.

Funding

The investigation was supported by the National Natural Science Foundation of China (Grant No.31570708). It was also funded by the Major Science and Technology Program for Water Pollution Control and Treatment of China (No. 2017ZX07101002–002). The authors are deeply indebted to the financial supporters.

Institutional Review Board Statement

Not applicable.

Informed Consent Statement

Not applicable.

Data Availability Statement

Not applicable.

Conflicts of Interest

The authors declare no conflict of interest.

References

  1. Wang, M.; Liu, Q.; Pang, X. Evaluating ecological effects of roadside slope restoration techniques: A global meta-analysis. J. Environ. Manag. 2020, 281, 111867. [Google Scholar] [CrossRef] [PubMed]
  2. Bojie, F.; Yanxu, L.; Meadows, M.E. Ecological restoration for sustainable development in China. Natl. Sci. Rev. 2023, 10, nwad033. [Google Scholar]
  3. Capilleri, P.P.; Motta, E.; Raciti, E. Experimental Study on Native Plant Root Tensile Strength for Slope Stabilization. Procedia Eng. 2016, 158, 116–121. [Google Scholar] [CrossRef]
  4. Liang, T.; Bengough, A.G.; Knappett, J.A.; MuirWood, D.; Loades, K.W.; Hallett, P.; Boldrin, D.; Leung, A.K.; Meijer, G.J. Scaling of the reinforcement of soil slopes by living plants in a geotechnical centrifuge. Ecol. Eng. 2017, 109, 207–227. [Google Scholar] [CrossRef]
  5. Tang, C.; Zahid, H.; Yong, L.; Chen, Y.; Mingmin, L.; Zhigang, H. Fine root densities of grasses and perennial sugarcane sig-nificantly reduce stream channel erosion in southern China. J. Environ. Manag. 2022, 316, 115279. [Google Scholar]
  6. Centenaro, G.; Hudek, C.; Zanella, A.; Crivellaro, A. Root-soil physical and biotic interactions with a focus on tree root systems: A review. Appl. Soil Ecol. 2018, 123, 318–327. [Google Scholar] [CrossRef]
  7. Reubens, B.; Poesen, J.; Danjon, F.; Geudens, G.; Muys, B. The role of fine and coarse roots in shallow slope stability and soil erosion control with a focus on root system architecture: A review. Trees 2007, 21, 385–402. [Google Scholar] [CrossRef]
  8. Schwarz, M.; Rist, A.; Cohen, D.; Giadrossich, F.; Egorov, P.; Büttner, D.; Stolz, M.; Thormann, J.J. Root reinforcement of soils under compression. J. Geophys. Res. Earth Surf. 2015, 120, 2103–2120. [Google Scholar] [CrossRef]
  9. Yang, Q.; Zhang, C.; Liu, P.; Jiang, J. The Role of Root Morphology and Pulling Direction in Pullout Resistance of Alfalfa Roots. Front. Plant Sci. 2021, 12, 580825. [Google Scholar] [CrossRef] [PubMed]
  10. Mickovski, S.B.; Bengough, A.G.; Bransby, M.F.; Davies, M.C.R.; Sonnenberg, R. Material stiffness, branching pattern and soil matric potential affect the pullout resistance of model root systems. Eur. J. Soil Sci. 2007, 58, 1471–1481. [Google Scholar] [CrossRef]
  11. Fourcaud, T.; Ji, J.-N.; Zhang, Z.-Q.; Stokes, A. Understanding the impact of root morphology on overturning mechanisms: A modelling approach. Ann. Bot. 2008, 101, 1267–1280. [Google Scholar] [CrossRef] [PubMed]
  12. Ji, X.; Cong, X.; Dai, X.; Zhang, A.; Chen, L. Studying the mechanical properties of the soil-root interface using the pullout test method. J. Mt. Sci. 2018, 15, 882–893. [Google Scholar] [CrossRef]
  13. Waldron, L.J. The Shear Resistance of Root-Permeated Homogeneous and Stratified Soil. Soil Sci. Soc. Am. J. 1977, 41, 843–849. [Google Scholar] [CrossRef]
  14. Wu, T.H.; McKinnell, W.P., III; Swanston, D.N. Strength of tree roots and landslides on Prince of Wales Island, Alaska. Can. Ge-Otechnical J. 1979, 16, 19–33. [Google Scholar] [CrossRef]
  15. Pollen, N. Temporal and spatial variability in root reinforcement of streambanks: Accounting for soil shear strength and moisture. Catena 2007, 69, 197–205. [Google Scholar] [CrossRef]
  16. Thomas, R.E.; Pollen-Bankhead, N. Modeling root-reinforcement with a fiber-bundle model and Monte Carlo simulation. Ecol. Eng. 2010, 36, 47–61. [Google Scholar] [CrossRef]
  17. Schwarz, M.; Cohen, D.; Or, D. Root-soil mechanical interactions during pullout and failure of root bundles. J. Geophys. Res. Atmos. 2010, 115, F04035. [Google Scholar] [CrossRef]
  18. Schwarz, M.; Preti, F.; Giadrossich, F.; Lehmann, P.; Or, D. Quantifying the role of vegetation in slope stability: A case study in Tuscany (Italy). Ecol. Eng. 2010, 36, 285–291. [Google Scholar] [CrossRef]
  19. Schwarz, M.; Cohen, D.; Or, D. Pullout tests of root analogs and natural root bundles in soil: Experiments and modeling. J. Geophys. Res. Atmos. 2011, 116, F02007. [Google Scholar] [CrossRef]
  20. Schwarz, M.; Cohen, D.; Or, D. Spatial characterization of root reinforcement at stand scale: Theory and case study. Geomorphology 2012, 171–172, 190–200. [Google Scholar] [CrossRef]
  21. Ji, X.; Chen, L.; Zhang, A. Anchorage properties at the interface between soil and roots with branches. J. For. Res. 2016, 28, 83–93. [Google Scholar] [CrossRef]
  22. Ruan, S.; Tang, L.; Huang, T. The Pullout Mechanical Properties of Shrub Root Systems in a Typical Karst Area, Southwest China. Sustainability 2022, 14, 3297. [Google Scholar] [CrossRef]
  23. Cucchi, V.; Meredieu, C.; Stokes, A.; Berthier, S.; Bert, D.; Najar, M.; Denis, A.; Lastennet, R. Root anchorage of inner and edge trees in stands of Maritime pine (Pinus pinaster Ait.) growing in different podzolic soil conditions. Trees 2004, 18, 460–466. [Google Scholar] [CrossRef]
  24. Boldrin, D.; Leung, A.K.; Bengough, A.G. Root biomechanical properties during establishment of woody perennials. Ecol. Eng. 2017, 109, 196–206. [Google Scholar] [CrossRef]
  25. Giadrossich, F.; Schwarz, M.; Cohen, D.; Preti, F.; Or, D. Mechanical interactions between neighbouring roots during pullout tests. Plant Soil 2013, 367, 391–406. [Google Scholar] [CrossRef]
  26. Nicoll, B.C.; Gardiner, B.A.; Rayner, B.; Peace, A.J. Anchorage of coniferous trees in relation to species, soil type, and rooting depth. Can. J. For. Res. 2006, 36, 1871–1883. [Google Scholar] [CrossRef]
  27. Dupuy, L.; Fourcaud, T.; Stokes, A. A Numerical Investigation into the Influence of Soil Type and Root Architecture on Tree Anchorage. Plant Soil 2005, 278, 119–134. [Google Scholar] [CrossRef]
  28. Fan, C.; Lu, J.; Chen, H. The pullout resistance of plant roots in the field at different soil water conditions and root geometries. Catena 2021, 207, 105593. [Google Scholar] [CrossRef]
  29. Zhang, C.; Liu, Y.; Li, D.; Jiang, J. Influence of soil moisture content on pullout properties of Hippophae rhamnoides Linn. roots. J. Mt. Sci. 2020, 17, 2816–2826. [Google Scholar] [CrossRef]
  30. Ennos, A.R. The Anchorage of Leek Seedlings: The Effect of Root Length and Soil Strength. Ann. Bot. 1990, 65, 409–416. [Google Scholar] [CrossRef]
  31. Mickovski, S.B.; Bransby, M.F.; Bengough, A.G.; Davies, M.C.; Hallett, P.D. Resistance of simple plant root systems to uplift loads. Can. Geotech. J. 2010, 47, 78–95. [Google Scholar] [CrossRef]
  32. Su, L.; Hu, B.; Xie, Q.; Yu, F.; Zhang, C. Experimental and theoretical study of mechanical properties of root-soil interface for slope protection. J. Mt. Sci. 2020, 17, 2784–2795. [Google Scholar] [CrossRef]
  33. Ghani, M.A.; Stokes, A.; Fourcaud, T. The effect of root architecture and root loss through trenching on the anchorage of tropical urban trees (Eugenia grandis Wight). Trees 2008, 23, 197–209. [Google Scholar] [CrossRef]
  34. Hairiah, K.; Widianto, W.; Suprayogo, D.; Van Noordwijk, M. Tree Roots Anchoring and Binding Soil: Reducing Landslide Risk in Indonesian Agroforestry. Land 2020, 9, 256. [Google Scholar] [CrossRef]
  35. Edwards, A.D.; Yannopoulos, P.J. Local bond-stress–slip relationships under repeated loading. Mag. Concr. Res. 1979, 31, 109. [Google Scholar] [CrossRef]
  36. Yi, W.J.; Kunnath, S.K.; Sun, X.D.; Shi, C.J.; Tang, F.J. Fatigue Behavior of Reinforced Concrete Beams with Corroded Steel Reinforcement. ACI Struct. J. 2010, 107, 526–533. [Google Scholar]
  37. Lin, H.; Zhao, Y.; Ožbolt, J.; Hans-Wolf, R. The bond behavior between concrete and corroded steel bar under repeated loading. Eng. Struct. 2017, 140, 390–405. [Google Scholar] [CrossRef]
  38. Huang, Y.; Yi, W.; Hu, C. Corroded reinforced concrete beams under low-speed and low-cycle fatigue loads. Constr. Build. Mater. 2018, 186, 644–651. [Google Scholar] [CrossRef]
Figure 1. Location map of the study area.
Sustainability 15 12791 g001
Figure 2. Root morphology of four B. platyphylla trees. (a) Point no. 1 at an altitude of 1889 m. (b) Point no. 2 at an altitude of 1898 m. (c) Point no. 3 at an altitude of 1926 m. (d) Point no. 4 at an altitude of 1938 m.
Sustainability 15 12791 g002aSustainability 15 12791 g002b
Figure 3. Test machine and specimen system.
Sustainability 15 12791 g003
Figure 4. Pull-out force–slip curve of failure mode 1 and comparison of curves under different loading modes.
Sustainability 15 12791 g004
Figure 5. Pull-out force–slip curve of failure mode 2 and comparison of curves under different loading modes.
Sustainability 15 12791 g005
Figure 6. Pull-out force–slip cycle segment curve.
Sustainability 15 12791 g006
Figure 7. Characteristic cycle loading and unloading section.
Sustainability 15 12791 g007
Figure 8. Evolution of pull-out force–slip hysteretic curve under 50% cyclic loading amplitude. (a) Loading and unloading section of the 1st–3rd cycle. (b) Loading and unloading section of the 49th–51st cycle. (c) Loading and unloading section of the 98th–100th cycle.
Sustainability 15 12791 g008
Figure 9. Evolution of pull-out force–slip hysteretic curve under 75% cyclic loading amplitude. (a) Loading and unloading section of the 1st–3rd cycle. (b) Loading and unloading section of the 32nd–34th cycle. (c) Loading and unloading section of the 64th–66th cycle.
Sustainability 15 12791 g009
Figure 10. Trend of cumulative residual slip. (a) At 25% cyclic loading amplitude. (b) At 50% cyclic loading amplitude. (c) At 75% cyclic loading amplitude.
Sustainability 15 12791 g010
Figure 11. Comparison of characteristic slip under different cyclic loading amplitudes. (a) At 25% cyclic loading amplitude. (b) At 50% cyclic loading amplitude. (c) At 75% cyclic loading amplitude.
Sustainability 15 12791 g011aSustainability 15 12791 g011b
Figure 12. Influence of soil moisture content and cyclic loading amplitude on the ratio of maximum root pull-out force before and after cyclic loading.
Sustainability 15 12791 g012
Figure 13. Influence of burial depth and cyclic loading amplitude on the ratio of maximum root pull-out force before and after cyclic loading.
Sustainability 15 12791 g013
Table 1. Soil properties of different B. platyphylla trees.
Snws (%)ρs (g/cm3)ρsd (g/cm3)was (%)ρas (g/cm3)
114.131.791.5713.861.58
212.921.821.61
313.851.731.58
414.671.771.54
Sn—soil group number; ws—soil moisture content of the sample; ρs—soil density of the sample; ρsd—soil dry density of the sample; was—average soil moisture content of the sample; ρas—average soil dry density of the sample.
Table 2. Experimental design and root physical parameters under monotonic loading.
TnR (mm)Ws (%)Dm (mm)Fm (N)Sm (mm)N
15013.851.67–9.8582.878 ± 53.4064.976 ± 3.48610
210013.851.88–9.93154.987 ± 76.1058.303 ± 3.36410
315013.851.13–8.57132.858 ± 94.09713.475 ± 6.72527
415013.851.54–9.45190.578 ± 140.5713.605 ± 9.95730
515013.851.26–9.89183.404 ± 126.14910.353 ± 3.91920
615011.851.66–9.57202.599 ± 127.95411.726 ± 5.16410
715013.851.42–9.50233.108 ± 168.3199.875 ± 5.75210
815015.851.54–9.51214.874 ± 130.98810.078 ± 4.47310
Tn—root group number; R—length of root buried in soil; Ws—soil moisture content; Dm—the mean root diameter; Fm—root pull-out peak bearing capacity; Sm—root pull-out peak slip; N—number of test roots.
Table 3. Experimental design and two failure modes under cyclic loading.
GnR (mm)Ws (%)CLA (%)NsNDM
Fm1Fm2
A5013.8525660
B50440
C10013.8525440
D50550
E15013.8525990
F50660
G75606
H15013.8525990
I50990
J75909
K15013.85751028
L15011.8525550
M50550
N13.8525440
O50550
P15.8525330
Q50440
Gn—root group number; R—length of root buried in soil; Ws—soil moisture content; CLAcyclic loading amplitude; Ns—number of test roots; NDM—number of test roots under different failure modes; Fm1—failure mode 1; Fm2—failure mode 2.
Table 4. Regression equation of maximum pull-out force ratio and diameter before and after cyclic loading and unloading under different soil moisture contents.
S–CRegression EquationR2P
11.85–25y = 0.728 + 0.019D0.9370.05
11.85–50y = 0.715 + 0.018D0.7830.05
13.85–25y = 0.802 + 0.012D0.9190.05
13.85–50y = 0.769 + 0.016D0.9770.05
15.85–25y = 0.833 + 0.014D0.6910.05
15.85–50y = 0.822 + 0.015D0.6470.05
S–C—soil moisture content–cyclic loading amplitude; for example, ‘11.85–25’ represents a group with a soil moisture content of 11.85% and a cyclic loading amplitude of 25%.
Table 5. Regression equation of maximum pull-out force ratio and diameter before and after cyclic loading and unloading under different burying depths.
B–CRegression EquationR2P
50–25y = 0.697 + 0.015D0.7830.05
50–50y = 0.707 + 0.008D0.9010.05
100–25y = 0.774 + 0.015D0.7000.05
100–50y = 0.762 + 0.011D0.8630.05
150–25y = 0.787 + 0.014D0.9580.05
150–50y = 0.770 + 0.015D0.9320.05
B–C—burial depth–cyclic loading amplitude; for example, ‘50–25’ represents a group with a burial depth of 50 cm and a cyclic loading amplitude of 25%.
Disclaimer/Publisher’s Note: The statements, opinions and data contained in all publications are solely those of the individual author(s) and contributor(s) and not of MDPI and/or the editor(s). MDPI and/or the editor(s) disclaim responsibility for any injury to people or property resulting from any ideas, methods, instructions or products referred to in the content.

