Article

An Outlier Detection Study of Ozone in Kolkata India by the Classical Statistics, Statistical Process Control and Functional Data Analysis

Faculty of Science, Beijing University of Technology, Beijing 100124, China
*
Author to whom correspondence should be addressed.
Sustainability 2023, 15(17), 12790; https://doi.org/10.3390/su151712790
Submission received: 28 May 2023 / Revised: 6 August 2023 / Accepted: 15 August 2023 / Published: 24 August 2023

Abstract

:
Air pollution is prevalent throughout the entire world due to the release of various gases such as NOx, PM, SO2, tropospheric ozone (O3), etc. Ground-stage ozone is the predominant issue in smog and is the product of the interplay between sunlight and emissions. The destructive impact on the health of the populace might also still occur in cities with noticeably clean air and where ozone levels hardly ever exceed safe limits. Therefore, the findings of small variations in air quality and the technique of regulating air contamination are thought-provoking. The study employs various techniques to effectively observe and assess strategies for detecting and eliminating outliers in ozone emissions from pollution episodes. This technique helps to describe the sources and exceedance values and enhance the value of monitoring the data. In this study, the data have some missing observations. The method of imputation, the classical statistical technique, the statistical process control (SPC) technique, functional data analysis (FDA), and functional process control help to fill in the data and detect outliers, trend deviations, and changes in ozone concentration at ground level. A comparison study is carried out using these three techniques: classical analysis, SPC, and FDA, and the results show how the statistical process control and functional data methods performed better than the classical technique for the detection of outliers and also in what way this methodology can enable an additional, comprehensive method of defining air pollution control measures and water pollution control measures.

1. Introduction

Air pollution contributes to climate change by affecting humans, animals, and ecosystems and causing illnesses like pneumonia, lung cancer, and influenza. It also causes smog, aerosol formation, reduced eyesight, rising temperatures, acid rain, and early death. According to the 2011 India census, with an urban agglomeration comprising the city and its suburbs, Kolkata has a population of 4.5 million, making it the third most densely populated metropolitan area in the world. Researchers used a machine learning model to forecast air pollution and how it affects human health [1,2,3]. Majumdar et al. [4] projected emissions for 2030 in a business-as-usual case, revealing that existing measures and policies are insufficient to significantly reduce PM2.5 emissions in Kolkata Metropolitan City by 2030. Understanding the geographical distribution of PM2.5, relative humidity, temperature, and wind speed is crucial for assessing air quality in metropolitan areas. This helps to understand the atmospheric conditions contributing to their dispersion. Various studies, comparable to air pollution analyses, have carried out various types of spatial interpolations of atmospheric variables, such as PM2.5 and PM10, and their influence on humans [5,6,7]. Additionally, Refs. [8,9,10] investigated the effects of Kolkata’s air quality before and after the lockdown.
Imputation is the assignation by inference of a value to something from the value of goods or the value-filling process. In all forms of collected data, missing data is a common concern. Many ways of managing missing data exist. Full or accessible case analysis, the missing indicator method, and general mean imputation are the most basic and commonly used approaches [11]. Missing attribute values in incomplete datasets hinder data mining and machine learning efficiency. Deep learning techniques outperform previous methods for missing value imputation [12,13].
SPC is a process that aims to maintain quality features with minimal variability. Control of statistical processes is crucial for achieving reliability and improving capacity by reducing variability. It involves continuous monitoring of normal variation to identify deviations and adjust for disturbance removal. SPC is a technique for data collection, organization, analysis, and decision-making that determines the mean, lower control limit, and upper control limit (LCL and UCL, respectively). If the values fall, the process is not under control.
In order to apply them to vector problems, FDA has been developed. The FDA approach was inspired by the classical technique of data mining to cope with vectorial data treatment. The applications of FDA have also been used for environmental research [14,15,16,17,18,19,20], medical research [21], and the manufacturing sector [22]. This functional model provides two important features: First, the correlation of the data structure with time is taken into account, and second, comparisons are made with a view of the global problem. The application compares functional depth principal curves, a metric that reflects within a group of curves the centrality of a given curve. By generating a new functional sample, the model transforms the sample vectors to find functional outliers by adapting the principle of functional depth. In order to achieve an improved air quality management solution, the researcher compares the corresponding results with classical and functional approaches and obtains the most suitable methodology to evaluate the dataset. Torres et al. [23] identified a solution that uses functional data analysis to discover the outliers in urban gas emissions. Over time, the researchers considered gas emissions as curves, with outliers found by comparing curves rather than vectors. The method identified outliers in Oviedo’s gas omissions using the functional depth principle and compared it with traditional vector comparison methods. A tool for outlier detection in water quality parameters was provided by Di Blasi et al. [24] using the variables of conductivity, turbidity, and ammonium. The methods were based on the consideration of the various parameters as a vector whose concentration values were components. A groundbreaking approach to monitoring water quality over time views the dataset as a time-dependent function, identifying outliers in samples from the Miño river basin based on functional depth in NW Spain. This technique helps identify trends in water quality over time. The approach of practical pattern recognition for the identification of fluvial valleys and topographic profiles of glaciers [25] uses a functional method for the classification of vector machines in order to determine process stability. Martinez et al. [26] addressed statistical process monitoring and control charts used for outlier detection methods. The one-class peeling (OCP) method provides statistical and machine learning techniques in multivariate data to identify multiple outliers. The one-class peeling approach is suitable for statistical process control in high-dimensional data sets with high outliers. However, the one-class peeling approach is more effective and stable in high dimensions. In the additional materials, examples of R commands and data sets determine the respective OCP distances and threshold availability. Garca-Nieto [27] studied the foraging efficacies of aerosol elements for removal devices, including congealing, heterogeneous nucleation, and gravitational subsidence, and examined the health effects of the aerosols on respirable dirt fractions. The scavenging equations were applied to three atmospheric situations: pure, cloudy, and city. The primary elimination mechanism for respirable aerosol was gravitational settling, which is nearly six times better than rainout. Imputation of missing data replaces missing data with values derived from variable distribution estimation. Just one approximation is used in one single imputation. Various projections are used in several imputations, representing the ambiguity in the distribution calculation. Both single and multiple imputations produce unbiased study correlation estimates under missing-at-random and absolutely-at-random circumstances. However, single imputation leads to small approximate standard errors, whereas multiple imputations can result in incorrect results [28]. In this research, the imputation technique was used to address missing data, ensuring a more complete dataset for analysis. Additionally, the traditional statistical technique, SQC, provided a well-established method for identifying outliers in the air pollution monitoring data. The functional approach, on the other hand, offered a novel perspective by considering the underlying functions and patterns in the data. By comparing and contrasting these three approaches, this research aimed to determine the most effective method for detecting outliers and providing valuable insights for enhancing local air quality measures.

2. Methods

2.1. Air Quality Monitoring Station, Kolkata, India

In urban areas, air pollution is very important for environmental health, especially in developing countries. Air pollution is a major concern in Indian cities, and it affects human health. In order to ensure pleasant breathing air in the future, Kolkata is one of the Indian cities that desperately needs intervention policies. More areas are being affected by air pollution from smog, industrial activity, etc. Moreover, ground-stage ozone is the predominant issue in smog and is the product of the interplay between sunlight and emissions. Kolkata has a number of air quality monitoring stations throughout the country that are part of the national program for monitoring ambient air quality. The air quality of Kolkata in relation to ozone ( μ g / m 3 ) is considered to be depreciating because measurement data indicate that it may in the future exceed the limit values and the national emissions ceiling.

2.2. Analysis Methodology

The systems can provide valuable insights into the quality of air, water, and soil in a given area. By analyzing these data, researchers and policymakers can make informed decisions to improve environmental conditions and protect public health. The expected value of the sample position and taking into account classical analysis, patterns, and differences between neighboring stations may be used to identify particular data values that are not usual. The pattern analysis in R-programming is an illustration of the expert structure of the data and the validation of an environmental parameter [29]. Analyzing data sets using mathematical models and statistical methods yields conclusions about a population without subjective interpretation or qualitative insights. In order to extract conclusions, the suggested approach requires using a large amount of data that already exists, with some incomplete findings. Today, automated analysis techniques are needed for the number of data stored in databases. The research methodology discussed here is oriented towards the discovery of information in databases (knowledge discovery database) (KDD) [30]. The KDD is a comprehensive data extraction procedure for preparing and analyzing results. It offers a clear and collaborative method for identifying design and model parameters for outlier identification, prediction, and classification. This research paper uses steps like imputation, classical analysis, SPC, and FDA.

2.3. Imputation

Imputation is a simple technique for missing observations, replacing each observation with a true value. Various imputation procedures fill in missing values using respondent data. For example, when the missing value is an average replacement for pollution characteristics like NO2, O3, and CO2, it is considered reasonable [31]. The method that is used for imputation is mean substitution. The mean value of the data replaces the missing data.

2.4. Classical Analysis

This approach allows researchers to make inferences about the larger data based on the characteristics observed in the sample. By analyzing the data collected, classical statistics (mean, quartiles (first quartile: Q1, second quartile: Q2, third quartile: Q3), time series, box plot, etc.) provides insights into the behavior and patterns of the variables under study. Additionally, it helps determine the level of confidence or uncertainty associated with the findings, enhancing the overall reliability of the statistical analysis.
Traditional statistical analysis seeks to evaluate the empirical frequency distribution that yields the absolute frequency of occurrence of each of the several possible results of the frequent size of a discrete event [19]. If there is just a finite number of various outcomes (a discrete example) and if the distribution function is utilized in the situation of an indefinitely frequent and randomly trustworthy calculation and each result is different, the outcome of relative frequency will not be very enlightening. This returns all values of the absolute frequency of occurrence that are less than x in this example [32].

2.5. Statistical Process Control

By applying SPC to monitor the system, it is possible to identify the outliers. However, in conditions where the points do not reach the defined limit, the analysis focuses on substantially low and high measurements. To study individual observation, the techniques can be used to study individual or average maps. It should split the dataset into logical subgroups [33]. In such cases, it may not be feasible to form rational subgroups due to the lack of variability. However, it is crucial to identify and address these sources of error in order to ensure accurate measurements and reliable data.
Data collection using the rational subgroup method shows intrinsic variation, a common cause of variation, which can be ignored. The method establishes special cause variation to avoid imperfect subgroups while determining the control chart’s border limit based on variability within each subgroup. If the mechanism is violated, only subgroups that duplicate the process’s common cause of variance should be collected [19].
When the data have some missing observations, the data have been imputed, and if normality has been established, then the data are correctly structured. If the researcher rejects the null hypothesis, then there are two methods to normalize the data: using modified techniques for non-normal distributions or transforming the data to normalize the set, and using Box–Cox transformation [34,35]. The Box–Cox transformation is as follows:
X j ω =          X j ω ω ,      i f   ω 0 log ( X j ) ,      i f   ω = 0
where ω denotes the maximizes profile likelihood function of the data.
Classical process analysis can be divided into two stages: the control stage, where patterns are evaluated and conditions outside of control are encountered, and the first stage, which removes normality and atypical measurement from the results. The average, UCL, and LCL are specified at the first level. The average is defined precisely by the control model and signifies the objective point. Then, the confidence interval is set to be the standard deviation of the process [36].
Shewart’s control chart is a popular monitoring system for graphical statistical processes, detecting major changes in processes. It is designed as a conventional control chart when the underlying form of the distribution of processes is known. Charts using recent samples show no significant improvement in the process. Complementary rules are needed to identify deviations and add to the initial rules, as established by different authors [37,38]. Supplementary rules enhance the alertness and detection capacity for non-random samples of Shewart’s control chart, improving non-random sample detection [27].
The average run length (ARL) is the most used and simple mode to measure the capacity of a control chart with supplementary run rules. In the control charts, the run rule is used before the warning alarm’s indication when the process is not controlled. The important thing to do if this happens is to identify it as soon as possible. On the other hand, it would be reasonable to have a few false alarms when the mechanism is statistically in a state of control. This term is defined specifically as an alpha error (type I) and a β error (type II). The technique of sensitivity is also defined and is highly linked to the number of outliers. It must be considered that the potential to identify out-of-control techniques is high; for this reason, there are a lot of points that fall outside [39].

2.6. Functional Data Analysis

FDA is a method for studying curves and functions to analyze data over time [40]. It converts vector samples into functional samples, using discrete values as starting points. Smoothing transforms vector points into continuous functions over time, making it valuable in air pollution research. This data composition allows for outlier detection, as days with varying ozone values may have identical averages. Functional analysis identifies possible outliers, making functional techniques superior for such investigations.
Let x( t j ) represent the initial observations, t j ∈ R signifies the time steps, and p represents the number of observations ( j = 1,2 , , p ). The individual value of the function x ( t ) x F , where F is a functional space, can be observed. The functional space F = s p a n ( ϕ 1 , ϕ 2 , ϕ p ) is used to estimate x(t), where ϕ k is the set of basis functions ( k = 1,2 , , n b ) and p is the number of basis functions necessary to generate a functional sample. In statistics, there are various types of bases, but the Fourier basis is the most commonly employed. Furthermore, for periodic data like the ones in our study, the Fourier basis is the best option [19].
min x ϵ F j = 1 p z j x t j 2 + λ Γ x
z j = x t j + ϵ j , where x is the observing point at t j , ϵ j is the random noise with zero mean, λ is the level of regulization, and Γ is the penalized operator.
x t = k = 1 p c k ϕ k ( t )
where { c k } k = 1 p is the coefficient that multiplies the basis function. This can be written the problem of smoothing as
min c { z ϕ c T z ϕ c + λ c T R c }
z = ( z 1 , , z p ) T , the expansion of vector coefficient c = (c1, … …, cp)T, a ( p , n b ) -matrix ϕ whose elements are ϕ j k = ϕ k t j , and a ( p , n b ) -matrix R whose elements are:
R k l = D 2 ϕ k , D 2 ϕ l L 2 ( T ) = T D 2 ϕ k , D 2 ϕ l d t
The problem can be solved with the following equation:
c = ( ϕ ϕ + λ R ) 1 ϕ z
Functional data help identify higher-than-mean time intervals and their differences, allowing for the removal of outliers caused by system failure and detecting system failure. The notion of depth allows you to sort a collection of data in Euclidian space by how close it is to the sample core. In multivariate analysis, the concept of depth emerged and was generated to calculate a point centrality among a cloud. This idea started to be incorporated into practical data analysis over the course of the year. In this region, the centrality of a certain curve x i is defined by depth, and the center of the sample is the mean curve. The two-depth measurement of Fraiman–Muniz depth (FMD) and the H-model depth (HMD) [19] are most usual in the sense of functional data.
Through the estimation of depths, it is also possible to classify outliers with a practical approach. In this case, it takes into account elements that have different behavioral designs than the rest. Instead of summarizing the curve observations into a single point, such as the average, the definition of depth makes it possible to deal with observations identified at a given interval in curve types. The depth technique is used for the identification of outliers and significance: There is a low depth of an element that is distant from the sample. Thus, practical outliers are the curves with the least depth.
Firstly, F n , t ( x i t ) is the cumulative empirical distribution function of the values of the curves x i ( t ) ,   ( i = 1,2 , , n ) in a certain time t   ϵ   a , b in which it is contemplated. It can be defined as:
F n , t x i t = 1 n k = 1 n I ( x k t x i ( t ) )  
where I(.) is an indicator function. Next, the FMD for curve xi is calculated as:
F M D n x i t = a b D n x i t d t
where t ϵ [ a , b ] . The functional mode in HMD, on the other hand, is the element or curve that is most densely surrounded by the other curves in the dataset. HMD is written as:
H M D n x i , h = k = 1 n K ( x i x k h )
In a functional space, with a kernel function K : R + R + , a bandwidth parameter h and · as the norm. In a vast majority of cases, norm L2, is expressed as:
x i ( t ) x j ( t ) = ( ( x i t x j ( t ) ) 2 d t ) 1 / 2
There is also a number of parameters for the kernel functions K( · ). The truncated Gaussian kernel is a popular one and can be expressed as:
K t = 2 2 π exp ( t 2 2 ) ,      t > 0
In this paper, the HMD depth was chosen for the identification of outliers. The value of h is the value that leaves, below it, 15% of the data coming from the distribution of { x i t x j t , i , j = 1,2 , , n } , and the cut-off C is selected, especially the 1% type I error, according to P r H M D n x i t < c = 0.01 ,   i = 1,2 , , n .
Because the functional depth distribution is unknown, the cut-off C must be computed. There is a variety of ways in which this estimation can be carried out. The bootstrapping approach, on the other hand, was best suited to the study’s objectives [19]. The steps are below:
  • Extract the substitution of the original with a new sample.
  • Via the statistics of this new sample, estimate the research parameter.
  • Repeat the steps overhead a significant number of times. The Monte-Carlo simulation is often referred to as this repetition. It uses duplication to extract evidence from the data.
  • Determine the empirical statistical distribution.

3. Results and Discussion

In this paper, the results of the technique that applied are as follows. The whole analysis and figure generation were carried out with R software (R 4.0.2) [41]. The complete 2018 hourly data were collected from the Central Pollution Control Board of India [42]. The data that were collected for analysis have some missing values, so the data were imputed by simple imputation (mean imputation).

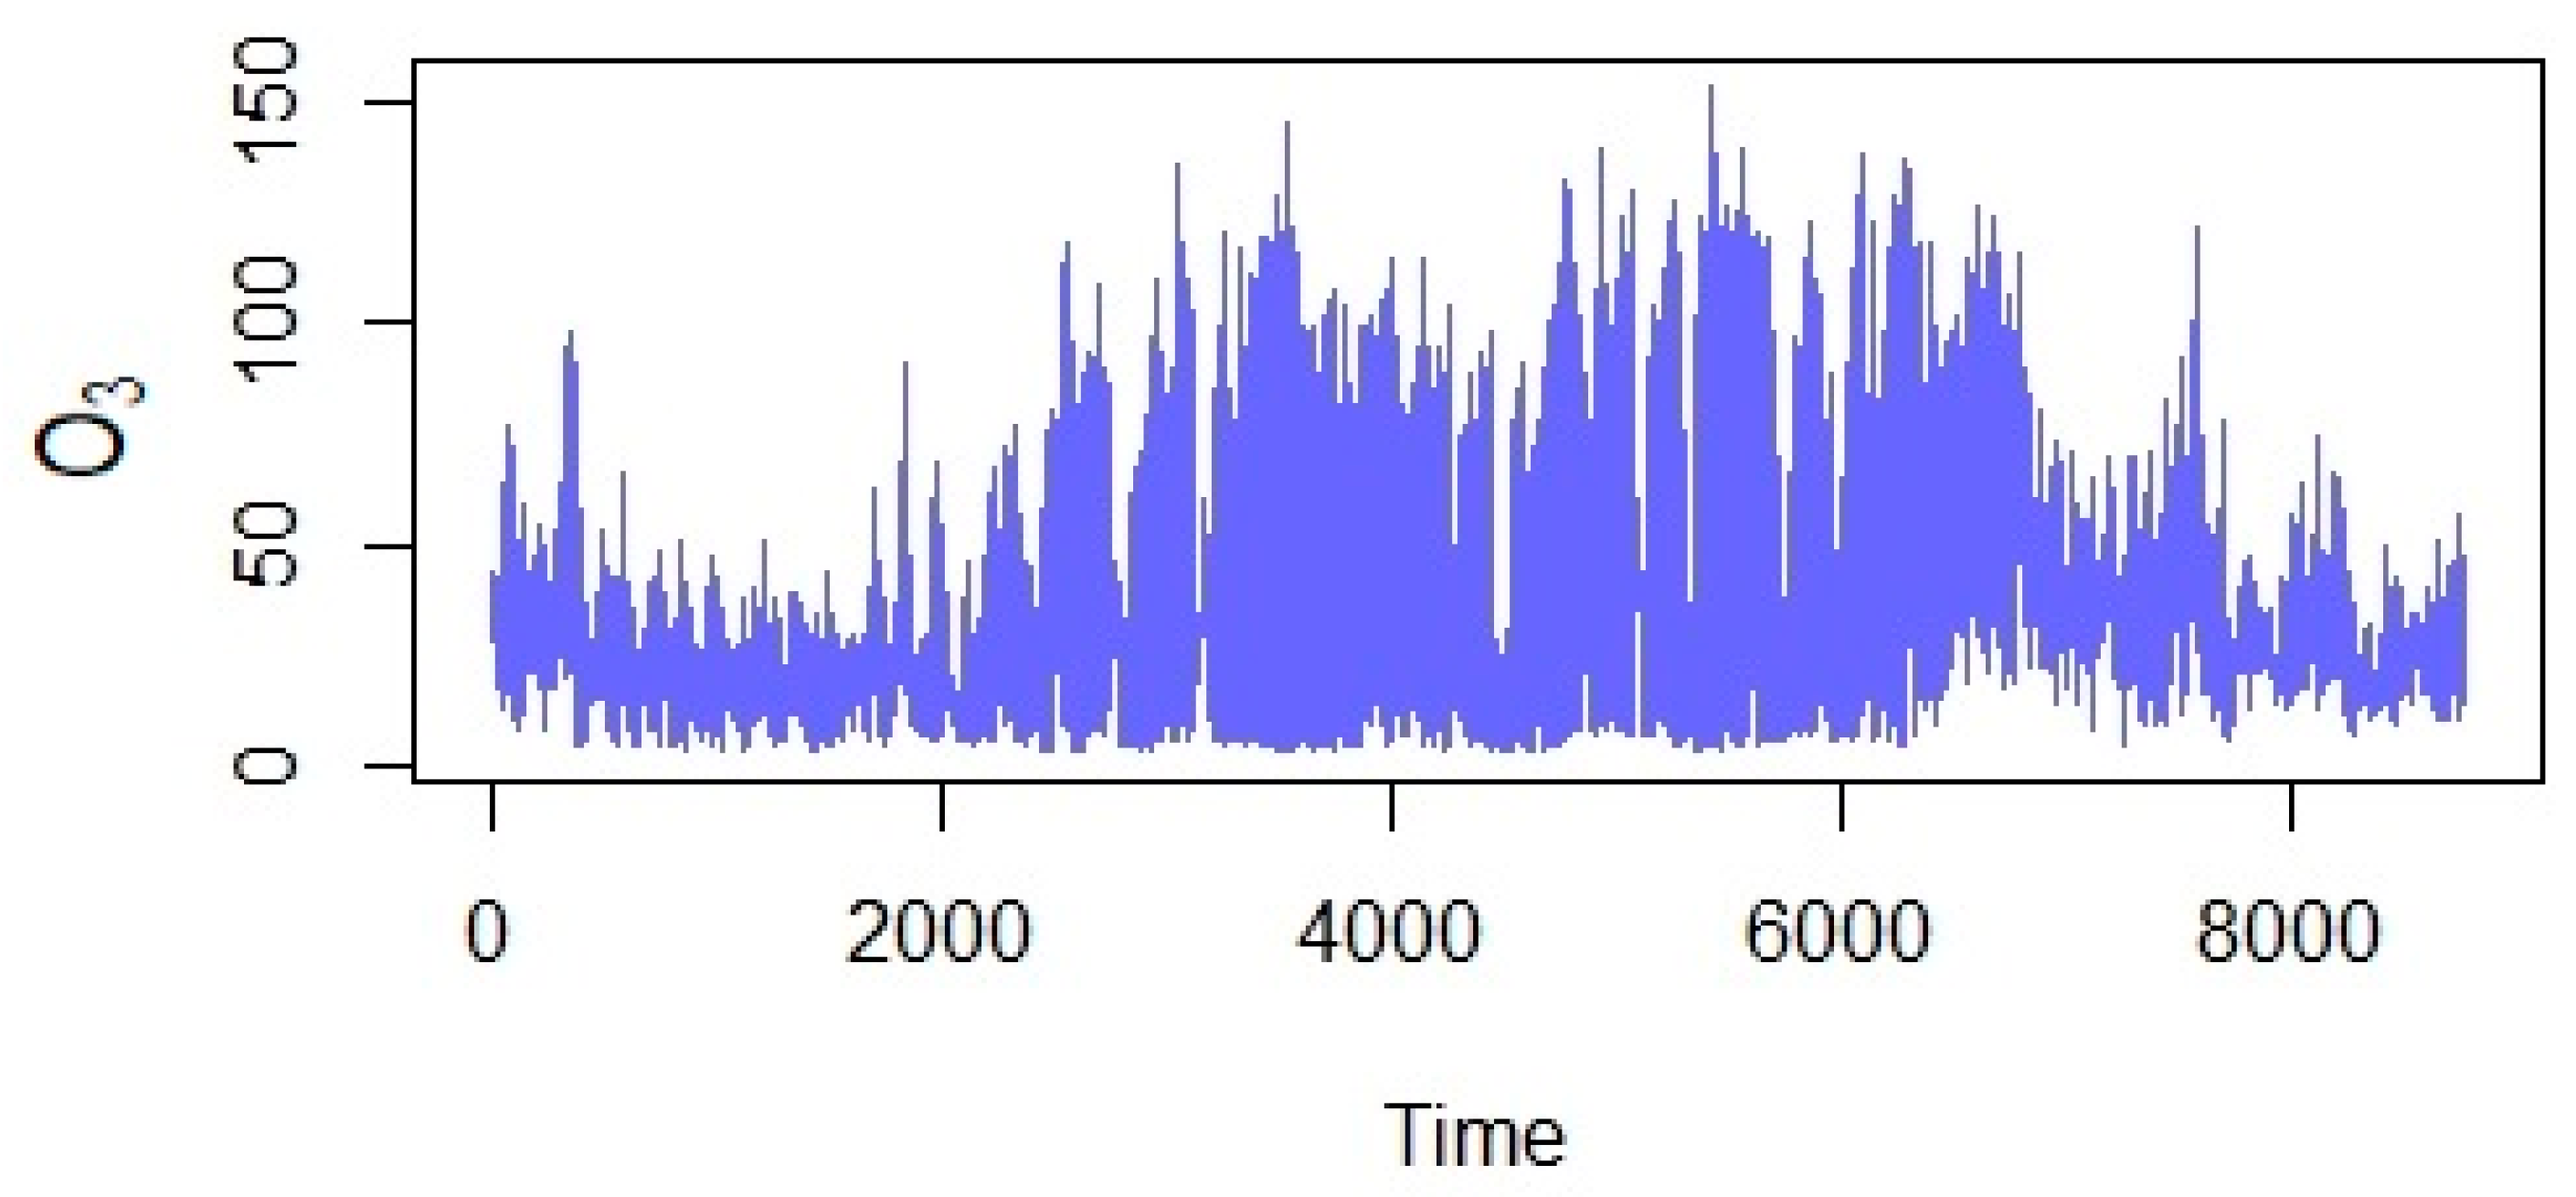
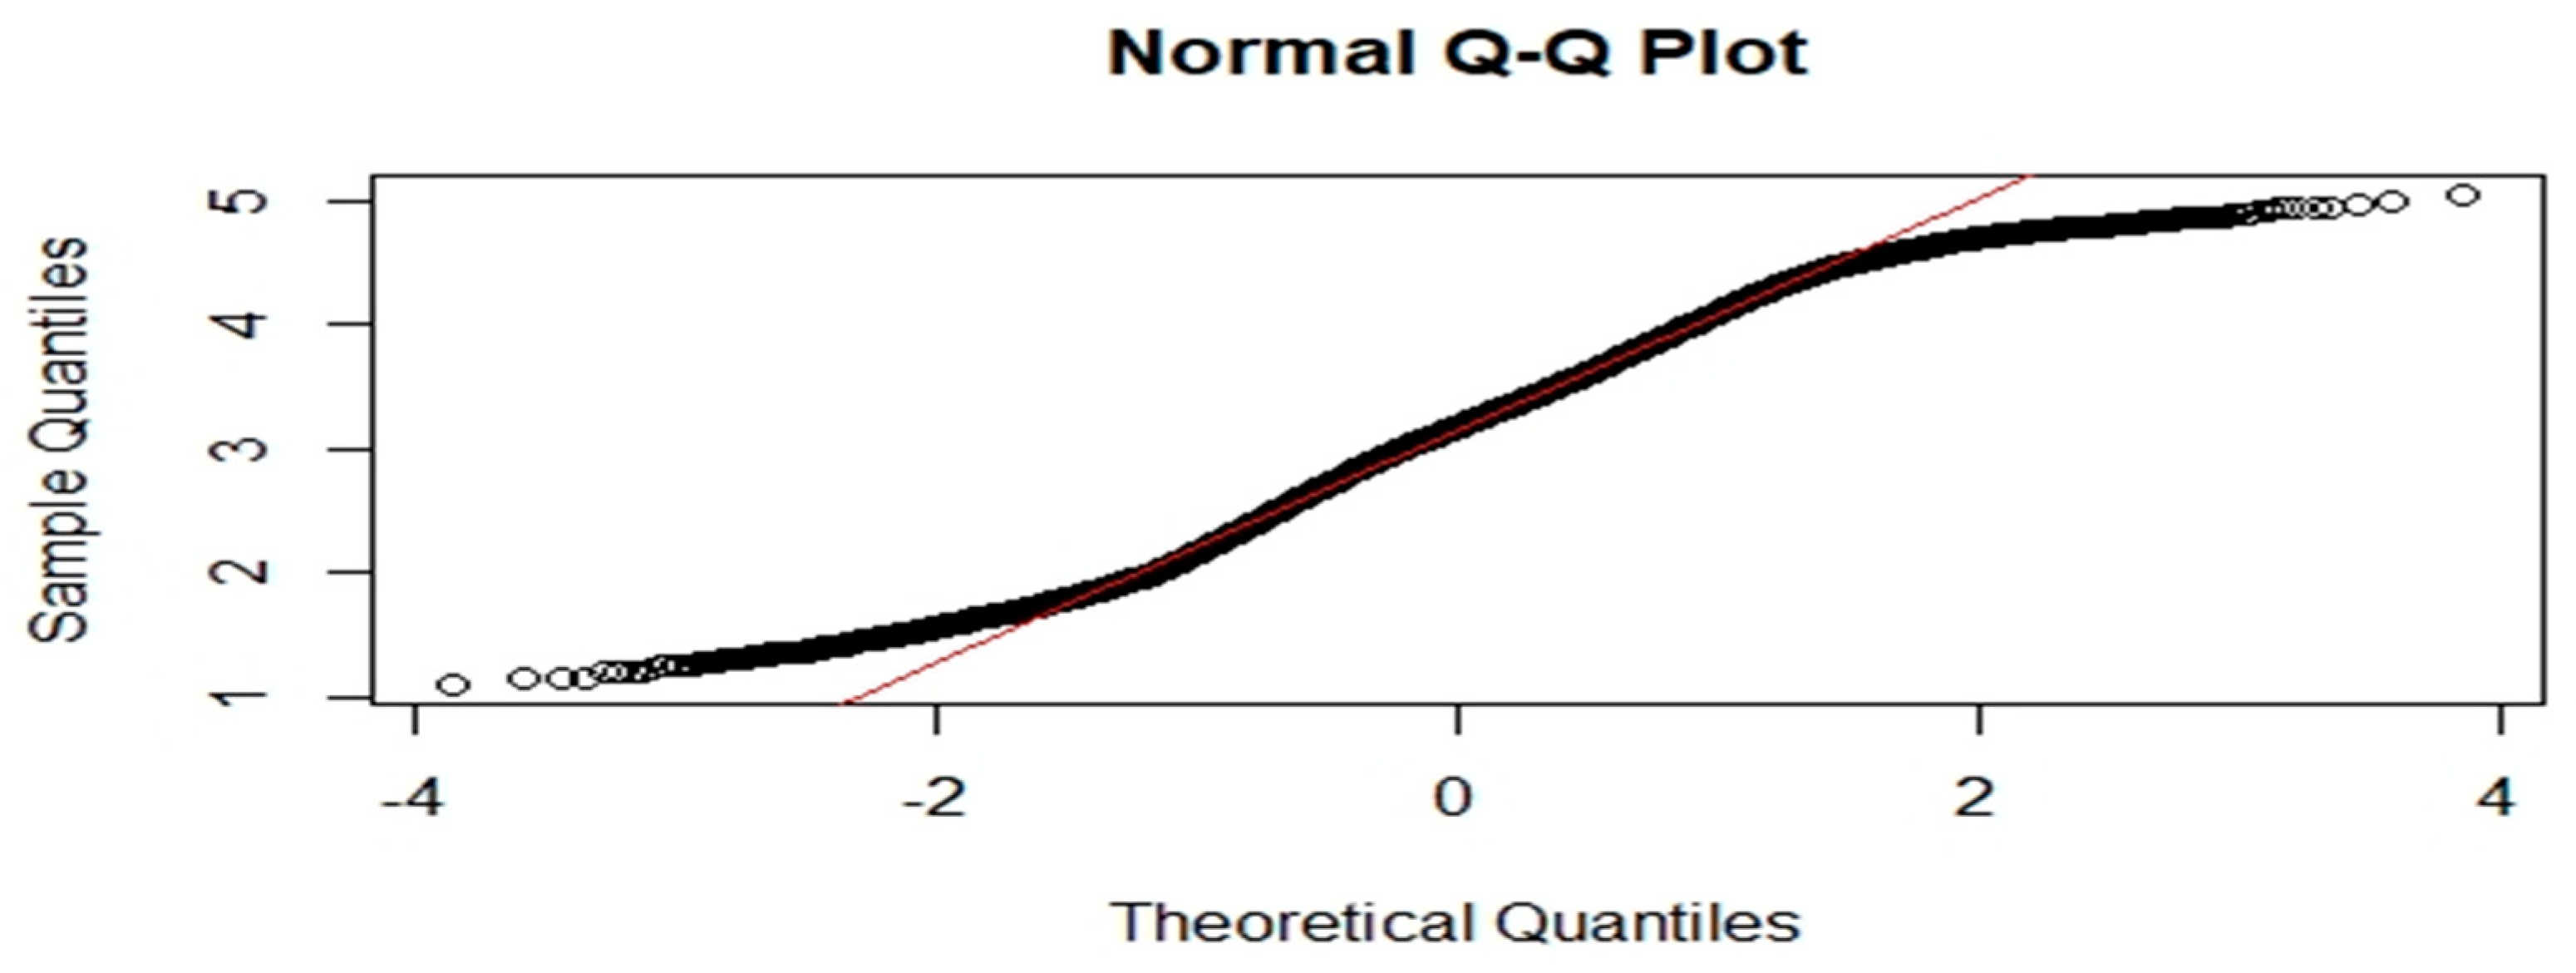
3.1. Classical Statistical Analysis

The classical monitoring strategy was used to evaluate the air quality within limits. The statistical parameters of the data were also used to evaluate the trends. The statistical techniques used to perform the classical air quality monitoring strategy are presented in the data on O3 concentrations at the Victoria air quality monitoring station in Kolkata, India. A summary of the statistical analysis of hourly data is presented in Table 1 for the minimum, maximum, mean, Q1, Q2, Q3, and interquartile range.
The descriptive analysis parameter in Table 1 demonstrates that the limit values were not exceeded. Additional steps are to analyze the hourly data from 2018 of individual time series plots (Figure 1) ranging from a minimum value of 3.03   ( μ g / m 3 ) to a maximum value of 153.32   ( μ g / m 3 ) .
Figure 2 depicts a box plot that graphically characterizes the O3 concentration data groupings by quartiles. The values of the first quartile Q1 (12.46 μ g / m 3 ), second quartile Q2 (23.91 μ g / m 3 ), third quartile Q3 (43.48 μ g / m 3 ), and interqurtile range IQR (31.38 μ g / m 3 ) and some red dots that represent the outliers are shown in the picture.
Figure 3 shows the QQ plot (normal probability plot) of the data. The null hypothesis is that the value follows a normal distribution and the alternate hypothesis is that the value does not follows a normal distribution.
Other tests were applied to see whether the data resembled any of the following distributions: normal, generalized extreme value, or Weibull and Rayleigh; however, there was no suitable null hypothesis at the 5% significance level.

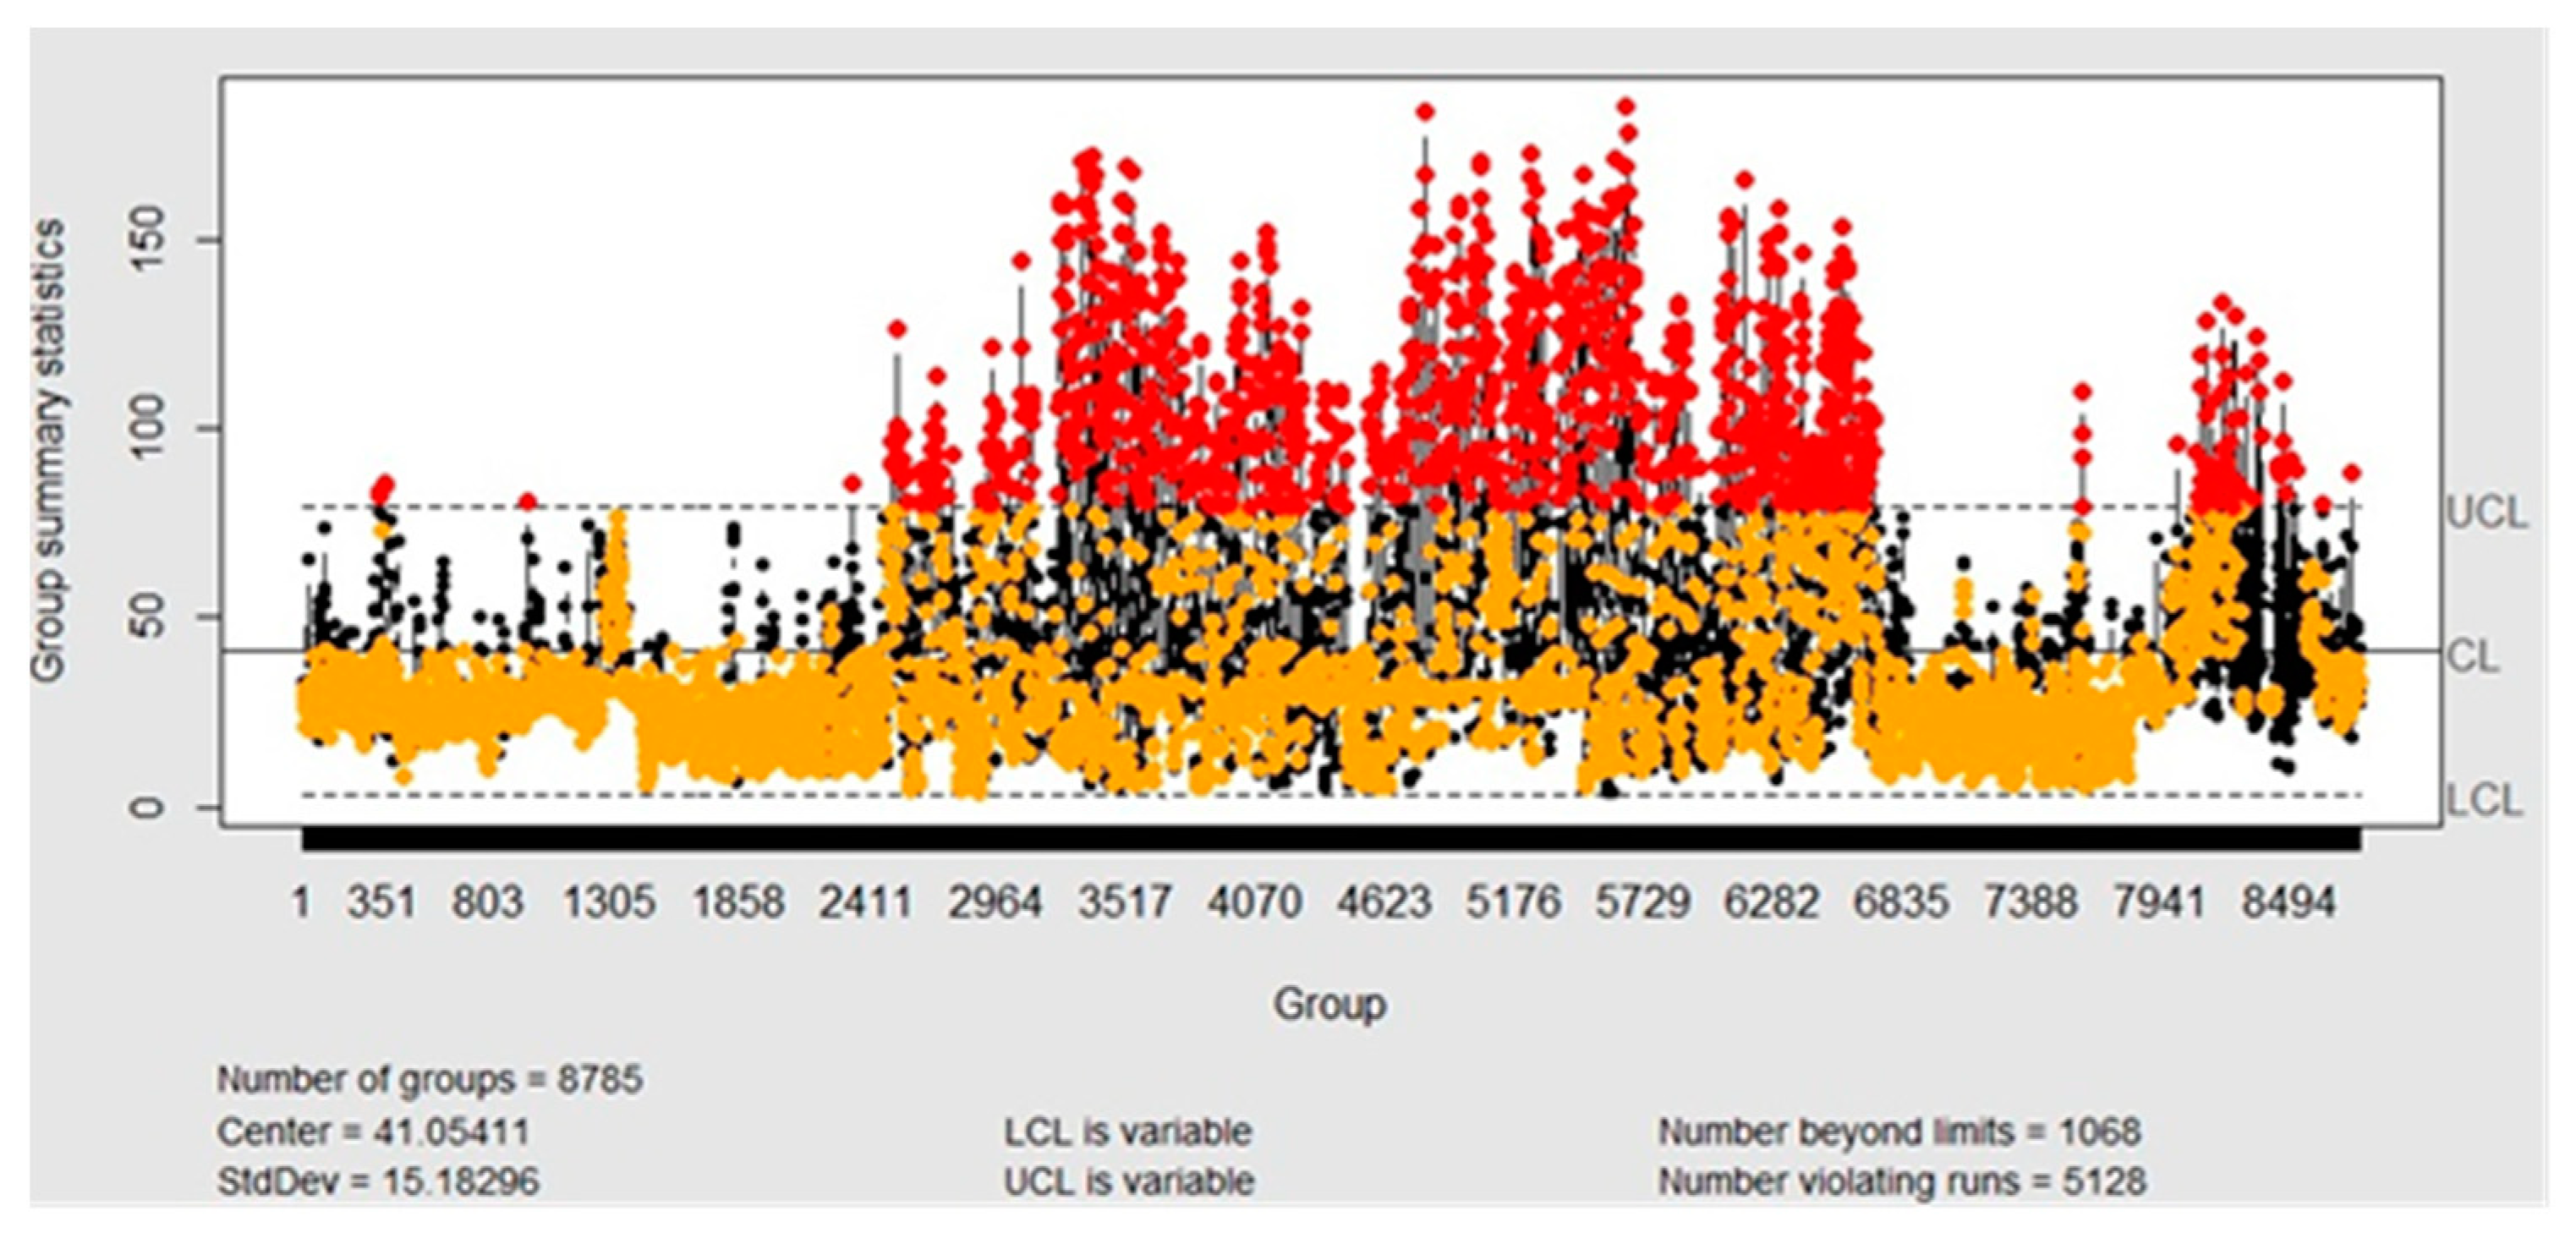
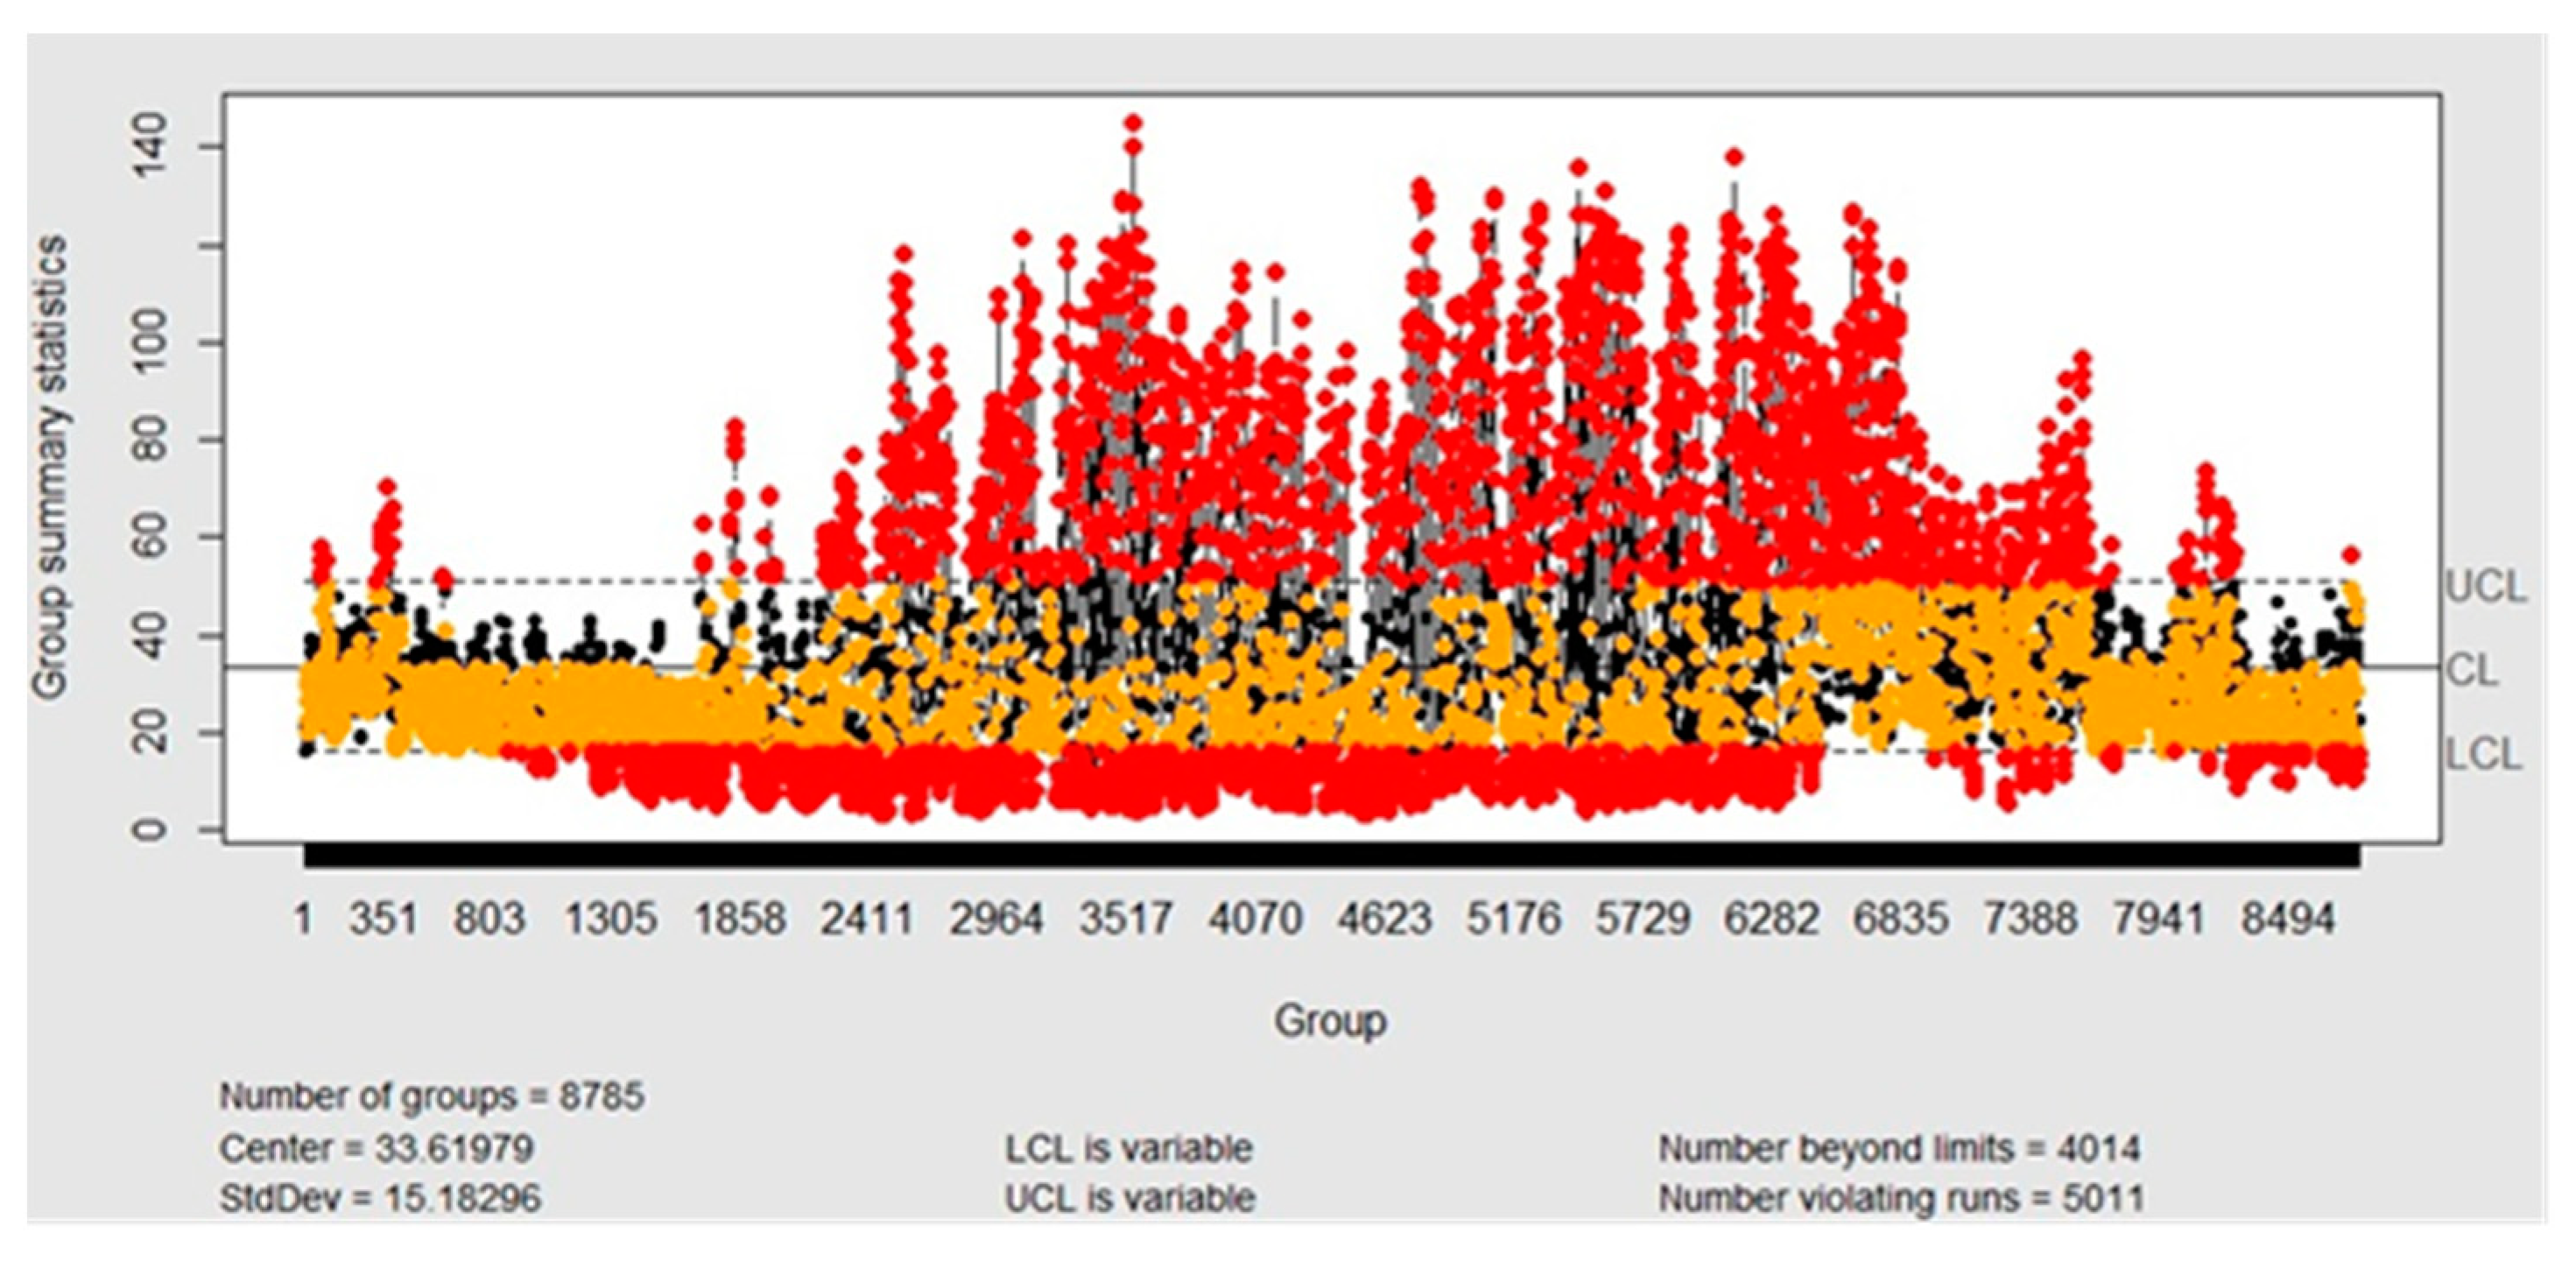
3.2. Statistical Process Control

(I)
Control I-MR Chart with Individual Mean
The control chart of the I-MR hourly concentration was generated using the data through the SPC method. In the examination of the results in Figure 4, there were some false alarms, i.e., outliers that were significant. This challenge is attributable to the fact that the data were non-normal, as shown in Figure 3, and that there was greater variability in the data.
(II)
Control Chart with Hourly Rational Subgroups
The results of the hourly data as rational subgroups of the X ¯ and S chart are not under control because there were more variations in the data.

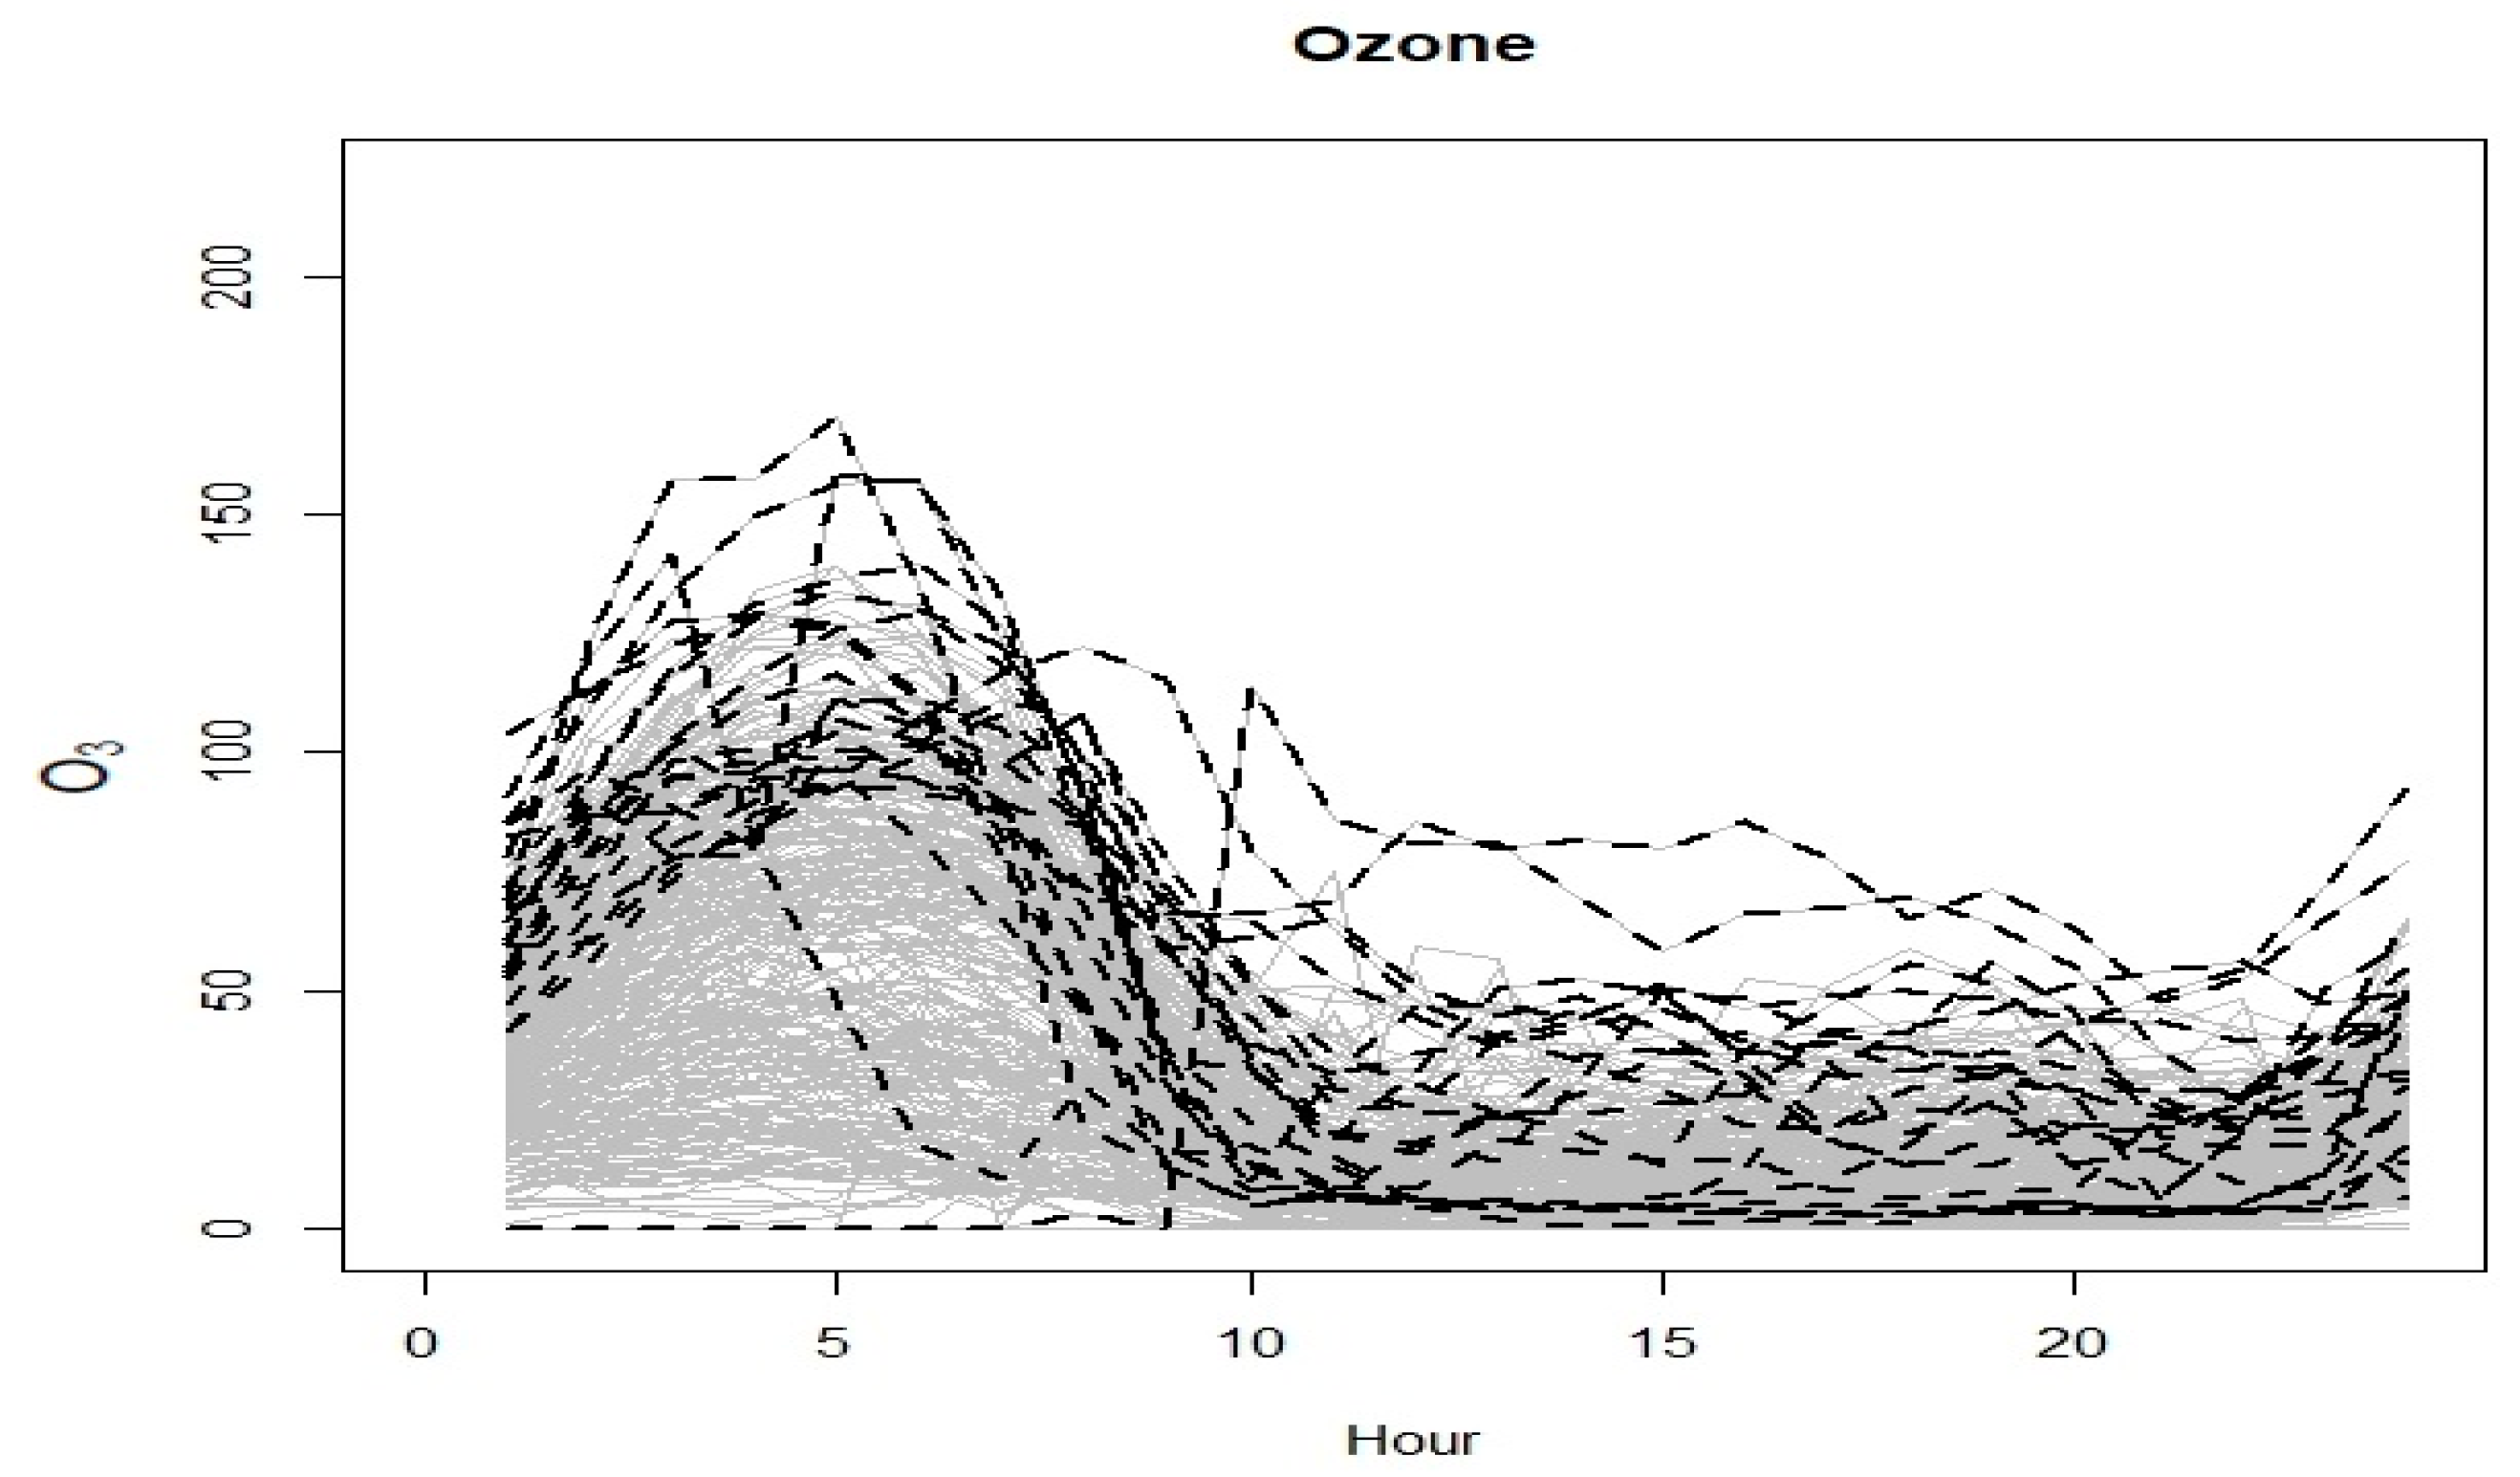
3.3. Functional Data Analysis

In the functional methodology technique, the initial step is to generate a sample curve based on discrete measurements taken each hour. The graph shows 365 functions derived from 24 h data. If the data have been translated into a functional form, i.e., curves with 24 points in a day, each of which takes into consideration the correlation between the O3 readings and may be examined for outliers, the data can be analyzed.
When the depths are taken into account, the functional analysis results let us discover days with aberrant functional points, even if there are no outliers. Despite the fact that the daily limit values were not exceeded, the O3 absorption may have demonstrated aberrant behavior throughout the course of the day. The functional technique, on the other hand, detects any variation from normal daily O3 emission behavior without depending on any distribution limits. The functional outliers found in this study. Outliers are indicated by black and dotted lines.
The variable O3 hourly data set was studied with a box plot, X ¯ /S chart, and functional depth. The hourly box plot (Figure 2) shows that there was a large number of outliers because of the O3 concentration. There were 5425 points not in between the limit using Tukey’s fences, as shown in Figure 2. The IMR and X ¯ /S chart (Figure 4, Figure 5 and Figure 6) shows that it was not statistically under control because there was greater variability in the O3 concentration. The X ¯ hourly control chart cycle shows that the UCL was 50.83 ( μ g / m 3 ) and the LCL was 16.40 ( μ g / m 3 ) and that the number beyond the limit was 4014, in which the smallest number of outliers was shown in the months of January to March and October to December and the largest number of outliers was shown in the months of April to September. This information shows that the highest concentration was in the months of April to September and that the minimum concentration was in the months of January to March and October to December. The S control chart shows that 1080 values went beyond the limit. This shows that there was a large number of concentrations beyond the standard limit (180 μ g / m 3 ), which is defined by the Indian Pollution Control Board. Moving on to functional data analysis, based on depth, Figure 7 represents the 365 functions (for each days) generated with 24 hourly data and Figure 8 shows functional outliers for 365 days. There were 25 outliers (24 h per day) detected out of 365 days. The data analysis revealed functionally significant changes on some days, which suggests that there were minimal O3 pollution issues. The FDA technique is good at identifying days where the patterns are distinct from those of the rest of the data. It is essential to examine pollution within permitted limits as well as days where the levels were detected to be different from what is expected. The functional approach detected an atypical day on the sixth day, as shown in Figure 8. The mean was higher than that obtained through SPC (Figure 5), but within the limit values, this day was not considered an outlier by classical analysis or SPC. The functional approach’s strength in detecting such a day allows for the study of the reasons behind the O3 behavior on that particular day.
Box plots can detect outliers, but they are disproportionate in all cases and fail to identify validation events. Additionally, the non-normality of the data makes it impossible to detect outliers below the minimum limit of the box plot. Control charts, such as an X ¯ chart, can detect trends but have flaws due to their initial design for industrial processes with low variability. The rational subgroups and mean values contribute to loss of information, preventing accurate outlier detection. Despite these flaws, control charts offer better and more consistent results than box plots, providing a clear graphical representation of variable changes over time. The functional approach studies the entire dataset, minimizing information loss and enabling reliable analysis of hidden trends. The transformation from discrete information points to functional data reduces instrumental errors detected by classical analysis and control charts. Instead, one can focus on analyzing the patterns and relationships within the data to gain insights. This allows for a more flexible approach in understanding the data without relying solely on their original distribution. The FDA approach performs well compared to classical statistics and control chart methods. Greater traceability of major sources, including information on the weather, traffic patterns, and industry sources, is required to comprehend aberrant O3 emissions behavior. Outlier evaluation can be enhanced by including meteorological factors like temperatures, daylight hours, and precipitation. Separating the sources of common and unique variability may be done with the use of outlier detection and air pollution events, which enable the creation and application of efficient mitigation strategies.

4. Conclusions

This study evaluates three analytical methodologies for identifying outliers in hourly data from a metropolitan air quality monitoring station in Victoria, Kolkata, India. Kolkata’s air quality is worsening day by day and it is challenging to find outliers for air quality. Traditional vectorial techniques, statistical process control, and functional data analysis were used to analyze data, dividing them into days or hours and control charts. The mean imputation and proposed methodology findings help to identify the air pollution events and outliers. To effectively control air pollution and achieve pure air quality conditions, a new strategy and new techniques are needed to measure local air pollution. The result obtained using the classical vectorial method is simple but has weaknesses in terms of the temporal correlation structure and recognizing true outliers. Advanced methodologies can provide deeper insights into mitigating air pollution issues, similar to statistical process control. As a result, the method might be unable to effectively identify patterns or trends that could help in differentiating between true abnormalities and false alarms. The accuracy of outlier identification might be improved and the incidence of false alarms could be decreased by including techniques that can record and analyze continuous data. Additionally, working from a functional point of view may also require expertise in statistical modeling and analysis to accurately interpret the results. Furthermore, the use of functional data analysis techniques may not be suitable for datasets with missing or incomplete observations. To do so, it is necessary to impute the data, as complete time units are required for analysis. By identifying and analyzing outliers from a functional point of view, researchers can gain valuable insights into the factors that contribute to air pollution and its control. This information can then be used to develop targeted actions and policies that effectively address the root causes of these distinct O3 value sets. Additionally, understanding the O3 outliers helps with accurately quantifying the impact of air pollution on public health and enabling better decision-making for sustainable development. Future studies aim to eliminate percentiles for outliers by testing classification techniques like isolation forest or k-means, identifying functions as outliers.

Author Contributions

Writing—original draft preparation, W.C. and M.A.; formal analysis, M.A. and X.Z.; writing—review and editing, W.C. and M.A.; validation, W.C. and X.Z.; supervision, W.C.; funding acquisition, W.C. All authors have read and agreed to the published version of the manuscript.

Funding

This work was supported by the National Natural Science Foundation of China (grant No. 11801019) and the Beijing Natural Science Foundation (grant No. Z190021).

Institutional Review Board Statement

Not applicable.

Informed Consent Statement

Not applicable.

Data Availability Statement

The data has been made publicly available by the Central Pollution Control Board: https://cpcb.nic.in/ which is the official portal of Government of India. They also have a real-time monitoring app: https://app.cpcbccr.com/AQI_India/.

Conflicts of Interest

The authors declare no conflict of interest.

References

  1. Chatterjee, A.; Sarkar, C.; Adak, A.; Mukherjee, U.; Ghosh, S.K.; Raha, S. Ambient air quality during Diwali Festival over Kolkata-a mega-city in India. Aerosol Air Qual. Res. 2013, 13, 1133–1144. [Google Scholar] [CrossRef]
  2. Haque, M.S.; Singh, R.B. Air pollution and human health in Kolkata, India: A case study. Climate 2017, 5, 77. [Google Scholar] [CrossRef]
  3. Kumar, K.; Pande, B.P. Air pollution prediction with machine learning: A case study of Indian cities. Int. J. Environ. Sci. Technol. 2023, 20, 5333–5348. [Google Scholar] [CrossRef] [PubMed]
  4. Majumdar, D.; Purohit, P.; Bhanarkar, A.D.; Rao, P.S.; Rafaj, P.; Amann, M.; Sander, R.; Pakrashi, A.; Srivastava, A. Managing future air quality in megacities: Emission inventory and scenario analysis for the Kolkata Metropolitan City, India. Atmos. Environ. 2020, 222, 117135. [Google Scholar] [CrossRef]
  5. Aldegunde, J.A.; Bolaños, E.Q.; Fernández-Sánchez, A.; Saba, M.; Caraballo, L. Environmental and Health Benefits Assessment of Reducing PM2.5 Concentrations in Urban Areas in Developing Countries: Case Study Cartagena de Indias. Environments 2023, 10, 42. [Google Scholar] [CrossRef]
  6. Aldegunde, J.A.; Sánchez, A.F.; Saba, M.; Bolaños, E.Q.; Palenque, J.Ú. Analysis of PM2.5 and meteorological variables using enhanced geospatial techniques in developing countries: A case study of Cartagena de Indias City (Colombia). Atmosphere 2022, 13, 506. [Google Scholar] [CrossRef]
  7. Karaca, F.; Alagha, O.; Ertürk, F. Statistical characterization of atmospheric PM10 and PM2.5 concentrations at a non-impacted suburban site of Istanbul, Turkey. Chemosphere 2005, 59, 1183–1190. [Google Scholar] [CrossRef]
  8. Datta, A.; Hassan, K.L.; Kundu, K. Rule-Based Investigation on Positive Change in Air Quality at Kolkata during Lockdown Period Due to COVID-19 Pandemic. In Proceedings of the Doctoral Symposium on Human Centered Computing, West Bengal, India, 23 February 2023; Springer Nature: Singapore, 2023; pp. 212–222. [Google Scholar]
  9. Chinnasamy, P.; Shah, Z.; Shahid, S. Impact of lockdown on air quality during COVID-19 pandemic: A case study of India. J. Indian Soc. Remote Sens. 2023, 51, 103–120. [Google Scholar] [CrossRef]
  10. Persis, J.; Amar, A.B. Predictive modeling and analysis of air quality–Visualizing before and during COVID-19 scenarios. J. Environ. Manag. 2023, 327, 116911. [Google Scholar] [CrossRef]
  11. Rubin, D.B. An overview of multiple imputation. In Proceedings of the Survey Research Methods Section of the American Statistical Association, New Orleans, LA, USA, 22–25 August 1988; Volume 79, p. 84. [Google Scholar]
  12. Lin, W.C.; Tsai, C.F.; Zhong, J.R. Deep learning for missing value imputation of continuous data and the effect of data discretization. Knowl.-Based Syst. 2022, 239, 108079. [Google Scholar] [CrossRef]
  13. Boursalie, O.; Samavi, R.; Doyle, T.E. Evaluation methodology for deep learning imputation models. Exp. Biol. Med. 2022, 247, 1972–1987. [Google Scholar] [CrossRef] [PubMed]
  14. Sosa Donoso, J.R.; Flores, M.; Naya, S.; Tarrío-Saavedra, J. Local Correlation Integral Approach for Anomaly Detection Using Functional Data. Mathematics 2023, 11, 815. [Google Scholar] [CrossRef]
  15. Sancho, J.; Pastor, J.J.; Martínez, J.; García, M.A. Evaluation of harmonic variability in electrical power systems through statistical control of quality and functional data analysis. Procedia Eng. 2013, 63, 295–302. [Google Scholar] [CrossRef]
  16. Sancho, J.; Martínez, J.; Pastor, J.J.; Taboada, J.; Piñeiro, J.I.; García-Nieto, P.J. New methodology to determine air quality in urban areas based on runs rules for functional data. Atmos. Environ. 2014, 83, 185–192. [Google Scholar] [CrossRef]
  17. Sancho, J.; Iglesias, C.; Piñeiro, J.; Martínez, J.; Pastor, J.J.; Araújo, M.; Taboada, J. Study of water quality in a spanish river based on statistical process control and functional data analysis. Math. Geosci. 2016, 48, 163–186. [Google Scholar] [CrossRef]
  18. Martínez, J.; Saavedra, Á.; García-Nieto, P.J.; Piñeiro, J.I.; Iglesias, C.; Taboada, J.; Sancho, J.; Pastor, J. Air quality parameters outliers detection using functional data analysis in the Langreo urban area (Northern Spain). Appl. Math. Comput. 2014, 241, 1–10. [Google Scholar] [CrossRef]
  19. Martínez Torres, J.; Pastor Pérez, J.; Sancho Val, J.; McNabola, A.; Martínez Comesaña, M.; Gallagher, J. A functional data analysis approach for the detection of air pollution episodes and outliers: A case study in Dublin, Ireland. Mathematics 2020, 8, 225. [Google Scholar] [CrossRef]
  20. Beevers, S.D.; Carslaw, D.C.; Dajnak, D.; Stewart, G.B.; Williams, M.L.; Fussell, J.C.; Kelly, F.J. Traffic management strategies for emissions reduction: Recent experience in London. Energy Emiss. Control Technol. 2016, 28, 27–39. [Google Scholar] [CrossRef]
  21. Dombeck, D.A.; Graziano, M.S.; Tank, D.W. Functional clustering of neurons in motor cortex determined by cellular resolution imaging in awake behaving mice. J. Neurosci. 2009, 29, 13751–13760. [Google Scholar] [CrossRef]
  22. Ordòñez, C.; Martìnez, J.; Saavedra, À.; Mourelle, A. Intercomparison exercise for gases emitted by a cement industry in Spain: A functional data approach. J. Air Waste Manag. Assoc. 2011, 61, 135–141. [Google Scholar] [CrossRef]
  23. Torres, J.M.; Nieto, P.G.; Alejano, L.; Reyes, A.N. Detection of outliers in gas emissions from urban areas using functional data analysis. J. Hazard. Mater. 2011, 186, 144–149. [Google Scholar] [CrossRef] [PubMed]
  24. Di Blasi, J.P.; Torres, J.M.; Nieto, P.G.; Fernández, J.A.; Muñiz, C.D.; Taboada, J. Analysis and detection of outliers in water quality parameters from different automated monitoring stations in the Miño river basin (NW Spain). Ecol. Eng. 2013, 60, 60–66. [Google Scholar] [CrossRef]
  25. Matías, J.M.; Ordóñez, C.; Taboada, J.; Rivas, T. Functional support vector machines and generalized linear models for glacier geomorphology analysis. Int. J. Comput. Math. 2009, 86, 275–285. [Google Scholar] [CrossRef]
  26. Martinez, W.G.; Weese, M.L.; Jones-Farmer, L.A. A one-class peeling method for multivariate outlier detection with applications in phase I SPC. Qual. Reliab. Eng. Int. 2020, 36, 1272–1295. [Google Scholar] [CrossRef]
  27. García-Nieto, P.J. Parametric study of selective removal of atmospheric aerosol by coagulation, condensation and gravitational settling. Int. J. Environ. Health Res. 2001, 11, 149–160. [Google Scholar] [CrossRef] [PubMed]
  28. Donders, A.R.; Van Der Heijden, G.J.; Stijnen, T.; Moons, K.G. A gentle introduction to imputation of missing values. J. Clin. Epidemiol. 2006, 59, 1087–1091. [Google Scholar] [CrossRef]
  29. Carslaw, D.C.; Ropkins, K. Openair—An R package for air quality data analysis. Environ. Model. Softw. 2012, 27, 52–61. [Google Scholar] [CrossRef]
  30. Piateski, G.; Frawley, W. Knowledge Discovery in Databases; MIT Press: Cambridge, MA, USA, 1991. [Google Scholar]
  31. Narasimhan, D.; Vanitha, M. Machine Learning Approach-based Big Data Imputation Methods for Outdoor Air Quality Forecasting. J. Sci. Ind. Res. 2023, 82, 338–347. [Google Scholar]
  32. Montgomery, D.C. Design and Analysis of Experiments; John Wiley & Sons: Hoboken, NJ, USA, 2017. [Google Scholar]
  33. Shewhart, W.A. Economic Control of Quality of Manufactured Product; Macmillan and Co Ltd.: London, UK, 1931. [Google Scholar]
  34. Chen, Y.K. An evolutionary economic-statistical design for VSI X control charts under non-normality. Int. J. Adv. Manuf. Technol. 2003, 22, 602–610. [Google Scholar] [CrossRef]
  35. Box, G.E.; Cox, D.R. An analysis of transformations. J. R. Stat. Soc. Ser. B Stat. Methodol. 1964, 26, 211–243. [Google Scholar] [CrossRef]
  36. Grant, E.; Leavenworth, R. Statistical Quality Control; McGraw-Hill: New York, NY, USA, 1998. [Google Scholar]
  37. Champ, C.W.; Woodall, W.H. Exact results for Shewhart control charts with supplementary runs rules. Technometrics 1987, 29, 393–399. [Google Scholar] [CrossRef]
  38. Zhang, M.H.; Lin, W.Y.; Klein, S.A.; Bacmeister, J.T.; Bony, S.; Cederwall, R.T.; Del Genio, A.D.; Hack, J.J.; Loeb, N.G.; Lohmann, U.; et al. Comparing clouds and their seasonal variations in 10 atmospheric general circulation models with satellite measurements. J. Geophys. Res. Atmos. 2005, 110, D15S02. [Google Scholar] [CrossRef]
  39. Western Electric Company. Statistical Quality Control Handbook; Western Electric Company: Roseville, GA, USA, 1956. [Google Scholar]
  40. Ramsay, J.O.; Silverman, B.W. Functional Data Analysis; Springer: Berlin/Heidelberg, Germany, 2005. [Google Scholar]
  41. R Core Team. R: A Language and Environment for Statistical Computing; R Foundation for Statistical Computing: Vienna, Austria, 2014. [Google Scholar]
  42. Central Pollution Control Board Air Quality (2018) India. Available online: https://cpcb.nic.in/ (accessed on 20 March 2021).
Figure 1. Individual time series of O3 hourly concentration.
Sustainability 15 12790 g001
Figure 2. Hourly box plot of O3. The central and black lines represent the median, and the red dots are outliers.
Sustainability 15 12790 g002
Figure 3. Normal probability plot of hourly O3 (Q-Q plot).
Sustainability 15 12790 g003
Figure 4. IMR chart with hourly range of O3 concentration, where LCL = 3.10 and UCL = 79.01.
Sustainability 15 12790 g004
Figure 5. X ¯ chart of hourly O3 concentration of rational subgroups, where LCL = 16.40 and UCL = 50.83.
Sustainability 15 12790 g005
Figure 6. S chart of hourly O3 concentration of rational subgroups, where LCL = 1.72 and UCL = 27.63.
Sustainability 15 12790 g006
Figure 7. Hourly concentration of O3 represented in functional form.
Sustainability 15 12790 g007
Figure 8. Hourly O3 functional diagram for outliers.
Sustainability 15 12790 g008
Table 1. Statistical summary of O3 hourly concentration.
MinQ1
3.03 μg/ m 3 12.46 μg/ m 3
MaxQ2
153.32 μg/ m 323.91 μ g / m 3
MeanQ3
32.98 μ g / m 3 43.84 μ g / m 3
Std DevVar
27.75 μ g / m 3 770.06 μ g / m 3
NIQR
878531.38 μ g / m 3
Disclaimer/Publisher’s Note: The statements, opinions and data contained in all publications are solely those of the individual author(s) and contributor(s) and not of MDPI and/or the editor(s). MDPI and/or the editor(s) disclaim responsibility for any injury to people or property resulting from any ideas, methods, instructions or products referred to in the content.

