Article

Bearing Characteristics of Rock Joints under Different Bolts Installation Angles and Their Underlying Mechanism

1
College of Energy and Mining Engineering, Shandong University of Science and Technology, Qingdao 266590, China
2
Academician (Expert) Workstation, Inner Mongolia Shanghaimiao Mining Co., Ltd., Ordos 016299, China
3
School of Engineering, Nagasaki University, Nagasaki 852-8521, Japan
*
Author to whom correspondence should be addressed.
Sustainability 2023, 15(17), 12876; https://doi.org/10.3390/su151712876
Submission received: 31 July 2023 / Revised: 19 August 2023 / Accepted: 23 August 2023 / Published: 25 August 2023

Abstract

:
To explore the mechanical failure characteristics of bolted joints under different bolt installation angles and the effect of bolting on the shear strength of joints, a numerical model of structural plane anchoring with different bolt installation angles was established based on the improved Pile element, and a series of uniaxial compression numerical tests were carried out to systematically study the effects of bolt installation angle on bolts. The results show that as the bolt installation angle increases, the peak stress of the specimen is first constant and then decreases, and the elastic modulus of the specimen decreases nonlinearly. When the bolt installation angle is lower than 45°, the bearing capacity of the joints is higher. The interaction between the bolt and the specimen’s force is mainly concentrated at the intersection of the structural plane and the area where the nut gaskets are installed at both ends of the bolt. The horizontal stress is higher in the area where the nut gaskets are installed at both ends of the bolt. With an increase in bolt installation angle, the plastic zone volume of the anchored joint specimen increases linearly with an exponential function. When the bolt installation angle is lower than 45°, the plastic zone volume increases slowly, and when the bolt installation angle is higher than 45°, the plastic zone volume increases rapidly. When the bolt installation angle is small, the contribution of the bolt axial force is greater than that of the bolt shear force. In contrast, when the bolt installation angle is large, the contribution of the bolt axial force is lower than the contribution of the bolt shear force. With an increase in bolt installation angle, the contribution of the bolt axial force decreases nonlinearly, the contribution of the bolt shear force increases linearly, and the shear resistance decreases nonlinearly. The optimal bolt installation angle is about 45°, but the optimal bolt installation angle also changes constantly under the influence of factors such as bolt type, rock strength, and external load.

1. Introduction

As the depth of coal mining progresses year by year, the geological conditions of coal mining become increasingly complicated, and problems such as high ground stress, strong mining stress, and soft breakage of surrounding rocks become more prominent. The frequency of damage to roadway support structures and other phenomena increases significantly [1]. Under the combined action of ground stress and mining stress, the surrounding rock of a roadway is very easy to shear and slip along the joints, and the bolts are easy to break under shear force, which leads to the failure of the supporting structure and seriously affects the stability of the roadway’s surrounding rock [2,3], as shown in Figure 1. Therefore, to ensure the safety and stability of roadways, it is of great scientific significance and engineering value to study the shear mechanical properties of anchorage joints and the breaking mechanical properties of anchor rods under tensile shear.
To study the bearing characteristics and mechanism of bolted joints, many experts have carried out research studies on the shear characteristics of bolted joints and achieved remarkable results. Chen et al. [4] carried out shear tests of bolted joints under different normal stresses and rough joints and systematically analyzed the failure characteristics, shear strength, and shear stiffness of the bolted joints after the tests. Wang et al. [5] carried out direct shear tests of bolted joints of different bolt types and analyzed the rule underlying the influence of bolt elongation on the shear characteristics of the joints. Wang Guanghui et al. [6] analyzed the stress distribution of bolts and the interaction between the bolt-anchoring agent and the surrounding rock under different anchoring modes, utilizing numerical simulation. Based on 3D engraving technology, Wang Liangqing et al. [7] produced a large number of joint rocks with the same morphological characteristics and conducted shear tests of their bolted joints under different roughness conditions to study the influence of the dilatancy effect of the joint plane on the axial force, deformation, and failure mode of the anchor rod. However, the abovementioned studies were carried out under the condition of a 90° bolt installation angle, and the influence of different bolt installation angles was not considered.
To study the effect of bolt installation angle on the shear characteristics of bolted joints, scholars have carried out their research using theoretical analyses, laboratory tests, and numerical simulations. In terms of theoretical analyses, Liu Quansheng et al. [8], Li Haibin et al. [9], and Yang Buyun et al. [10], based on the classical beam theory and the minimum residual energy variational method, proposed a theoretical formula of the deformation and stress of bolts during shear and discussed the law underlying the influence of bolt installation angle on the shear strength of bolted joints. In laboratory tests, direct shear and uniaxial compression are often used to generate shear deformation of bolted joints and to study the influence of inclined bolts on the strength of the structural parts. Cui et al. [11] studied the influence of bolt installation angle on the shear characteristics and failure characteristics of joints through direct shear tests. The results show that with an increase in bolt installation angle, the peak shear stress and maximum friction coefficient both first increase and then decrease. Zhou Hui et al. [12], Srivastava et al. [13], Zhao Tongbin et al. [14], and Yang et al. [15] analyzed the rock failure morphology and strength characteristics of joints before and after anchoring using indoor uniaxial compression tests and studied the evolution law of the deformation field of these specimens during loading and the anchoring control mechanism of the inclined bolts. In terms of numerical simulations, He Dongliang et al. [16] used PFC numerical simulation software to establish numerical models of bolted joints under different bolt installation angles and conducted direct shear tests under different normal loads to reveal the mechanical characteristics and failure characteristics of rock joint surfaces under different bolt installation angles and shear loads from the macro- and micro-perspectives. Wu Dongyang et al. [17] and Chen Miao et al. [18] used PFC numerical simulation software to establish numerical models of bolted joints with different bolt installation angles and conducted uniaxial compression tests to analyze the influence of bolt installation angles on the macro- and micromechanical properties of bolted joints. To clarify the anchoring effect of bolts, Zhen et al. [19] established three-dimensional numerical simulation by using the FLAC3D numerical simulation software, reproduced the gradual damage process of the jointed rock mass, and obtained the best anchoring conditions for the jointed rock mass. The above research results enhance our understanding of the shear mechanical properties of joints. However, at present, studies are still limited in providing an understanding of the shear characteristics of bolted joints. Only qualitative analysis has been conducted on the mechanical characteristics, deformation, and failure characteristics of anchoring structural parts, while quantitative analysis on the stress characteristics and action mechanisms of bolts under different bolt installation angles is still lacking.
To address the gap in current knowledge, in this study we utilized FLAC3D numerical simulation software to establish a numerical model of bolted joints with different bolt installation angles and carried out numerical simulation tests of uniaxial compression to analyze the influence of bolt installation angles on the compressive strength, elastic modulus, and failure characteristics of anchoring solids. Moreover, combined with the stress analysis of anchoring bolts, the influence of bolt installation angles on the contribution value of bolt shear resistance was revealed. The research results can provide a scientific reference for the stability control of complex roadways.

2. Establishment of a Numerical Model and Simulation Scheme

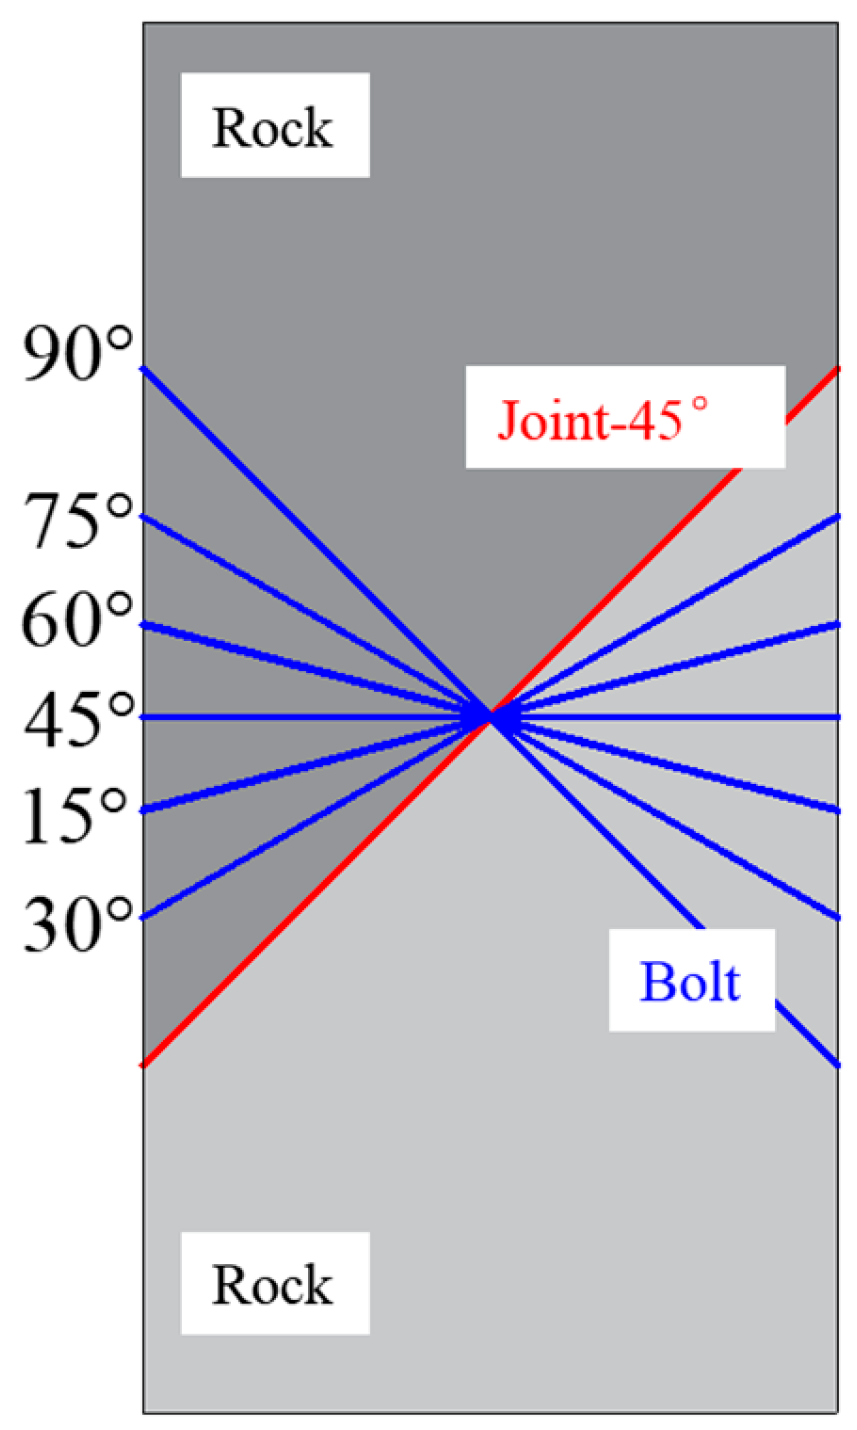
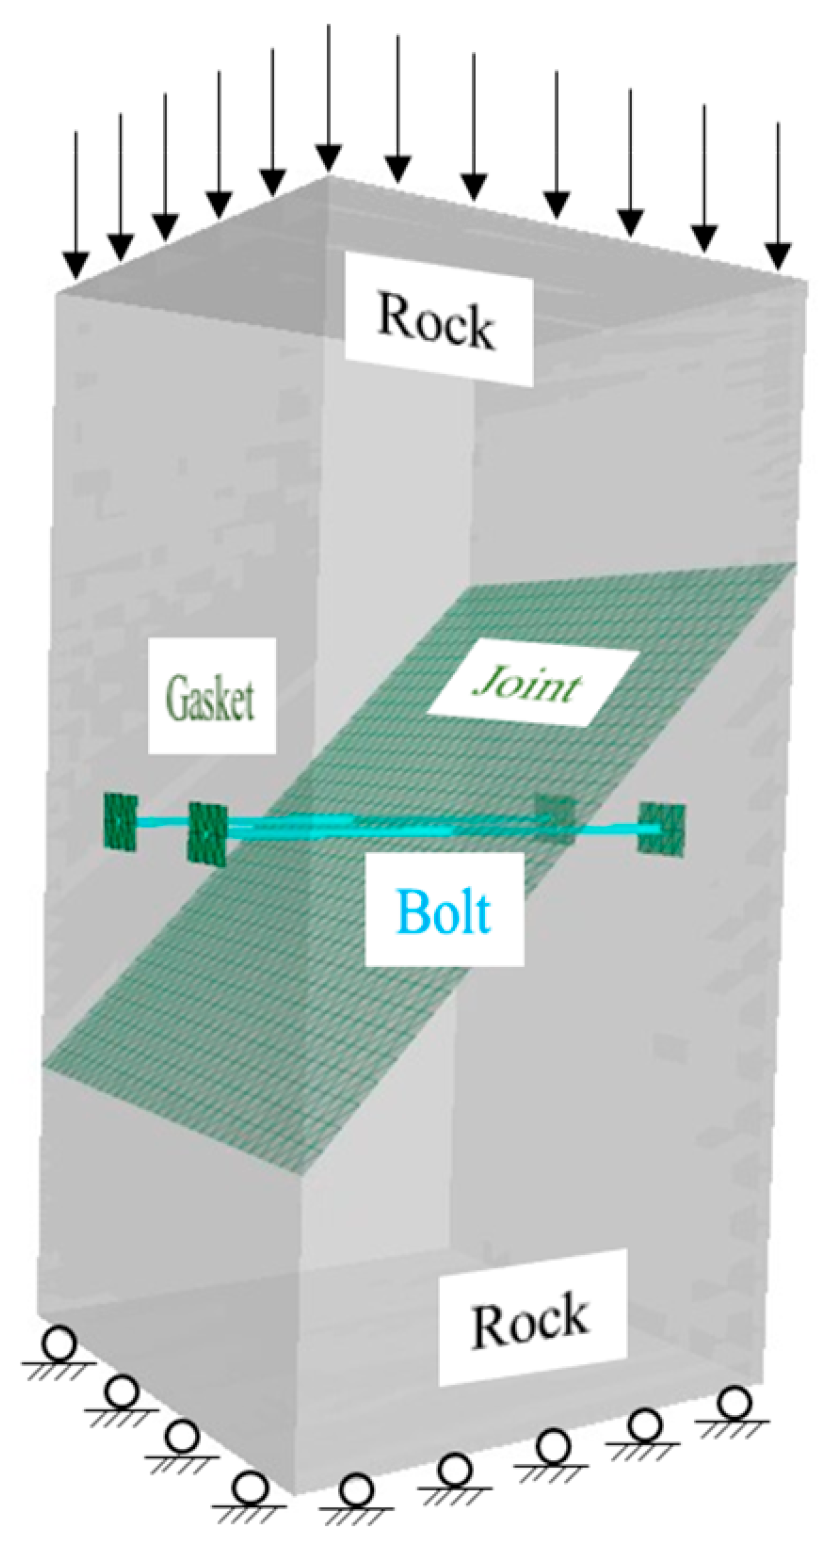
2.1. Establishment of a Numerical Model

It is necessary to establish models with different bolt installation angles to study the effect of bolt installation angles on the shear characteristics of joints. At present, there are two main ways to realize models with different bolt installation angles: The first is that the bolt installation angle is unchanged while the angle of the joint is changed. According to the test results of Srivastava et al. [13], when the tilt angle of the joint is between 45°and 60°, the specimen mainly slides and fails. The compressive strength of the specimen is provided by the friction of the joint, and its uniaxial compressive strength is small, being less than 0.2 MPa. The shear and rupture failure of the specimen occur, and the compressive strength of the specimen is provided by the friction of the joint and the strength of the part of the rock itself. The uniaxial compressive strength of the specimen is relatively large, exceeding 40 MPa. It can be observed that the strength of the structural part also changes with the change of the joint angle of the specimen [20], which is not conducive to the quantitative analysis of the influence of bolt installation angles on the shear characteristics of the joint. The second method is that the joint is unchanged while the installation angle of the bolt is changed [21]. Since it is difficult to install nut gaskets to fix an inclined bolt to the surface of a rock specimen, this model is rarely used in practice. However, in numerical simulation, the inclined bolt and the surface of the specimen can be directly fixed via programming. Therefore, based on the above analysis, the joint inclination angle of the model in this study was designed to be 45°, and then the bolt installation angles were set up to be 15°, 30°, 45°, 60°, 75°, and 90°, respectively, as shown in Figure 2.
The numerical model in this study was established based on the specimen tested in the study by Srivastava et al. [13] to facilitate the identification and verification of the parameters of the physical model in the simulation. The final established model and boundary conditions are shown in Figure 3. The size of the model is 150 mm (length) × 150 mm (width) × 300 mm (height), the joint is located in the middle of the specimen, the inclination angle is 45°, and two holes with a diameter of 10 mm are drilled 50 mm apart to install the bolt with a diameter of 6 mm. The bolt adopts full-length anchoring without applying preload. The model has 54,000 zones and 59,582 grid points; each Pile is divided into 20 segments. The bolt is fixed with a nut gasket on the specimen surface. The boundary conditions and the loading mode of the numerical model are consistent with those of the specimen used in the laboratory tests; that is, the bottom end of the specimen is fixed, and a constant rate (2 × 10⁻⁸ m/step) is applied to the top of the specimen. In the simulation, the stress and strain of the specimen were calculated by monitoring the reaction force and displacement of the upper and lower surfaces of the specimen, and the deformation and force of the bolt were determined by monitoring the force and deformation of the Pile. The detailed calculation method is described in reference [22].
The Pile structure unit in FLAC3D is composed of nodes, structural members, and a coupled spring-slide block. It can transfer force, displacement, and bending moment to the solid element; thus, it can simulate the axial tension and tangential shear force characteristics of the bolt body. Numerous studies have shown that both shear yield and shear failure of a bolt occur under the action of tension-shear coupling [8,23,24], but the Pile structural unit of the software cannot simulate the tension-shear coupling failure and fracture of a bolt, which is inconsistent with practice [25]. Given this, Jiang et al. [22] proposed an improved Pile structural element, whose shear yield and fracture are determined by considering axial force and shear force together, which overcomes the defect that the built-in model cannot achieve shear failure while the shear failure of the independent model of tensile shear does not consider the yield of the bolt. The model expression is shown in Formula (1), and the specific improvement method has been described in the literature [22]:
F s = A G γ   ( F s < F sYield , ε < ε Max ) F sYield   ( F sYield F s F sMax , ε < ε Max ) 0   ( F s F sMax   or   ε > ε Max )
In the formula, F s is the sheer force of the bolt, in kN; F sYield is the rock bolt’s yield shear stress, in MPa; F sMax is the maximum shear stress of the bolt, in MPa; ε Max is the tensile failure variable of the bolt; and G is the shear stiffness of the bolt, in GPa.

2.2. Model Parameters and Validation

The Moore-Coulomb constitutive model was used to simulate the rock and interface to simulate the joint. The model parameters are shown in Table 1. The modified Pile structural unit was used to simulate the bolt, and the Liner structural unit was used to simulate the gasket. It is worth noting that to simulate the fixing effect of nuts, the link between the Liner and the improved Pile structural unit is fixed [26]. Model parameters were selected according to references [25,26], as shown in Table 1. To verify the reliability of the simulation results, the simulation results at the bolt installation angle of 45° were compared with the test results of the T2 material at 45° reported by Srivastava et al. [13]. The peak compressive strengths of the simulation and the test were 9.52 MPa and 9.57 MPa, respectively, and the elastic modulus was 1.21 GPa and 1.23 GPa, respectively. It can be seen from the comparison of the two results that the simulation results are consistent with the test results, which indicates that the model established in this study can better simulate the bearing capacity and yield fracture process of the anchor rod under tensile shear load.

3. Analysis of Numerical Simulation Results

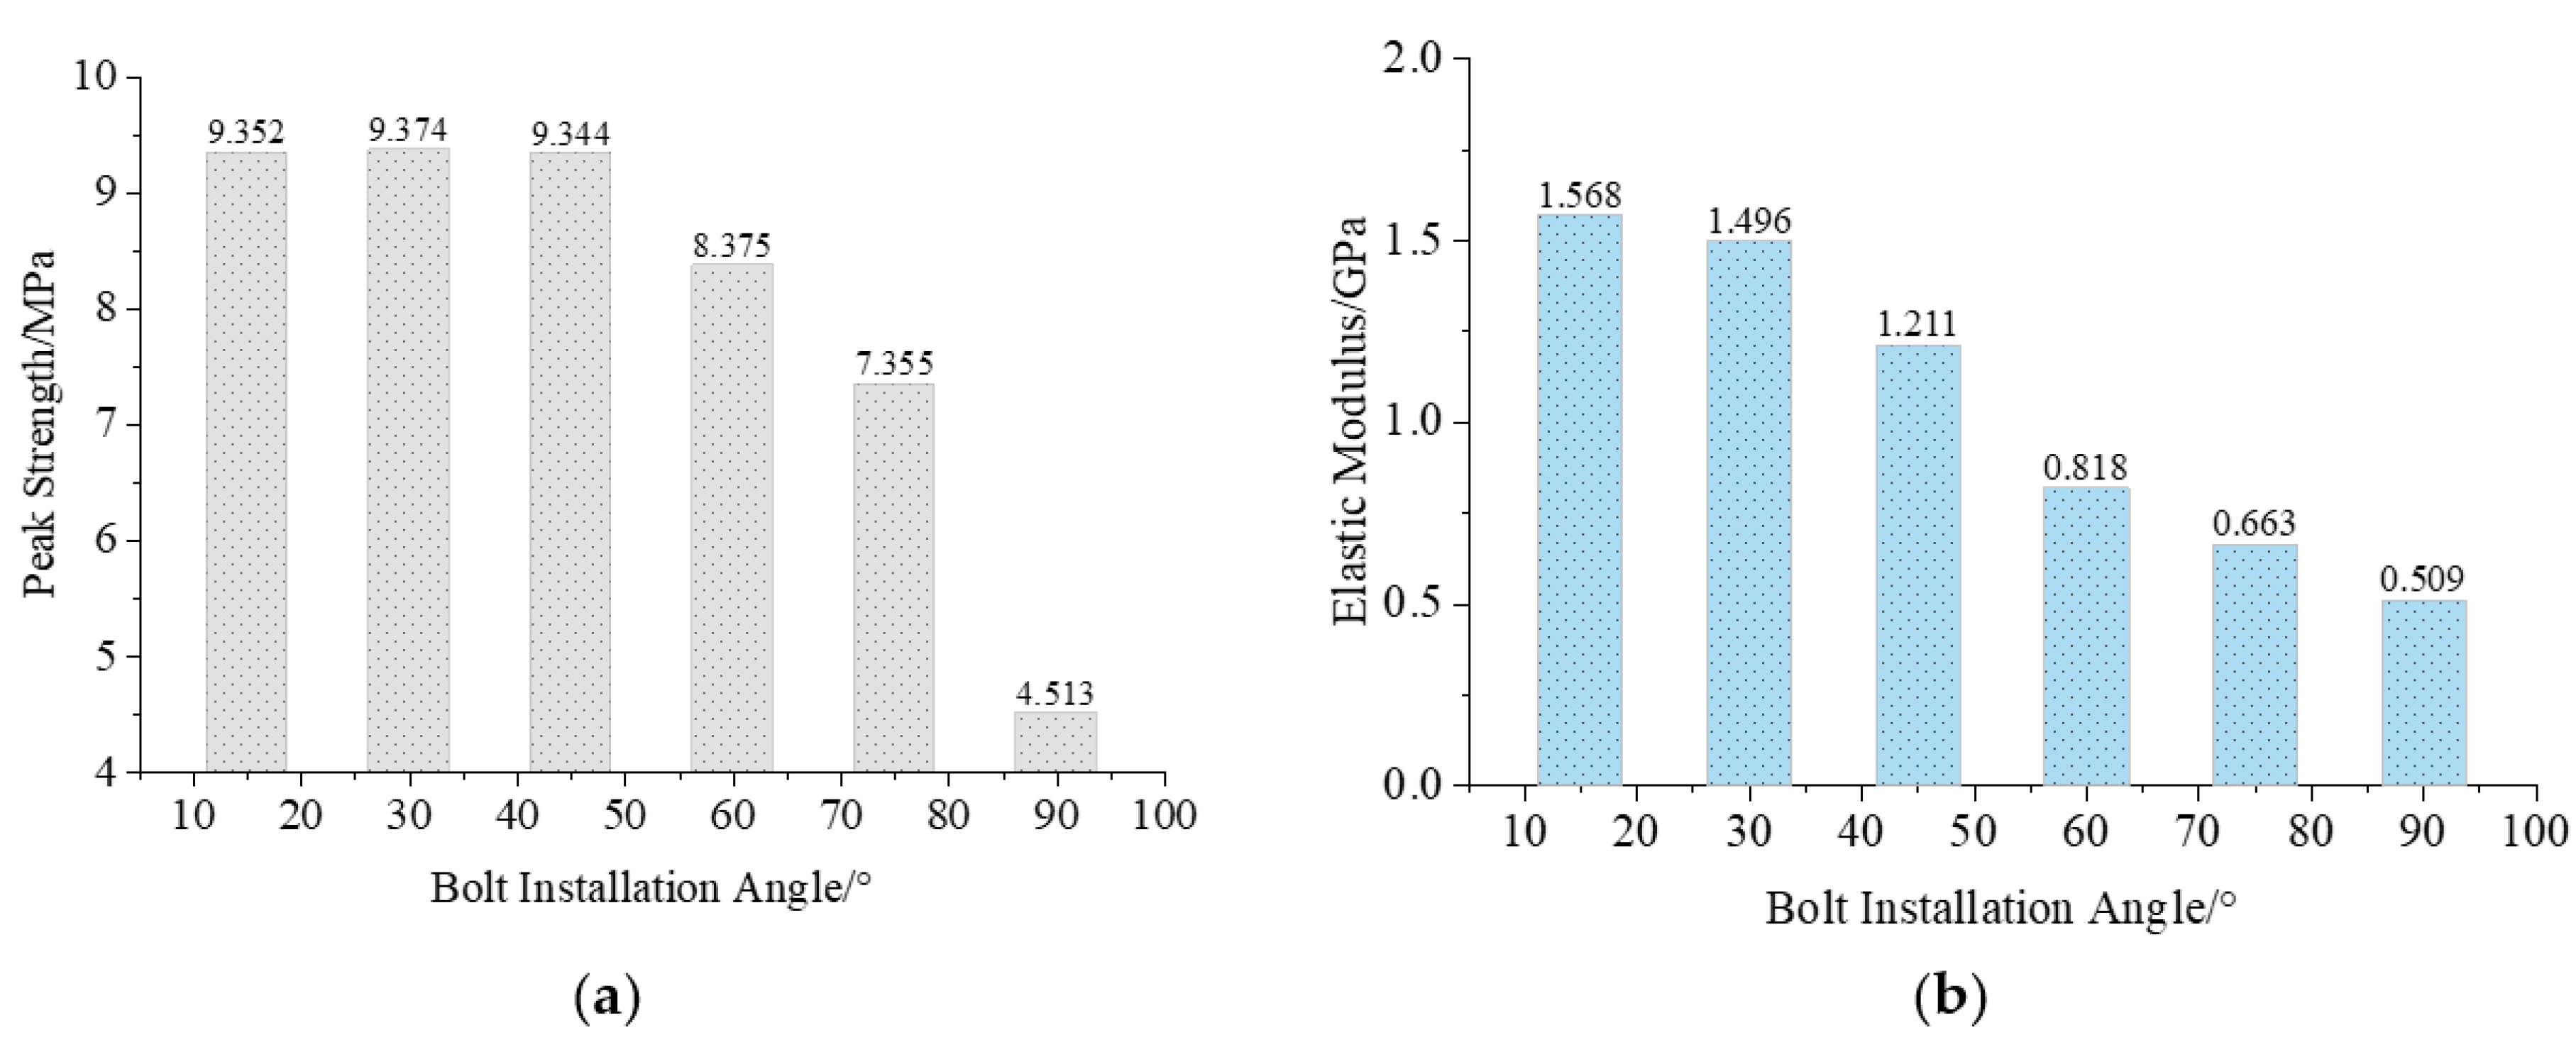
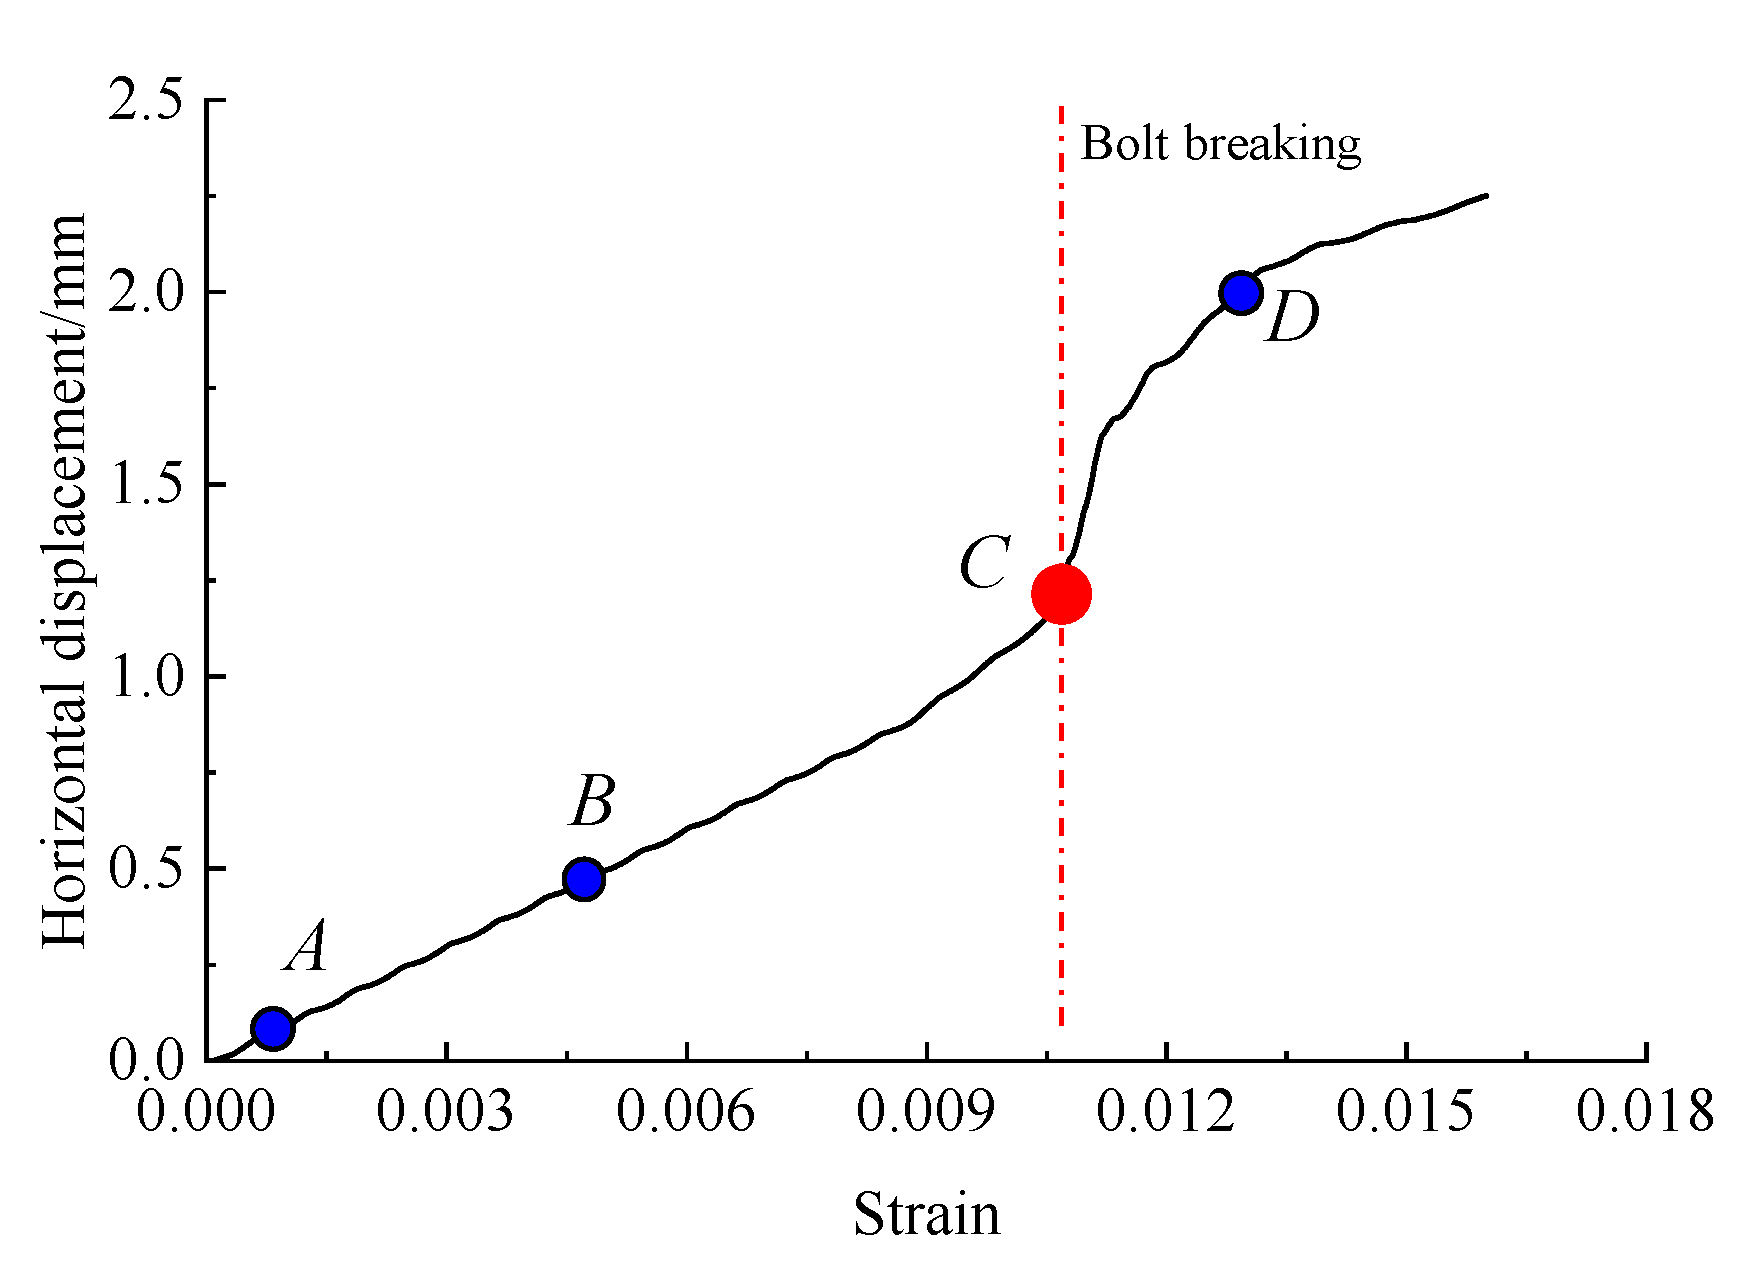
3.1. Analysis of the Deformation and Strength Characteristics of the Specimen

Figure 4 shows the stress-strain curves of the specimen under different bolt installation angles. As shown in the figure, the loading process for the specimen can be roughly divided into three stages: The I stage, from point A to point B of the stress-strain curve, is the initial stage, and the specimen has just begun to load. At this stage, the axial force and shear force of the bolt couple together to provide the shear action, and thus, the slope of the stress-strain curve is relatively large. The II stage, from point B to point C of the stress-strain curve, is the yield stage. After reaching the peak, the bolt has yielded, and the shear resistance exerted by the bolt has reached an extreme value and no longer increases. At this stage, the bolt has not broken and continues to play its role; thus, the stress-strain curve remains almost constant. The III stage, from point C to point D of the stress-strain cycle, is the breaking stage. With further increases in the deformation of the bolt, when the strain reaches the C point, the bolt breaks, resulting in a rapid reduction in the stress of the specimen.
To quantitatively analyze the influence of bolt installation angle on the peak strength and elastic modulus of the specimen, the peak strength and elastic modulus of the specimen under different bolt installation angles were estimated, and the results are shown in Figure 5. It can be seen from Figure 5a, when the bolt installation angle is 15°, 30°, 45°, 60°, and 75°, the peak strength of the specimen is 9.35 MPa, 9.37 MPa, 9.34 MPa, 8.38 MPa, and 7.36 MPa, respectively, compared to 4.51 MPa when the bolt installation angle is 90°. Thus, it has increased by 4.84 MPa, 4.86 MPa, 4.83 MPa, 3.87 MPa, and 2.85 MPa, respectively. As depicted in Figure 5b, when the bolt installation angle is 15°, 30°, 45°, 60°, and 75°, the elastic modulus of the specimen is 1.58 GPa, 1.50 GPa, 1.21 GPa, 0.82 GPa, and 0.66 GPa, respectively, compared to 0.51 GPa when the bolt installation angle is 90°. Thus, it has increased by 1.07 GPa, 0.99 GPa, 0.70 GPa, 0.31 GPa, and 0.15 GPa, respectively.
Based on the obtained data, when the bolt installation angle is 30°, the peak stress of the specimen is at its maximum, and with an increase in the bolt installation angle, the peak stress, on the whole, is first constant and then decreases. When the bolt installation angle is less than 45°, the peak stress of the specimen shows little change, and the peak stress curve is constant. In contrast, when the bolt installation angle is greater than 45°, the peak stress of the specimen changes significantly. The reduction rate of the peak curve is 0.111 MPa/°, which is mainly affected by the stress of the bolt and the contribution value of the exerted shear resistance, which are described in detail in Section 4.2. It can also be deduced from the data that with an increase in bolt installation angle, the elastic modulus of the specimen decreases nonlinearly. When the bolt installation angle is smaller than 30°, the elastic modulus curve decreases at a rate of 0.005 GPa/°; when the bolt installation angle increases from 30° to 60°, the elastic modulus curve decreases at a rate of 0.023 GPa/°; when the bolt installation angle increases from 60° to 90°, the elastic modulus curve decreases at a rate of 0.023 GPa/°. Thus, the reduction rate of the elastic modulus curve is 0.010 GPa/°. It can be concluded that when the bolt installation angle is from 30° to 60°, the elastic modulus of the specimen changes the fastest, followed by 60° to 90°, and the minimum change occurs when the bolt installation angle is from 15° to 30°.

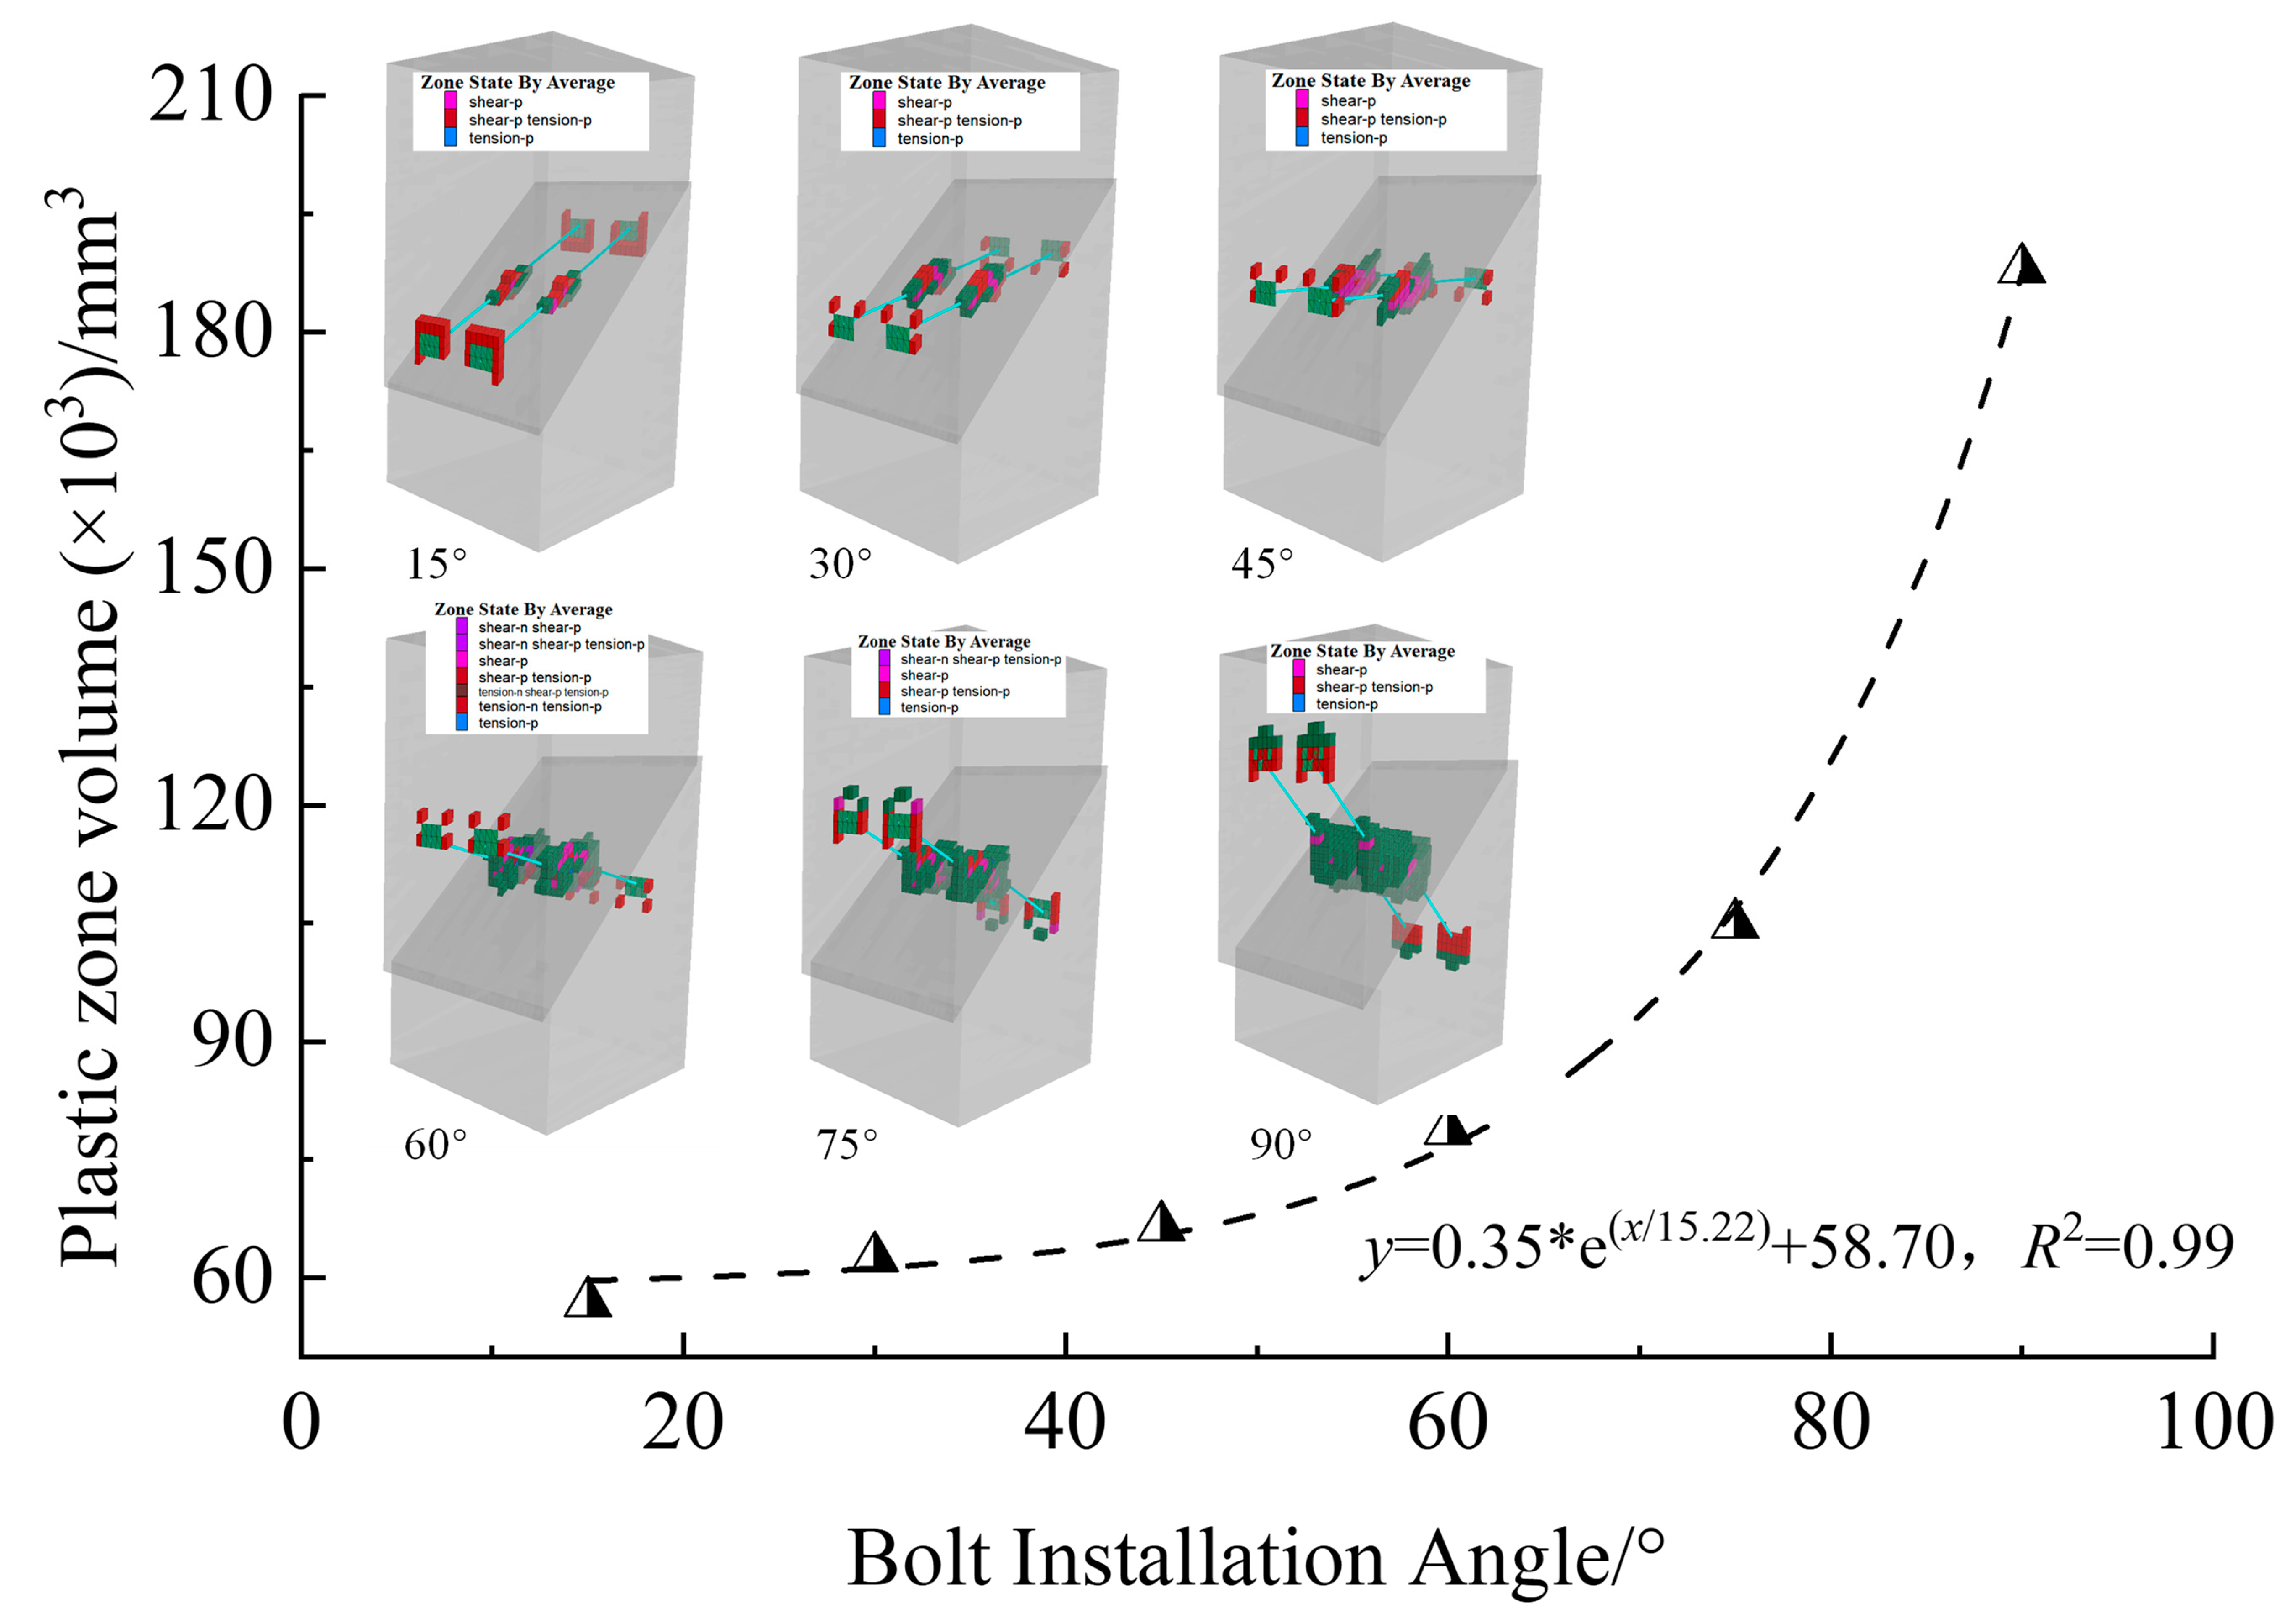
3.2. Analysis of Interaction Characteristics of Bolt-Surrounding Rock

To reveal the evolution law of the deformation, stress, and failure range of the surrounding rock during the loading process of the anchor structure, the deformation, stress, and plastic zone of the specimen were statistically analyzed by taking the model with a bolt installation angle of 45° as an example.
Figure 6 shows the horizontal displacement curve and the displacement field distribution of the specimen during the loading process. As can be seen from Figure 6, before the bolt breaks, that is, from point A to point C, the horizontal deformation curve shows a roughly linear growth trend. When the bolt is broken, that is, from point C to point D, the horizontal deformation of the specimen increases nonlinearly. This is because in the early stages of the test, the bearing energy of the specimen is strong under the anchoring action of the anchor rod, and its horizontal deformation is slow. When the anchor rod is broken, the anchoring action of the anchor rod is lost, and the accumulated elastic energy in the specimen is quickly released. Therefore, the horizontal deformation curve increases rapidly when the anchor rod is broken; then, the compressive strength of the specimen is provided only by the joint, and the compressive strength of the specimen decreases significantly. The slope of the horizontal deformation curve gradually becomes smaller. It can be concluded that the anchor rod has an obvious effect on the deformation control of the structural interview parts during the whole loading process.
Figure 7 presents the statistics of the horizontal stress distribution of the model with a bolt installation angle of 45° during the loading process, where a positive value of horizontal stress represents the tensile stress and a negative value represents the compressive stress. As shown in the figure, the interaction between the bolt and the specimen force is mainly distributed in two places. The first is the cross area between the bolt and the joint, which means that the deformation of the bolt is mainly concentrated near the joint. Therefore, the interaction between the bolt and the surrounding rock in this part is obvious, which has a great influence on the stress field at the joint of the specimen. The second are the two ends of the anchor rod, i.e., the nut gasket area is installed on the surface of the test piece. This is because the axial force of the anchor rod is mainly transmitted to the test piece through the nut gasket, where the bolt is subjected to a larger tension, and thus, the test piece there receives a larger compressive stress. In addition, the horizontal stress in most other areas is the tensile stress, and its value is also small, being about 1 MPa. Before the bolt breaks, the maximum horizontal stress on the specimen is mainly concentrated at both ends of the bolt, and with the progress of loading, the maximum horizontal stress on the specimen increases continuously; when the strain is 0.0032, 0.0064, and 0.0096, the maximum horizontal stress is 20.9 MPa, 42.8 MPa, and 60.1 MPa, respectively.
The horizontal stress was monitored at the two positions mentioned above during the loading process, and the results are shown in Figure 7. As can be seen from the figure, during the loading process, the horizontal stress curve follows a similar variation trend as the stress-strain curve of the anchored joint specimen, which is also divided into three sections that are related to the stress of the anchor rod. It can also be seen from the figure that, compared to both ends of the bolt, the horizontal stress at the intersection of the bolt and the joint is smaller, indicating that under this model, the role played by the axial force of the bolt is higher than that of the shear force of the bolt. The specimen mainly relies on the tensile strength of the anchor rod to enhance the shear strength of the joint.
To analyze the influence of bolt installation angle on the horizontal stress distribution of the rock specimen, the horizontal stress distribution cloud maps of the numerical models with different bolt installation angles at the same time step were generated, as shown in Figure 8. In the simulation, the horizontal stress of the rock specimen at the end of the bolt and at the intersection of the bolt and the joint was also calculated, and the horizontal stress-anchorage angle curve was drawn. As shown in the figure, as the bolt installation angle increases, the horizontal stress of the rock specimen at the end of the anchor rod decreases significantly, while the horizontal stress at the intersection of the anchor rod and the joint first decreases, then slowly rises, and gradually becomes stable. It can be seen that the horizontal stress distribution of the rock changes significantly with different installation angles of the bolt. With an increase in bolt installation angle, the stress concentration area at both ends of the bolt gradually disappears, and the horizontal stress gradually concentrates at the intersection of the bolt and the joint. This shows again that when the bolt installation angle gradually increases, the tensile force of the bolt gradually decreases, and the shear resistance of the bolt gradually plays a greater role.
Figure 9 presents the plastic division layout of the model with a bolt installation angle of 45° during loading. It can be seen from the figure that the plastic failure of the specimen is mainly concentrated at the intersection of the anchor rod and the joint, and the distribution range of the plastic zone is not large, which is consistent with the test results of other scholars [22] and further confirms the accuracy of the simulation results in this study. Before the breaking of the bolt, the range of the plastic zone continued to increase with the progress of loading, but after the breaking of the bolt, the interaction force between the bolt and the surrounding rock was almost negligible, so the range of the plastic zone no longer increased. It can also be seen from the figure that the plastic zone with the anchor rod as the axis is basically symmetrical; this is because the interaction between the anchor rod and surrounding rock will form a compressive stress zone and a tensile stress zone in the surrounding rock [22]. Accordingly, on the one hand, the surrounding rock will produce compression failure under the compression action of the anchor rod, and on the other hand, the surrounding rock will be separated from the anchor rod and produce tensile failure. Furthermore, two groups of basically symmetrical plastic zones appear near the junction between the bolt and the joint.
To analyze the variation law of the plastic zone of the rock specimen further quantitatively during the loading process, the variation law of the plastic zone volume during the loading process was calculated using the self-designed FISH function, and the results are shown in Figure 9. As can be seen from the figure, the volume of the plastic zone of the rock specimen increases continuously with the loading process before the anchor rod breaks. When the strain of the anchoring joint specimen is 0.0016, 0.0032, 0.0048, 0.0064, 0.008, 0.0096, and 0.0112, the plastic zone volume is 9.892 × 103 mm3, 18.075 × 103 mm3, 23.796 × 103 mm3, 31.554 × 103 mm3, 40.654 × 103 mm3, 57.667 × 103 mm3, and 65.796 × 103 mm3, respectively. The volume of the plastic zone of the rock specimen basically increases linearly. After the breaking of the anchor rod, the plastic zone volume of the anchored joint specimen is constant at 66.419 × 103 mm3, which indicates that no new plastic zone is generated in the anchored joint specimen after the breaking of the anchor rod.
To explore the failure distribution characteristics of the bolt and surrounding rock under different bolt installation angles, the plastic failure zone volume and distribution of rock specimens under different bolt installation angles were calculated, and the results are shown in Figure 10. It can be seen from the figure that the anchorage angle has a significant influence on the range of the plastic zone of the specimen. When the anchorage angle is 15°, 30°, 45°, 60°, 75°, and 90°, the plastic zone volume of the bolted joint is 56.825 × 103 mm3, 62.508 × 103 mm3, 66.419 × 103 mm3, 78.710 × 103 mm3, 104.85 × 103 mm3, and 187.992 × 103 mm3, respectively. It can be seen that with an increase in the bolt installation angle, the plastic zone volume of the specimen increases linearly in an exponential function relationship. When the bolt installation angle is lower than 45°, the plastic zone volume’s increase rate is small, at roughly 0.32 × 103 mm3/°; when the bolt installation angle is greater than 45°, the slope of the plastic zone volume curve increases rapidly, at approximately 3.64 × 103 mm3/°. This is because the greater the bolt installation angle, the greater the angle between the anchor rod and the joint, and the more obvious the “pin effect” played by the anchor rod in the process of joint slip [27], that is, the stronger the lateral resistance of the anchor rod to the deformation of the surrounding rock, the more obvious the squeezing effect of the surrounding rock by the anchor rod, and thus, the surrounding rock will suffer more damage. When the bolt installation angle is small, the “pin effect” of the bolt is small; thus, the extrusion effect between the bolt and the surrounding rock is not obvious, and the plastic zone of the surrounding rock is small. The appearance of the plastic zone reduces the bearing capacity of the surrounding rock, resulting in stress transfer; that is, the larger the range of the plastic zone, the weaker the bearing capacity of the specimen, which also explains the reason why the larger the bolt installation angle, the smaller the elastic modulus of the specimen.

4. Analysis of Anchoring Mechanisms

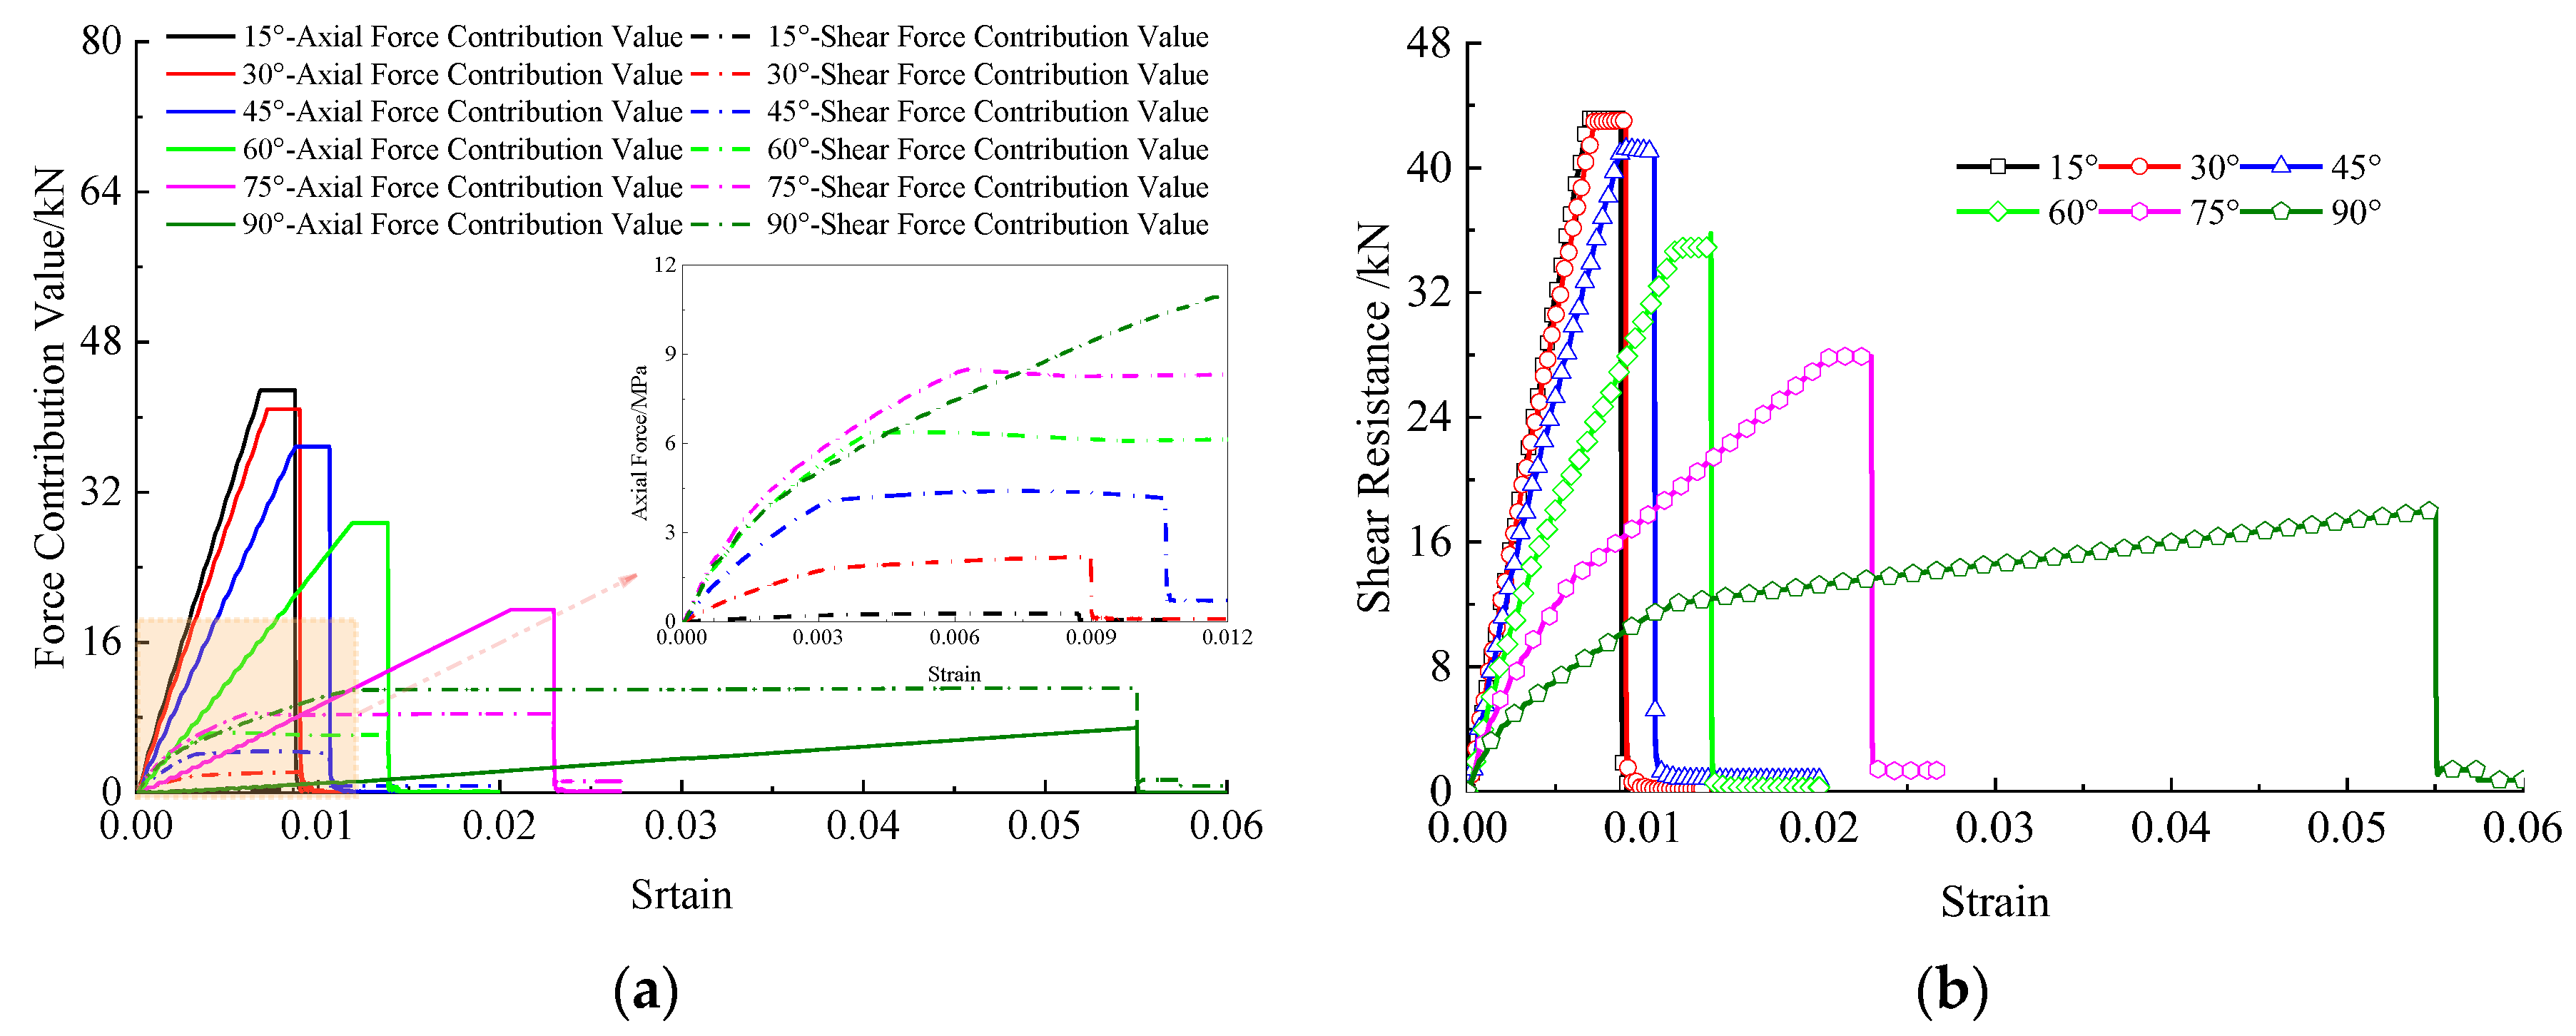
4.1. Shear Resistance Mechanism of the Bolt

After anchors were added to the structural parts, the mechanical analysis of joint slip control under the constraint of active anchor reinforcement was performed, and the results are shown in Figure 11a. It can be seen from the figure that “S” deformation occurs along the joint after the load is applied to the specimen. In the figure, the O point is the intersection point between the bolt and the joint plane; the shear force at point A is 0 N, and the angle and bending moment are the largest. The angle of point B is 0° [28]. The sliding of the joint causes the bolt to be acted on by the transverse shear force Q and the axial force N, and the extrusion between the rock mass and the bolt causes the bolt to be compressed, as shown on the left side of Figure 11a. The stress of a bolt under such circumstances has been analyzed in detail in the literature [8,10].
To analyze the shear action of the bolt, the stress of the anchoring specimen was decomposed, and the results are shown in Figure 11b. It can be seen from the figure that when the anchoring specimen is assumed to be balanced, the joint shear force should be balanced as follows:
F sin θ = N cos ( θ β ) + Q sin ( θ β ) + μ ( N sin ( θ β ) + F cos θ Q cos ( θ β ) )
In the formula, F is the vertical load; θ is the angle between the bolt and the joint, that is, the bolt installation angle; μ is the friction coefficient of the structural surface; and β is the angle between the straight line where the bolt is located after bending deformation and the straight line where it is located before deformation at the joint, which can be calculated using the following formula [12]:
β = 343 n σ c d 4 320 E I
In the formula, E is the elastic modulus of the bolt, and I is the moment of inertia of the bolt section.
Under the condition of no anchor, the shear resistance R1 of the joint is:
R 1 = μ F cos θ
Therefore, according to Equations (3) and (4), the shear resistance R2 exerted by the bolt is as follows:
R 2 = N ( cos ( θ β ) + μ sin ( θ β ) ) + Q ( sin ( θ β ) μ cos ( θ β ) )
According to Formula (5), when the material and diameter of the bolt are determined, the shear force and axial force of the bolt are the same under the same deformation size. When the interface parameters of the joint are determined, the friction coefficient of the joint is the same. Therefore, when the parameters of the bolt and the joint are determined, the bolt installation angle and the angle β are the main factors affecting the shear force of the bolt. According to Formula (3), the β value is mainly affected by the strength of the surrounding rock and the diameter of the bolt. In conclusion, when the parameters of the bolt and the joint are determined, the bolt installation angle is the main factor influencing the shear resistance of the bolt. Additionally, according to Formula 5, as the bolt installation angle increases, sin ( θ β ) increases and cos ( θ β ) decreases. On the whole, the role played by the shear force increases and the role played by the axial force decreases, which is consistent with the numerical simulation results.

4.2. Evolutionary Characteristics of Shear Resistance of Bolt

According to the results shown in Figure 11 and Formula (5), the shear resistance of the bolt is mainly composed of the axial force and shear force of the bolt, and the shear resistance of the bolt can be divided into the contribution value of the anchor shaft force and the contribution value of the anchor shear force, as determined by the following formulae:
T n = N ( cos ( θ β ) + μ sin ( θ β ) )
T s = Q ( sin ( θ β ) μ cos ( θ β ) )
Formulas (5)–(7) were written into the FISH language and integrated into the main program to monitor the contribution value of the anchor shaft force, the contribution value of the anchor shear force, and the shear resistance during the loading of the specimen. The monitoring results are shown in Figure 12. It can be seen from Figure 12a that with an increase in bolt installation angle, the maximum contribution value of the bolt axial force decreases. When the bolt installation angle increases from 15° to 90°, the maximum contribution value of the bolt axial force is 42.88 kN, 40.84 kN, 36.87 kN, 28.73 kN, 19.49 kN, and 7.02 kN, respectively. It can also be seen from Figure 12a that with an increase in bolt installation angle, the maximum contribution value of the bolt shear force increases. When the bolt installation angle increases from 15° to 90°, the maximum contribution value of the bolt shear force is 0.28 kN, 2.18 kN, 4.40 kN, 7.06 kN, 8.51 kN, and 11.14 kN, respectively. It can be seen from Figure 12b that the growth trend of the shear resistance curve of the bolt is consistent with the stress curve of the bolted joint. As the bolt installation angle increases, the shear resistance of the bolt decreases overall. When the bolt installation angle increases from 15° to 90°, the maximum contribution value of the shear force of the bolt is 43.16 kN, 43.02 kN, 41.23 kN, 35.79 kN, 27.90 kN, and 18.11 kN, respectively.
The maximum contribution value of the bolt axial force, the maximum contribution value of the bolt shear force, and the maximum shear resistance value of the bolt under different bolt installation angles were calculated. As shown in Figure 13, the contribution value of the shaft force of the bolt is significantly greater than that of the shear force, especially when the bolt installation angle is small. With an increase in the bolt installation angle, the contribution of the shaft force of the bolt decreases, while the contribution of the shear force of the bolt increases with an increase in the bolt installation angle. In other words, the smaller the bolt installation angle, the more the shaft force of the bolt can be mobilized, and, in contrast, the larger the bolt installation angle, the more the shear force of the bolt can be mobilized, which is consistent with the conclusion above. It can also be seen from the figure that with an increase in the bolt installation angle, the shear resistance of the bolt presents a nonlinear decreasing trend. The slope of the shear resistance curve is small when the bolt installation angle is less than 45°, while the slope of the shear resistance curve is large when the bolt installation angle is greater than 45°, and its changing trend is similar to that of the contribution value of the shaft force of the bolt. Therefore, this makes the main contribution to the shaft force of the anchor rod.

4.3. Discussion on Selecting the Optimal Bolt Installation Angle

In research on the anchorage mechanism of jointed rock masses, bolt installation angle is considered to be the main factor affecting the pinning effect of a bolt; thus, it is also the most concerning problem in experimental studies of jointed rock mass anchoring. To this end, a large number of scholars [27,29,30] have studied this problem and obtained the following understandings:
(1) The larger the bolt installation angle, the stronger the “pin effect” of the bolt and the greater the transverse shear resistance of the bolt; in contrast, the smaller the effect of the axial force of the bolt relative to the transverse resistance of the bolt, the smaller the contribution of the total resistance of the bolt. When the bolt installation angle is within the range of 30°~40°, the “pin effect” of the bolt can be ignored, and the bolt can be treated according to the tension rod. The simulation results presented in this paper are consistent with these conclusions, which also show the correctness of the simulation described in this paper.
(2) Selecting the optimal bolt installation angle has always been a concern for many scholars. Ge Xiurun et al. [31] concluded through experiments that the optimal bolt installation angle is 60°. Yang Buyun et al. [10] calculated the optimal bolt installation angle to be 105°, which may be related to the shear direction. Li Haibin et al. [9] estimated theoretically that the optimal bolt installation angle is 60~80°. Egger et al. [32] found that the bolt installation angle that contributes the most to the shear strength of the bolt is between 30° and 60°. Utilizing a double-shear sample, Liu Shuguang et al. [33] found that the strength of their specimen reached its maximum when the bolt installation angle was about 60°. Azuar et al. [34] concluded through their test that the shear strength of the anchoring specimen reached its maximum at 30°. The optimal bolt installation angle obtained in this study is below 45°. Based on the above analysis, it can be seen that the optimal bolt installation angle obtained by different scholars through theoretical calculations, tests, and numerical simulations is not the same, which is mainly caused by different rock strengths, bolt types, anchor materials, shear test loading modes of the bolted joint, etc. However, there is a general rule that the inclined bolt has a greater contribution to the shear strength of the joint plane. The shear displacement of the bolted joint is smaller before reaching its peak shear strength.
(3) The optimal bolt installation angle of the bolt is different under different conditions, so it needs to be analyzed according to the actual engineering and geological conditions. In future research, the influence of multiple factors on the shear strength of the anchorage structural parts should be considered, and a shear model of the anchorage joint based on multiple influential factors should be established to obtain the change law of the axial force and shear force of the bolt under different conditions. The optimal bolt installation angle of the bolt should be further analyzed from the perspective of the axial force of the bolt and the contribution value of the shear force to the joint.

5. Conclusions

(1) With an increase in bolt installation angle, the peak stress of the specimen as a whole is first constant and then decreases, and the elastic modulus of the specimen is nonlinear. It shows that the bearing capacity of the joint is higher when the bolt installation angle is lower than 45°.
(2) The interaction between the bolt and the specimen’s force is mainly distributed in two places: the first is at the intersection of the joint and the bolt, and the other is at the installation of the nut gaskets at both ends of the bolt. Therefore, these two parts of the specimen have larger forces and are the main bearing positions of the anchored joint specimen.
(3) With the progress of loading, the plastic zone volume of the anchored joint specimen increases linearly until the anchor rod breaks and the plastic zone volume no longer increases. With an increase in bolt installation angle, the plastic zone volume of the anchored joint specimen increases linearly with an exponential function.
(4) Through theoretical analysis, the calculation method of bolt shear resistance was obtained, and it was brought into the numerical simulation. The calculation results show that the contribution of the bolt axial force is greater than that of the bolt shear force when the bolt installation angle is small.
(5) With an increase in bolt installation angle, the contribution of the bolt axial force decreases nonlinearly, the contribution of the bolt shear force increases linearly, and the shear resistance decreases nonlinearly. That is, the optimal bolt installation angle is about 45°, but the optimal bolt installation angle also changes constantly under the influence of factors such as bolt type, rock strength, and external load.
Concluding remarks: In this study, numerical models of anchoring structural planes with different bolt installation angles were established based on the improved Pile element, and a series of uniaxial compression numerical tests were carried out to systematically analyze the effects of bolt installation angle on the bolt. The uniaxial compressive strength and deformation stress characteristics of the bolt under different bolt installation angles were estimated. The evolution of the shear resistance of the bolt under different bolt installation angles was calculated, and the mechanism underlying the influence of bolt installation angles on the improvement in the shear strength of the joint was revealed. On this basis, the problem of selecting the optimal installation angle of the bolt was discussed, which provides a theoretical foundation for establishing an optimal installation angle model of bolts in a complex environment. This study also provides a reference for engineers to determine the optimal installation angle of bolts in roadway support designs.

Author Contributions

Conceptualization, J.L. and R.W.; methodology, R.W., Y.J. and H.L.; software, R.W. and S.Z.; investigation, H.Z.; resources, J.L. and H.Z.; data curation, S.Z. and X.L.; writing—original draft preparation, J.L. and H.Z.; writing—review and editing, Y.J. and R.W.; visualization, X.L.; funding acquisition, H.L. All authors have read and agreed to the published version of the manuscript.

Funding

This research was funded by the National Natural Science Foundation of China (No. 52104093).

Institutional Review Board Statement

Not applicable.

Informed Consent Statement

Not applicable.

Data Availability Statement

The data associated with this research are available and can be obtained by contacting the corresponding author upon reasonable request.

Conflicts of Interest

The authors declare no conflict of interest.

References

  1. Kang, H.P.; Wang, J.H.; Lin, J. Study and applications of roadway support techniques for coal mines. J. China Coal Soc. 2010, 35, 1809–1814. [Google Scholar]
  2. Yang, R.S.; Li, Y.L.; Wang, M.S. Experimental study of shear mechanical properties of prestressed cable bolts. J. China Univ. Min. Technol. 2018, 47, 1166–1174. [Google Scholar]
  3. Wu, B.W. Research on Crack Evolution Mechanism and Large Deformation Control of Surrounding Rock in Soft Rock Roadway; China University of Mining and Technology: Xuzhou, China, 2021. [Google Scholar]
  4. Chen, N.; Zhang, X.B.; Jiang, Q.H. Shear behavior of rough rock joints reinforced by bolts. Int. J. Geomech. 2018, 18, 4017130. [Google Scholar] [CrossRef]
  5. Wang, G.; Zhang, Y.Z.; Jiang, Y.J. Shear behaviour and acoustic emission characteristics of bolted rock joints with different roughnesses. Rock Mech. Rock Eng. 2018, 51, 1885–1906. [Google Scholar] [CrossRef]
  6. Wang, G.H.; Wang, X.Y.; Yang, J.X. Mechanism analysis of pre-stressed bonded rock bolt controlling the deformation in joint surrounding rocks. J. China Univ. Min. Technol. 2021, 50, 60–68. [Google Scholar]
  7. Wang, L.Q.; Zhu, L.F.; Zheng, L.B. Shear test of bolted joint rock masses considering joint roughness. China J. Highw. Transp. 2021, 34, 38–47. [Google Scholar]
  8. Liu, Q.S.; Lei, G.F.; Peng, X. Shearing mechanical model and experimental verification of bolts in jointed rock mass. Chin. J. Geotech. Eng. 2018, 40, 794–801. [Google Scholar]
  9. Hai, B.L.; Han, H.T.; Wei, Y. The anchorage mechanism under the coplanar condition of shear direction and bolt inclination. Rock Soil Mech. 2020, S2, 1–11. [Google Scholar] [CrossRef]
  10. Yang, B.Y.; Xiao, M.; Luo, N. Research on mechanical characteristic of anchor bolt in process of shearing. J. Huazhong Univ. Sci. Technol. 2019, 47, 127–132. [Google Scholar]
  11. Cui, G.J.; Zhang, C.Q.; Chen, J.L. Effect of bolt inclination angle on shear behavior of bolted joints under CNL and CNS conditions. J. Cent. South Univ. 2020, 27, 937–950. [Google Scholar] [CrossRef]
  12. Hui, Z.; Rong, C.X.; Chuan, Q.Z. Experimental study of crack prevention effect of pre-stressed bolt anchoring. Chin. J. Rock Mech. Eng. 2015, 34, 2027–2037. [Google Scholar]
  13. Srivastava, L.P.; Singh, M. Empirical estimation of strength of jointed rocks traversed by rock bolts based on experimental observation. Eng. Geol. 2015, 197, 103–111. [Google Scholar] [CrossRef]
  14. Tong, B.Z.; Kang, K.C.; Ping, W. Study on slip failure of rock with weak plane and anchorage control mechanism. J. Min. Saf. Eng. 2017, 34, 1081–1087. [Google Scholar]
  15. Yang, S.Q.; Chen, M.; Tao, Y. Experimental study on anchorage mechanical behavior and surface cracking characteristics of a non-persistent jointed rock mass. Rock Mech. Rock Eng. 2021, 54, 1193–1221. [Google Scholar] [CrossRef]
  16. He, D.L.; Yang, W.J.; Lin, H. Numerical analysis for direct shear test of bolted joint based on particle flow code. J. Eng. Geol. 2019, 27, 302–310. [Google Scholar]
  17. Wu, D.Y.; Yu, L.Y.; Su, H.J. Experimental study and PFC3D simulation on crack propagation of fractured rock-like specimens with bolts under uniaxial compression. Rock Soil Mech. 2021, 42, 1681–1692. [Google Scholar]
  18. Chen, M. Study on the Mechanical Failure Behavior and Anchoring Control Effect of Non-Persistent Jointed Rock; China University of Mining and Technology: Xuzhou, China, 2019. [Google Scholar]
  19. Yang, Z.; Zhu, W.C.; Guan, K. Experimental and numerical study on the anchorage effect of bolted jointed rock masses. Front. Earth Sci. 2022, 10, 861912. [Google Scholar] [CrossRef]
  20. Guo, D.M.; Zuo, J.P.; Zhang, Y. Research on strength and failure mechanism of deep coal-rock combination bodies of different inclined angles. Rock Soil Mech. 2011, 32, 1333–1339. [Google Scholar]
  21. Mao, M.G.; Xue, G.S.; Xian, J.D. Experimental study on active anchorage mechanism of prestressed anchor cable in inclined bedding rock mas. Min. Res. Dev. 2022, 42, 89–94. [Google Scholar]
  22. Jiang, Y.J.; Zhang, S.H.; Luan, H.J. Numerical modelling of the performance of bolted rough joint subjected to shear load. Geomech. Geophys. Geo-Energy Geo-Resour. 2022, 8, 140. [Google Scholar] [CrossRef]
  23. Pellet, F.; Egger, P. Analytical model for the mechanical behaviour of bolted rock joints subjected to shearing. Rock Mech. Rock Eng. 1996, 29, 73–97. [Google Scholar] [CrossRef]
  24. Ma, S.; Zhao, Z.Y.; Peng, J. Analytical modeling of shear behaviors of rock bolts perpendicular to joints. Constr. Build. Mater. 2018, 175, 286–295. [Google Scholar] [CrossRef]
  25. Song, Y.B.; Yan, S.; Bai, J.B. Implementation of shear broken failure of bolts in FLAC3D and its application. Chin. J. Rock Mech. Eng. 2017, 36, 1899–1909. [Google Scholar]
  26. Wang, X.Q. Analysis for bearing characteristics and reinforcement effect of counter-pulled bolts and cables. J. China Coal Soc. 2019, 44, 430–438. [Google Scholar]
  27. Cai, H.L.; Yu, Z.L. Research progress in bolting mechanism and theories of fully grouted bolts in jointed rock masses. Chin. J. Rock Mech. Eng. 2018, 37, 1856–1872. [Google Scholar]
  28. Jalalifar, H.; Aziz, N. Analytical behaviour of bolt–joint intersection under lateral loading conditions. Rock Mech. Rock Eng. 2010, 43, 89–94. [Google Scholar] [CrossRef]
  29. Grasselli, G. 3D behaviour of bolted rock joints: Experimental and numerical study. Int. J. Rock Mech. Min. Sci. 2005, 42, 13–24. [Google Scholar] [CrossRef]
  30. Spang, K.; Egger, P. Action of fully-grouted bolts in jointed rock and factors of influence. Rock Mech. Rock Eng. 1990, 23, 201–229. [Google Scholar] [CrossRef]
  31. Xiu, R.G.; Jian, W.L. Study on the shear resistance behaviour of bolted rock Joints. Chin. J. Geotech. Eng. 1988, 10, 8–19. [Google Scholar]
  32. Egger, P.; Fernandez, H. A novel triaxial press-study of anchored jointed models. Proc. 5th Int. Congr. Rock Mech. 1983, 38, 171–175. [Google Scholar]
  33. Liu, S.G.; Huang, Z.X.; Zhang, H. Study of shearing tests of bolted frictionless joints with different bolt installation angles. Chin. J. Undergr. Space Eng. 2022, 18, 824–831. [Google Scholar] [CrossRef]
  34. Azuar, J.J. Stabilization of fissured rock masses by grouted steel bar. Rapp. De Rech. LPC 1977, 73, 56–83. [Google Scholar]
Figure 1. Large deformation of roadway surrounding rock in a deep coal mine [3].
Sustainability 15 12876 g001
Figure 2. Schematic diagram of anchorage structure with different bolt installation angles.
Sustainability 15 12876 g002
Figure 3. Numerical model diagram.
Sustainability 15 12876 g003
Figure 4. Stress-strain curves under different bolt installation angle conditions.
Sustainability 15 12876 g004
Figure 5. Bolt installation angle-peak strength and bolt installation angle-elastic modulus curves. (a) Peak Strength and (b) Elastic Modulus.
Sustainability 15 12876 g005
Figure 6. Horizontal displacement curve and displacement distribution during the loading process of the anchored rock/joint specimen.
Sustainability 15 12876 g006
Figure 7. Horizontal stress distribution of the anchored rock/joint specimen.
Sustainability 15 12876 g007
Figure 8. Horizontal stress distribution of the bolted rock/joint specimen under different angle conditions.
Sustainability 15 12876 g008
Figure 9. Distribution of the plastic zone of the anchored rock/joint specimen.
Sustainability 15 12876 g009
Figure 10. Distribution of the plastic zone of the anchored rock/joint specimen under different angle conditions.
Sustainability 15 12876 g010
Figure 11. Deformation of the anchored rock/joint specimen and the force on the bolt. (a) Schematic diagram of the deformation of the anchored rock/joint specimen. (b) Bolt force diagram.
Sustainability 15 12876 g011
Figure 12. Curves of bolt axial force contribution value, shear force contribution value, and shear resistance curve. (a) Bolt axial force and shear force contribution values. (b) Shear resistance curve.
Sustainability 15 12876 g012
Figure 13. Curve showing the bolt axial force contribution value, shear force contribution value, and shear resistance at different bolt installation angles.
Sustainability 15 12876 g013
Table 1. Physical and mechanical parameters for the rock, joint, bolt, and gasket.
ParameterUnitValueParameterUnitValue
RockDensityg/cm32500Tensile strengthMPa10
Young’s modulusGPa6.22CohesionMPa20
Dilatancy angleMPa0Friction angle°42
Shear modulusGPa3.52
BoltModulus of elasticityGPa200Tangential friction angle°45
Poisson’s ratio-0.2Normal bonding forceMN·m−1200
Moment of inertia10−11 m46.36Normal bond stiffnessGN·m−210
Polar moment of inertia10−11 m412.7Normal friction angle°0
Tangential bonding forceMN·m−12Breaking forcekN42
Tangential bond stiffnessMN·m−220Normal stiffnessGPa/m16
JointCohesionMPa0Shear stiffnessGPa/m16
Friction angle°21
GasketModulus of elasticityGPa150Normal stiffnessGN·m−30.8
Poisson’s ratio-0.2Shear stiffnessGN·m−30.8
Thicknessm0.01
Disclaimer/Publisher’s Note: The statements, opinions and data contained in all publications are solely those of the individual author(s) and contributor(s) and not of MDPI and/or the editor(s). MDPI and/or the editor(s) disclaim responsibility for any injury to people or property resulting from any ideas, methods, instructions or products referred to in the content.

