Article

Estimation of the Leaf Area Index of Winter Rapeseed Based on Hyperspectral and Machine Learning

1
Key Laboratory of Agricultural Soil and Water Engineering in Arid and Semiarid Areas of Ministry of Education, Northwest A&F University, Yangling 712100, China
2
Institute of Water-Saving Agriculture in Arid Areas of China, Northwest A&F University, Yangling 712100, China
3
College of Water Resources and Architectural Engineering, Northwest A & F University, Yangling, 712100, China
*
Author to whom correspondence should be addressed.
Sustainability 2023, 15(17), 12930; https://doi.org/10.3390/su151712930
Submission received: 6 July 2023 / Revised: 18 August 2023 / Accepted: 23 August 2023 / Published: 27 August 2023

Abstract

:
Leaf area index (LAI) is essential for evaluating crop growth and development. Destructive manual measurement methods mainly achieve traditional crop LAI acquisition. Due to the advantages of being fast and non-destructive, spectroscopy technology provides a feasible method for obtaining crop LAI. In order to achieve efficient acquisition of winter oilseed rape LAI, this study collected hyperspectral data and LAI data at the full-bloom stage of winter oilseed rape. It calculated the spectral indexes related to the LAI of the original spectrum and the first-order differential spectrum, respectively. The index with the highest correlation with the LAI of winter oilseed rape at the flowering stage was selected as the optimal spectral index for input. Subsequently, three machine learning methods, Back Propagation Neural Network (BPNN), Support Vector Machine (SVM), and Random Forest (RF), were used to construct the LAI model of winter oilseed rape, and the model was tested. The results show that the correlation coefficient between the spectral index calculated by the first-order differential processing of the original spectral data and the LAI of winter rapeseed is significantly improved compared with the original data. Among them, the spectral index NDVI with the best correlation coefficient with LAI can be obtained under the first-order differential: the correlation coefficient is 0.734, and the wavelength combination is 716 nm and 724 nm. At the same time, we found that when the input variables are the same, the RF model has higher estimation accuracy than the other models. The best estimation accuracy is obtained when the input variable is the first-order differential spectral index. The R2 of the model validation set is 0.810, RMSE is 0.455 cm2/cm2, MRE is 10.465%, and the model accuracy is high. The results of this study can provide a theoretical basis for crop monitoring based on spectral technology and provide a theoretical basis for crop growth.

1. Introduction

Oilseed rape is one of the most significant economic crops in China and ranks among the four major oil crops worldwide. It boasts extensive cultivation, remarkable growth adaptability, versatile applications, promising development prospects, and substantial economic value [1]. Winter oilseed rape seeds can be extracted to produce biodiesel, a renewable energy source that offers advantages over conventional fossil fuels by reducing greenhouse gas emissions and diminishing reliance on finite energy resources [2]. Leaf area index (LAI) denotes the ratio of multiple plant leaves to land area per unit of land area. This crucial physiological parameter reflects vegetation density, canopy structure and function, biological characteristics, and ecological environmental factors [3]. Its value correlates closely with biomass and crop yield, rendering it a vital indicator for assessing the growth status of crop populations. Nevertheless, traditional field experiments to measure rape LAI are time-consuming, cause significant plant damage, and yield imprecise measurements [4]. Consequently, researchers have shifted their focus towards efficient, accurate, and non-destructive methods to obtain vegetation parameters like rape LAI within this domain.
In recent years, remote sensing technology has gained widespread usage in real-time monitoring of modern agriculture, owing to its dynamic and macroscopic advantages. Numerous scholars have conducted studies using hyperspectral remote sensing technology to determine vegetation physiological parameters [5,6,7]. For instance, Qi et al. [8] employed hyperspectral remote sensing to measure the hyperspectral data of peanut leaves under different planting densities. They constructed a vegetation index based on leaf spectra by combining various bands across the full spectral range (350–1830 nm). By quantifying the correlation with chlorophyll content, they selected the optimal vegetation index reflecting the SPAD value of peanut leaves and established a regression-based SPAD estimation model. The study findings revealed that excessive or inadequate plant densities resulted in decreased chlorophyll content in peanut leaves, reaching its maximum under appropriate plant density. Moreover, the spectral reflectance of peanut leaves exhibited significant variations across different chlorophyll content levels. Similarly, Li et al. [9] utilized corn canopy spectral data in conjunction with measured plant height and biomass data to analyze the relationship between biomass and spectral reflectance. They identified sensitive bands and constructed a hyperspectral vegetation index. Regression analyses employing Partial Least Squares (PLS), Support Vector Machine (SVM), and Random Forest (RF) were conducted to establish a biomass inversion model for maize, and the model’s accuracy was validated. The results demonstrated that integrating plant height data into biomass inversion enhanced the model’s accuracy to some extent, thereby improving the effectiveness of crop biomass estimation.
In previous studies, spectral indices have been calculated using fixed wavelengths to estimate crop LAI. The spectral indices with better correlation to LAI were selected for modeling [10,11]. However, when studying crops, the physiological information of the subjects may vary greatly due to different growing environments, even if the varieties are the same. This leads to variations in spectral data. Using fixed wavelengths to calculate spectral data under such circumstances results in underutilization of the spectral information and can affect the accuracy of the resulting estimation model. Recently, researchers have employed the correlation matrix method to further process and model spectral data [12,13]. However, these studies have mainly focused on soil and environmental disciplines [14] and other crops, less on winter oilseed rape. Xiang et al. [15] studied the LAI of soybean at the flowering stage under different nitrogen application levels and film mulching treatments. The original hyperspectral reflectance data of soybean at the flowering stage were processed by 0–2 order differential transformation, and the index with the highest correlation with the LAI of soybean at the flowering stage was selected as the optimal spectral index for input. Three machine learning methods: SVM, RF, and the BP neural network optimized by genetic algorithm (GA-BP), were used to construct soybean LAI prediction models. The conclusions are as follows: 1.5-order differential and RF methods are the optimal differential order and the optimal model construction method in this study, respectively. The R2 of the optimal soybean LAI estimation model modeling set and validation set are: 0.890 and 0.880, RMSE are: 0.348 cm2/cm2 and 0.320 cm2/cm2, NRMSE are: 11.278% and 10.354%, MRE are: 9.795% and 9.572%, respectively. Therefore, this study focused on winter oilseed rape in Northwestern China. Leaf canopy hyperspectral data were collected during the flowering stage. Seven spectral indices (14 in total, including order 0 and order 1) were calculated based on the full-band hyperspectral reflectance. The RF model was applied to estimate the LAI of winter oilseed rape during flowering. The full-band spectral reflectance was used as the input, and the LAI value of winter oilseed rape was used as the output. The model accuracy of SVM and the back-propagation neural network (BPNN) were compared with RF to establish a more accurate LAI estimation model for winter oilseed rape. The results of this study provide a valuable reference for estimating LAI in winter oilseed rape.

2. Materials and Methods

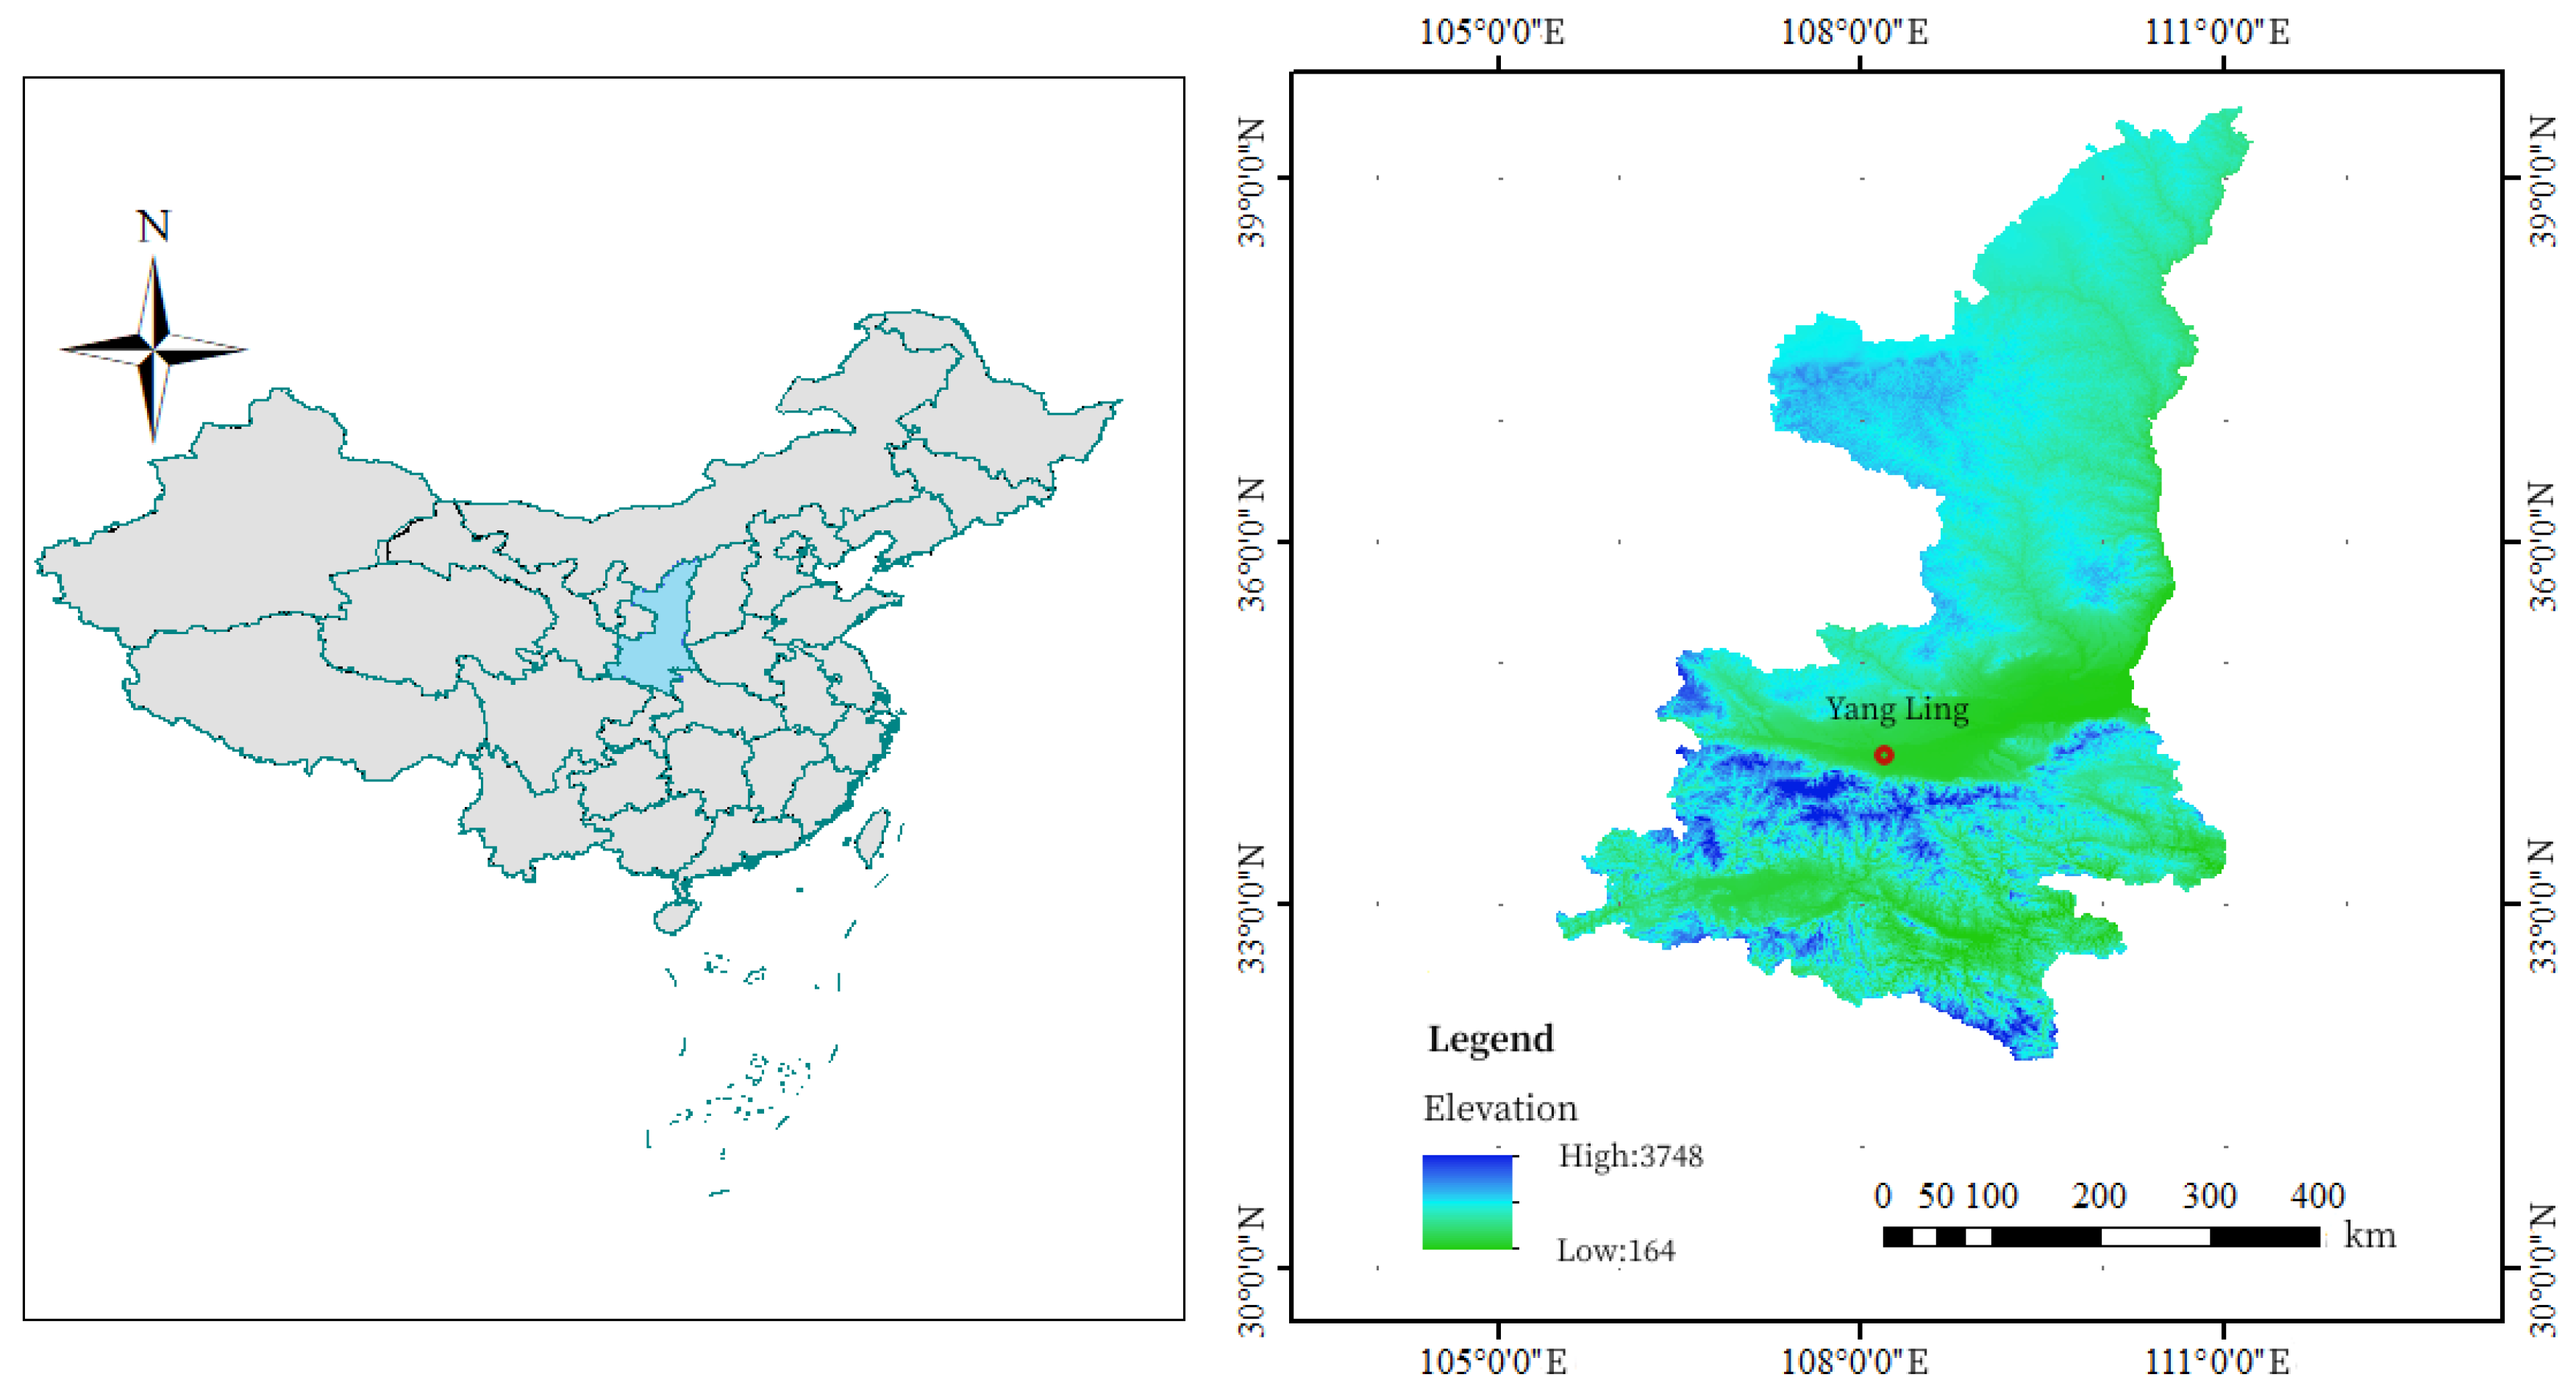
2.1. Overview of the Test Area

The experiment was carried out at the Water-saving Irrigation Experimental Station of Water-saving Agriculture Research Institute of Northwest A & F University (34°14′ N, 108°10′ E, altitude 521 m), the location of the experimental area is shown in Figure 1. Shaanxi Province is an important production base of rapeseed, the experimental area is located in the Guanzhong Plain irrigation area, it is a warm temperate monsoon semi-humid climate. This specific climatic conditions have an important impact on the growth and yield of winter rapeseed. The experimental station is equipped with an irrigation system and meteorological monitoring station, which provides the necessary conditions for the experiment. The winter oilseed rape variety ‘Shanyou 18’ cultivated by Northwest A & F University was sown on 3 October 2021.

2.2. Data Acquisition and Processing

On 8 April, 11 April, 13 April, and 15 April 2022, ten oilseed rape plants were randomly chosen in each plot to measure LAI. The measurements included the leaf length L_ij and width B_ij of all selected leaves, which were determined using a tape measure. The LAI value for each plot was represented by the average of the measurements. A total of 64 data sets were obtained, and the LAI was calculated using the following equation [16]:
LAI = α · ρ i = 1 m i = 1 m ( L i j · B i j ) m
where: α is the conversion factor, taken as 1.0; ρ denotes the planting density (plants/m2); n is the total number of leaves (pieces) of the jth plant; m is the number of plants tested. The final data obtained are shown in Table 1.

2.3. Hyperspectral Data Acquisition and Processing

The canopy spectral reflectance of winter oilseed rape was measured using the ASD Field-Spec 3 back-mounted field hyperspectral spectrometer (Analytical Spectral Devices, Inc, St, Boulder, CO, USA). A detailed description of the instrument and its specific usage method can be found in the literature [17]. The instrument has a wavelength range of 350 to 1830 nm, and measurements were conducted using a 1.5 m long fiber. For each sample, 10 spectral curves were collected, and the average value was calculated to represent the spectral reflectance of the sample [18]. During the measurements, the optical fiber probe was positioned in a vertical downward orientation, approximately 1 m above the canopy. Data collection took place between 10:00 and 14:00, resulting in a total of 64 data sets. To mitigate (or eliminate) the impact of background noise, baseline drift, stray light, and other irrelevant information on the hyperspectral reflectance curve, this study employed Savitzky–Golay convolution smoothing as a preprocessing technique for the spectral data [19]. A quadratic polynomial was used, and a window size of 9 points was applied for function fitting and filtering to remove noise.

2.4. Selection and Extraction of Vegetation Index

For healthy crops, their leaves exhibit three main characteristics in terms of physiological and spectral properties: (1) strong absorption of various photosensitive pigments such as chlorophyll in the visible light range (400–750 nm) resulting in low reflectivity; (2) multiple scattering at the cell-air interface inside the leaves leading to high reflectivity in the near-infrared range (750–1300 nm); and (3) absorption of water causing low reflectivity in the short-wave infrared range (1300–2500 nm) [20]. Vegetation spectral indices can serve as indicators of the plants’ physiological status. Therefore, based on the existing literature, seven vegetation spectral indices closely related to vegetation were selected, including the ratio index (RI), triangular vegetation index (TVI), modified simple ratio (mSR), modified normalized difference index (mNDI), difference index (DI), normalized difference vegetation index (NDVI), and the soil-adjusted vegetation index (SAVI). The specific calculation formulas for each index are presented in Table 2.

2.5. Modeling Technique

Of the aforementioned spectral indices, the five with the highest correlation to LAI in the 0-order and 1-order were selected as input variables for the model. Subsequently, three machine learning models, namely BPNN, SVM, and RF, were employed to model the LAI of winter rapeseed [23]. BPNN is a type of artificial neural network available in the Neural Network Toolbox of MATLAB, which is commonly used for solving classification, regression, and pattern recognition problems. Utilizing BPNN in MATLAB requires the utilization of the Neural Network Toolbox, which offers various functions and tools for facilitating neural network construction, training, testing, and evaluation. The transfer function of the hidden layer in BPNN is set to TANSIG, and the Levenberg–Marquardt (Train-LM) algorithm, based on numerical optimization theory, is employed as the network training function. After several rounds of training, the number of neurons in the middle layer was determined to be 15. Typically, the repetitive oscillation is halted if the cost function becomes less than a very small positive number or the iteration no longer decreases. At this point, the training of the BP network and the establishment of the mapping relationship between input and output are completed [24]. RF, on the other hand, is an ensemble learning method composed of multiple decision trees. Each decision tree is trained based on random sampling of training data and randomly selected feature subsets. In constructing the RF model, through parameter optimization and multiple training iterations, the final number of decision trees for the RF model was determined to be 500 [25]. SVM, as a principle, aims to map linearly separable or approximately linearly separable data sets into a high-dimensional space and utilizes hyperplanes or nonlinear kernel functions for segmentation to achieve classification or regression tasks. In this study, the SVM model’s penalty coefficients C and γ were set to 20 and 0.02, respectively [26].

2.6. Data Processing and Model Evaluation

A total of 64 data sets were obtained in this experiment. After eliminating one set of abnormal data, 2/3 of the data (42 groups) were randomly selected as the modeling dataset, while the remaining 1/3 of the data (21 groups) were used as the validation dataset. The aforementioned data were inputted into MATLAB for analysis, and different codes were used to construct SVM and RF models. BPNN, available in the Neural Network Toolbox of MATLAB, was also employed. In this study, three evaluation indices, namely R2, RMSE, and MRE, were used to assess the accuracy of each model [27]. A higher R2 value (closer to 1) and lower RMSE and MRE values indicate better prediction accuracy of the models [28].
The calculation formula of accuracy evaluation index is as follows [25]:
R 2 = i = 1 n y i ^ y ¯ 2 i = 1 n y i y ¯ 2
R M S E = i = 1 n y i y ¯ 2 n
M R E = 1 n i = 1 n y i ^ y i y i × 100 %

3. Results

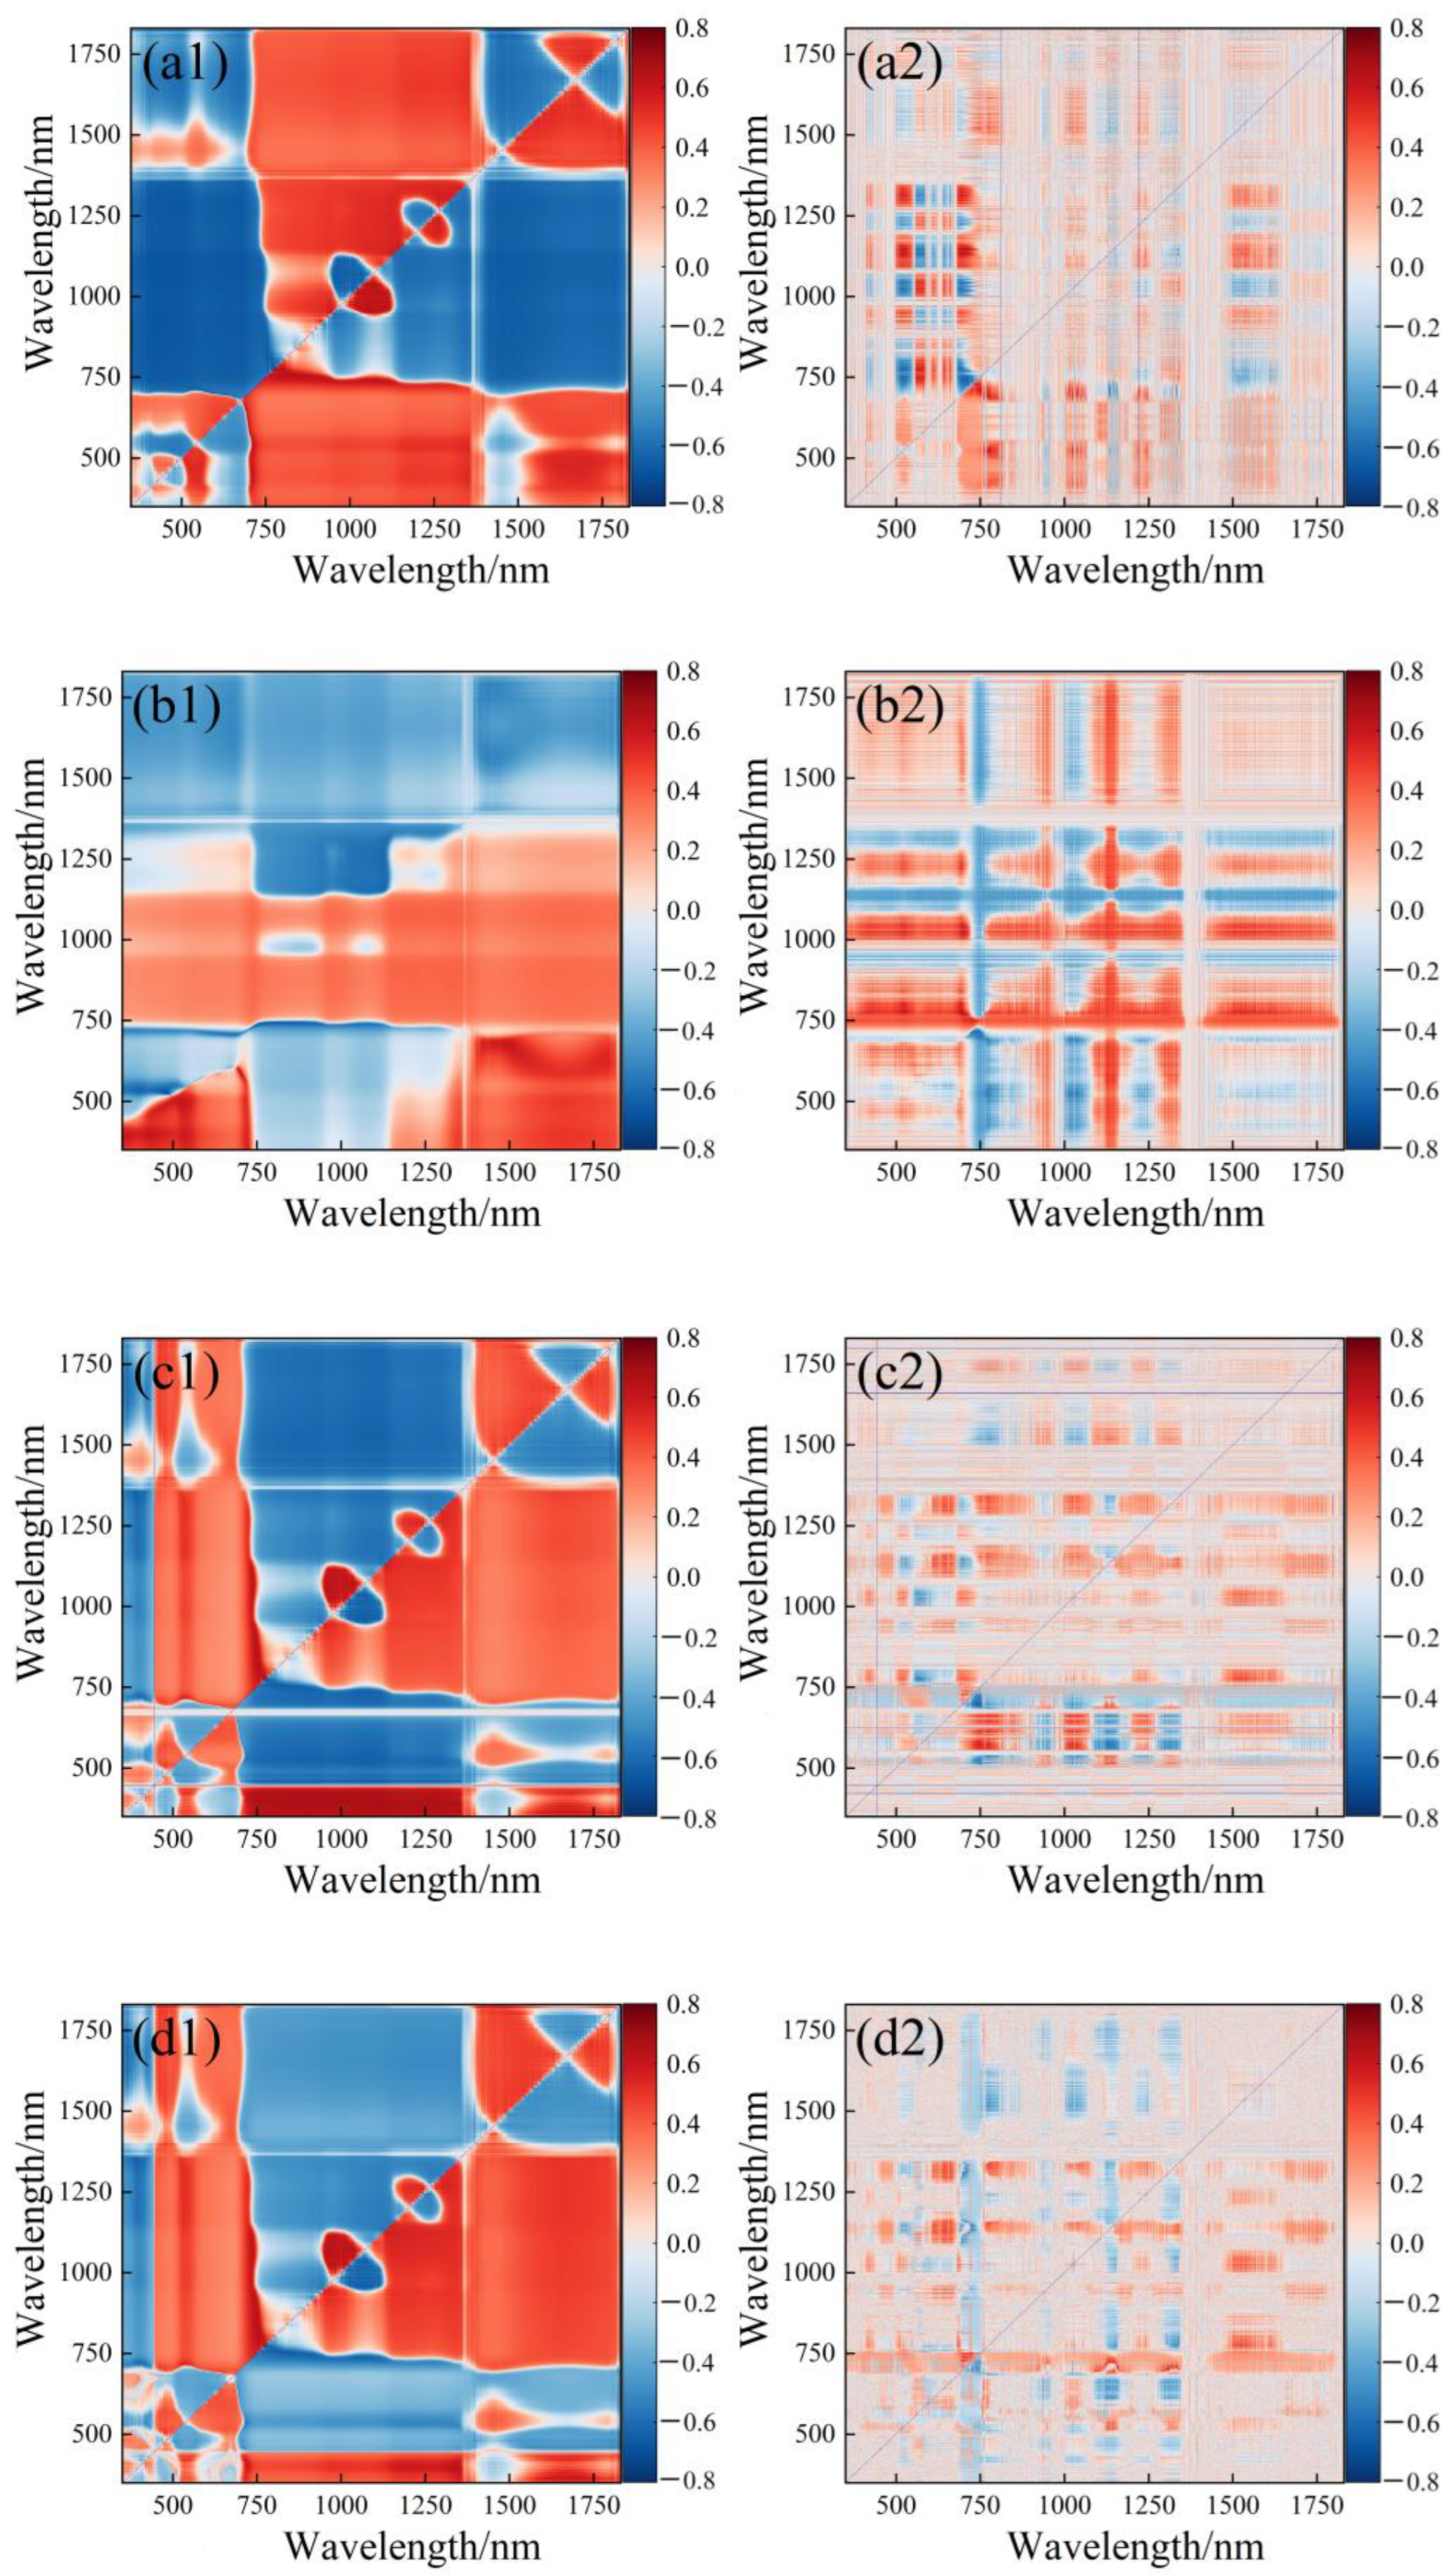
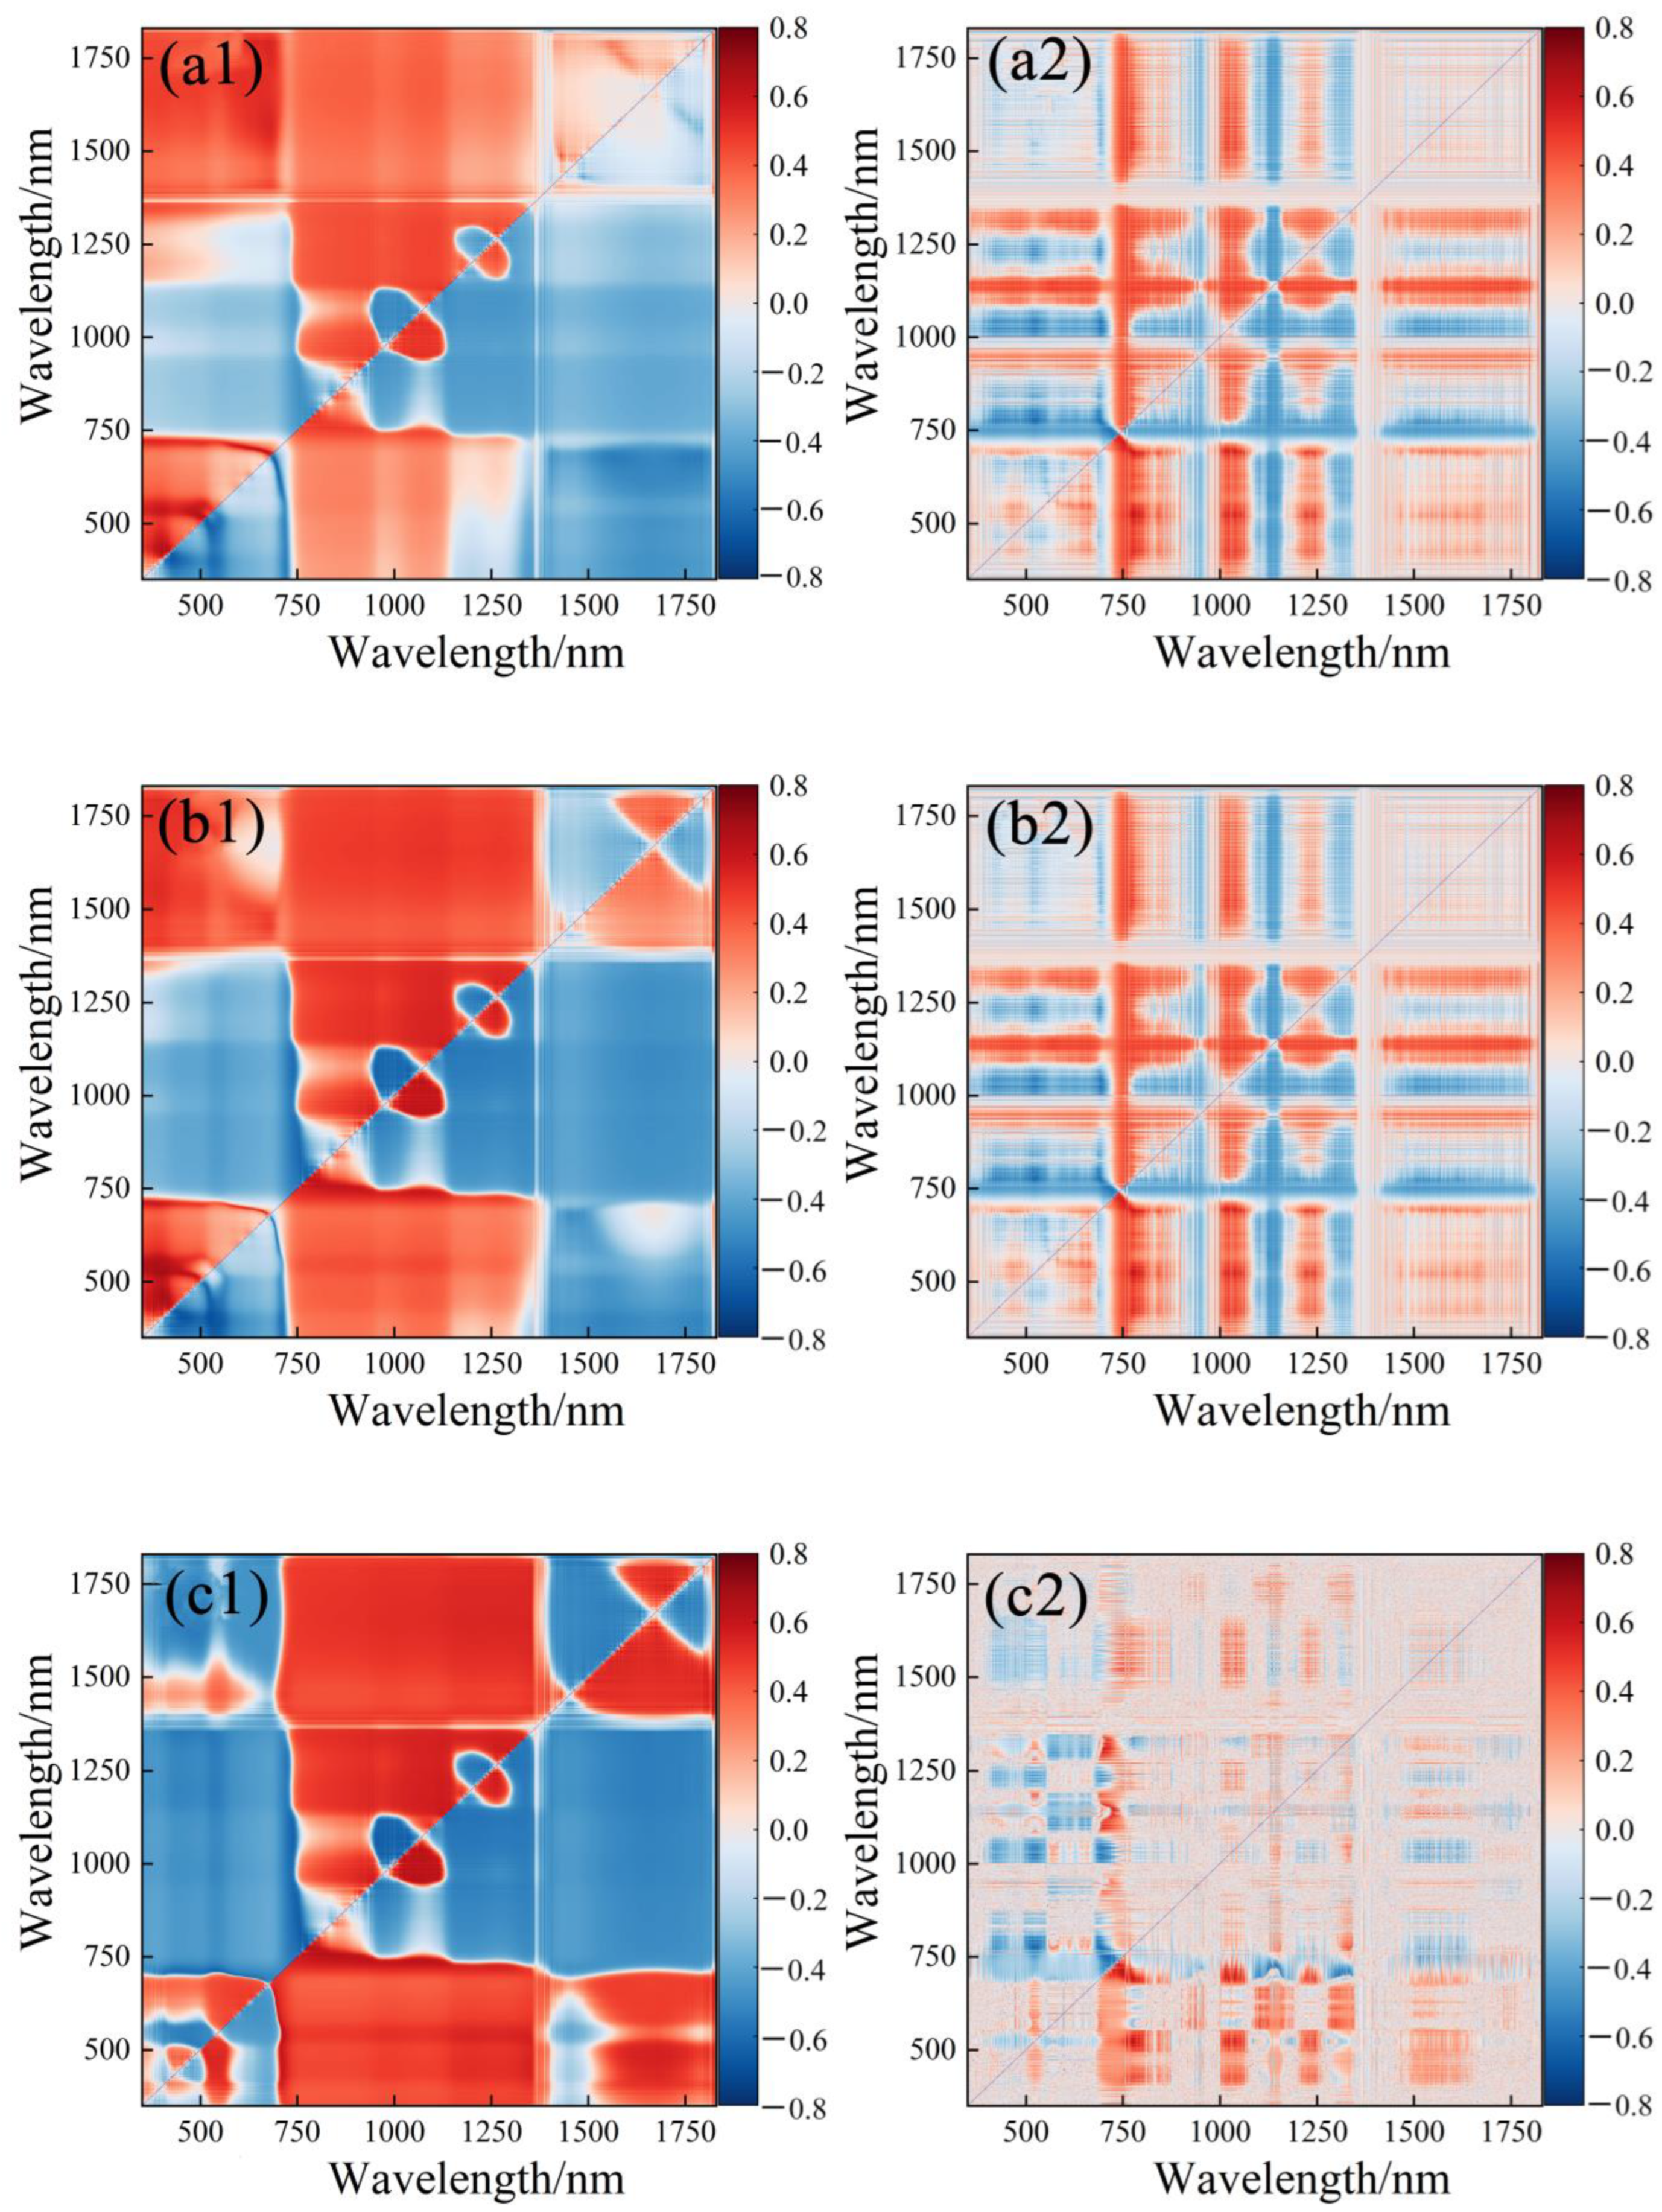
3.1. Spectral Index Construction and Optimal Spectral Index Band Combination Extraction

Firstly, the correlation matrix diagram was constructed for 14 spectral indices. As depicted in Figure 2 and Figure 3, the color gradient from blue to red represents the strength of the correlation between each spectral index and the winter rapeseed LAI, ranging from a highly negative correlation to a highly positive correlation [27]. Subsequently, the hyperspectral reflectance was computed after applying 0-order and 1-order differential processing on a band-by-band basis using spectral indices. The correlation matrix method was then employed to assess the relationship with winter rapeseed LAI. The two wavelengths exhibiting the highest coefficients were selected to construct spectral indices of varying orders. The correlations between the 0th and 1st order indices of winter rapeseed LAI exceeded 0.310 (p < 0.01), indicating a highly significant relationship. This suggests that all seven selected spectral indices can be utilized to accurately predict the LAI of winter rapeseed during its flowering stage. Among these indices, the highest correlation coefficient with winter rapeseed LAI was observed for NDVI, with a coefficient value of 0.734 and wavelength combination coordinates of (716, 724) under first-order differentiation. The order of correlation coefficients for each spectral index with winter rapeseed LAI, from highest to lowest, was as follows: NDVI > RI > TVI > DI > SAVI > mNDI > mSR. From the seven spectral indices, the top five with the highest correlations—NDVI, RI, TVI, DI, and SAVI—were selected as the optimal band combinations. The corresponding wavelength bands for these indices were (716, 724), (716, 724), (755, 725), (717, 753), and (717, 753). The band combinations for the 0th-order spectral index are presented in Table 3.

3.2. Construction and Comparison of LAI Prediction Models for Winter Oilseed Rape

Each order’s optimal spectral index combination was used as the independent variable, and the LAI of winter rapeseed was used as the response variable. SVM, RF, and BPNN were selected to construct the LAI estimation model of winter rapeseed at multiple flowering stages. The model’s accuracy was comprehensively evaluated from three indicators: R2, RMSE, and MRE. The prediction results of different modeling methods are as Table 4.
Table 4 presents the prediction results of different models for winter oilseed rape LAI estimation on the modeling and validation sets under 0th and 1st order differential changes. It can be observed that under the 1st order differential, the R2 values of all three models are higher than those under the 0th order, and the validation set R2 values of all three models are above 0.6, which indicates that all three models exhibit good linear fitting results. Among them, under the 1st order differential, the RF model achieves a high validation set R2 of 0.810. This is significantly higher compared to the BPNN and SVM models, which have an increment of 0.171 and 0.180 in R2, respectively. The RF model under the 1st order differential also demonstrates a lower validation set RMSE of 0.455 cm2/cm2, reducing by 24.0% and 31.3% compared to BPNN and SVM, respectively. Additionally, the MRE of the RF model under the 1st order differential is 10.465%, which is lower by 30.5% and 33.9% compared to BPNN and SVM, respectively. When considering the same modeling method, the order of accuracy for winter oilseed rape LAI estimation among the three models is as follows: RF > BPNN > SVM. Therefore, the 1st order differential processing combined with the RF method are identified as the optimal fractional differentiation and modeling approach in this study. The LAI estimation model for winter oilseed rape constructed using this approach achieves a training set R2 of 0.705, RMSE of 0.725 cm2/cm2, and MRE of 14.562%. Moreover, the validation set R2 is 0.810, with an RMSE of 0.455 cm2/cm2 and an MRE of 10.465%. The evaluation results of the model are shown in Figure 4.

4. Discussion

In calculating and selecting the spectral index, all the combinations of wavelength indexes are in the red edge range, and the optimal wavelength position is consistent with the previous research results [29]. The red edge refers to the point where the reflectance of green plants increases fastest between 670 and 760 nm. [30] Studies have shown that the absorption spectrum curve of chlorophyll in leaves has a red edge, while the absorption spectrum curve of water and carotenoids has no red edge. The change and characteristic information of chlorophyll content can be reflected on the red edge to the greatest extent because the red edge has a high sensitivity to chlorophyll content [31]. This study found that LAI is closely related to chlorophyll in leaves because the growth of leaves requires chlorophyll to participate in photosynthesis, which is the root cause of LAI growth. When selecting the best spectral index combination for modeling, it is found that the first-order differential spectral index has a high predictive ability for LAI. When analyzing the input characteristics of the model, it can be observed that the first-order differential spectral index is closely related to LAI. While filtering the background noise, the differential treatment also retains the red edge band’s ability to describe the plant’s physical and chemical parameters [32]. Therefore, the band combinations selected under each order differential treatment in this study that have a very significant correlation with the LAI of winter oilseed rape are mostly distributed in the range of 670–760 nm, consistent with previous studies’ results [33]. The first-order differential spectral index and LAI correlate better than the original one. It is because the model based on the first-order differential spectral index is more adaptable to unknown samples, which can improve the response and information mining ability of the spectrum to LAI, enhance the correlation between LAI and spectrum, and better characterize the growth status of winter rapeseed. It may be due to the differential treatment of canopy reflectance spectral data, which can reduce the influence of baseline drift and background noise and enhance the spectral characteristics of physiological and biochemical parameters in winter rapeseed. It is worth noting that baseline drift and noise interference are mostly non-stationary signals. Differential and spectral variable selection can effectively eliminate background noise [34], thereby improving the correlation between spectrum and LAI.
Among the three modeling methods employed in this study, the RF-based evaluation model for winter rapeseed LAI demonstrated superior accuracy, indicating RF’s advantage over other models in estimating winter rapeseed LAI [35]. These findings align with previous estimations of crop LAI. Research has shown that different modeling methods have a significant impact on the prediction accuracy of the estimation model [36]. By comparing the prediction accuracy of SVM and RF models, this study found that the RF model outperformed SVM. The low accuracy of the SVM model can be attributed to limitations in kernel function and related parameter selection [37]. Additionally, the performance of the BPNN model could potentially be improved, which may be attributed to the small sample size or improper selection of activation function, leading to the poor generalization ability of the model. In summary, optimizing kernel functions and parameter settings, increasing the number of training samples, and selecting appropriate activation functions are key factors for enhancing the accuracy of SVM and BPNN models in future research.
In this study, the utilization of hyperspectral data for studying the LAI model of winter rapeseed has yielded promising results. However, it is important to note that there are certain limitations to the applicability of the model because only LAI hyperspectral data from a single growth stage, specifically the flowering stage, were used as the input variables for model construction. To address this limitation, it is necessary to incorporate hyperspectral data from different growth stages as input variables in future research. Additionally, exploring alternative machine learning methods could be beneficial in testing and improving the model, aiming to achieve a balance between estimation accuracy and universality. Such exploration can provide valuable insights into predicting the growth status of winter rapeseed across multiple growth stages, further contributing to effective solutions for promoting sustainable energy development.

5. Conclusions

In this experiment, the research focused on the LAI of winter rapeseed specifically at the flowering stage. The LAI values and canopy hyperspectral reflectance data were measured for winter rapeseed during this growth phase. The hyperspectral reflectance data were processed through 0-order and 1-order differential transformations, and band-by-band spectral indices were calculated accordingly. The correlation matrix method was utilized to determine the optimal wavelengths for constructing spectral indices of different orders. Finally, based on these optimal spectral indices and three machine learning models, namely RF, SVM, and BPNN, LAI prediction models for winter rapeseed at the flowering stage were constructed. The following conclusions were drawn from the study:
(1) Compared with the original hyperspectral reflectance data, the correlation between the optimal spectral index extracted after the first-order differential transformation and winter rapeseed was significantly improved. The average correlation coefficient between each spectral index and winter rapeseed LAI under the first-order treatment was 1.5% higher than that of the original spectral index. Among which, NDVI (716&724) showed the highest correlation, with a correlation coefficient of 0.734.
(2) When comparing the same modeling method with different input variables, the accuracy of the winter rapeseed LAI prediction model is higher for the first-order differential treatment compared to the original order. On the other hand, when keeping the input variables the same and changing the modeling method, the accuracy of the winter rapeseed LAI prediction model follows the order of RF > BPNN > SVM. By conducting a comprehensive comparison and evaluation of the differential transformation results and model evaluation indicators, it can be concluded that the first-order differential treatment and RF method are the optimal differential treatment and optimal model construction methods in this study, respectively. The R2 of the optimal winter rapeseed LAI estimation model was 0.595 and 0.810, the RMSE was 0.725 cm2/cm2 and 0.455 cm2/cm2, and the MRE was 14.562% and 10.465%, respectively.

Author Contributions

Data curation, W.Z.; investigation, W.Z.; methodology, W.Z. and Y.P.; project administration, W.Z. and Y.Z.; resources, Y.X. and F.Z.; software, W.X. and Z.L.; supervision, W.Z. and J.F.; visualization, W.Z. and Z.T.; writing—original draft, W.Z.; writing—review and editing, W.Z. and Z.L. All authors have read and agreed to the published version of the manuscript.

Funding

This study was supported by the National Natural Science Foundation of China (No. 52179045), National Innovative Experimental Project for College Students (Inversion study of leaf area index of winter oilseed rape based on hyperspectral and machine learning) and National Innovative Experimental Project for College Students (S202310712509).

Data Availability Statement

Not applicable.

Conflicts of Interest

The authors declare no conflict of interest.

References

  1. Li, J.; Zhou, Y.; Gu, H.; Lu, Z.; Cong, R.; Li, X.; Ren, T.; Lu, J. Synergistic effect of nitrogen and potassium on seed yield and nitrogen use efficiency in winter oilseed rape (Brassica napus L.). Eur. J. Agron. 2023, 148, 126875. [Google Scholar] [CrossRef]
  2. Stephenson, A.; Dennis, J.; Scott, S. Improving the sustainability of the production of biodiesel from oilseed rape in the UK. Process Saf. Environ. Prot. 2008, 86, 427–440. [Google Scholar] [CrossRef]
  3. Lu, X.; Wang, X.; Zhang, X.; Wang, J.; Yang, Z. Winter wheat leaf area index inversion by the genetic algorithms neural network model based on SAR data. Int. J. Digit. Earth 2022, 15, 362–380. [Google Scholar] [CrossRef]
  4. Casadesús, J.; Villegas, D. Conventional digital cameras as a tool for assessing leaf area index and biomass for cereal breeding. J. Integr. Plant Biol. 2014, 56, 7–14. [Google Scholar] [CrossRef]
  5. Pradhan, S.; Bandyopadhyay, K.K.; Sehgal, V.K.; Sahoo, R.N.; Panigrahi, P.; Krishna, G.; Gupta, V.K.; Joshi, D.K. Estimation of leaf chlorophyll content in wheat using hyperspectral vegetation indices. Curr. Sci. 2020, 119, 174–175. [Google Scholar]
  6. Lu, J.; Yang, T.; Su, X.; Qi, H.; Yao, X.; Cheng, T.; Zhu, Y.; Cao, W.; Tian, Y. Monitoring leaf potassium content using hyperspectral vegetation indices in rice leaves. Precis. Agric. Int. J. Adv. Precis. Agric. 2020, 21, 32. [Google Scholar] [CrossRef]
  7. Zhang, Z.; Lou, Y.; Ojara, A.M.; Li, R.; Ma, L.; Li, J. Hyperspectral vegetation indexes to monitor wheat plant height under different sowing conditions. Spectrosc. Lett. 2020, 53, 194–206. [Google Scholar]
  8. Qi, H.; Zhu, B.; Kong, L.; Yang, W.; Zou, J.; Lan, Y.; Zhang, L. Hyperspectral Inversion Model of Chlorophyll Content in Peanut Leaves. Appl. Sci. 2020, 10, 2259. [Google Scholar] [CrossRef]
  9. Li, C.; Cui, Y.; Ma, C.; Niu, Q.; Li, J. Hyperspectral inversion of maize biomass coupled with plant height data. Crop Sci. 2021, 61, 2067–2079. [Google Scholar] [CrossRef]
  10. Feng, S.; Xu, T.; Yu, F.; Chen, C.; Yang, X.; Wang, N. Research of Method for Inverting Nitrogen Content in Canopy Leaves of Japonica Rice in Northeastern China Based on Hyperspectral Remote Sensing of Unmanned Aerial Vehicle. Spectrosc. Spectr. Anal. 2018, 39, 3281–3287. [Google Scholar]
  11. Wang, R.; Song, X.; Li, Z.; Yang, G.; Guo, W.; Tan, C.; Chen, L. Estimation of winter wheat nitrogen nutrition index using hyperspectral remote sensing. Editor. Off. Trans. Chin. Soc. Agric. Eng. 2014, 30, 191–198. [Google Scholar]
  12. Farias, G.D.; Bremm, C.; Bredemeier, C.; Menezes, J.d.L.; Alves, L.A.; Tiecher, T.; Martins, A.P.; Fioravanço, G.P.; da Silva, G.P.; Carvalho, P.C.d.F. Normalized Difference Vegetation Index (NDVI) for soybean biomass and nutrient uptake estimation in response to production systems and fertilization strategies. Front. Sustain. Food Syst. 2023, 6, 959681. [Google Scholar] [CrossRef]
  13. Wang, X.; Cai, G.; Lu, X.; Yang, Z.; Zhang, X.; Zhang, Q. Inversion of Wheat Leaf Area Index by Multivariate Red-Edge Spectral Vegetation Index. Sustainability 2022, 14, 15875. [Google Scholar] [CrossRef]
  14. Wu, T.; Yu, J.; Lu, J.; Zou, X.; Zhang, W. Research on Inversion Model of Cultivated Soil Moisture Content Based on Hyperspectral Imaging Analysis. Agriculture 2020, 10, 292. [Google Scholar] [CrossRef]
  15. Xiang, Y.; Wang, X.; An, J.; Tang, Z.; Li, W.; Shi, H. Estimation of soybean leaf area index based on fractional differential and optimal spectral index. Trans. Chin. Soc. Agric. Mach. 2023, 54, 281–295. [Google Scholar]
  16. Abubakar, S.A.; Hamani, A.K.M.; Wang, G.; Liu, H.; Mehmood, F.; Abdullahi, A.S.; Gao, Y.; Duan, A. Growth and nitrogen productivity of drip-irrigated winter wheat under different nitrogen fertigation strategies in the North China Plain. J. Integr. Agric. 2023, 22, 908–922. [Google Scholar] [CrossRef]
  17. Tang, Z.; Guo, J.; Xiang, Y.; Lu, X.; Wang, Q.; Wang, H.; Cheng, M.; Wang, H.; Wang, X.; An, J.; et al. Estimation of Leaf Area Index and Above-Ground Biomass of Winter Wheat Based on Optimal Spectral Index. Agronomy 2022, 12, 1729. [Google Scholar] [CrossRef]
  18. Kerimkhulle, S.; Kerimkulov, Z.; Aitkozha, Z.; Saliyeva, A.; Taberkhan, R.; Adalbek, A. The estimate one-two-sided confidence intervals for mean of spectral reflectance of the vegetation. J. Phys. Conf. Ser. 2022, 2388, 012160. [Google Scholar] [CrossRef]
  19. Yang, H.; Cheng, Y.; Li, G. A denoising method for ship radiated noise based on Spearman variational mode decomposition, spatial-dependence recurrence sample entropy, improved wavelet threshold denoising, and Savitzky-Golay filter. Alex. Eng. J. 2021, 60, 3379–3400. [Google Scholar] [CrossRef]
  20. Zhang, X.; Zhang, Y.; Wang, M.; Liu, Y.; Wu, H.; Wang, K. An Analysis of Physiological Changes and Spectral Characteristics of Platanus occidentalis Leaves Infested by Corythucha ciliata (SAY) (Hemiptera:Tingidae). Forests 2023, 14, 449. [Google Scholar] [CrossRef]
  21. Chai, X. Parameters Based on UAV Remote Sensing Study on Inversion Method of Soybean Growth. Master’s Thesis, Shanxi Agricultural University, Jinzhong, China, 2023. [Google Scholar] [CrossRef]
  22. Xu, C.; Hu, X.; Chen, D.; Zhen, J.; Wang, W.; Peng, X.; Ru, C. Estimation of grape basal crop coefficient in northwestern semi-humid zone based on UAV multispectral remote sensing. Agric. Res. Arid. Areas 2023, 41, 106–117. [Google Scholar]
  23. Liu, S.; Yu, H.; Zhang, J.; Zhou, H.; Kong, L.; Zhang, L.; Dang, J.; Sui, Y. Study on Inversion Model of Chlorophyll Content in Soybean Leaf Based on Optimal Spectral Indices. Spectrosc. Spectr. Anal. 2021, 41, 1912–1919. [Google Scholar]
  24. Zhou, Y.; Zhang, S. Prediction of rupture and perforation limits of pressurised X80 pipelines using BP neural networks and generalised additive models. Ocean. Eng. 2022, 259, 111839. [Google Scholar] [CrossRef]
  25. Liu, L.; Gao, Y.; Wu, X.; Chang, T.; Li, Y.; Lv, J.; Jiang, D.; Zhao, B.; Wang, Z. A rapid origin identification method for Panax quinquefolius by terahertz spectroscopy combined with random forest. Optik 2022, 268, 169718. [Google Scholar] [CrossRef]
  26. Huang, H.; Wang, Z.; Chung, W. Efficient parameter selection for support vector machines. Enterp. Inf. Syst. 2019, 13, 916–932. [Google Scholar] [CrossRef]
  27. Shi, H.; Guo, J.; An, J.; Tang, Z.; Wang, X.; Li, W.; Zhao, X.; Jin, L.; Xiang, Y.; Li, Z.; et al. Estimation of Chlorophyll Content in Soybean Crop at Different Growth Stages Based on Optimal Spectral Index. Agronomy 2023, 13, 663. [Google Scholar] [CrossRef]
  28. Shen, W.; Wang, J.; Chen, M.; Hao, L.; Wu, Z. Research on Bathymetric Inversion Capability of Different Multispectral Remote Sensing Images in Seaports. Sensors 2023, 23, 1178. [Google Scholar] [CrossRef]
  29. Xu, D.; Liu, Y.; Xu, W.; Guo, X. The Impact of NPV on the Spectral Parameters in the Yellow-Edge, Red-Edge and NIR Shoulder Wavelength Regions in Grasslands. Remote Sens. 2022, 14, 3031. [Google Scholar] [CrossRef]
  30. Yang, Y.; Liao, J.; Li, H.; Tan, K.; Zhang, X. Identification of high-oil content soybean using hyperspectral reflectance and one-dimensional convolutional neural network. Spectrosc. Lett. 2023, 56, 28–41. [Google Scholar] [CrossRef]
  31. Kanako, M. Use of chlorophyll index-green and the red-edge chlorophyll index to derive an algorithm for estimating gross primary production capacity. Remote Sens. 2019, 11149, 54–61. [Google Scholar]
  32. Gao, S.; Guan, H.; Ma, X. A recognition method of multispectral images of soybean canopies based on neural network. Ecol. Inform. 2022, 68, 101538. [Google Scholar] [CrossRef]
  33. Deng, W.; Huang, Y.; Zhao, C.; Wang, X. Discrimination of Crop and Weeds on Visible and Visible/Near-Infrared Spectrums Using Support Vector Machine, Artificial Neural Network and Decision Tree. Sens. Transducers 2014, 26, 26–34. [Google Scholar]
  34. Li, J.; Yu, Y.; Wang, Y.; Zhao, L.; He, C. Prediction of Transient NOx Emission from Diesel Vehicles Based on Deep-Learning Differentiation Model with Double Noise Reduction. Atmosphere 2021, 12, 1702. [Google Scholar] [CrossRef]
  35. Yang, S.; Hu, L.; Wu, H.; Ren, H.; Qiao, H.; Li, P.; Fan, W. Integration of Crop Growth Model and Random Forest for Winter Wheat Yield Estimation from UAV Hyperspectral Imagery. IEEE J. Sel. Top. Appl. Earth Obs. Remote Sens. 2021, 14, 6253–6269. [Google Scholar] [CrossRef]
  36. Yang, Z.; Tian, J.; Wang, Z.; Feng, K. Monitoring the photosynthetic performance of grape leaves using a hyperspectral-based machine learning model. Eur. J. Agron. 2022, 140, 126589. [Google Scholar] [CrossRef]
  37. Kang, N.Y.; Go, S.Y.; Cho, G.S. A Comparative Study on Suitable SVM Kernel Function of Land Cover Classification Using KOMPSAT-2 Imagery. J. Korean Soc. Geospat. Inf. Syst. 2013, 21, 19–25. [Google Scholar]
Figure 1. Geographical location of the test area.
Sustainability 15 12930 g001
Figure 2. Correlation matrix of RI (a1,a2), TVI (b1,b2), mSR (c1,c2), MNDI (d1,d2), and LAI of winter oilseed rape at flowering stage under 0th and 1st order differentials.
Sustainability 15 12930 g002
Figure 3. Correlation matrix of DI (a1,a2), SAVI (b1,b2), NDVI (c1,c2) and LAI of winter oilseed rape at flowering stage under 0th and 1st order differentials.
Sustainability 15 12930 g003
Figure 4. Correlation between the predicted and measured values of winter rapeseed LAI of 0-order and 1-order based on BPNN, RF, and SVM.
Sustainability 15 12930 g004
Table 1. Statistical results of winter rapeseed LAI data at flowering stage.
Statistical IndicatorsLAI/(cm2/cm2)
Sample size64
Maximum value5.46
Minimum value1.88
Average value3.65
Standard deviation0.99
Coefficient of variation/%0.27
Table 2. Spectral index of winter rapeseed in flowering period.
Spectral IndexCalculation FormulaReference
Ratio vegetation index (RI) R i / R j [20]
Triangle vegetation index (TVI) 0.5 × 120 × R i R 550 200 × R j R 550 [20]
Modified simple ratio (mSR) R i R 455 / R j R 455 [21]
Modified normalized difference index (mNDI) R i R j / R i + R j 2 R 455 [21]
Difference vegetation index (DI) R i R j [22]
Soil adjustment vegetation index (SAVI) 1 + 0.16 R i R j R i + R j + 0.16 [22]
Normalized difference vegetation index (NDVI) R i R j / R i + R j [23]
Note: Ri(I = 1,2,3) and Rj(i = 1,2,3) are the reflectivity at any waveband, R455 and R550 are the spectral reflectance at 450 nm and 550 nm.
Table 3. Spectral index wavelength combinations at different differential orders.
Differential OrderSpectral IndexCorrelation CoefficientPosition of Wavelength
(i,j)/(nm)
Spectral Index Combination
0DI0.692629,670RI, NDVI, mSR, mNDI, SAVI
RI0.714748,749
NDVI0.714748,749
SAVI0.701685,670
TVI0.664760,736
mSR0.715749,748
mNDI0.707750,748
1DI0.709717,753DI, RI, SAVI,
TVI, NDVI
RI0.734716,724
NDVI0.734716,724
SAVI0.709717,753
TVI0.721755,725
mSR0.675728,708
mNDI0.702728,708
Note: The wavelength range with the higher correlation is between 670 and 760. Spectral index, the spectral index combinations are the five most correlated from high to low.
Table 4. Comparison of model accuracy prediction evaluation under different differential orders.
Different OrderEvaluating IndicatorBPNNRFSVM
Modeling SetValidation SetModeling SetValidation SetModeling SetValidation Set
0R20.6460.5410.5350.5590.4960.701
RMSE0.5690.6840.5220.7220.7580.410
MRE12.08312.87215.74918.36812.878.845
1R20.6500.6390.7050.8100.7380.630
RMSE0.4550.5990.7250.4550.4880.662
MRE11.72115.06414.56210.4657.59615.853
Note: RMSE unit is cm2/cm2, MRE is a percentage.
Disclaimer/Publisher’s Note: The statements, opinions and data contained in all publications are solely those of the individual author(s) and contributor(s) and not of MDPI and/or the editor(s). MDPI and/or the editor(s) disclaim responsibility for any injury to people or property resulting from any ideas, methods, instructions or products referred to in the content.

