
A Study of Sandy Land Changes in the Chifeng Region from 1990 to 2020 Based on Dynamic Convolution


Abstract
:1. Introduction
2. Study Region and Data
2.1. Overview of the Study Region
2.2. Research Information
3. Research Methodology
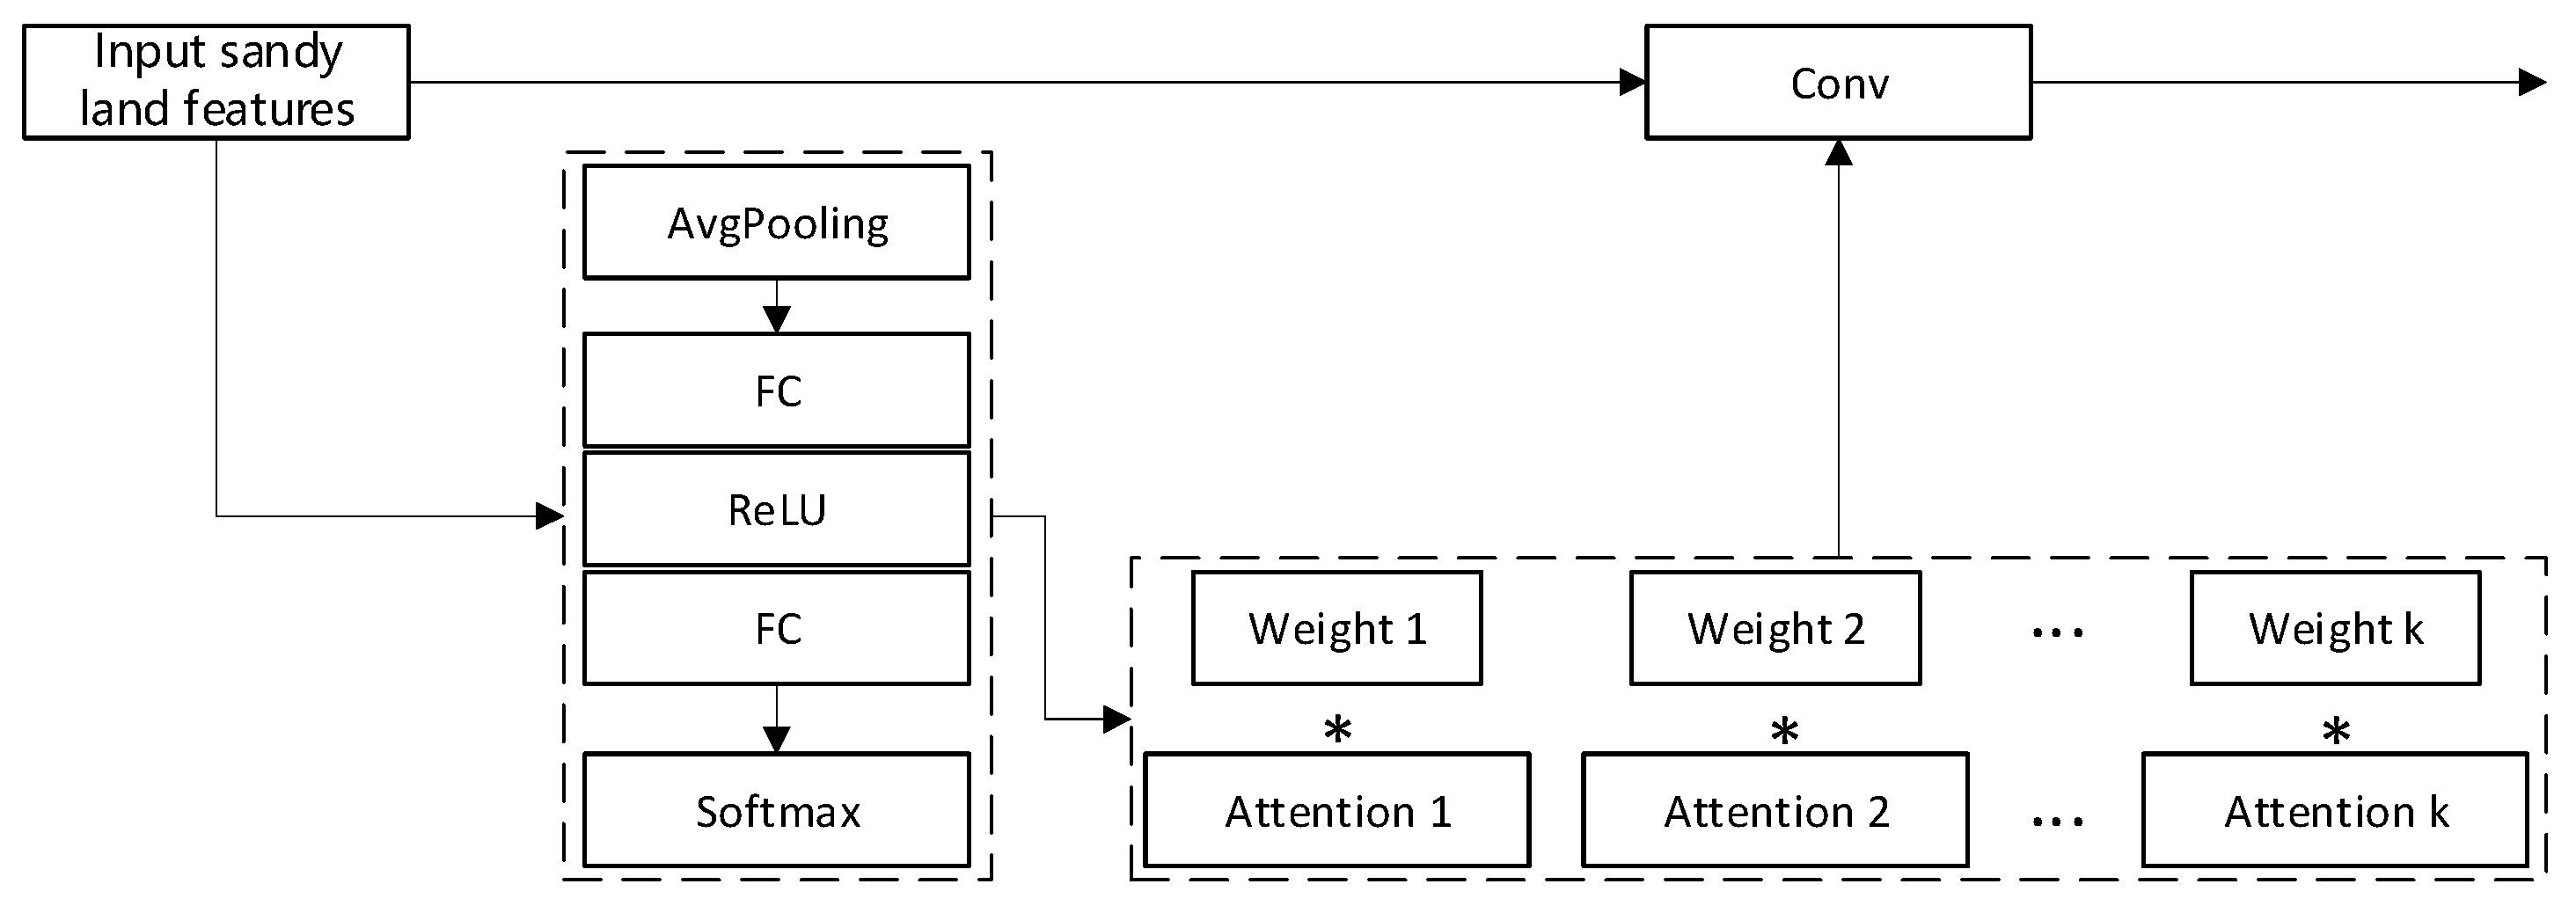
3.1. Dynamic Convolution
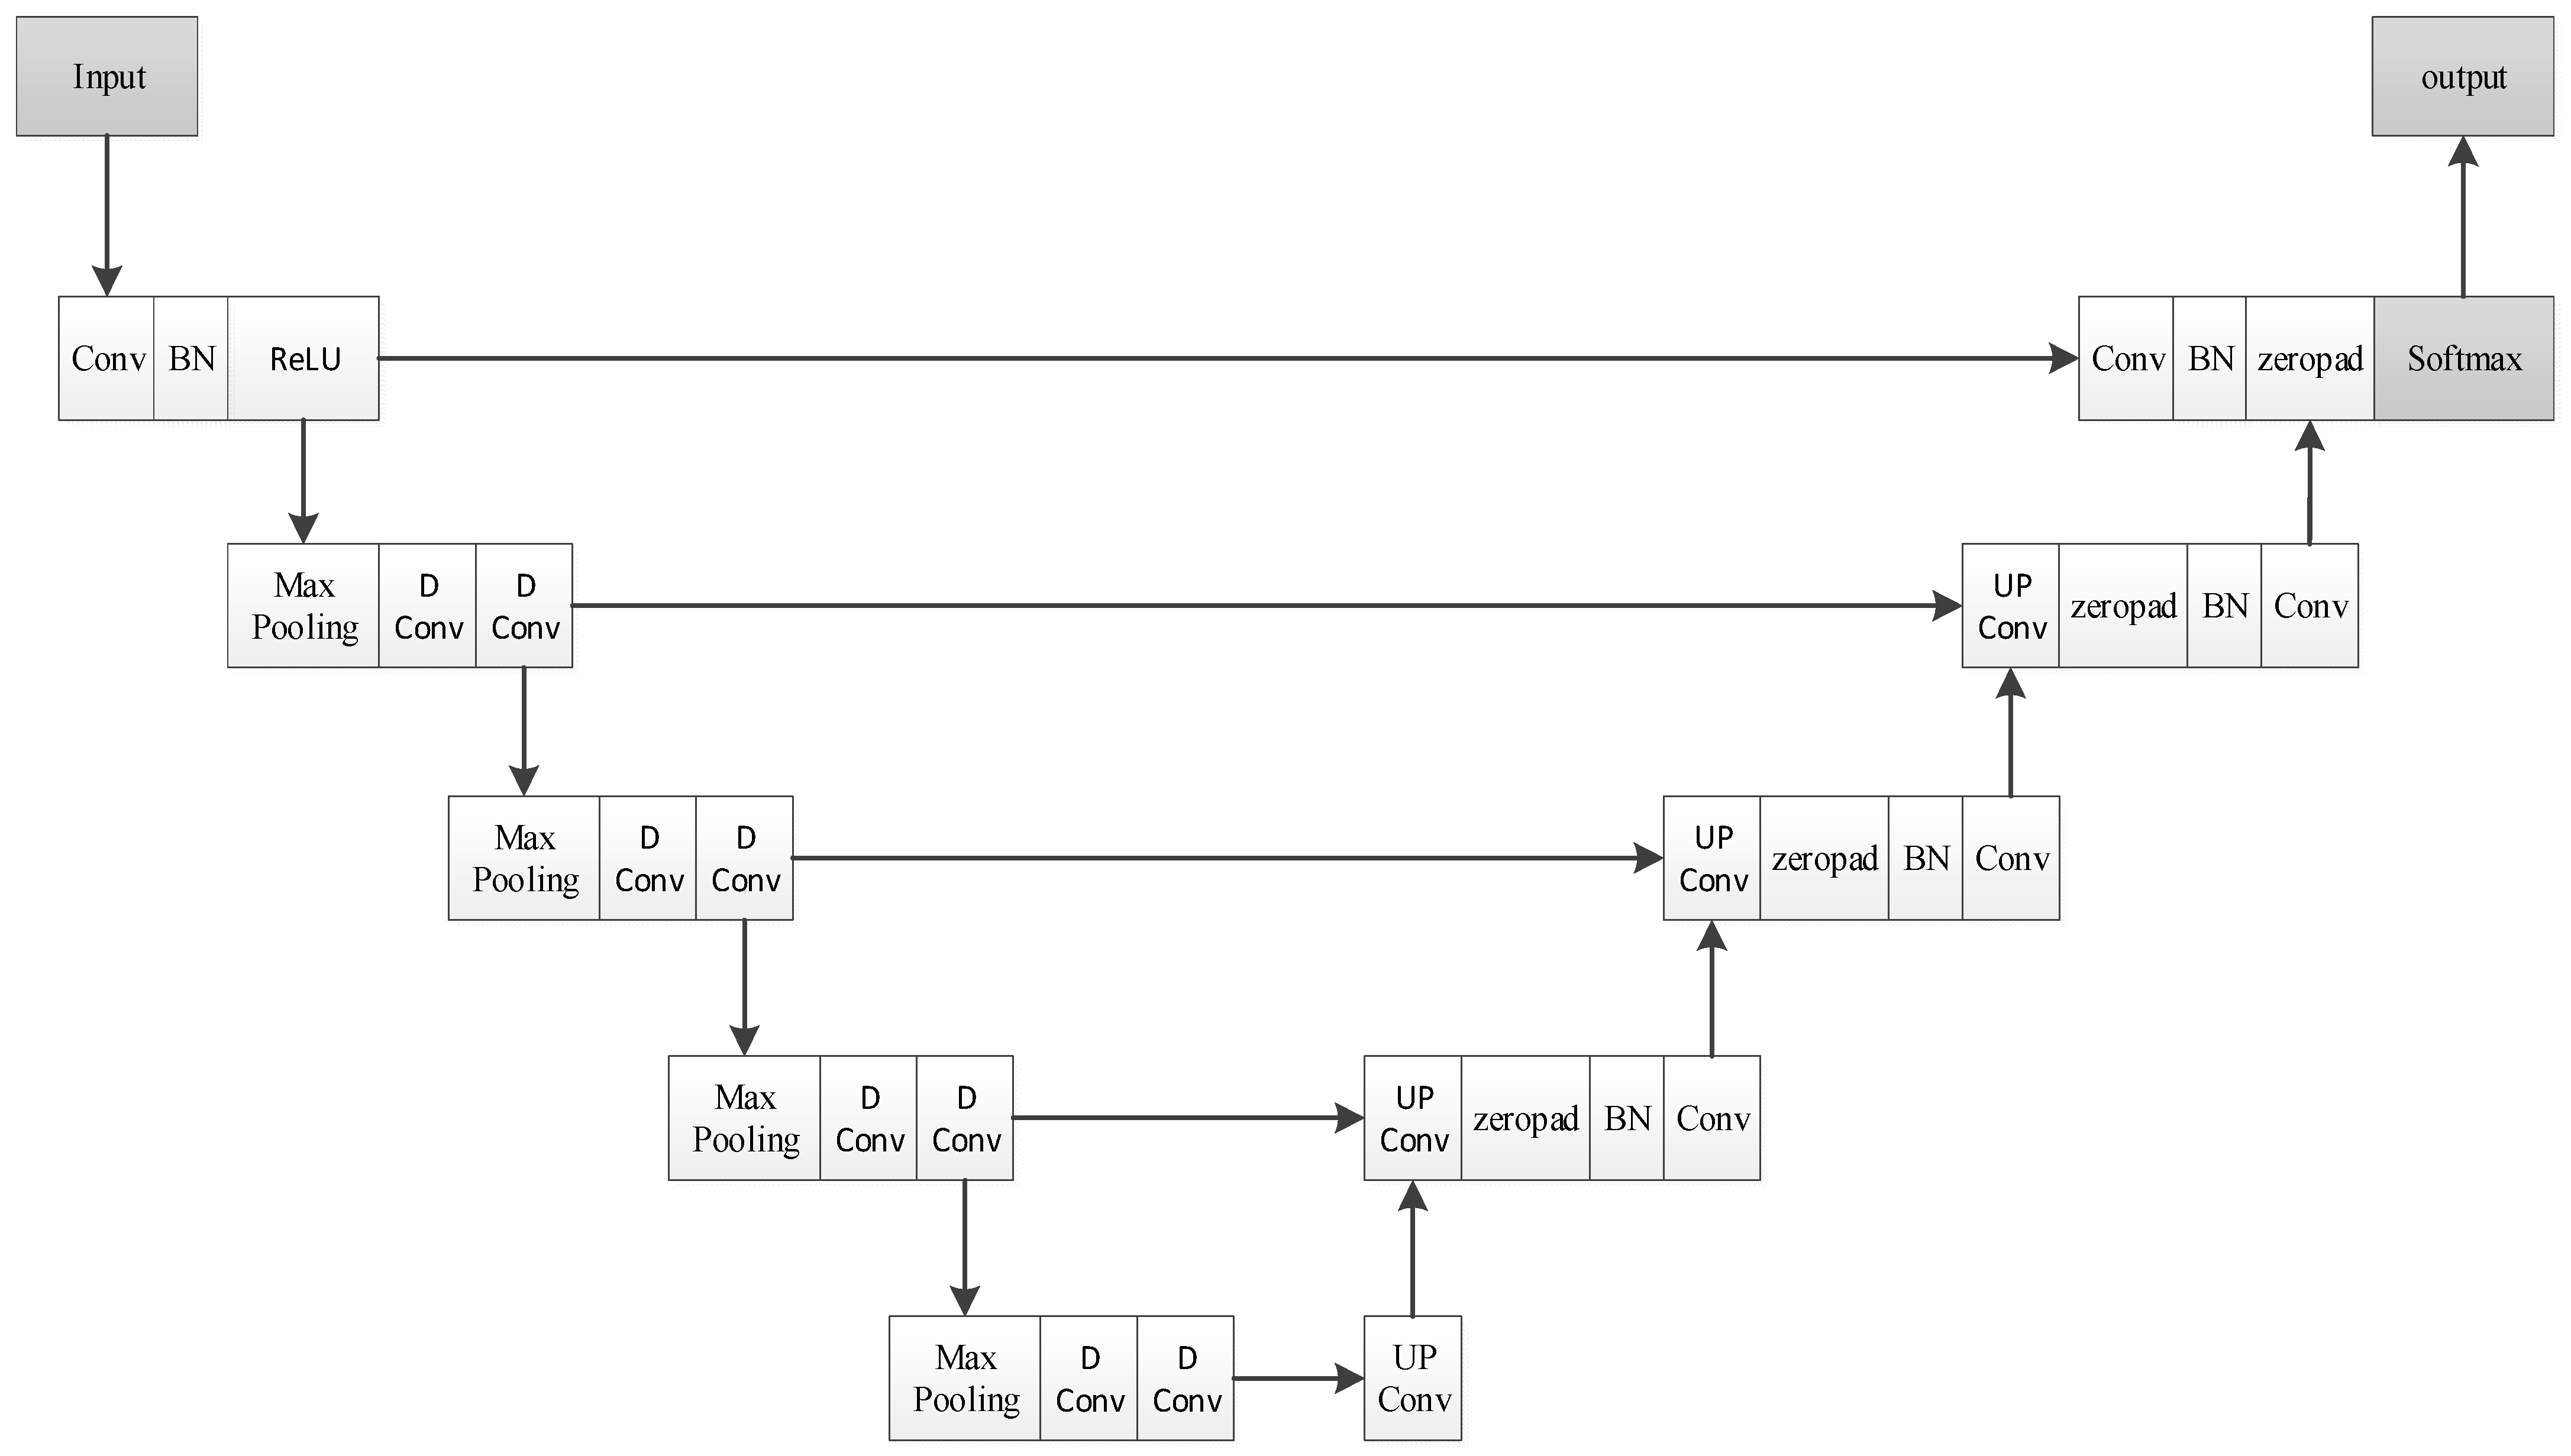
3.2. DU-Net Sandy Land Extraction Model
3.3. Structural Equation Model (SEM)
3.4. Multivariate Weighted Results
4. Experiments and Analysis
4.1. Experimental Data
4.2. Model Training
4.3. Experimental Results
5. Discussion
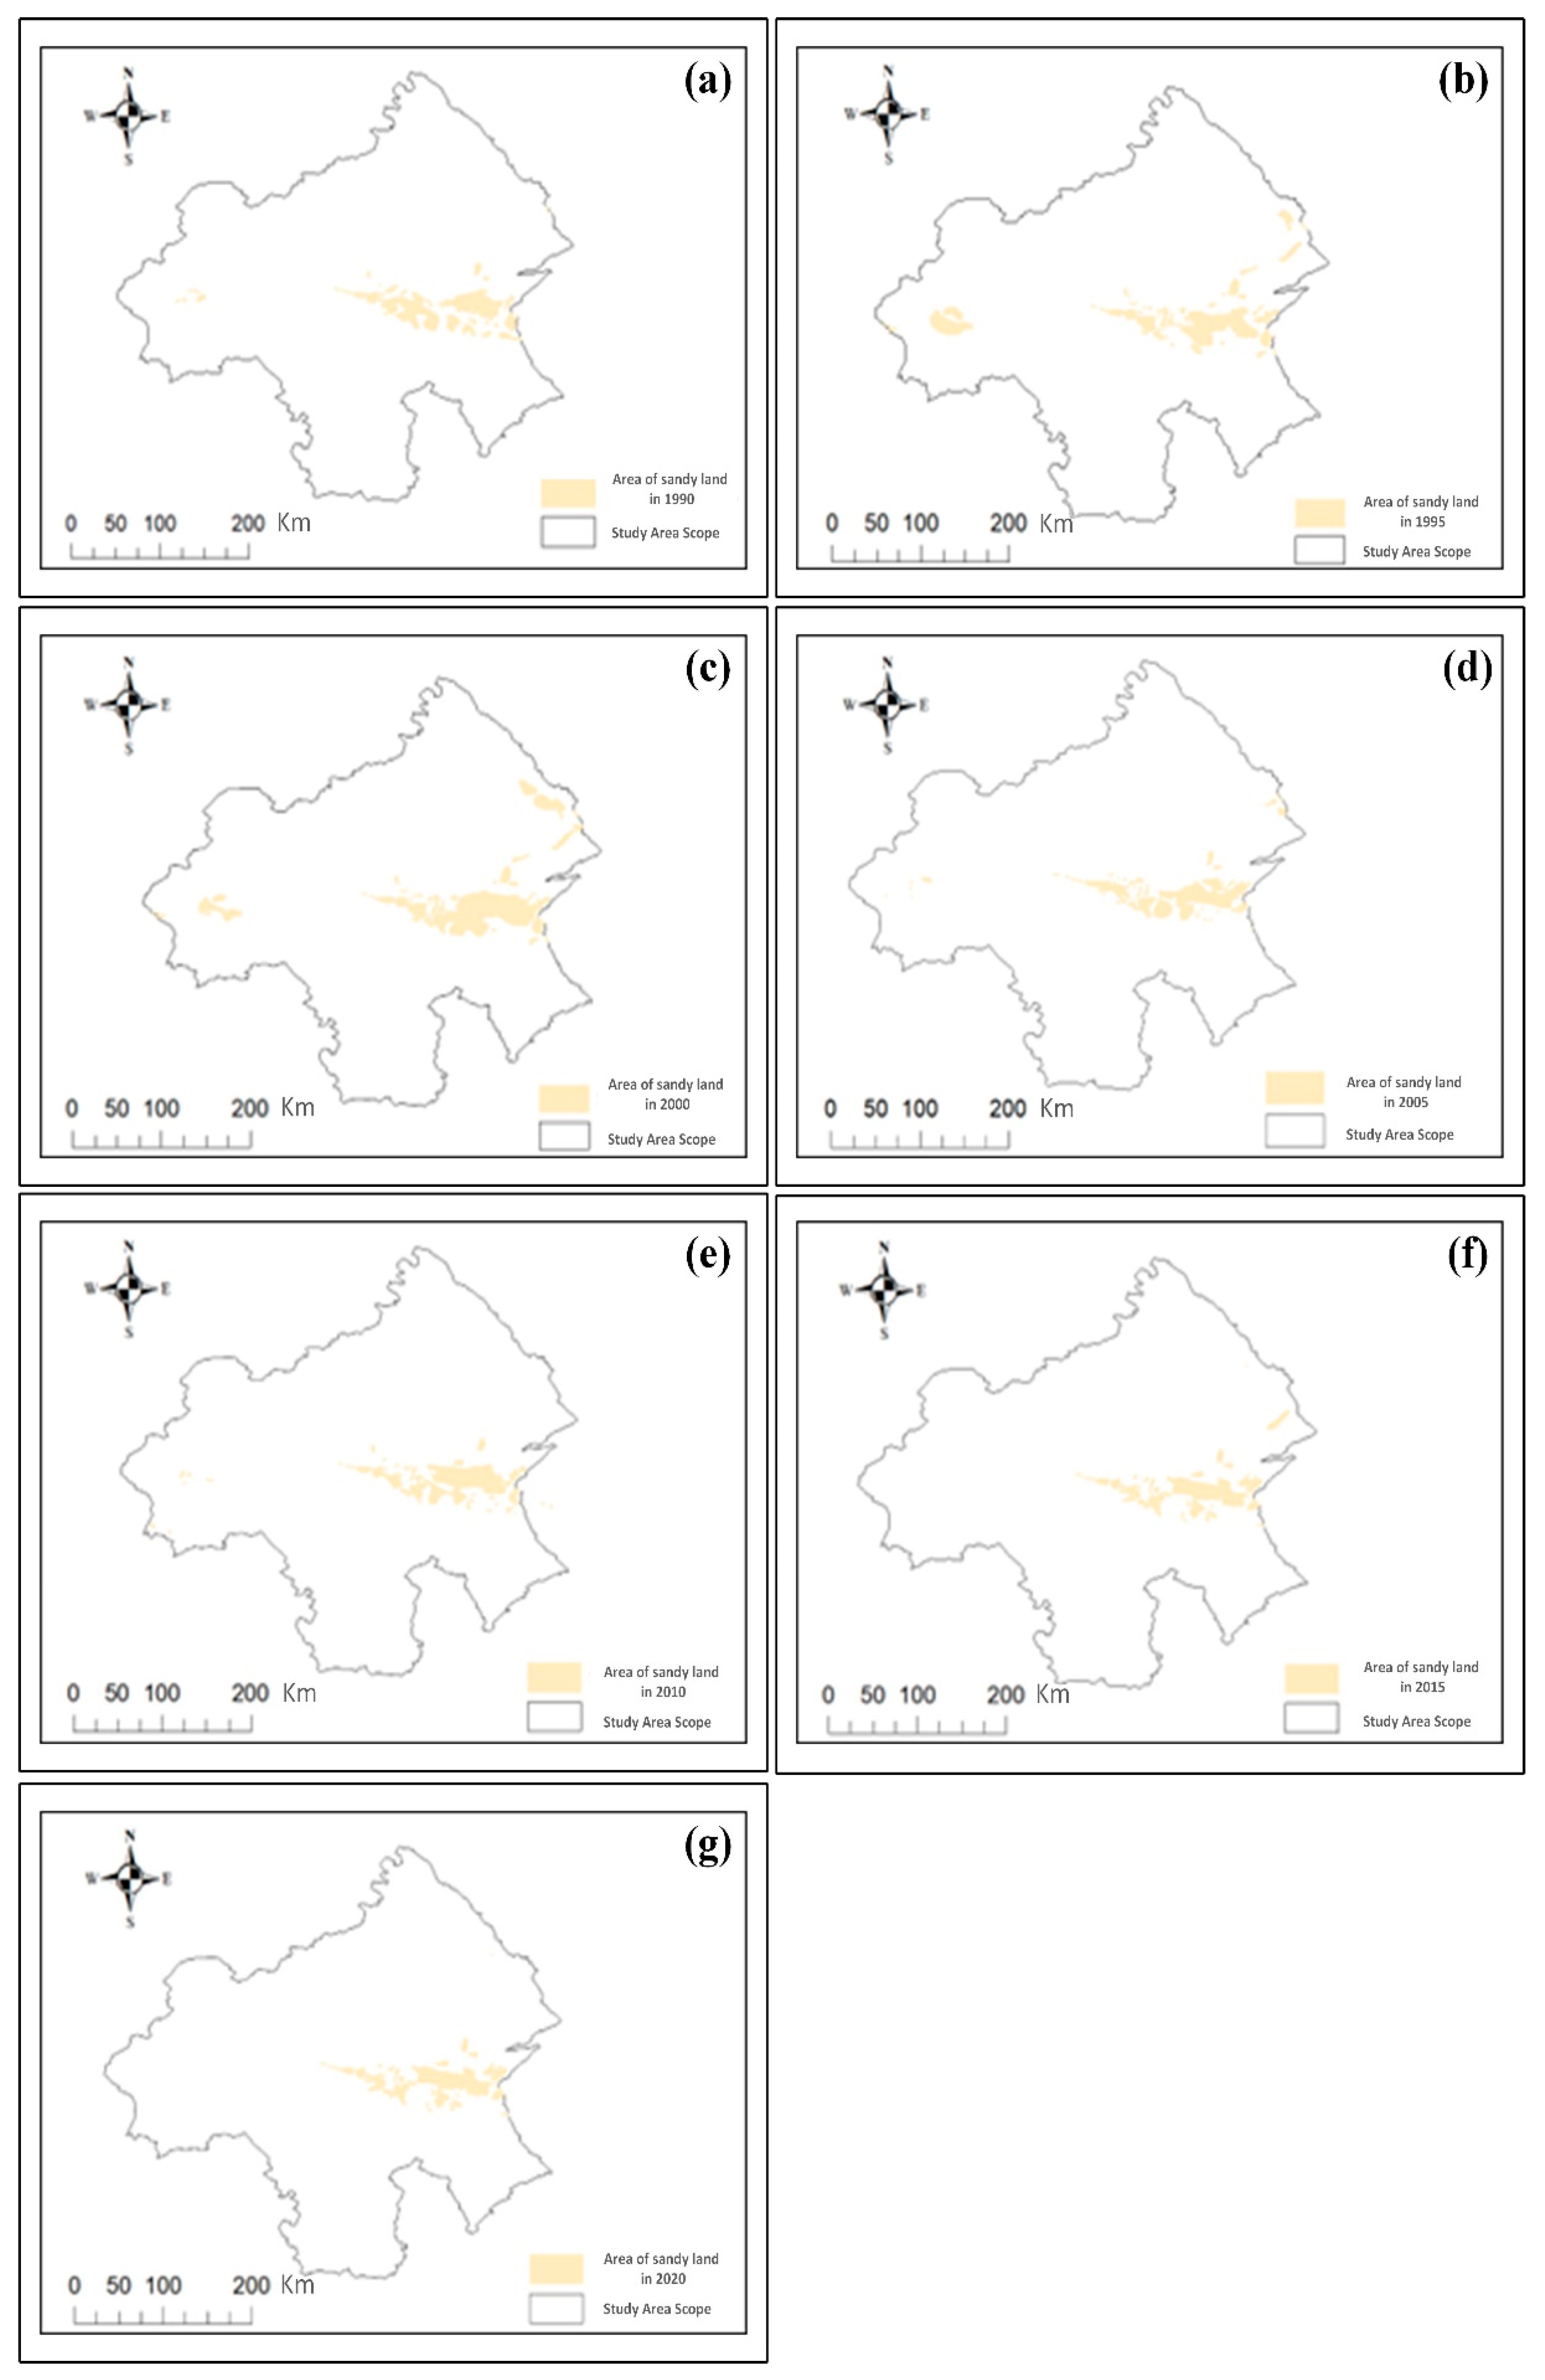
5.1. Analysis of the Spatial and Temporal Trends of the Sandy Land Areas in the Study Region
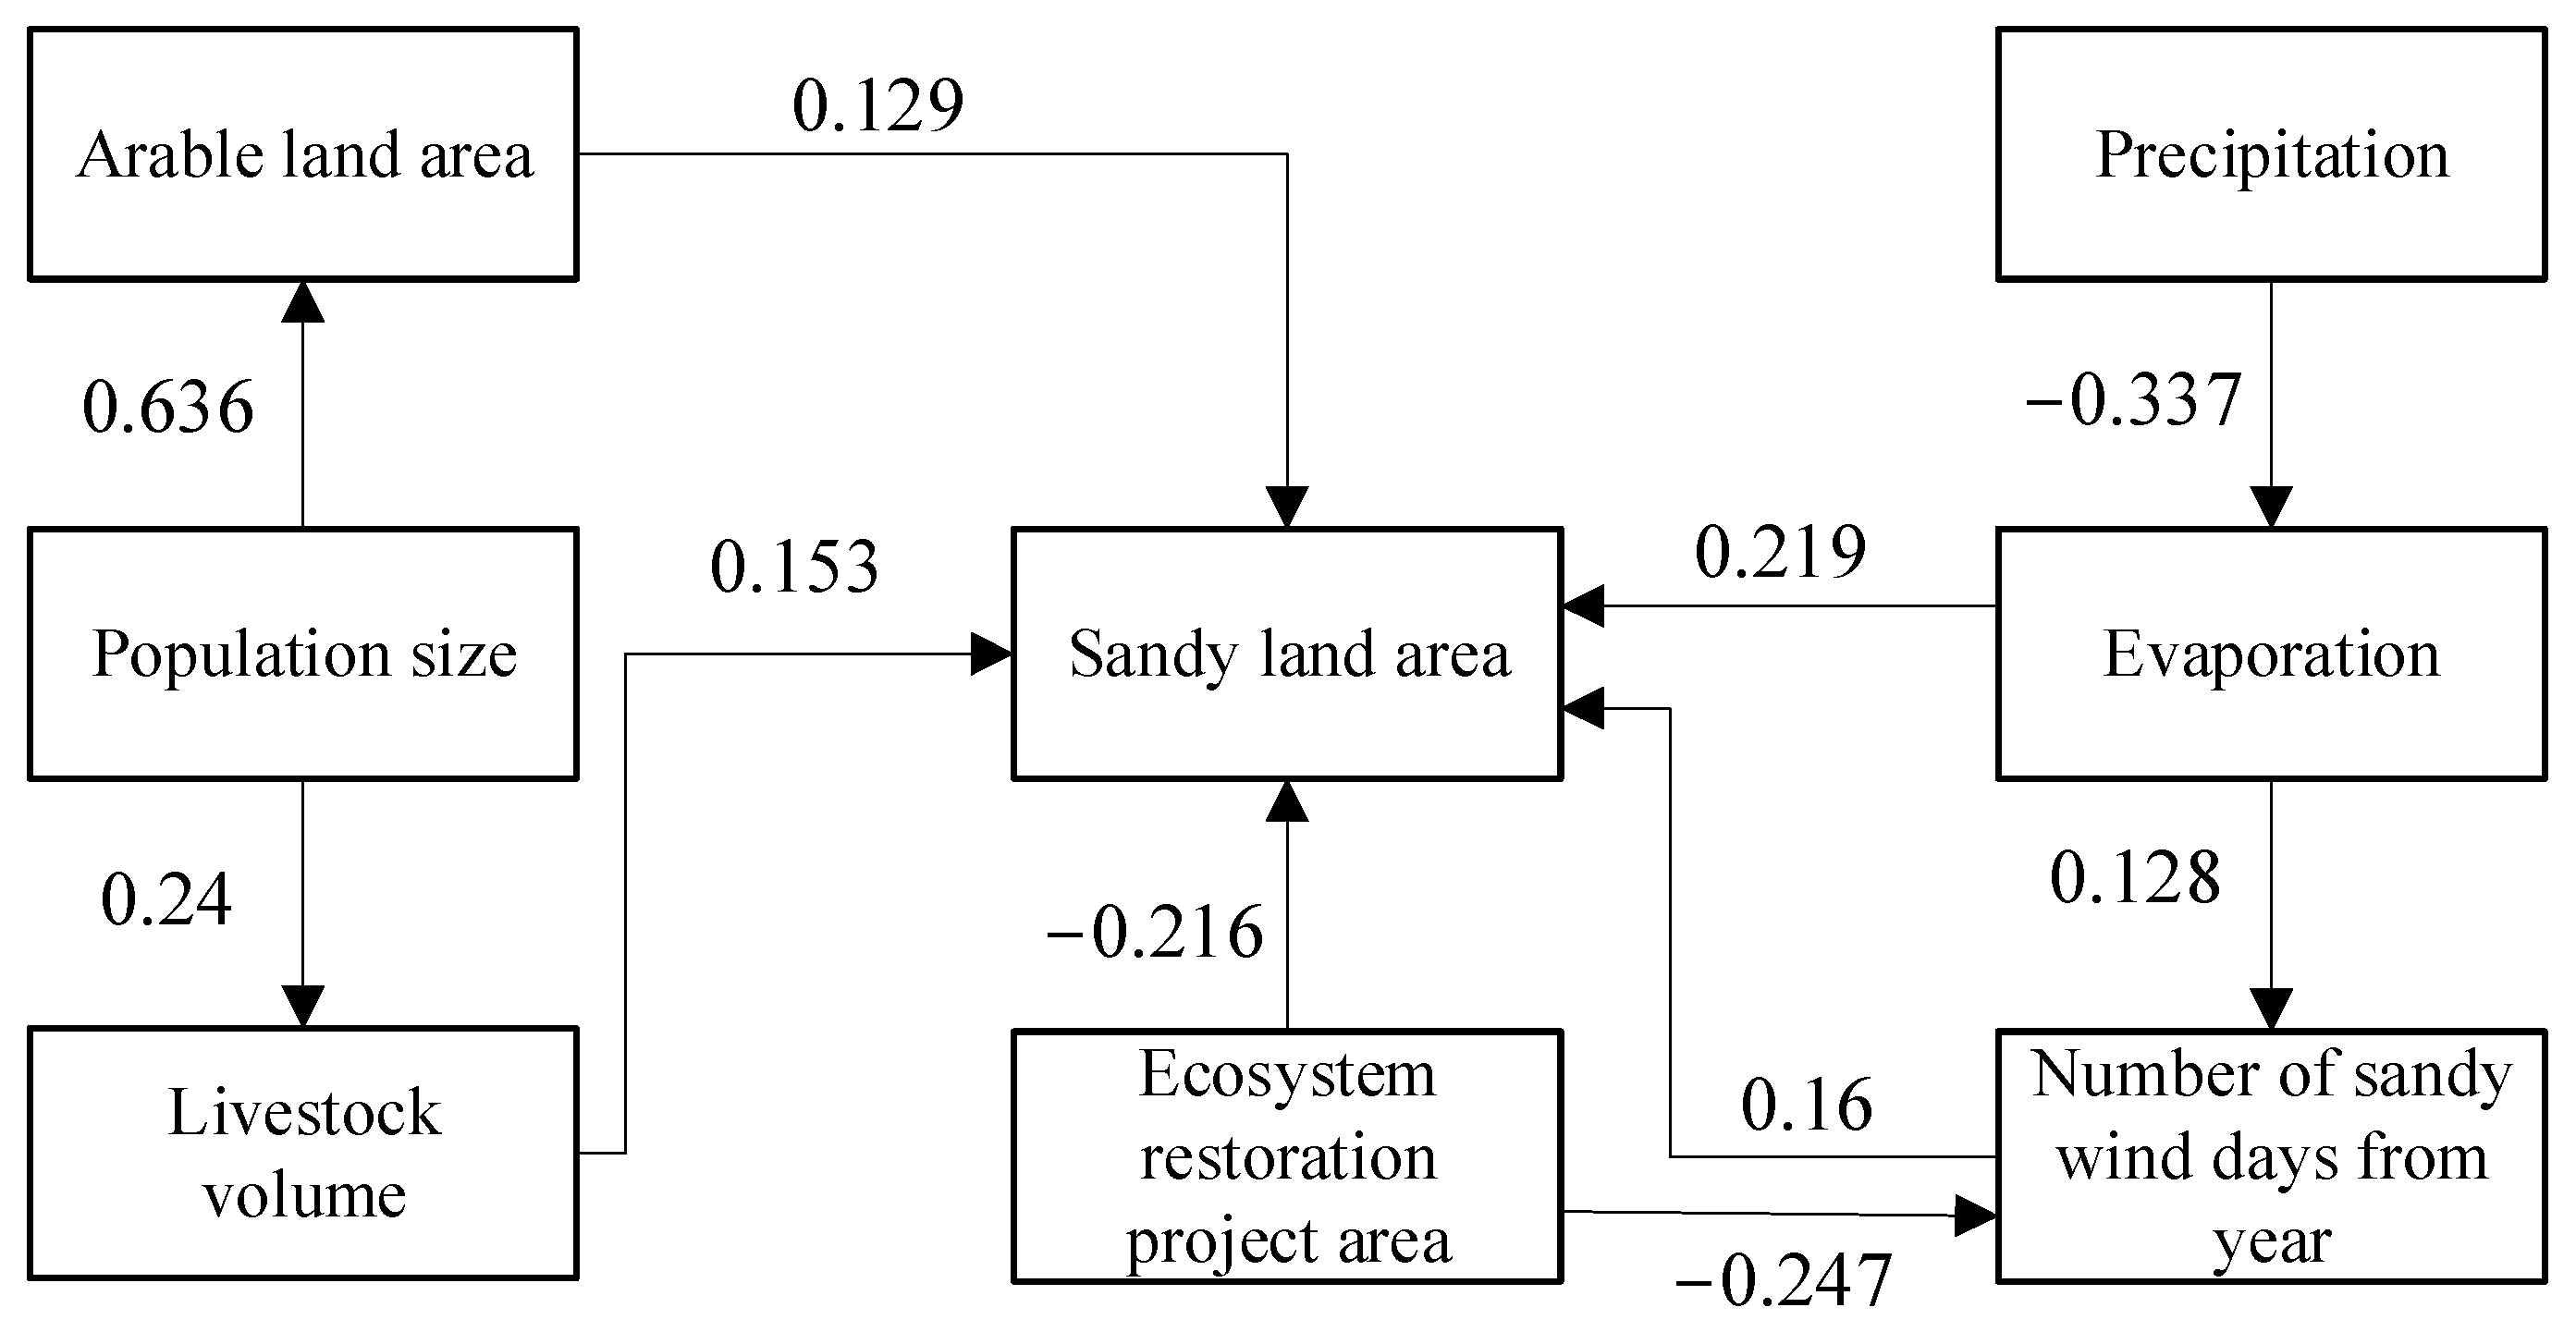
5.2. Analysis of the Driving Factors of Sandy Land Area Change from the Structural Equation Modeling Perspective
5.3. Limitations and Future Research
6. Conclusions
Author Contributions
Funding
Institutional Review Board Statement
Informed Consent Statement
Data Availability Statement
Acknowledgments
Conflicts of Interest
References
- Neely, C.; Bunning, S. Review of evidence on drylands pastoral systems and climate change. Land Water Discuss. Pap. 2009, 6, 103. [Google Scholar]
- PNUMA. Status of Desertification and Implementation of the United Nations Plan of Action to Combat Desertification: Report of the Executive Director; United Nations Environment Programme: Nairobi, Kenya, 1991. [Google Scholar]
- Wang, T.; Yan, C.Z.; Song, X.; Xie, J.L. Monitoring recent trends in the area of aeolian desertified land using Landsat images in China’s Xinjiang region. ISPRS J. Photogramm. Remote Sens. 2012, 68, 184–190. [Google Scholar]
- Wang, H.; Ma, M.; Geng, L. Monitoring the recent trend of aeolian desertification using Landsat TM and Landsat 8 imagery on the north-east Qinghai-Tibet Plateau in the Qinghai Lake basin. Nat. Hazards 2015, 79, 1753–1772. [Google Scholar] [CrossRef]
- Zhang, F.; Tiyip, T.; Feng, Z.D.; Kung, H.T.; Johnson, V.C.; Ding, J.L.; Tashpolat, N.; Sawut, M.; Gui, D.W. Spatio-Temporal Patterns of Land Use/Cover Changes Over the Past 20 Years in the Middle Reaches of the Tarim River, Xinjiang, China. Land Degrad. Dev. 2015, 26, 284–299. [Google Scholar] [CrossRef]
- Poulos, H.M. Mapping fuels in the Chihuahuan Desert borderlands using remote sensing, geographic information systems, and biophysical modeling. Can. J. For. Res. 2009, 39, 1917–1927. [Google Scholar] [CrossRef]
- Feng, Y.M.; Wu, B.; Zhou, N.; Che, T.T.; Wang, F.; Cong, R.C.; Cao, Y.L.; Lu, Q. Gobi Classification System Based on Remote Sensing Image Recognition. J. Desert Res. 2013, 33, 635–641. [Google Scholar]
- Varma, G.S.; Shah, V.; Buddhiraju, K.M. Segmentation of desert sand dunes. Remote Sens. Lett. 2014, 5, 961–970. [Google Scholar]
- Schlesinger, W.H.; Reynolds, J.F.; Cunningham, G.L.; Huenneke, L.F.; Jarrell, W.M.; Virginia, R.A.; Whitford, W.G. Biological feedbacks in global desertification. Science 1990, 247, 1043–1048. [Google Scholar] [CrossRef]
- Zongfan, B.; Ling, H.; Xuhai, J.; Ming, L.; Liangzhi, L.; Huiqun, L.; Jiaxin, L. Spatiotemporal evolution of desertification based on integrated remote sensing indices in Duolun County, Inner Mongolia. Ecol. Inform. 2022, 70, 101750. [Google Scholar] [CrossRef]
- Wang, J.; Wang, J.; Yu, D.; Teng, D.; He, B.; Chen, X.; Ge, X.; Zhang, Z.; Wang, Y.; Yang, X.; et al. Machine learning-based detection of soil salinity in an arid desert region, Northwest China: A comparison between Landsat-8 OLI and Sentinel-2 MSI. Sci. Total Environ. 2020, 707, 136092. [Google Scholar] [CrossRef]
- Li, J.; Zhao, L.; Xu, B.; Yang, X.; Jin, Y.; Gao, T.; Yu, H.; Zhao, F.; Ma, H.; Qin, Z. Spatiotemporal variations in grassland desertification based on Landsat images and spectral mixture analysis in Y anchi county of Ningxia, China. IEEE J. Sel. Top. Appl. Earth Obs. Remote Sens. 2014, 7, 4393–4402. [Google Scholar] [CrossRef]
- Lecun, Y.; Boser, B.; Denker, J. Backpropagation Applied to Handwritten Zip Code Recognition. Neural Comput. 1989, 1, 541–551. [Google Scholar] [CrossRef]
- Hugo, L. Exploring Strategies for Training Deep Neural Networks. J. Mach. Learn. Res. 2009, 1, 1–40. [Google Scholar]
- Long, J.; Shelhamer, E.; Darrell, T. Fully convolutional networks for semantic segmentation. In Proceedings of the IEEE Conference on Computer Vision and Pattern Recognition, Boston, MA, USA, 12 June 2015; pp. 3431–3440. [Google Scholar]
- Ronneberger, O.; Fischer, P.; Brox, T. U-Net: Convolutional Networks for Biomedical Image Segmentation; Springer International Publishing: Berlin/Heidelberg, Germany, 2015. [Google Scholar]
- Zhou, K.; Zhang, Z.; Liu, L.; Miao, R.; Yang, Y.; Ren, T.; Yue, M. Research on SUnet Winter Wheat Identification Method Based on GF-2. Remote Sens. 2023, 15, 3094. [Google Scholar] [CrossRef]
- Jiang, T.; Freudenberg, M.; Kleinn, C.; Ecker, A.; Nölke, N. The Impacts of Quality-Oriented Dataset Labeling on Tree Cover Segmentation Using U-Net: A Case Study in WorldView-3 Imagery. Remote Sens. 2023, 15, 1691. [Google Scholar] [CrossRef]
- He, C.; Liu, Y.; Wang, D.; Liu, S.; Yu, L.; Ren, Y. Automatic Extraction of Bare Soil Land from High-Resolution Remote Sensing Images Based on Semantic Segmentation with Deep Learning. Remote Sens. 2023, 15, 1646. [Google Scholar] [CrossRef]
- Cho, N.; Shin, H.S.; Tsourdos, A.; Amato, D. Incremental Correction in Dynamic Systems Modelled with Neural Networks for Constraint Satisfaction. arXiv 2022, arXiv:2209.03698. [Google Scholar]
- Othmani, M.; Ezzedine, Y.; Wang, Q.G. Event Detection in Clustered Wireless Sensor Networks Using Dynamic Cell Structures Neural Networks. Adhoc Sens. Wirel. Netw. 2022, 51, 141–171. [Google Scholar]
- Jiang, Z.H.; Yu, W.; Zhou, D.; Chen, Y.; Feng, J.; Yan, S. ConvBERT: Improving BERT with Span-based Dynamic Convolution. Adv. Neural Inf. Process. Syst. 2020, 33, 12837–12848. [Google Scholar]
- Feng, M.; Sun, X.; Dong, J.; Zhao, H. Gaussian Dynamic Convolution for Semantic Segmentation in Remote Sensing Images. Remote Sens. 2022, 14, 5736. [Google Scholar] [CrossRef]
- Onojeghuo, A.O.; Miao, Y.; Blackburn, G.A. Deep ResU-Net Convolutional Neural Networks Segmentation for Smallholder Paddy Rice Mapping Using Sentinel 1 SAR and Sentinel 2 Optical Imagery. Remote Sens. 2023, 15, 1517. [Google Scholar] [CrossRef]
- Zhang, L.; Li, Y. Occurrence and Nutrition Indicators of Alfalfa with Leptosphaerulina in Chifeng, Inner Mongolia. Agriculture 2022, 12, 1465. [Google Scholar] [CrossRef]
- Wang, L.; Wang, X.; Wang, D.; Qi, B.; Zheng, S.; Liu, H.; Luo, C.; Li, H.; Meng, L.; Meng, X.; et al. Spatiotemporal Changes and Driving Factors of Cultivated Soil Organic Carbon in Northern China’s Typical Agro-Pastoral Ecotone in the Last 30 Years. Remote Sens. 2021, 13, 3607. [Google Scholar] [CrossRef]
- Xu, H. Evaluation of Two Absolute Radiometric Normalization Algorithms for Pre-processing of Landsat Imagery. J. China Univ. Geosci. 2006, 2, 146–150+157. [Google Scholar] [CrossRef]
- Bodechtel, J.; Haydn, R.; Dibernardo, G.; Hiller, K.; Jaskolla, F.; Leisen, H.; Muenzer, U.; Nithack, J.; Smolka, A. Application of LANDSAT Data and Digital Image Processing; No. NASA-CR-158102; NASA: Washington, DC, USA, 1978.
- Paisley, E.C.I.; Lancaster, N.; Gaddis, L.R.; Greeley, R. Discrimination of active and inactive sand from remote sensing: Kelso dunes, Mojave desert, California. Remote Sens. Environ. 1991, 37, 153–166. [Google Scholar] [CrossRef]
- Muthén, B. A general structural equation model with dichotomous, ordered categorical, and continuous latent variable indicators. Psychometrika 1984, 49, 115–132. [Google Scholar] [CrossRef]
- Lefcheck, J.S. piecewiseSEM: Piecewise structural equation modelling in r for ecology, evolution, and systematics. Methods Ecol. Evol. 2016, 7, 573–579. [Google Scholar] [CrossRef]
- Mardani, A.; Streimikiene, D.; Zavadskas, E.K.; Cavallaro, F.; Nilashi, M.; Jusoh, A.; Zare, H. Application of Structural Equation Modeling (SEM) to Solve Environmental Sustainability Problems: A Comprehensive Review and Meta-Analysis. Sustainability 2017, 9, 1814. [Google Scholar] [CrossRef]
- Song, W.; Zhang, Z.; Zhang, B.; Jia, G.; Zhu, H.; Zhang, J. ISTD-PDS7: A Benchmark Dataset for Multi-Type Pavement Distress Segmentation from CCD Images in Complex Scenarios. Remote Sens. 2023, 15, 1750. [Google Scholar] [CrossRef]
- Zhang, G.P.; Liu, J.Y.; Zhang, Z.X.; Zhao, X.L.; Zhou, Q.B. Remote Sensing Based Analysis of the Distribution Pattern and Dynamic Changes of Sandy Land in China from 1995 to 2000. Acta Ecol. Sin. 2002, 22, 1500–1506+1574. [Google Scholar]
- Zhang, L. Analysis of the suitability of agro-pastoral selection in the mixed agro-pastoral zone in northern China: The case of the Horqin sandy area. Res. Soil Water Conserv. 2007, 14, 46–50. [Google Scholar]
- Zhu, H.; Zhang, B.; Song, W.; Dai, J.; Lan, X.; Chang, X. Power-Weighted Prediction of Photovoltaic Power Generation in the Context of Structural Equation Modeling. Sustainability 2023, 15, 10808. [Google Scholar] [CrossRef]
- Ma, A. Sand management, greening and enrichment—Investigation report on the management of Horqin sand and Hunsandak sand in Chifeng city. For. Econ. 2006, 7, 11–14+21. [Google Scholar]
- Wang, S.; Liu, Y. Study on Plant Sand Block Harness Model for Floating Sand of Chifeng City. J. Soil Water Conserv. 2005, 4, 144–147. [Google Scholar] [CrossRef]
- Wang, Y.Q.; Song, S.Y.; Wang, J.; Li, H.F.; Xu, D.Y.; Li, L.T. Vulnerability evolution of the ecological-economic-social complex system and the key influencing factors in the sandy region of Inner Mongolia from 2000 to 2018. Acta Ecol. Sin. 2023, 43, 2271–2286. [Google Scholar]

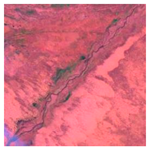
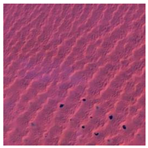
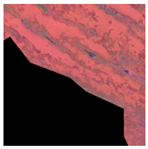
| Normal Image | Low-Brightness Image | Complex Background Image | Cloud Amount Interference Image | Negative Sample |
|---|---|---|---|---|
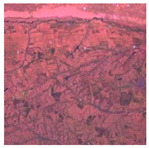 | 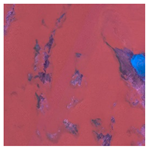 | 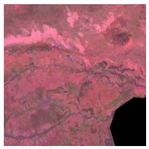 |  | 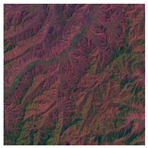 |
 |  |  |  |  |
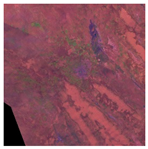 | 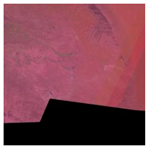 |  |  |  |
 |  |  |  |  |
 |  |  |  |  |
 |  |  |  |  |
| Parameter Indicators | Epochs | Batch_Size | Train Loss | Val Loss | Learning Rate |
|---|---|---|---|---|---|
| Parameters | 200 | 4 | 0.022 | 0.028 | 1 × 10⁻⁵ |
| Model | IoU/% | Precision/% | Recall/% | F1/% |
|---|---|---|---|---|
| U-Net | 81.649 | 90.890 | 91.409 | 89.898 |
| DU-Net | 86.324 | 93.224 | 94.501 | 92.660 |
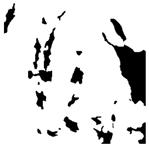
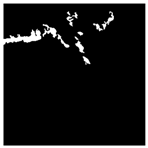
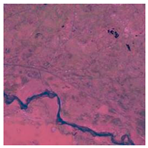
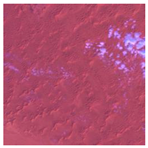
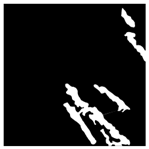
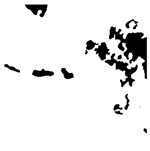
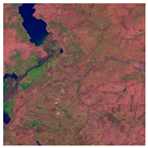
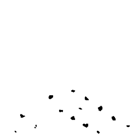
| Original Image | True Value Label | U-Net | DU-Net |
|---|---|---|---|
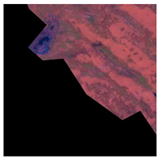 |  | 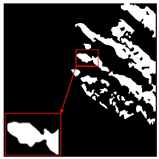 | 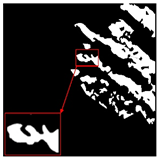 |
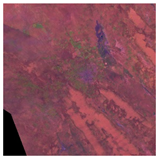 |  | 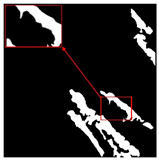 | 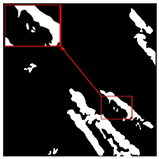 |
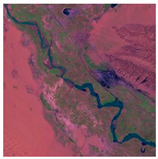 | 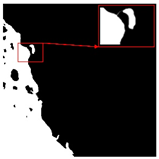 | 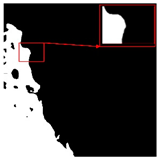 |  |
| Driving Factor | Arable Land Area | Population Size | Livestock Volume | Precipitation | Evaporation | Number of Sandy Wind Days | Ecosystem Restoration Project Area |
|---|---|---|---|---|---|---|---|
| Integrated path coefficient | 0.129 | 0.119 | 0.153 | −0.054 | 0.24 | 0.16 | −0.26 |
Disclaimer/Publisher’s Note: The statements, opinions and data contained in all publications are solely those of the individual author(s) and contributor(s) and not of MDPI and/or the editor(s). MDPI and/or the editor(s) disclaim responsibility for any injury to people or property resulting from any ideas, methods, instructions or products referred to in the content. |
© 2023 by the authors. Licensee MDPI, Basel, Switzerland. This article is an open access article distributed under the terms and conditions of the Creative Commons Attribution (CC BY) license (https://creativecommons.org/licenses/by/4.0/).
Share and Cite
Zhu, H.; Zhang, B.; Chang, X.; Song, W.; Dai, J.; Li, J. A Study of Sandy Land Changes in the Chifeng Region from 1990 to 2020 Based on Dynamic Convolution. Sustainability 2023, 15, 12931. https://doi.org/10.3390/su151712931
Zhu H, Zhang B, Chang X, Song W, Dai J, Li J. A Study of Sandy Land Changes in the Chifeng Region from 1990 to 2020 Based on Dynamic Convolution. Sustainability. 2023; 15(17):12931. https://doi.org/10.3390/su151712931
Chicago/Turabian StyleZhu, Hongbo, Bing Zhang, Xinyue Chang, Weidong Song, Jiguang Dai, and Jia Li. 2023. "A Study of Sandy Land Changes in the Chifeng Region from 1990 to 2020 Based on Dynamic Convolution" Sustainability 15, no. 17: 12931. https://doi.org/10.3390/su151712931
APA StyleZhu, H., Zhang, B., Chang, X., Song, W., Dai, J., & Li, J. (2023). A Study of Sandy Land Changes in the Chifeng Region from 1990 to 2020 Based on Dynamic Convolution. Sustainability, 15(17), 12931. https://doi.org/10.3390/su151712931