Abstract
Non-intrusive load monitoring (NILM) has been on the rise for more than three decades. Its main objective is non-intrusive load disaggregation into individual operating appliances. Recent studies have shown that a higher sampling rate in the aggregated measurements allows better performance regarding load disaggregation. In addition, recent developments in deep learning and, in particular, convolutional neural networks (CNNs) have facilitated load disaggregation using CNN models. Several methods have been described in the literature that combine both a higher sampling rate and a CNN-based NILM framework. However, these methods use only a small number of cycles of the aggregated signal, which complicates the practical application of real-time NILM. In this work, a high sampling rate time-driven CNN-based NILM framework is also proposed. However, a novel current harmonic distortion image extracted from 60 cycles of the aggregated signal is proposed, resulting in 1 s appliance classification with low computational complexity. Appliance classification performance is evaluated using the PLAID3 dataset for both single and combined appliance operation. In addition, a comparison is made with a method from the literature. The results highlight the robustness of the novel feature and confirm the real-time applicability of the proposed NILM framework.
1. Introduction
The recent energy crisis and the need to reduce greenhouse gas emissions as much as possible to achieve net zero targets have made the concept of electrical energy savings a vital necessity [1]. The building sector, as one of the most significant participants in global electrical energy consumption, could play an important role in a more sustainable and energy-efficient future [2]. Recent studies have shown that awareness of electrical energy consumption is an important factor in energy savings. If consumers know in real time how much electrical energy they are using in their buildings, the total electrical energy savings could be as high as 9%. If this type of real-time consumption information is provided down to the appliance level, the total electrical energy savings could even exceed 12% [3].
The most appropriate approach to achieve the above goals and provide real-time energy breakdown to consumers at the appliance level is non-intrusive load monitoring (NILM). The main advantages of this approach, firstly introduced by Hart in 1992, are its low cost and effort, since the power consumption of each appliance is determined based only on aggregated measurements at the entrance of the electrical installation [4]. The mathematical formulation of the problem denotes that the total power consumption of an electrical installation at any time t is the sum of the power consumption of all individual operating appliances [5].
Since then, the development of NILM has been evolving rapidly. However, in recent years, NILM research has entered a new era of development, especially due to the exponential growth of deep learning models [6]. A common deep learning model for load disaggregation by NILM is the convolutional neural network (CNN). Although the use of CNNs was initially introduced as a model to meet the needs of the image recognition “industry”, their applications for load disaggregation are various [7]. The value of using CNN-based NILM frameworks has recently been highlighted in terms of the potential for increased performance and efficiency [8,9].
In the realm of deep neural network architectures for NILM, an innovative approach known as LDwA has been proposed in [10]. This architecture features a customized attention mechanism within the encoder–decoder framework, facilitating the extraction of appliance-specific power usage from aggregated signals. By combining convolutional and recurrent layers in the regression subnetwork, this model effectively identifies crucial features via the attention mechanism. Its deployment significantly enhances information extraction and utilization, as demonstrated through experimentation on real-world datasets, namely REDD and UK-DALE. Notably, the results exhibit substantial accuracy improvements and enhanced generalization capabilities compared to contemporary deep learning techniques.
Another noteworthy contribution involves the development of subtask gated networks, particularly effective for regression problems with on/off states, as presented in [11]. In the context of non-intrusive load monitoring, extensive evaluation on the REDD and UK-DALE datasets showcases the superiority of this approach. The proposed solution outperforms state-of-the-art deep learning methods by a notable margin when metrics such as MAE and SAEδ are considered. The integration of regression and classification subnetworks proves promising for enhancing regression tasks inherently characterized by on/off states.
In the domain of NILM, the algorithm has the potential to decipher the power consumption of individual household appliances through the analysis of overall household energy data. Exploiting limited input features, the methodology in [12] involves sliding windows and discrete wavelet transforms to extract diverse frequency bands. The subsequent neural network, incorporating one-dimensional convolution and bi-directional long short-term memory (LSTM), demonstrates predictive capabilities. Additionally, a classification network aligned with multi-task learning is designed to account for device switch states. The efficacy of this approach is demonstrated using the UK-DALE dataset. Key performance indicators such as FScore, mean absolute error, and signal aggregate error reflect significant improvements over prior methodologies.
Moreover, leveraging deep learning, another paper [13] introduces a non-intrusive load decomposition method, anchored in the CNN-LSTM hybrid model. This approach capitalizes on the spatial features of CNN and the temporal features of the LSTM network for non-intrusive load decomposition tasks. The model’s simplicity and power lie in its recognition of data feature extraction characteristics, particularly within the realm of time series data. This approach’s versatility is evidenced by its efficacy in scenarios where low-frequency data is predominant, enabling cost-effective instrumentation for aggregated load data acquisition. Furthermore, an innovative model evaluation employing Gaussian noise with varying signal-to-noise ratios tests the hybrid model’s robustness. The simulations on the UK public dataset UK-DALE confirm the model’s excellence in decomposition results and its superiority over other alternatives.
Furthermore, in a separate contribution detailed in [14], a novel NILM method is introduced that leverages advances in both unsupervised and supervised learning techniques. The approach features fully automated, unsupervised appliance state extraction inspired by Bayesian non-parametric learning. This aspect is particularly beneficial when power readings of appliances are available, yet their signature states are not. Empirical validation on the REDD dataset substantiates the model’s efficacy, with an ablation study confirming the contributions of each sub-module within the proposed NILM method.
In addition, recent developments in NILM suggest that a high sampling rate of the aggregated extracted signal, which is subsequently inserted into a NILM framework, could enable better load disaggregation performance [15]. This could be due to the fact that a higher sampling rate allows the transient and nonlinear behavior of electrical devices to be better represented in the aggregated measurements [16]. Moreover, the advent of smart devices, based mainly on power electronics, reflects a non-negligible amount of harmonics in the overall electrical signal [17]. Therefore, a higher sampling rate provides a better opportunity to capture the harmonic fingerprint of these devices, allowing an improved load disaggregation procedure.
In the context of using a higher sampling rate in a NILM framework based on a CNN model, the authors in [15] measure the instantaneous current signal and apply the proposed method every 16,640 samples thereof. Here, the 16,640-sample signal is reduced by an overall percentage of 15% to form an edge at both the end and the beginning of the signal, and then it is divided into 5 non-overlapping segments with duration of 10 network cycles per segment. Thus, for every 10 network cycles fed to the proposed CNN architecture, the output is the appliance event type classification. In another example in [18], the instantaneous steady-state current and voltage measurements are extracted and a search process for the zero crossing of the voltage follows. When the zero-crossing voltage is detected, a steady-state cycle of the instantaneous current and voltage measurements is extracted. Each of the extracted steady-state instantaneous current and voltage cycles is scaled to 48 values using a piecewise aggregated approximation (PAA). Each scaled steady-state instantaneous current and voltage cycle is converted to a recurrence plot. The recurrence plots are inserted into the proposed CNN architecture with spatial pyramid pooling (SPP), where the final output is inserted into a fully connected layer whose size corresponds to the number of classes to be classified in the appliance classification problem. Similarly, in [19], the instantaneous current is measured and its rms value is computed using a sliding window technique from 1 s windows with an overlap of 500 ms. Then, the derivative of the extracted rms value of the instantaneous current is calculated and the result is an impulsive signal. The pulses of the signal indicate transient states of the rms value of the instantaneous current. In other words, these pulses indicate the occurrence of an event. In the next step of the proposed method, this impulsive signal is processed using the short-time Fourier transform (STFT) with 200 ms windows and an overlap of 4/5 of the windows. The result of the aforementioned step is multiplied by the sign of the cumulative sum, which is evaluated on the rms value of the instantaneous current signal to distinguish turn-on and turn-off events. This process generates the instantaneous current spectrograms that are used as input to the proposed CNN-based architecture. The proposed network provides a 500 ms (25 cycles) response for an event or non-event occurrence, the type of event (on/off), and the type of appliance involved. A representative example of the recent trend to take advantage of the CNN architecture for load disaggregation application could also be the example in [20]. Here, the instantaneous current and voltage measurements with a duration of several cycles are used for the typical V-I image formation. Then, the V-I thresholds estimated by the particle swarm optimization (PSO) method are used to reconstruct the typical V-I image. Then, the reconstructed V-I image is introduced into the proposed CNN architecture with a residual unit for appliance classification.
However, apart from the benefits that a CNN-based NILM framework processing signals at a high sampling rate could provide for load disaggregation performance, NILM development should also consider the practical limitations in terms of real-time application. These practical limitations mainly concern the degree of computational complexity that characterizes the use of the developed NILM framework [21]. In other words, the computational complexity cannot be as high as possible. Firstly, the nature of high sampling rate signals leads to higher computational complexity in NILM application [22]. Secondly, due to their architecture and frequent use as an image processing model, CNNs are generally a complex solution for load disaggregation [23]. Consequently, the combined use of a higher sampling rate with respect to the input signal and a CNN-based NILM framework contributes to better load disaggregation performance on the one hand, and increases computational complexity on the other. Therefore, there is a need to find a balance between sufficient load disaggregation performance and tolerable computational complexity in the development of CNN-based high sampling rate NILM that can satisfy the real-time application.
In this sense, this study proposes a time-driven CNN-based NILM framework that is fed with instantaneous current measurements extracted at a high sampling rate. In light of the identified research need to find a tradeoff between sufficient appliance classification performance and tolerable computational complexity that enables a real-time NILM implementation, this work makes the following contributions:
- Presentation of a novel and robust feature extracted from high sampling rate current measurements. In particular, the percent harmonic distortion of third- () and fifth- () order current harmonics is computed and a novel image is formatted and studied in terms of appliance classification;
- Application of a CNN-based NILM framework that processes a larger number of current waveform cycles (60) to create the proposed image and perform appliance classification in real-time for 1 s windows. This approach keeps the computational complexity at a logical level due to the extended time window, while maintaining good appliance classification performance due to the robustness of the novel image.
2. High Sampling Rate Data
The public availability of high sampling rate measurements not only supports the development of high sampling rate NILM frameworks, but also allows researchers to benchmark their work [24]. In recent years, several public high sampling rate NILM datasets have emerged to meet this need. PLAID is one of these datasets and its latest version (PLAID3) was used in this study.
The PLAID3 dataset includes all previous PLAID datasets (PLAID and PLAID2). However, some measurements were removed under certain conditions, as described in [25]. This dataset consists of two parts. The first part is the sub-metered data and the second part is the aggregated data. In the aggregated data section, there are transient measurements of 12 appliances in combinations of up to 3 different appliances under certain conditions of the activation and deactivation of the appliances, within the combination. However, there is only one combination measurement per specific condition. The appliances used for this type of aggregated measurements concern 12 out of 16 total available appliance types. The sampling rate is 30 kHz, the measurements took place in a laboratory, there is only one appliance of each appliance type within the combination, and some measurements concern different modes of operation of an appliance within the combination (e.g., soldering iron). In conclusion, there are 576 combination measurements of instantaneous aggregated current and voltage. The duration of the aggregated consumption data ranges from 10 to 30 s, including activation, steady state, and deactivation. Finally, it is to be noted that the content of the dataset is not balanced with respect to the different types of appliances.
The selection of this high sampling rate NILM dataset resulted from a twofold necessity. The first states that a practical NILM development should incorporate the combined operation of appliances, while the second states that the true labels regarding the operation of appliances should be provided with a high degree of confidence by time-stamped events to avoid bias errors during training and testing [26]. Apparently, the PLAID3 dataset satisfies these two requirements for practical and reliable development of a high sampling rate NILM framework.
3. Current Harmonic Distortion Image Extraction
The mathematical definition of the problem solved by the NILM approach can be found in (1), where the total power consumption () of an electrical installation at any time (t) is the sum of the power consumption of all the individual operating appliances (, in the installation regarding the same time (t) [5]:
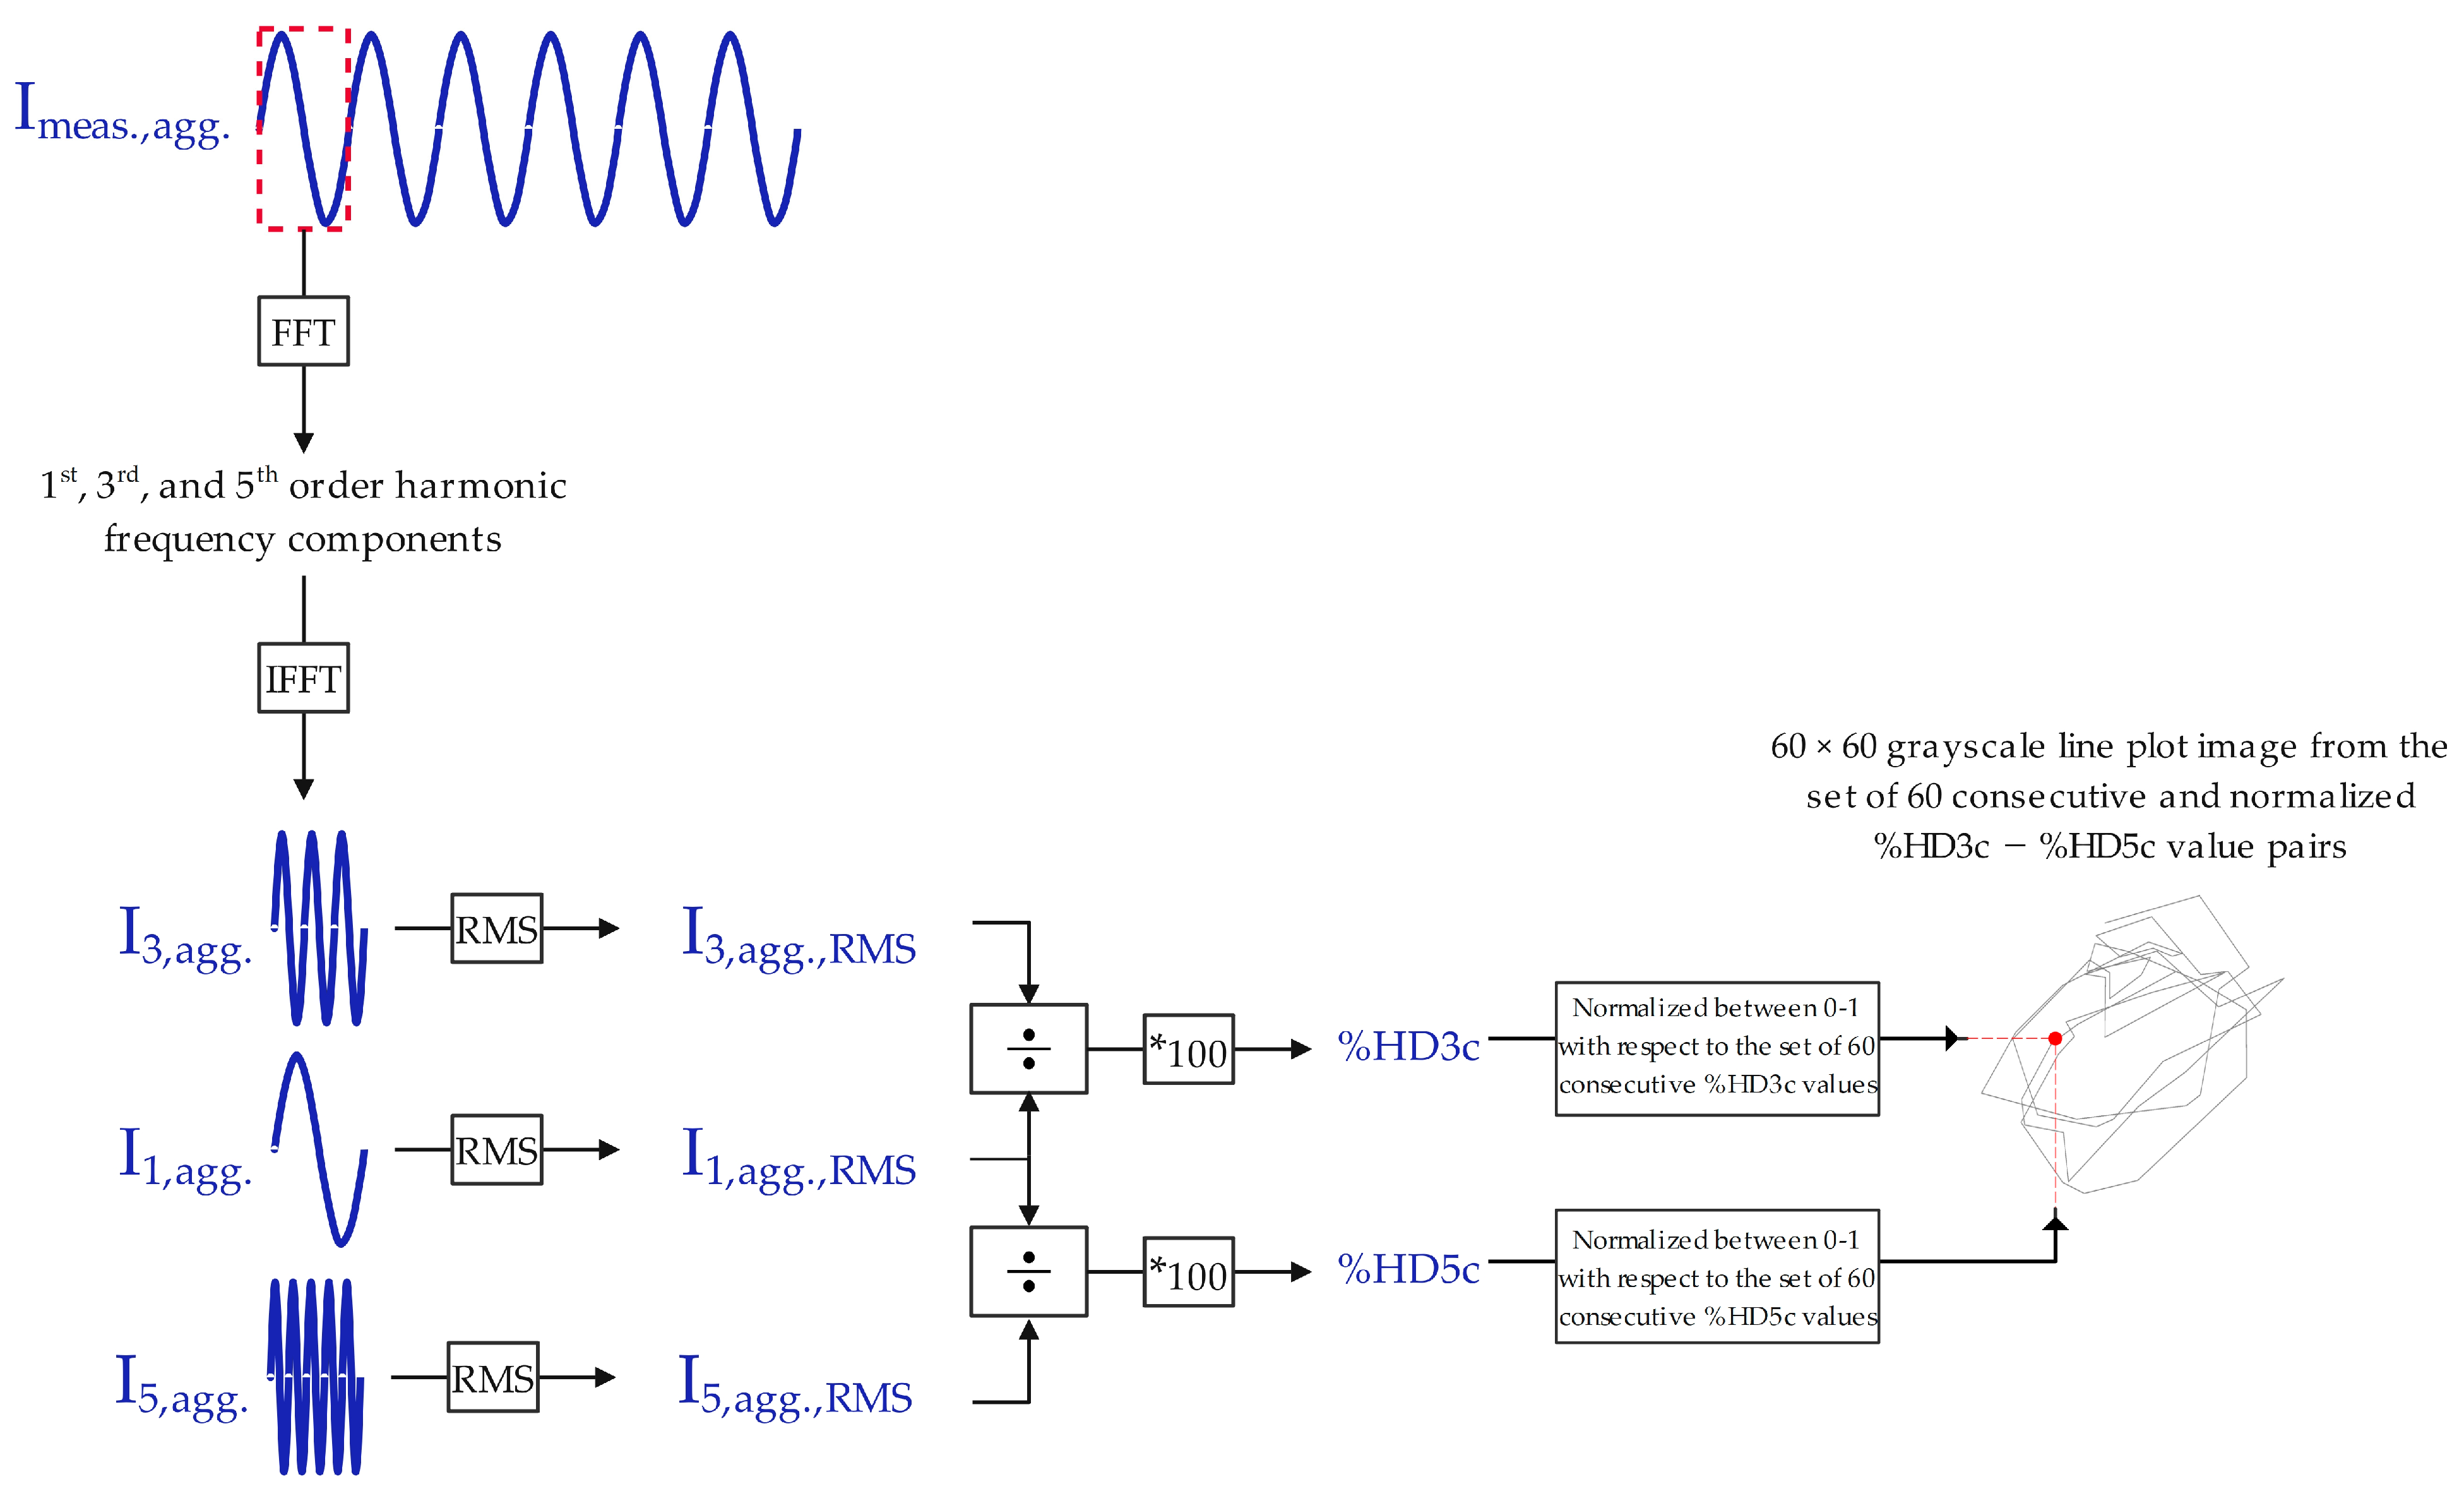
Feature extraction is an essential part of NILM implementation [27]. In particular, in the high-frequency domain, to which this study belongs, it is common for the high sampling rate measurements of instantaneous current and voltage to be used for high-frequency feature extraction [28,29]. Similarly, in this work, the instantaneous aggregated current measurements provided by the PLAID3 dataset were used to extract the novel high-frequency feature called “the current harmonic distortion image”.
In the first stage, the fast Fourier transform (FFT) was applied to the instantaneous aggregated current measurements every 500 samples (1 cycle). This is derived from (2):
where 30,000 is the sampling frequency (Hz) used to develop the PLAID3 dataset and 60 is the fundamental frequency (Hz) of the power grid where PLAID3 development took place (United States). FFT application to each cycle of the instantaneous aggregated current waveform was performed to extract the harmonic frequency component per cycle with respect to the fundamental, third, and fifth order. Then, the harmonic frequency components per cycle were used with the inverse fast Fourier transform (IFFT) to reconstruct the aggregated current harmonic waveforms of the fundamental, third, and fifth order of the instantaneous aggregated current measurements per cycle.
In the next step, the reconstructed aggregated fundamental, third-order, and fifth-order current harmonic waveforms were used to calculate the rms value of these waveforms every 500 samples as well. Obviously, this was similar to calculating the rms value per cycle. Moving forward, these rms values per cycle were used to calculate the per cycle percent third- and fifth-order harmonic distortion, as shown in (3) and (4), respectively:
where , , and are the rms values per cycle of the reconstructed aggregate waveforms of the fundamental, third, and fifth current harmonics respectively.
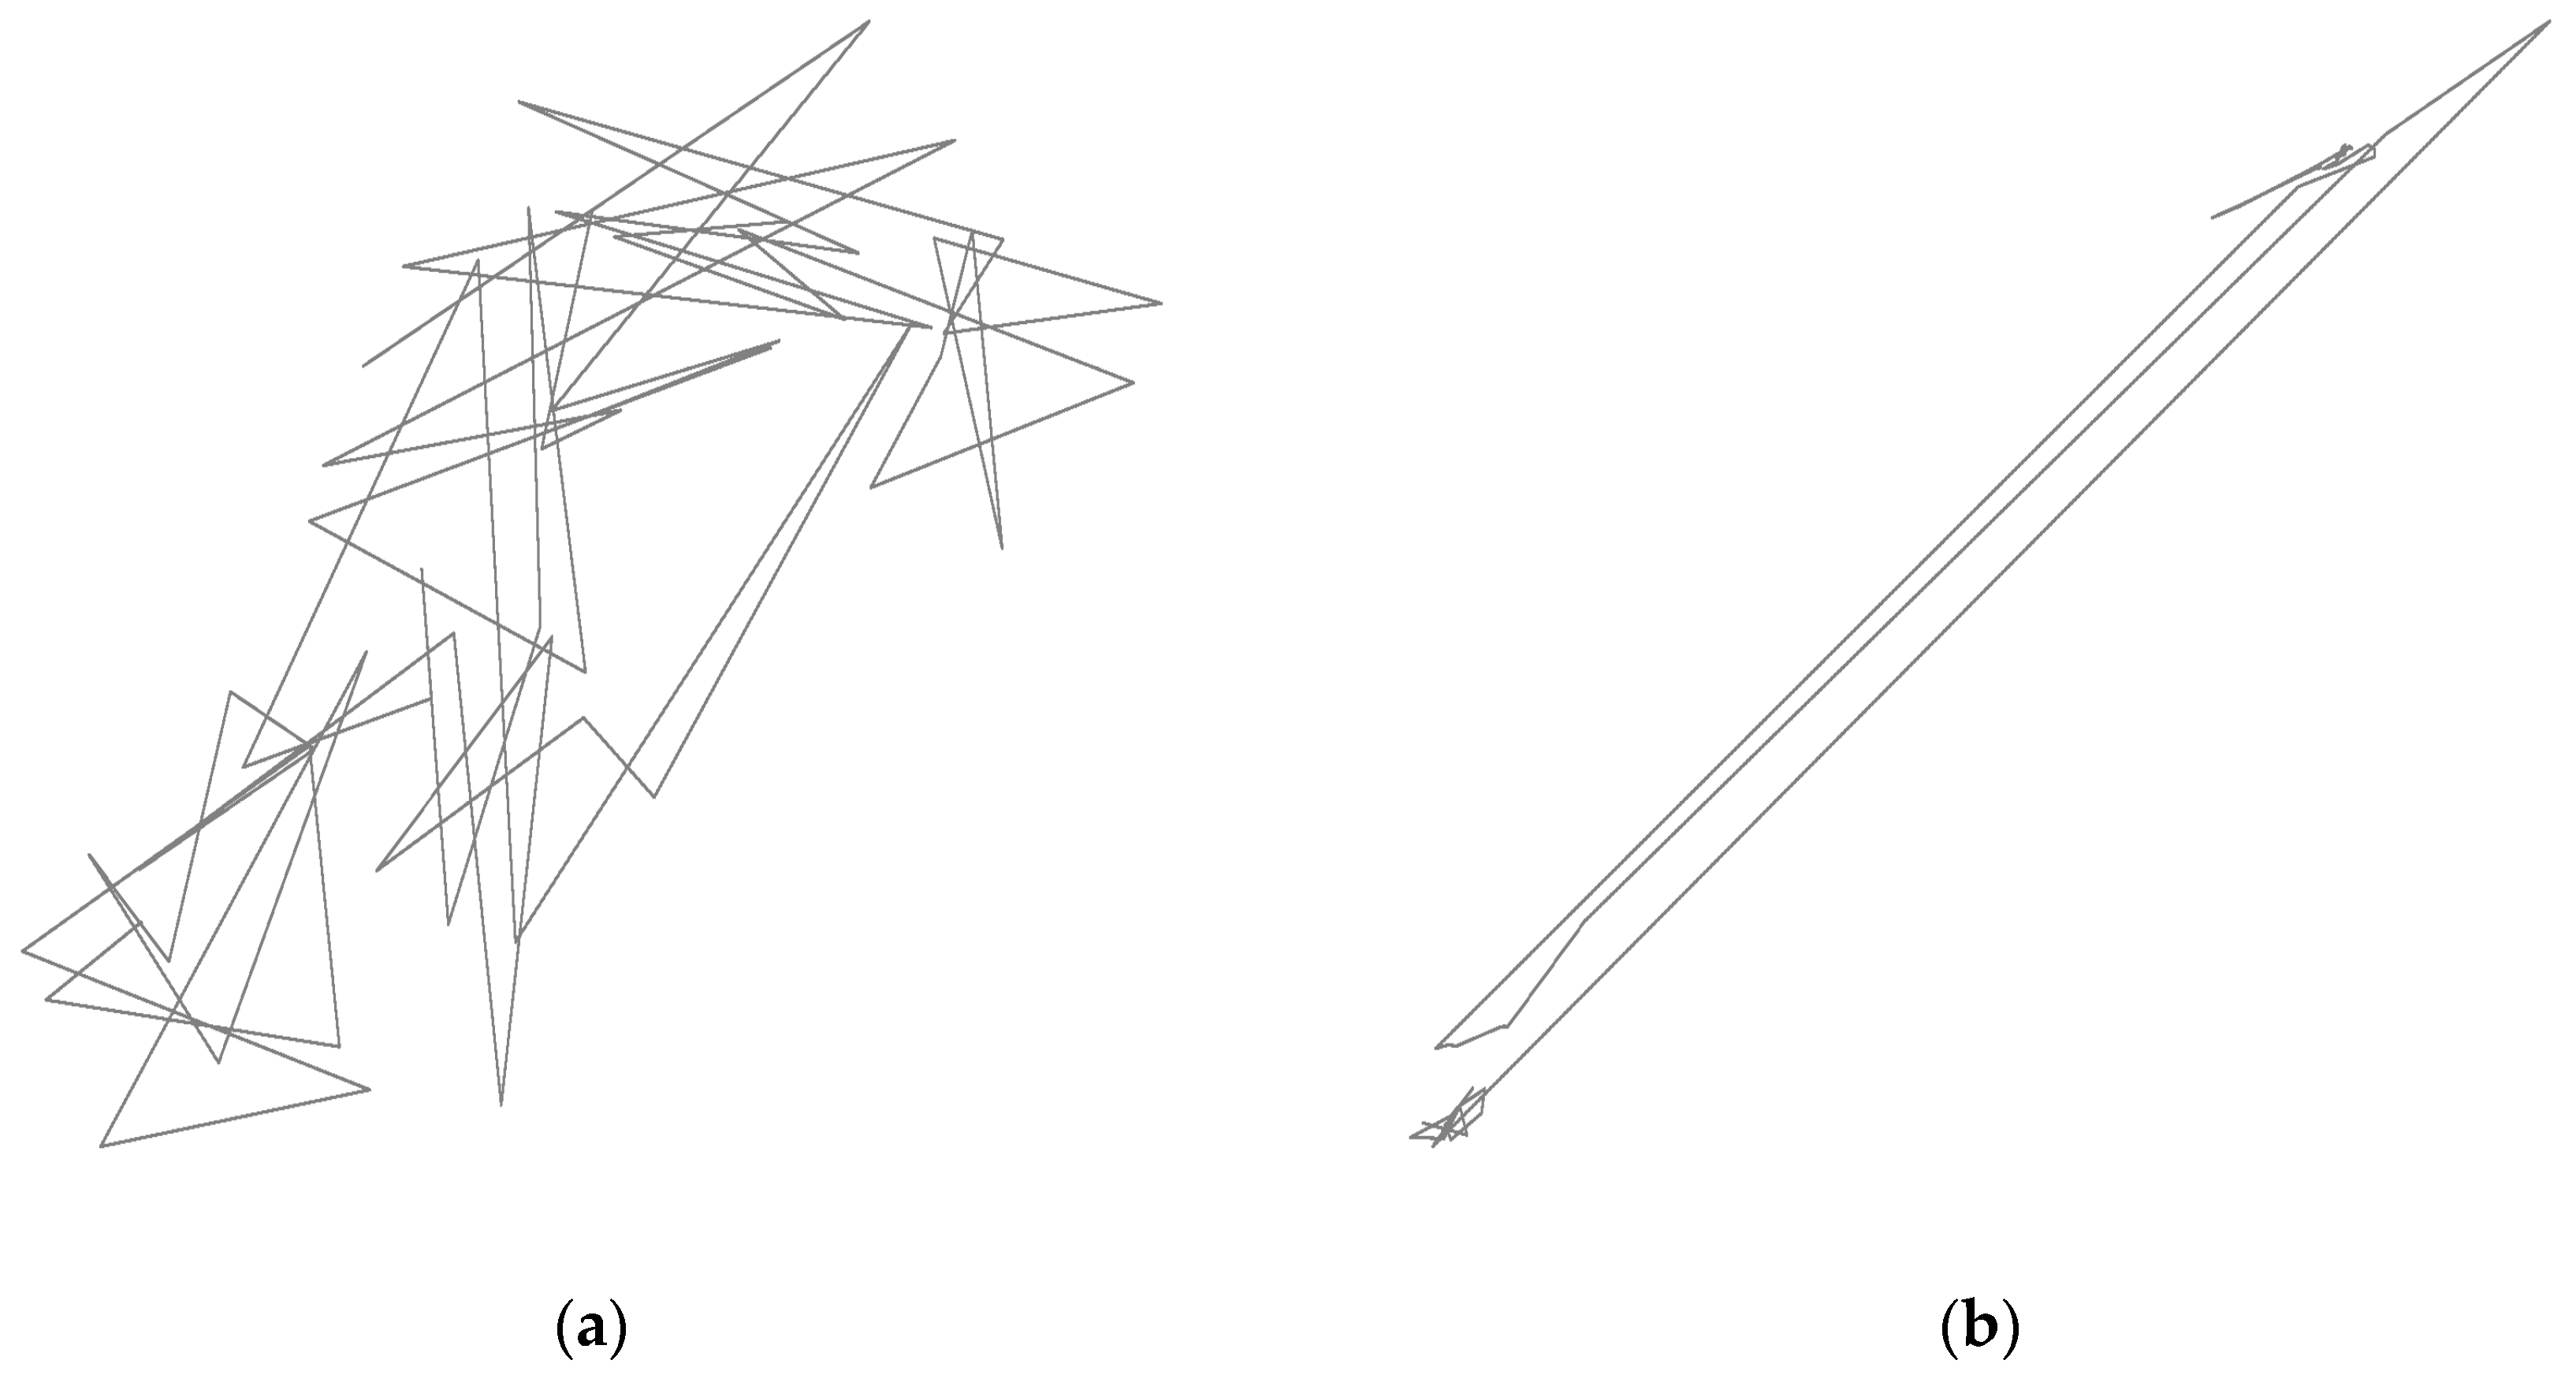
In the last phase, 60 consecutive values of and were used after normalization between 0-, to create the grayscale line plot image. This was performed in respect to the 60 consecutive values of and , respectively. This image captures their relative temporal change for 1 s. Figure 1 and Figure 2 provide some representative examples of these images with the corresponding operation of the appliances from which they were extracted. The entire process of extracting current harmonic distortion images is shown in Figure 3.
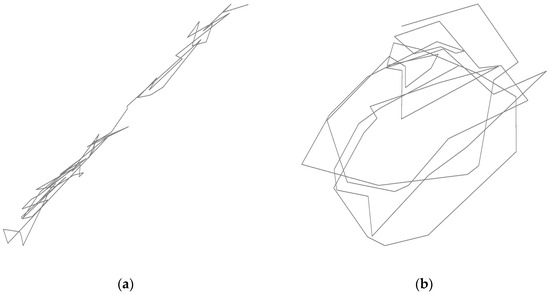
Figure 1.
Normalized grayscale images of combined operation of appliances: (a) Air conditioner and laptop; (b) Fridge and hair iron.

Figure 2.
Normalized grayscale images of single operation of appliances: (a) Air conditioner; (b) Laptop.
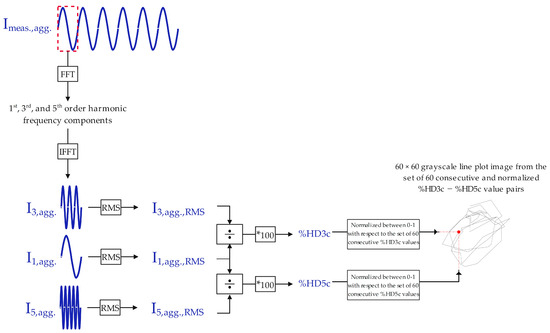
Figure 3.
Current harmonic distortion image extraction process.
4. Proposed CNN Architecture
In this work, a subtype of neural networks, named CNN, is used, due to its capability of recognizing patterns in images in respective classification problems. CNNs can process large amounts of data, producing highly accurate predictions. They have been designed in a way that enables them to learn spatial hierarchies of features automatically and adaptively. It can be assumed that they use many identical copies of the same neuron, which makes it possible for the network to handle large computational models, maintaining a small number of parameters [30].
In this paper, we classify the current harmonic distortion images extracted from the PLAID3 dataset through the proposed CNN. The images are related to the operation of household appliances and belong to four classes that can be distinguished in (a) single appliance operation and (b) the simultaneous operation of two appliances. The proposed network, which is shown in Figure 4, consists of twelve different layers, which are described below. As far as the parameters are concerned, the batch size used for training is equal to 32, meaning that the model is updated after processing every batch of 32 images. The model is being trained for 15 epochs, i.e., passes through all the training samples. Adam is chosen as an optimizer algorithm, using adaptive learning rates, with an initial value set to 0.001. For the tuning of the parameters, the values suggested by the literature were subjected to “trial and error” tests, in order for the ones that showed the best performance of the model to be finally selected.
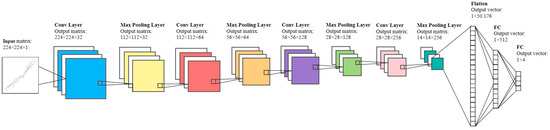
Figure 4.
Structure of the proposed CNN.
The proposed model comprises the following layers:
- (1)
- Input Layer: This anticipates the vectors that represent the grayscale images. The actual dimensions of the images are quite large (1548 × 1548), which will slow down the operation of the network and will probably require a large memory capacity. For this reason, the images are reconstructed, and the final dimensions are converted to 224 × 224. Then, the downsized images are subjected to reshaping, in which they are converted into vectors of dimensions (224 × 224, 1), with their pixel values. This is followed by standardization, which is practically a division by 255, i.e., the maximum number of pixels, if the data are images. Its purpose is to reduce the values of the vectors (between zero and one), so that the calculations are easier to be implemented, in less time.
- (2)
- Convolutional Layer 1: This is the basic building block of a CNN. Most of the computations, and specifically the operation of convolution, are implemented in this layer. The convolution process involves a kernel or filter, which moves over the input data, extracting all the features. The final output is known as a feature map. Finally, the image is converted into numerical values, allowing the CNN to interpret it and extract patterns from it. In this layer, there are 32 filters of size 3 × 3 and the activation function ReLU is applied. The size of the stride is (1, 1). The size of the extracted feature map is (224, 224, 32). The dimensions have been maintained because the method of same padding has been used, preventing information loss from the edges of the input image.
- (3)
- Max Pooling Layer 1: This layer follows the convolutional layer, with the aim of reducing the size of the feature map, in order to decrease the computational cost. This is achieved by reducing the number of connections between layers. Depending on the method that is used, there are different types of pooling layers. At Maximum (Max) Pooling, the maximum values are obtained from the feature map, while at Average Pooling, the average of the values is calculated and obtained. In this layer, pooling with size 2 × 2 has been used. The dimensions of the extracted feature map are (112, 112, 32).
- (4)
- Convolutional Layer 2: In this layer, there are 64 filters of size 3 × 3 and the activation function ReLU is applied. The size of the stride is (1, 1). The size of the extracted feature map is (112, 112, 64). The dimensions have been maintained because the method of the same padding has been used.
- (5)
- Max Pooling Layer 2: This performs pooling with size 2 × 2. The dimensions of the extracted feature map are (56, 56, 64).
- (6)
- Convolutional Layer 3: In this layer, there are 128 filters of size 3 × 3 and the activation function ReLU is applied. The size of the stride is (1, 1). The size of the extracted feature map is (56, 56, 128). The dimensions have been maintained because the method of the same padding has been used.
- (7)
- Max Pooling Layer 3: This performs pooling with size 2 × 2. The dimensions of the extracted feature map are (28, 28, 128).
- (8)
- Convolutional Layer 4: In this layer, there are 256 filters of size 3 × 3 and the activation function ReLU is applied. The size of the stride is (1, 1). The size of the extracted feature map is (28, 28, 256). The dimensions have been maintained because the method of the same padding has been used.
- (9)
- Max Pooling Layer 4: This performs pooling with size 2 × 2. The dimensions of the extracted feature map are (14, 14, 256).
- (10)
- Flatten Layer: This converts the 3-D output of the previous layer to a 1-D vector, preparing it for the fully connected layers. The dimensions are not affected.
- (11)
- Fully Connected Layer 1: This includes 512 neurons and implements the ReLU activation function. This layer is used to introduce nonlinearity, through the activation function, and to learn higher level features. The number of neurons is adjusted based on the complexity of the network.
- (12)
- Fully Connected Layer 2: This includes four neurons and implements the Softmax activation function, so as to make the prediction. The Softmax function is basically selected and applied for classification problems in which each input corresponds to one output (multi-class problem) and is defined in (5) [19]. The number of neurons is equal to the number of classes. The activation function normalizes the output values to a probability distribution among the classes, and the model makes the predictions by selecting the class with the highest probability.
5. Results and Discussion
In this section, there are shown some representative results regarding the household load disaggregation based on the high sampling rate measurements contained in the dataset PLAID3. In this part, the aim is to highlight and benchmark evaluate the robustness of the novel current harmonic distortion images that can be used by a CNN model and facilitate the classification of household appliances in real time.
The results are divided into two different scenarios of participating appliances regarding the training and, of course, testing the process of the proposed CNN model, as shown in Table 1. More specifically, in the two scenarios, the current harmonic distortion images were extracted by the proposed method, regarding the single and combined operation of the appliances. It should be noted that the images were rearranged before use so that they were subsequently randomly distributed among the training and test sets, resulting in unbiased training. The distribution was carried out according to the usual 80–20 method, i.e., 80% of the images were included in the training set and 20% in the test set [31,32]. This method was used because the dataset was much smaller than that typically required by a CNN and should be better utilized in the training part.

Table 1.
Examined appliance classification.
The concept for selecting the above scenarios was based firstly on including the combined operation of appliances for which the PLAID3 dataset provides measurements at a high sampling rate. As mentioned above, the simultaneous operation of appliances is a common fact in the real world. On the other hand, it was also necessary to include single appliance operation to allow a comparison with studies that used an older version of the PLAID dataset, where only single appliance operation was measured.
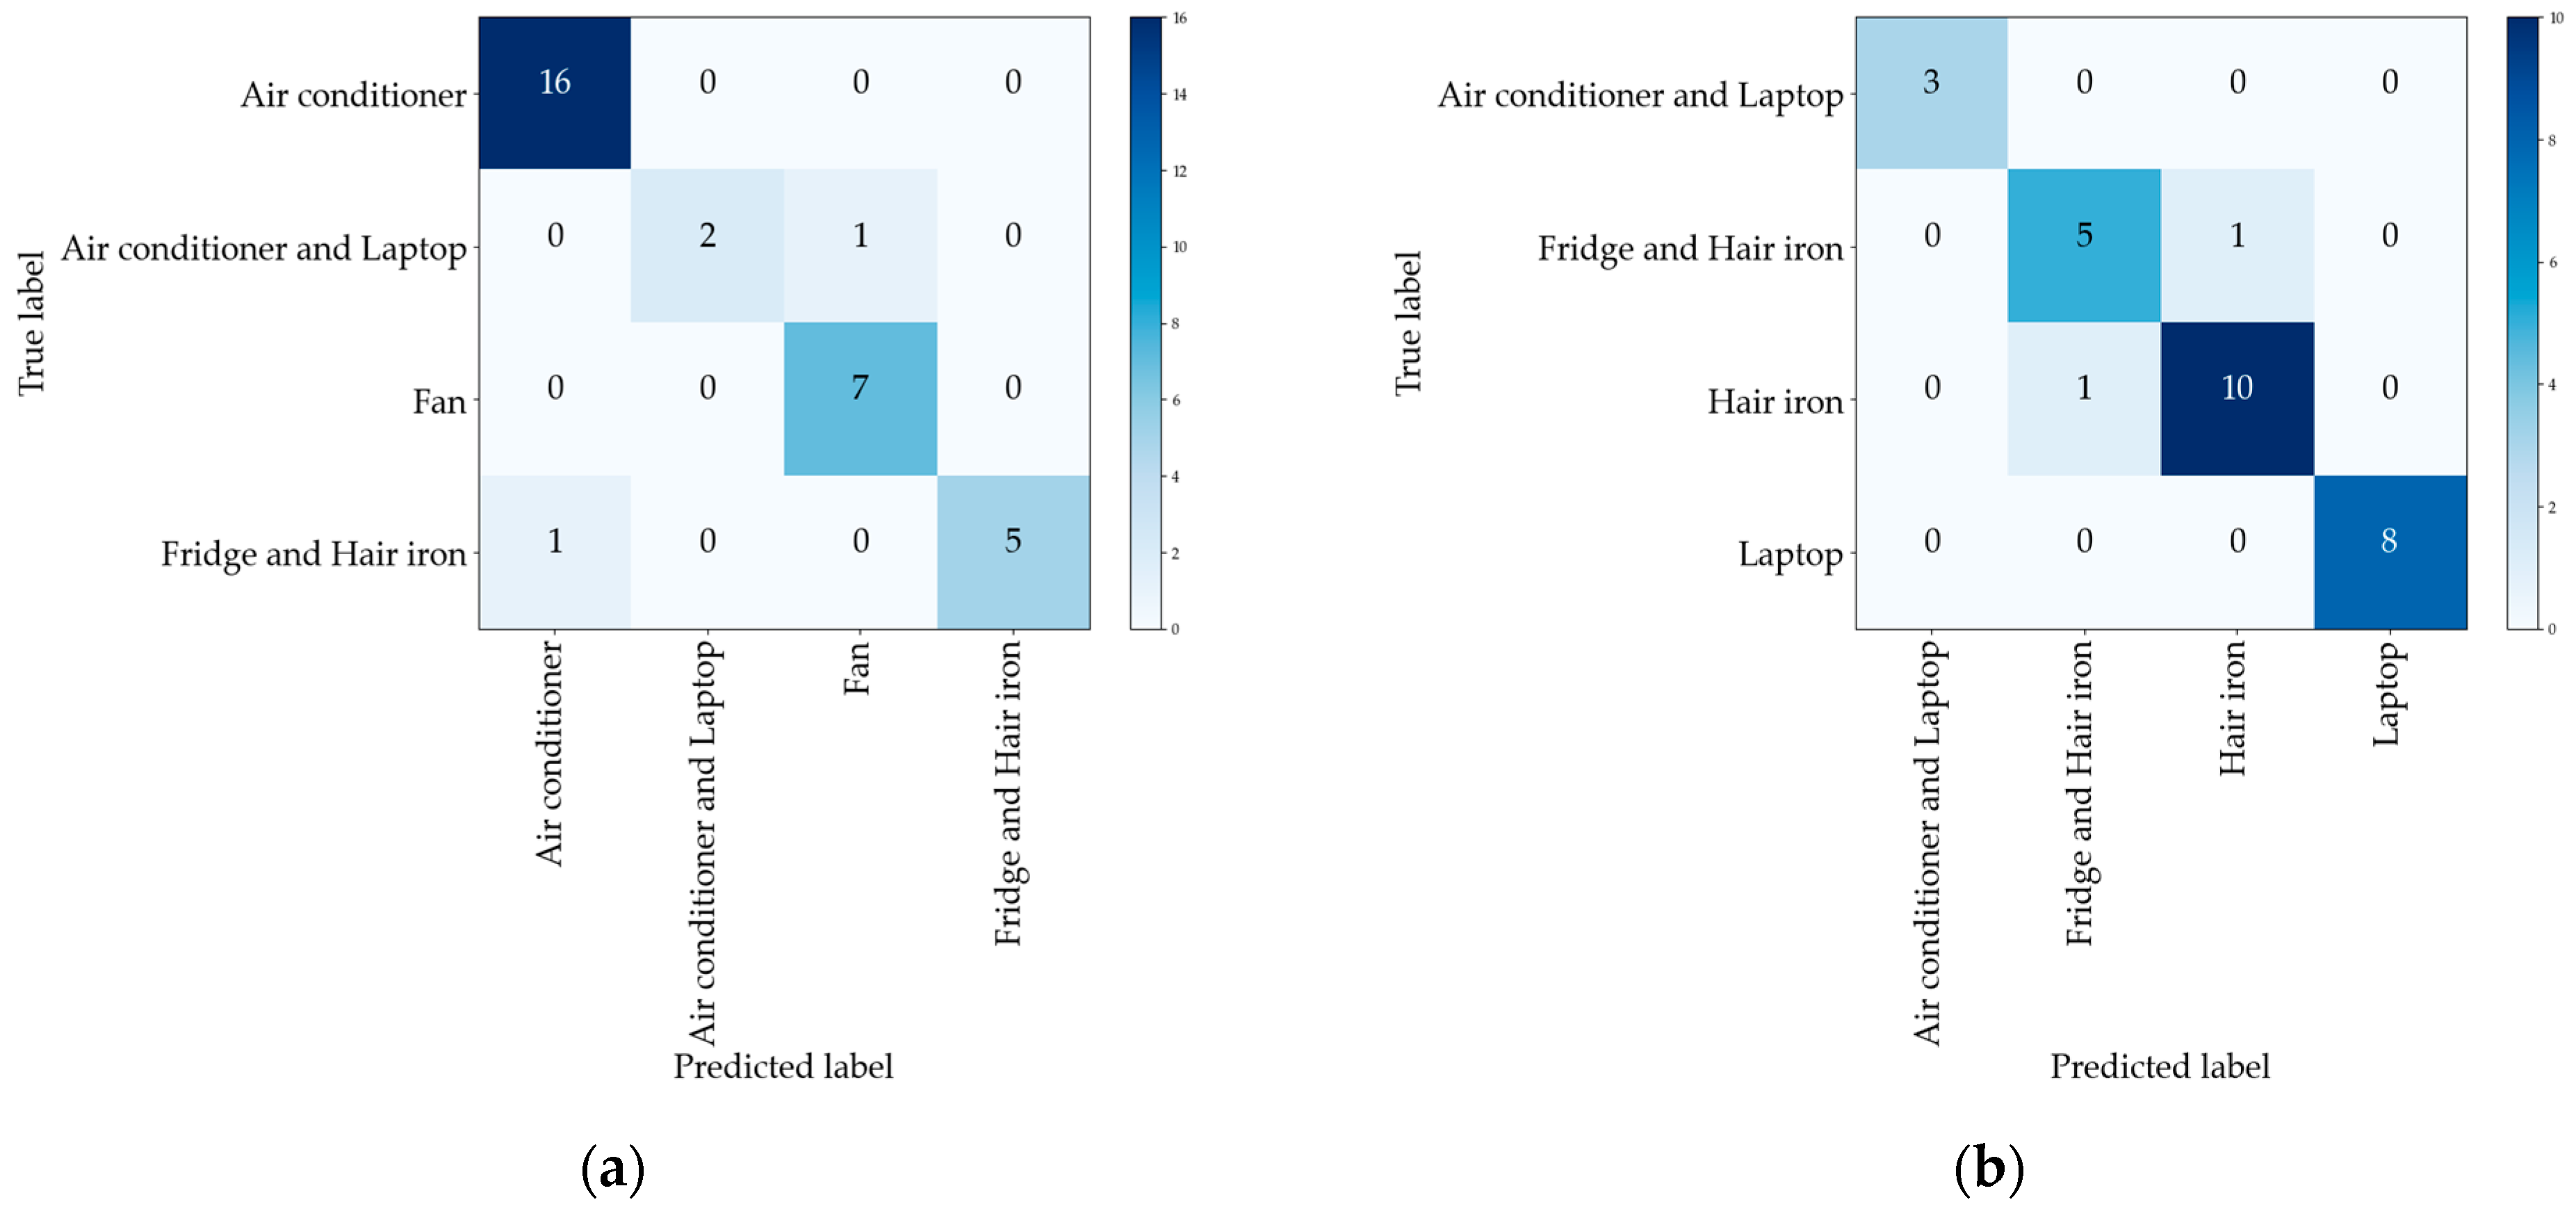
The performance evaluation in terms of appliance classification in both scenarios was performed using the well-known multi-class Precision, Recall, and FScore metrics. For the overall fair evaluation of the scenarios in terms of appliance classification, the micro variants of the multi-class Precision, Recall, and FScore are used, as presented in (6)–(8) [33]. The results are summarized in Table 2. For a more detailed overview of the appliance classification performance for both scenarios, the confusion matrices are shown in Figure 5.
where , , and are the number of true positives, false positives, and false negatives, respectively, for the output label i. L is the number of output labels.
Table 2.
Performance metrics for PLAID3.

Figure 5.
Confusion matrices: (a) Scenario 1; (b) Scenario 2.
The results show that, despite the significantly lower number of available images for adequate CNN model training, the performance is robust. For example, in Scenario 2, the only classification errors are those between the single operation of the hair iron and the simultaneous operation of the fridge and hair iron. The performance is also comparable to studies that used a larger number of images. The difference in the number of images results from the use of 60 cycles from the aggregated measurements to extract the current harmonic distortion image in this study, unlike other studies that used a much smaller number of cycles for appliance classification. A representative comparative example can be found in Table 3. At this point, it should be noted that a limited number of cycles was used for the corresponding image extraction in [20] in contrast to the 60 cycles used for the current harmonic distortion image extraction for 1 s driven appliance classification in the current study.
Table 3.
Comparison results for PLAID.
The real-time capability of the proposed NILM framework is confirmed by Table 4, which shows the execution time for all the intermediate steps. This aspect of the proposed methodology is crucial because it could support the efficiency of Energy Management Systems (EMSs) in buildings and enhance the sustainability of methodologies and schemes that support energy efficiency under Demand Side Management (DSM). In such applications, it is quite important to have information about the consumption patterns of specific appliances. Thus, real- or near-real-time load identification could facilitate the efficient employment of DSM schemes in order to adjust load consumption with local power generation. The steps concern the use of the instantaneous aggregated current measurements for the calculation of 60 consecutive value pairs and the relative current harmonic distortion grayscale image extraction from the 60 consecutive and normalized value pairs. The last step concerns the introduction of the image into the already-trained CNN model for the corresponding appliance classification. In other words, the intermediate steps are the following:
Table 4.
Execution time per image.
- Step 1: 60 consecutive value pair calculation;
- Step 2: 1 current harmonic distortion grayscale image extraction from 60 consecutive and normalized value pairs;
- Step 3: 1 current harmonic distortion grayscale image classification.
The execution times reported are the average result for 10 current harmonic distortion images. All the experiments were performed on a laptop equipped with a 16 GB RAM, a 4-core (11th Gen Intel(R) Core(TM) i7-11370H @ 3.30GHz-3.00 GHz, Dell, Thessaloniki, Greece) CPU, and a 2-GB NVIDIA GeForce MX450 GPU.
Accordingly, the goal of the real-time appliance classification of 1 s can be easily achieved since the total execution time from providing the instantaneous current measurements to classifying the current harmonic distortion image is much less than 1 s. At the same time, as expected, the use of 60 cycles keeps the computational complexity at a tolerable level, so that practical application is possible.
6. Conclusions
Recent research related to the development of NILM suggests that a higher sampling rate could enable better performance in load disaggregation. In addition, the exponential growth of deep learning could not leave the development of NILM untouched. It introduced the ability to translate aggregated current and voltage measurements into images that could then be classified and associated with the operation of specific appliances. The main models that were used for image classification before the development of deep learning NILM are the CNNs. In the context of combining the benefits of higher sampling rate and the use of CNN models, a time-driven CNN-based NILM framework is proposed in this study to highlight the contribution that the novel current harmonic distortion grayscale image extraction could make to load disaggregation. The advantage of the proposed image extraction is twofold. Firstly, the use of high sampling rate measurements on the aggregated signal allows a better representation of the appliance operation from the aggregated signal. Secondly, the proposed image to be classified uses 60 consecutive cycles of the instantaneous aggregated current measurements, corresponding to a 1 s appliance classification under a tolerable computational complexity. Appliance classification results in scenarios based on data from the PLAID3 dataset highlight the robustness of the novel current harmonic distortion grayscale image. Despite the significantly reduced number of available images, the performance of the proposed method was comparable or proved to be better than a literature study that used a significantly higher number of images for the same dataset. Finally, the presented execution time in terms of average total appliance classification time required per image supports the ability of the proposed method to be used for real-time applicable load disaggregation.
The goal of developing a real-time applicable NILM could direct future work to the area of event detection and on how the same type of current harmonic distortion images could be extracted from appliances during events. In this way, the load disaggregation task could follow an event-driven approach that is even closer to a practical real-time NILM application. Finally, the power estimation regarding the identified appliances cannot be excluded from future research, which will lead to a completed real-time applicable NILM.
Author Contributions
Conceptualization, P.P. and A.S.B.; methodology, P.P.; software, P.P., D.M. and K.S.; validation, P.P., D.M. and K.S.; formal analysis, P.P.; investigation, P.P.; resources, P.P., D.M. and K.S.; writing—original draft preparation, P.P. and D.M.; writing—review and editing, P.P. and A.S.B.; visualization, P.P. and D.M.; supervision, A.S.B.; project administration, A.S.B.; funding acquisition, A.S.B. All authors have read and agreed to the published version of the manuscript.
Funding
We acknowledge support of this work by the project “Development of New Innovative LowCarbon Energy Technologies to Enhance excellence in the Region of Western Macedonia” (MIS 5047197) under the Action “Reinforcement of the Research and Innovation Infrastructure”, funded by the Operational Program “Competitiveness, Entrepreneurship and Innovation” (NSRF 2014–2020) and co-financed by Greece and the European Union (European Regional Development Fund).
Data Availability Statement
Current harmonic distortion images with the corresponding true labels, extracted from the PLAID3 dataset can be provided under request.
Conflicts of Interest
The authors declare no conflict of interest. The funders had no role in the design of the study; in the collection, analyses, or interpretation of data; in the writing of the manuscript; or in the decision to publish the results.
References
- Hoyo-Montaño, J.A.; Valencia-Palomo, G.; Galaz-Bustamante, R.A.; García-Barrientos, A.; Espejel-Blanco, D.F. Environmental Impacts of Energy Saving Actions in an Academic Building. Sustainability 2019, 11, 989. [Google Scholar] [CrossRef]
- Guyot, D.; Giraud, F.; Simon, F.; Corgier, D.; Marvillet, C.; Tremeac, B. Overview of the use of artificial neural networks for energy-related applications in the building sector. Int. J. Energy Res. 2019, 43, 6680–6720. [Google Scholar] [CrossRef]
- Gopinath, R.; Kumar, M.; Prakash Chandra Joshua, C.; Srinivas, K. Energy management using non-intrusive load monitoring techniques—State-of-the-art and future research directions. Sustain. Cities Soc. 2020, 62, 102411. [Google Scholar] [CrossRef]
- Hart, G.W. Nonintrusive appliance load monitoring. Proc. IEEE 1992, 80, 1870–1891. [Google Scholar] [CrossRef]
- Liaqat, R.; Sajjad, I.A. An Event Matching Energy Disaggregation Algorithm Using Smart Meter Data. Electronics 2022, 11, 3596. [Google Scholar] [CrossRef]
- Moradzadeh, A.; Zakeri, S.; Oraibi, W.A.; Mohammadi-Ivatloo, B.; Abdul-Malek, Z.; Ghorbani, R. Non-Intrusive Load Monitoring of Residential Loads via Laplacian Eigenmaps and Hybrid Deep Learning Procedures. Sustainability 2022, 14, 14898. [Google Scholar] [CrossRef]
- Medeiros, A.; Canha, L.; Bertineti, D.; De Azevedo, R. Event classification in non-intrusive load monitoring using convolutional neural network. In Proceedings of the 2019 IEEE PES Innovative Smart Grid Technologies Conference-Latin America (ISGT Latin America), Gramado, Brazil, 15–18 September 2019; pp. 1–6. [Google Scholar]
- Athanasiadis, C.; Doukas, D.; Papadopoulos, T.; Chrysopoulos, A. A Scalable Real-Time Non-Intrusive Load Monitoring System for the Estimation of Household Appliance Power Consumption. Energies 2021, 14, 767. [Google Scholar] [CrossRef]
- Fang, Y.; Jiang, S.; Fang, S.; Gong, Z.; Xia, M.; Zhang, X. Non-Intrusive Load Disaggregation Based on a Feature Reused Long Short-Term Memory Multiple Output Network. Buildings 2022, 12, 1048. [Google Scholar] [CrossRef]
- Piccialli, V.; Sudoso, A.M. Improving Non-Intrusive Load Disaggregation through an Attention-Based Deep Neural Network. Energies 2021, 14, 847. [Google Scholar] [CrossRef]
- Shin, C.; Joo, S.; Yim, J.; Lee, H.; Moon, T.; Rhee, W. Subtask Gated Networks for Non-Intrusive Load Monitoring. In Proceedings of the AAAI Conference on Artificial Intelligence, Honolulu, HI, USA, 27 January–1 February 2019; Volume 33, pp. 1150–1157. [Google Scholar] [CrossRef]
- Luo, J.; Liu, S.; Cai, Z.; Xiong, C.; Tu, G. A multi-task learning model for non-intrusive load monitoring based on discrete wavelet transform. J. Supercomput. 2023, 79, 9021–9046. [Google Scholar] [CrossRef]
- Zhou, X.; Feng, J.; Li, Y. Non-intrusive load decomposition based on CNN-LSTM hybrid deep learning model. Energy Rep. 2021, 7, 5762–5771. [Google Scholar] [CrossRef]
- Fang, Z.; Zhao, D.; Chen, C.; Li, Y.; Tian, Y. Non-Intrusive Appliance Identification with Appliance-Specific Networks. IEEE Trans. Ind. Appl. 2020, 56, 3443–3452. [Google Scholar] [CrossRef]
- da Silva Nolasco, L.; Lazzaretti, A.E.; Mulinari, B.M. DeepDFML-NILM: A new CNN-based architecture for detection, feature extraction and multi-label classification in NILM signals. IEEE Sens. J. 2021, 22, 501–509. [Google Scholar] [CrossRef]
- Schirmer, P.A.; Mporas, I. Double Fourier integral analysis based convolutional neural network regression for high-frequency energy disaggregation. IEEE Trans. Emerg. Top. Comput. Intell. 2021, 6, 439–449. [Google Scholar] [CrossRef]
- Ghosh, S.; Chatterjee, A.; Chatterjee, D. An improved load feature extraction technique for smart Homes using fuzzy-based NILM. IEEE Trans. Instrum. Meas. 2021, 70, 1–9. [Google Scholar] [CrossRef]
- Wenninger, M.; Bayerl, S.P.; Maier, A.; Schmidt, J. Recurrence plot spacial pyramid pooling network for appliance identification in non-intrusive load monitoring. In Proceedings of the 2021 20th IEEE International Conference on Machine Learning and Applications (ICMLA), Pasadena, CA, USA, 13–16 December 2021; pp. 108–115. [Google Scholar]
- Ciancetta, F.; Bucci, G.; Fiorucci, E.; Mari, S.; Fioravanti, A. A new convolutional neural network-based system for NILM applications. IEEE Trans. Instrum. Meas. 2020, 70, 1–12. [Google Scholar] [CrossRef]
- Jia, D.; Li, Y.; Du, Z.; Xu, J.; Yin, B. Non-intrusive load identification using reconstructed voltage–current images. IEEE Access 2021, 9, 77349–77358. [Google Scholar] [CrossRef]
- Yan, L.; Sheikholeslami, M.; Gong, W.; Tian, W.; Li, Z. Challenges for real-world applications of nonintrusive load monitoring and opportunities for machine learning approaches. Electr. J. 2022, 35, 107136. [Google Scholar] [CrossRef]
- Yan, L.; Tian, W.; Han, J.; Li, Z. Event-driven two-stage solution to non-intrusive load monitoring. Appl. Energy 2022, 311, 118627. [Google Scholar] [CrossRef]
- de Aguiar, E.L.; Lazzaretti, A.E.; Mulinari, B.M.; Pipa, D.R. Scattering Transform for Classification in Non-Intrusive Load Monitoring. Energies 2021, 14, 6796. [Google Scholar] [CrossRef]
- Iqbal, H.K.; Malik, F.H.; Muhammad, A.; Qureshi, M.A.; Abbasi, M.N.; Chishti, A.R. A critical review of state-of-the-art non-intrusive load monitoring datasets. Electr. Power Syst. Res. 2021, 192, 106921. [Google Scholar] [CrossRef]
- Medico, R.; De Baets, L.; Gao, J.; Giri, S.; Kara, E.C.; Dhaene, T.; Develder, C.; Berges, M.E.; Deschrijver, D. A voltage and current measurement dataset for plug load appliance identification in households. Sci. Data 2020, 7, 49. [Google Scholar] [CrossRef] [PubMed]
- Held, P.; Mauch, S.; Saleh, A.; Benyoucef, D.; Abdeslam, D.O. Held1: Home equipment laboratory dataset for non-intrusive load monitoring. In Proceedings of the SIGNAL 2018 Third International Conference on Advances in Signal, Image and Video Processing, Nice, France, 20–24 May 2018; Volume 23. [Google Scholar]
- Lytras, M.D.; Chui, K.T. The Recent Development of Artificial Intelligence for Smart and Sustainable Energy Systems and Applications. Energies 2019, 12, 3108. [Google Scholar] [CrossRef]
- de Souza, W.A.; Garcia, F.D.; Marafão, F.P.; da Silva, L.C.P.; Simões, M.G. Load Disaggregation Using Microscopic Power Features and Pattern Recognition. Energies 2019, 12, 2641. [Google Scholar] [CrossRef]
- Faustine, A.; Pereira, L. Multi-Label Learning for Appliance Recognition in NILM Using Fryze-Current Decomposition and Convolutional Neural Network. Energies 2020, 13, 4154. [Google Scholar] [CrossRef]
- Albawi, S.; Mohammed, T.A.; Al-Zawi, S. Understanding of a convolutional neural network. In Proceedings of the 2017 International Conference on Engineering and Technology (ICET), Antalya, Turkey, 21–23 August 2017; pp. 1–6. [Google Scholar]
- Chen, T.; Qin, H.; Li, X.; Wan, W.; Yan, W. A Non-Intrusive Load Monitoring Method Based on Feature Fusion and SE-ResNet. Electronics 2023, 12, 1909. [Google Scholar] [CrossRef]
- Wang, Z.; Wang, W.; Zhang, Z.; Hu, F.; Xia, X.; Chen, L. DeepEdge: A Novel Appliance Identification Edge Platform for Data Gathering, Capturing and Labeling. Sensors 2022, 22, 2432. [Google Scholar] [CrossRef]
- Buddhahai, B.; Korkua, S.K.; Rakkwamsuk, P.; Makonin, S. A Design and Comparative Analysis of a Home Energy Disaggregation System Based on a Multi-Target Learning Framework. Buildings 2023, 13, 911. [Google Scholar] [CrossRef]


Disclaimer/Publisher’s Note: The statements, opinions and data contained in all publications are solely those of the individual author(s) and contributor(s) and not of MDPI and/or the editor(s). MDPI and/or the editor(s) disclaim responsibility for any injury to people or property resulting from any ideas, methods, instructions or products referred to in the content. |
© 2023 by the authors. Licensee MDPI, Basel, Switzerland. This article is an open access article distributed under the terms and conditions of the Creative Commons Attribution (CC BY) license (https://creativecommons.org/licenses/by/4.0/).