

Influence of Opposing Exterior Window Geometry on the Carbon Emissions of Indoor Lighting under the Combined Effect of Natural Lighting and Artificial Lighting in the City of Shenyang, China
Abstract
:1. Introduction
2. Methods
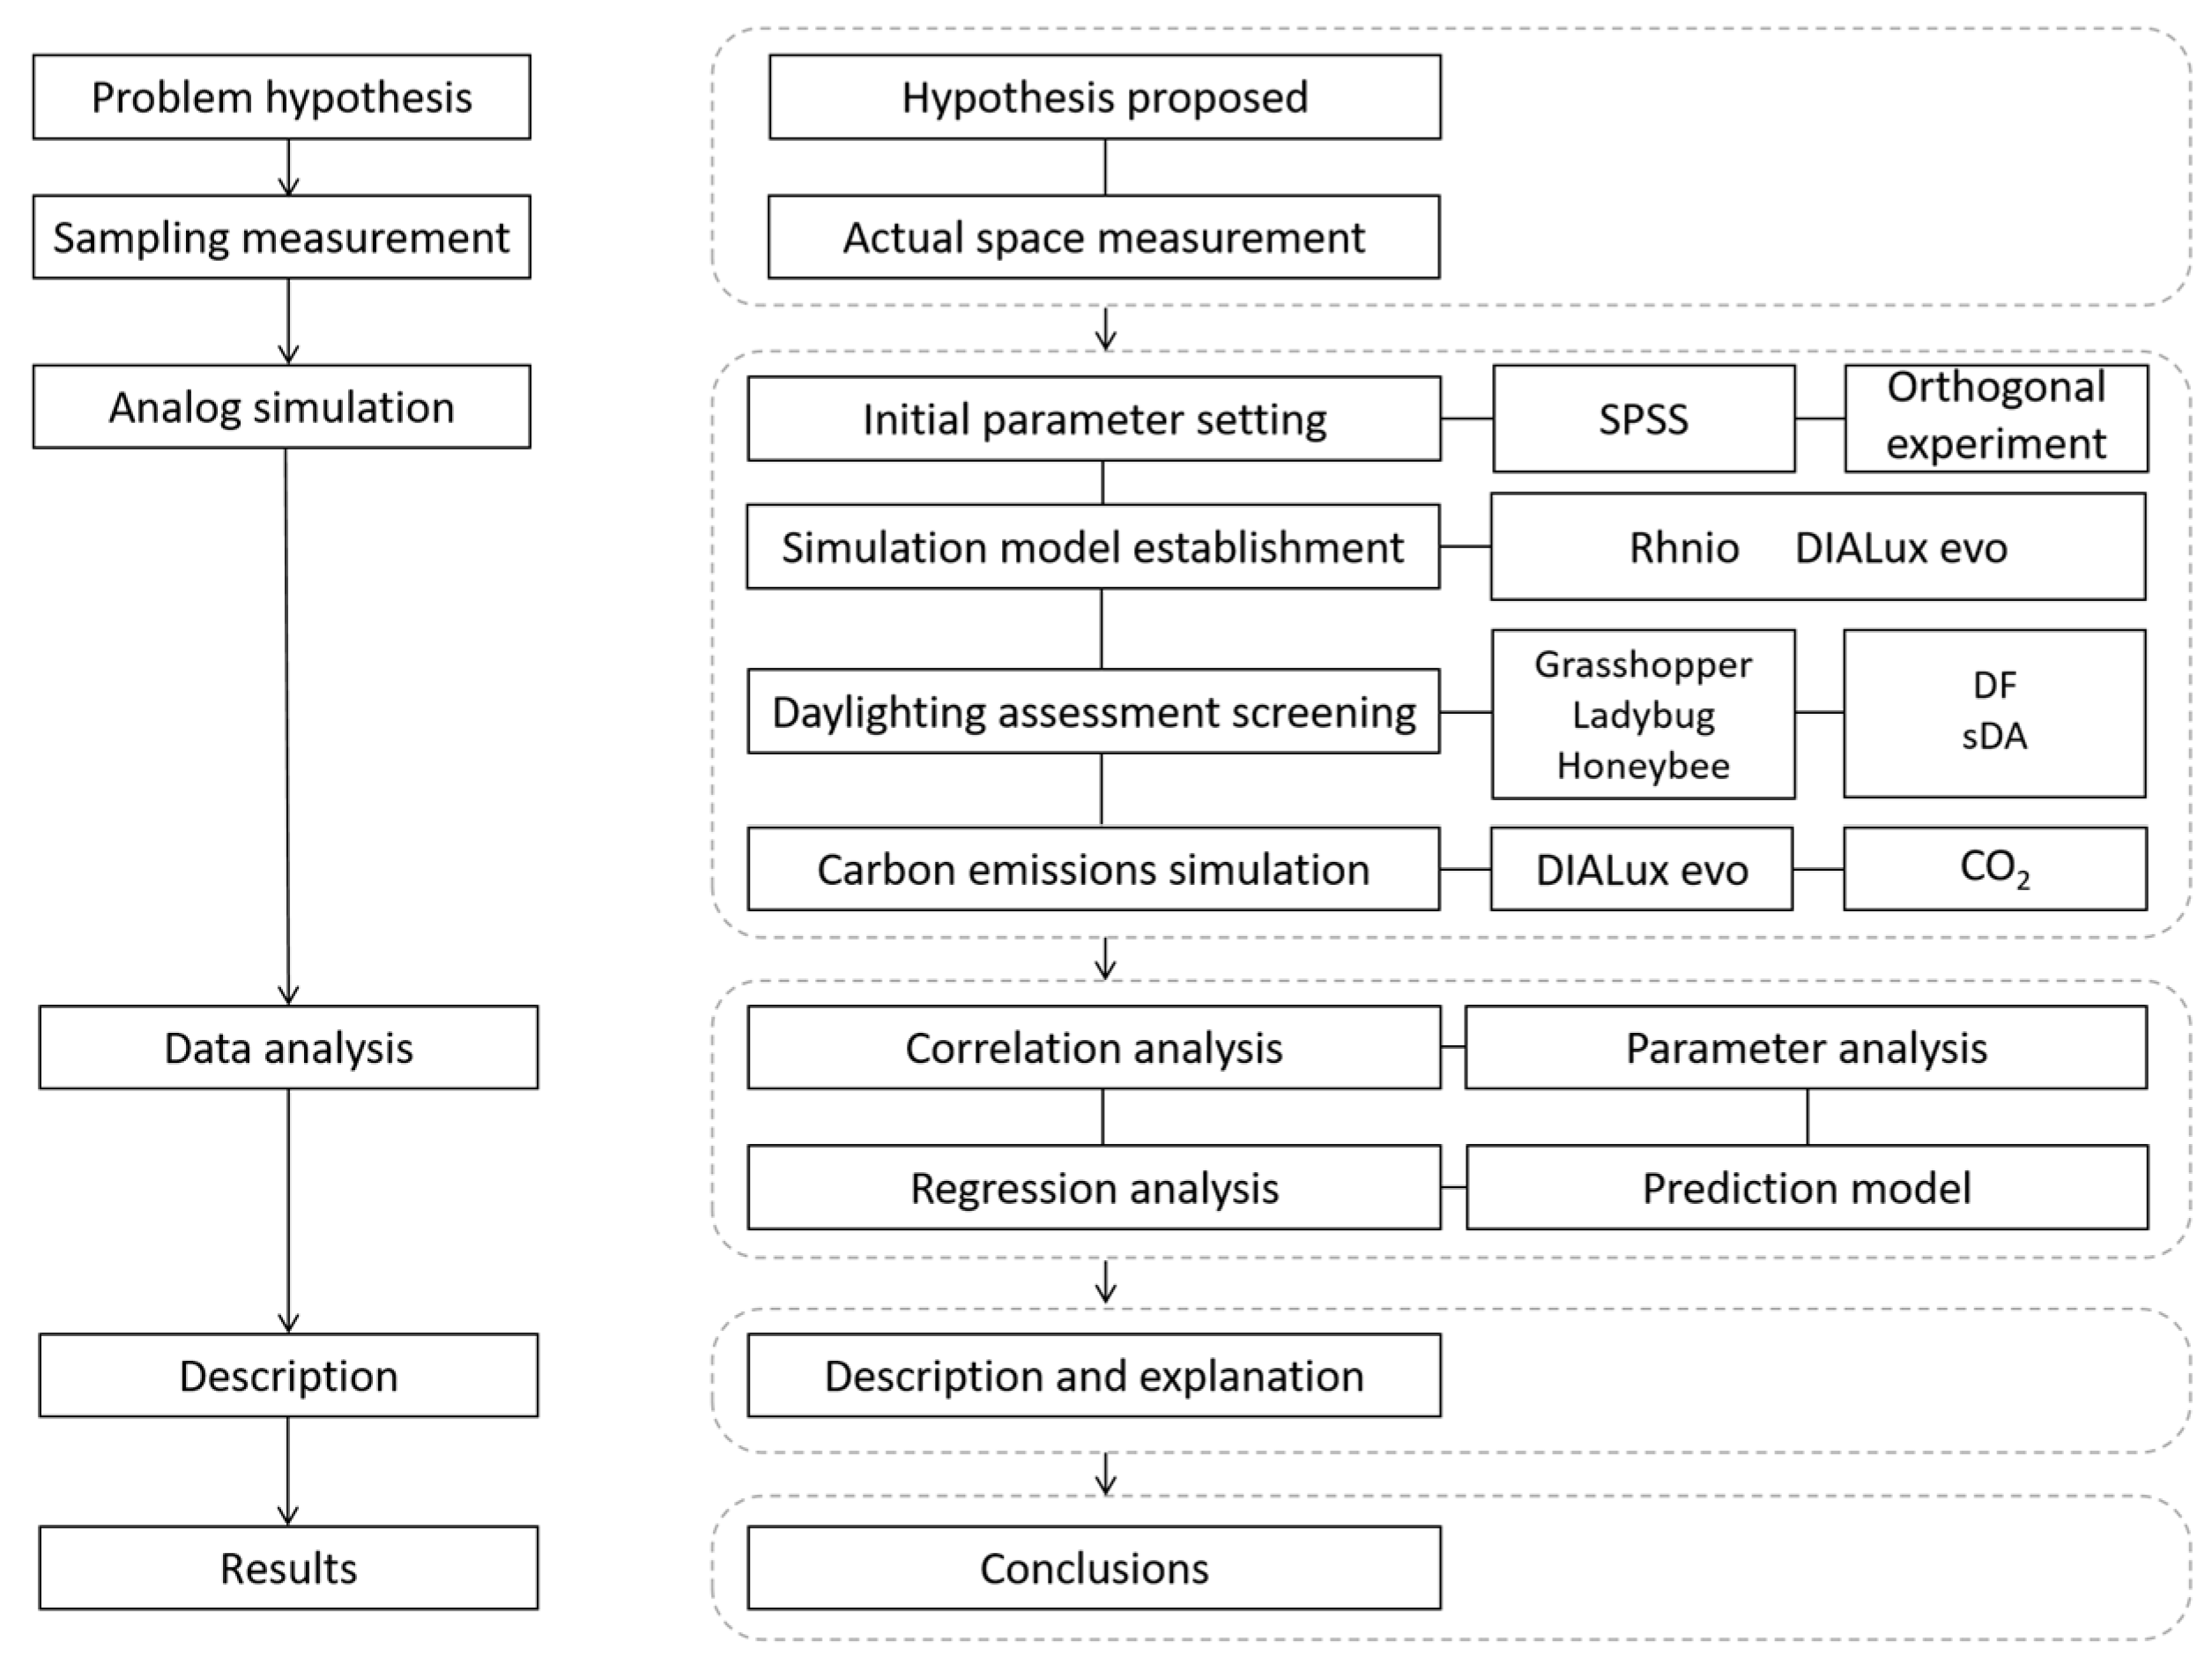
2.1. Workflows
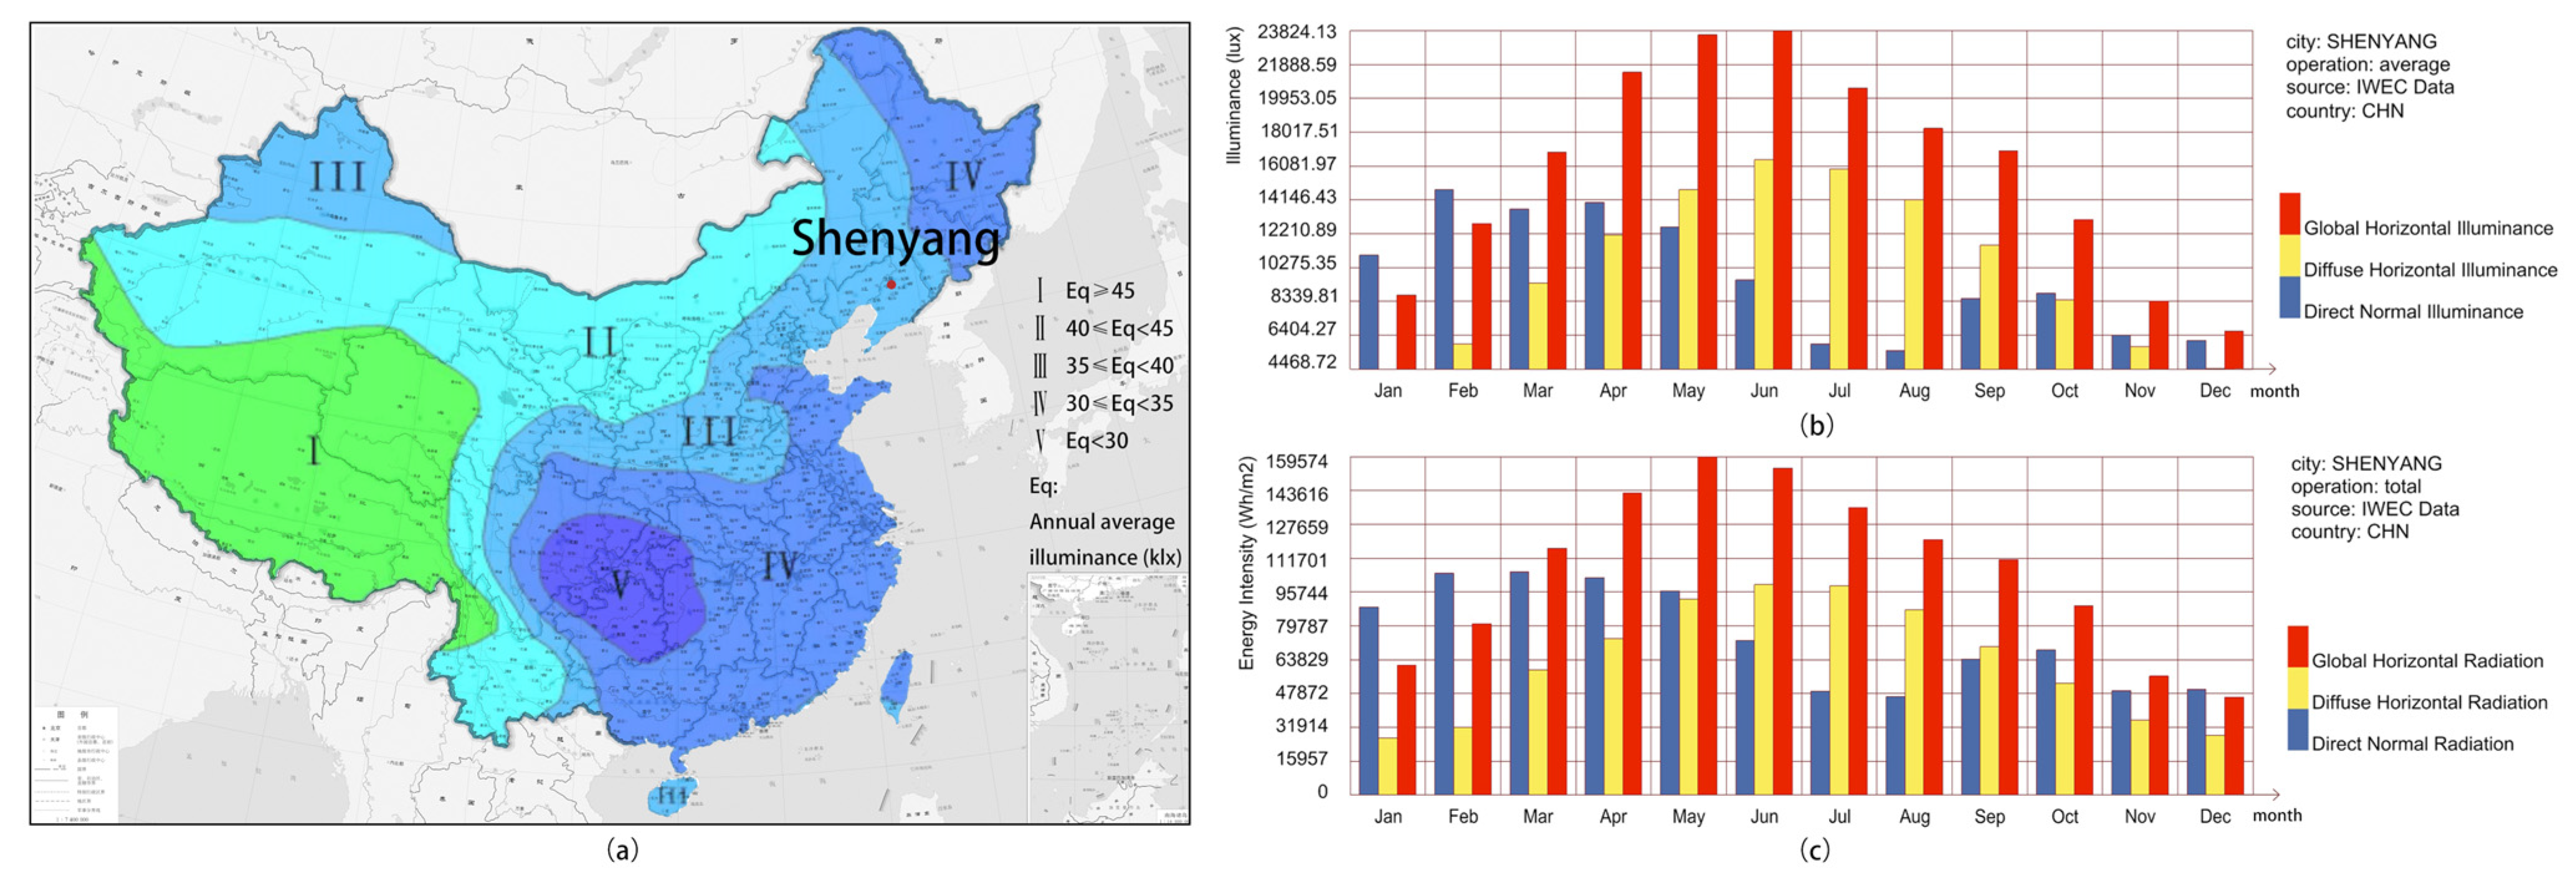
2.2. Location and Climate
2.3. Evaluation Criteria
2.4. Sample Analysis and Selection
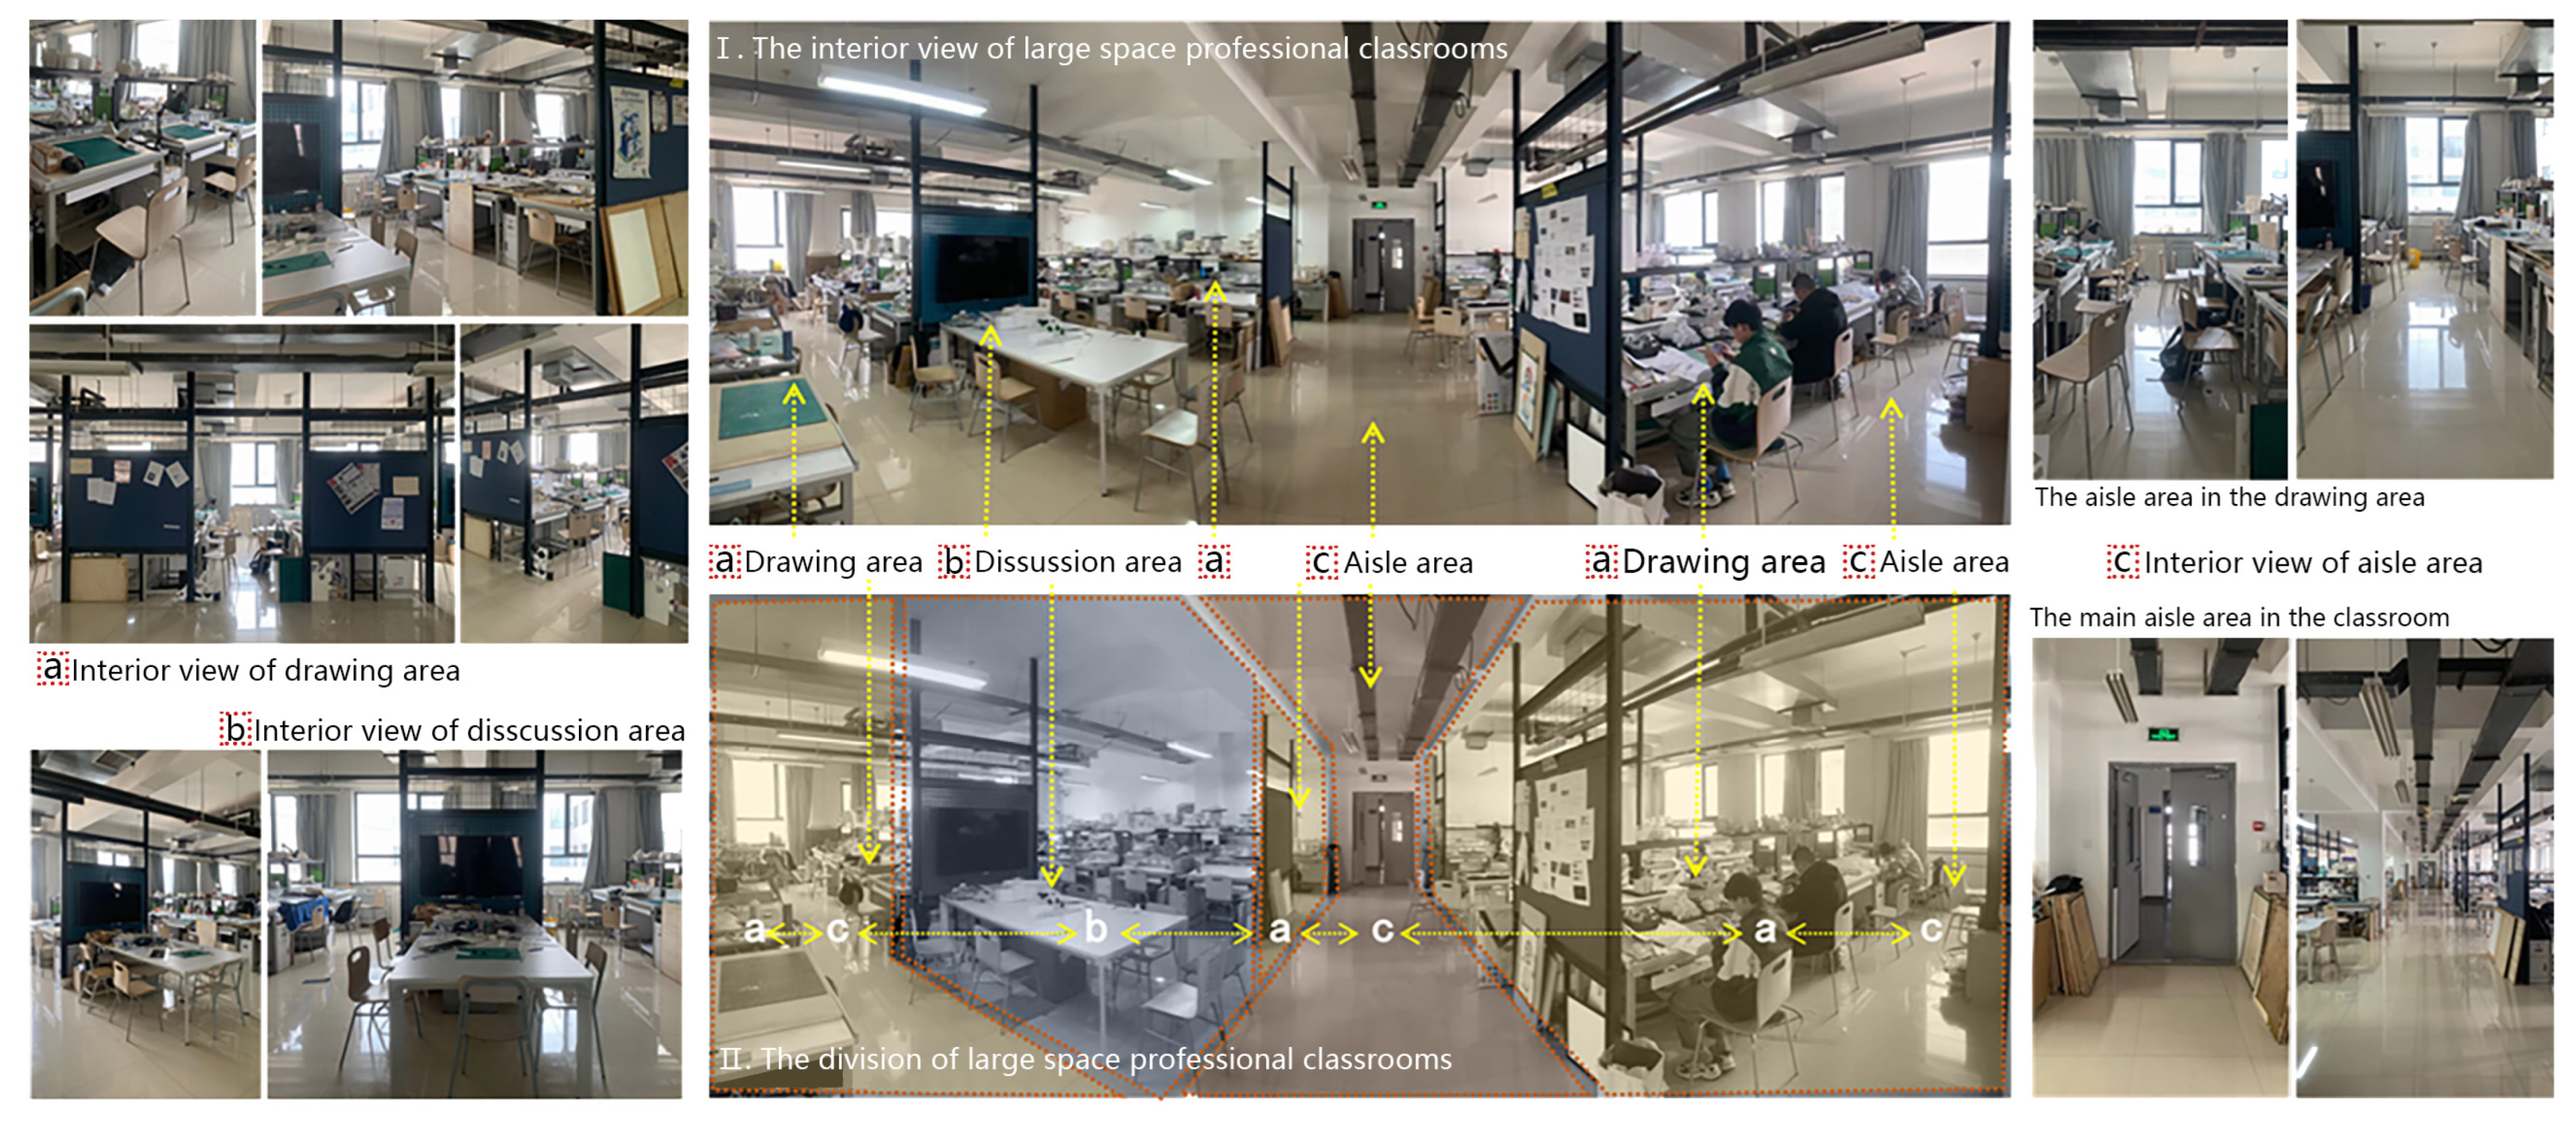
2.4.1. Sample Analysis
2.4.2. Sample Selection
3. Simulation Setup and Data Processing
3.1. Simulation Tools
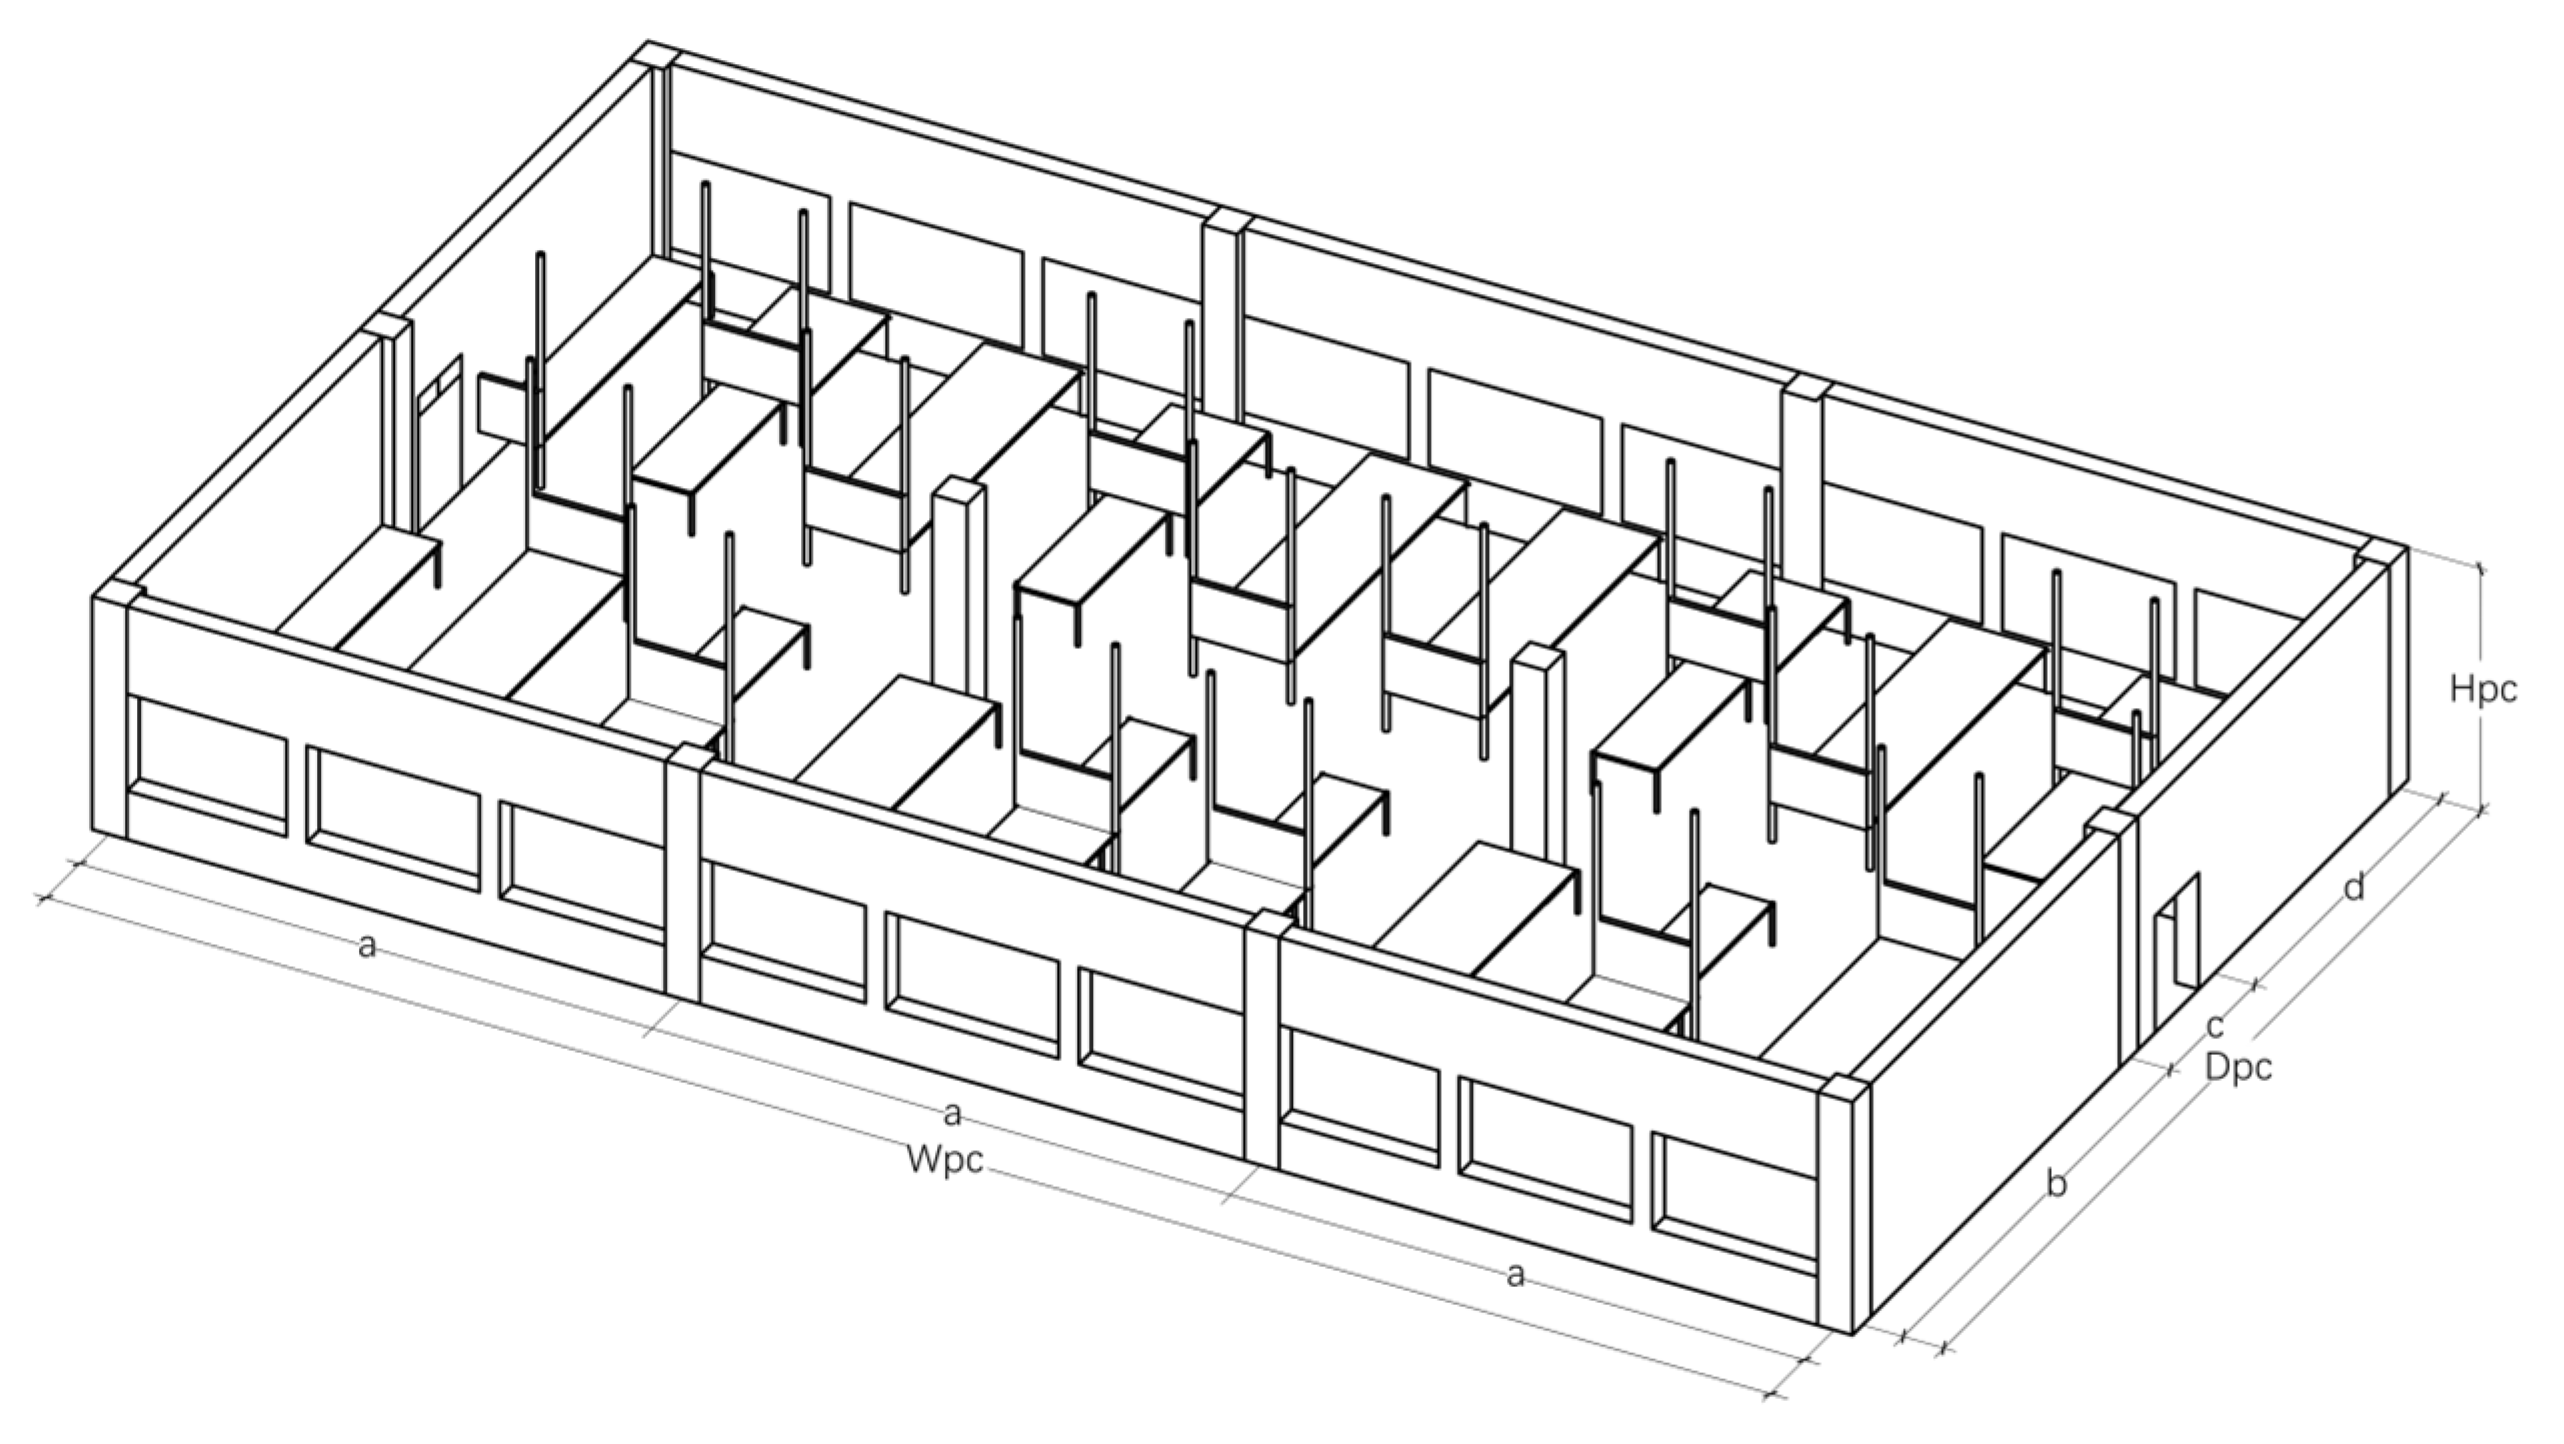
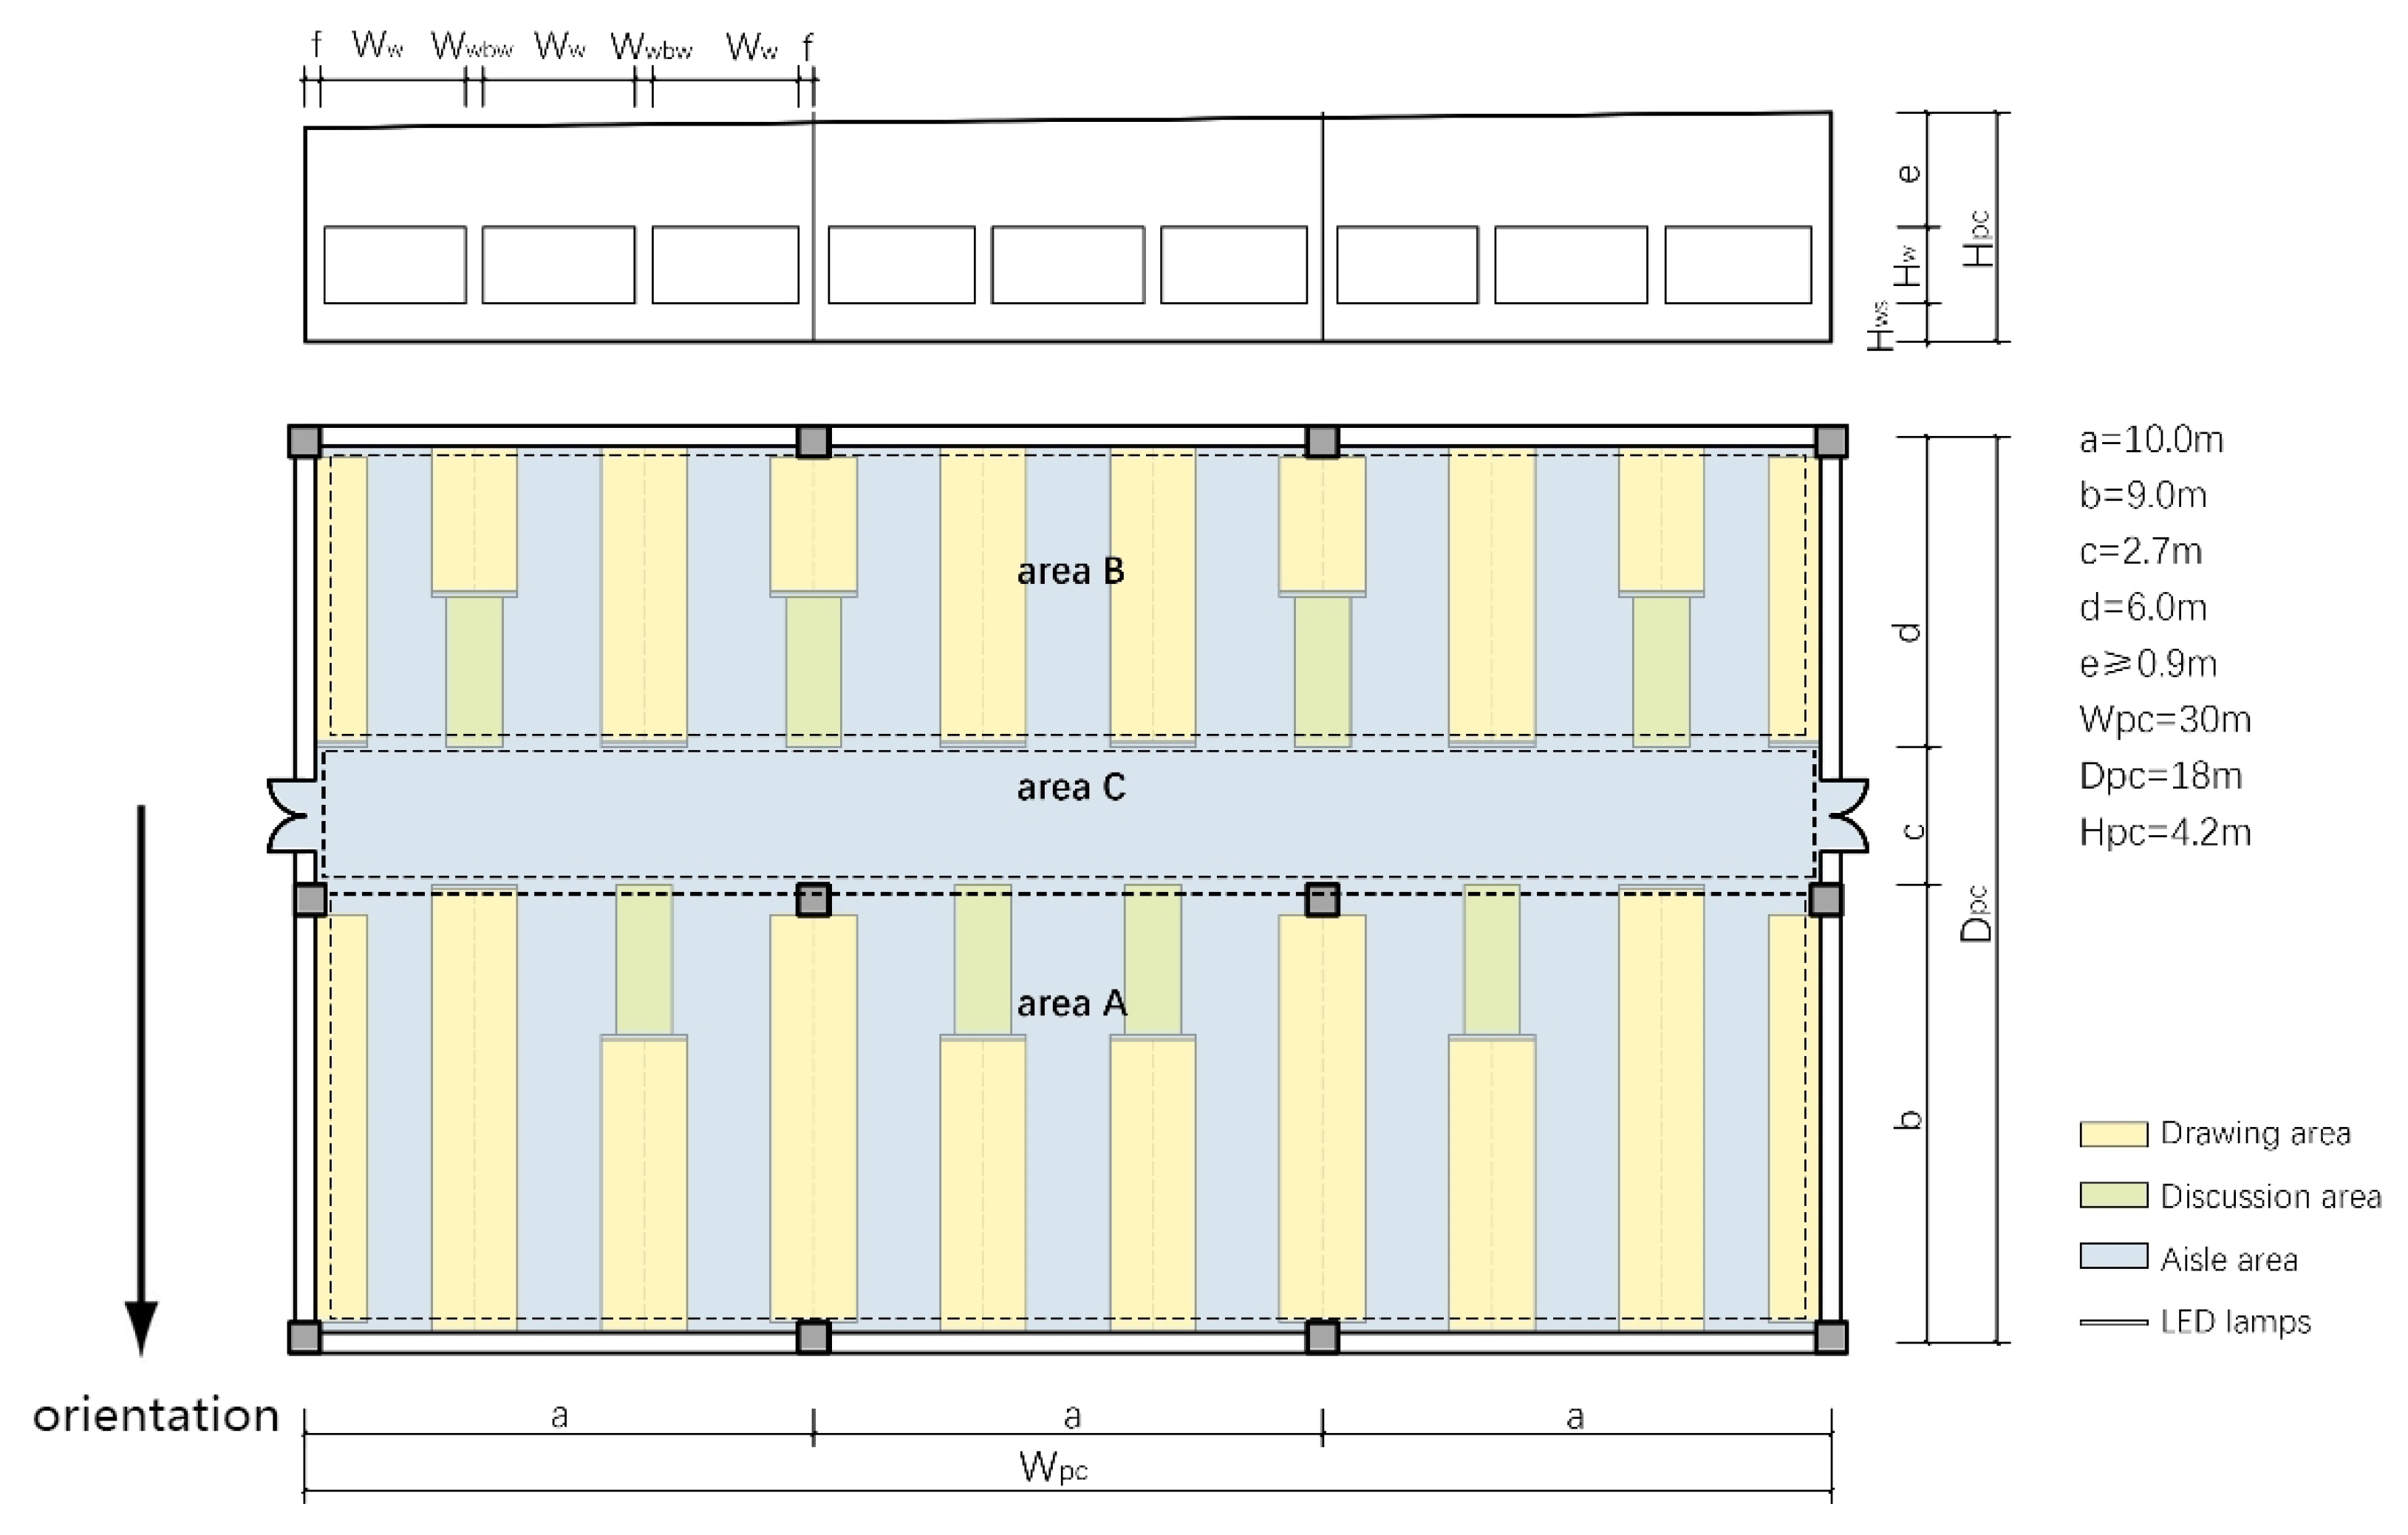
3.2. Simulation Modeling
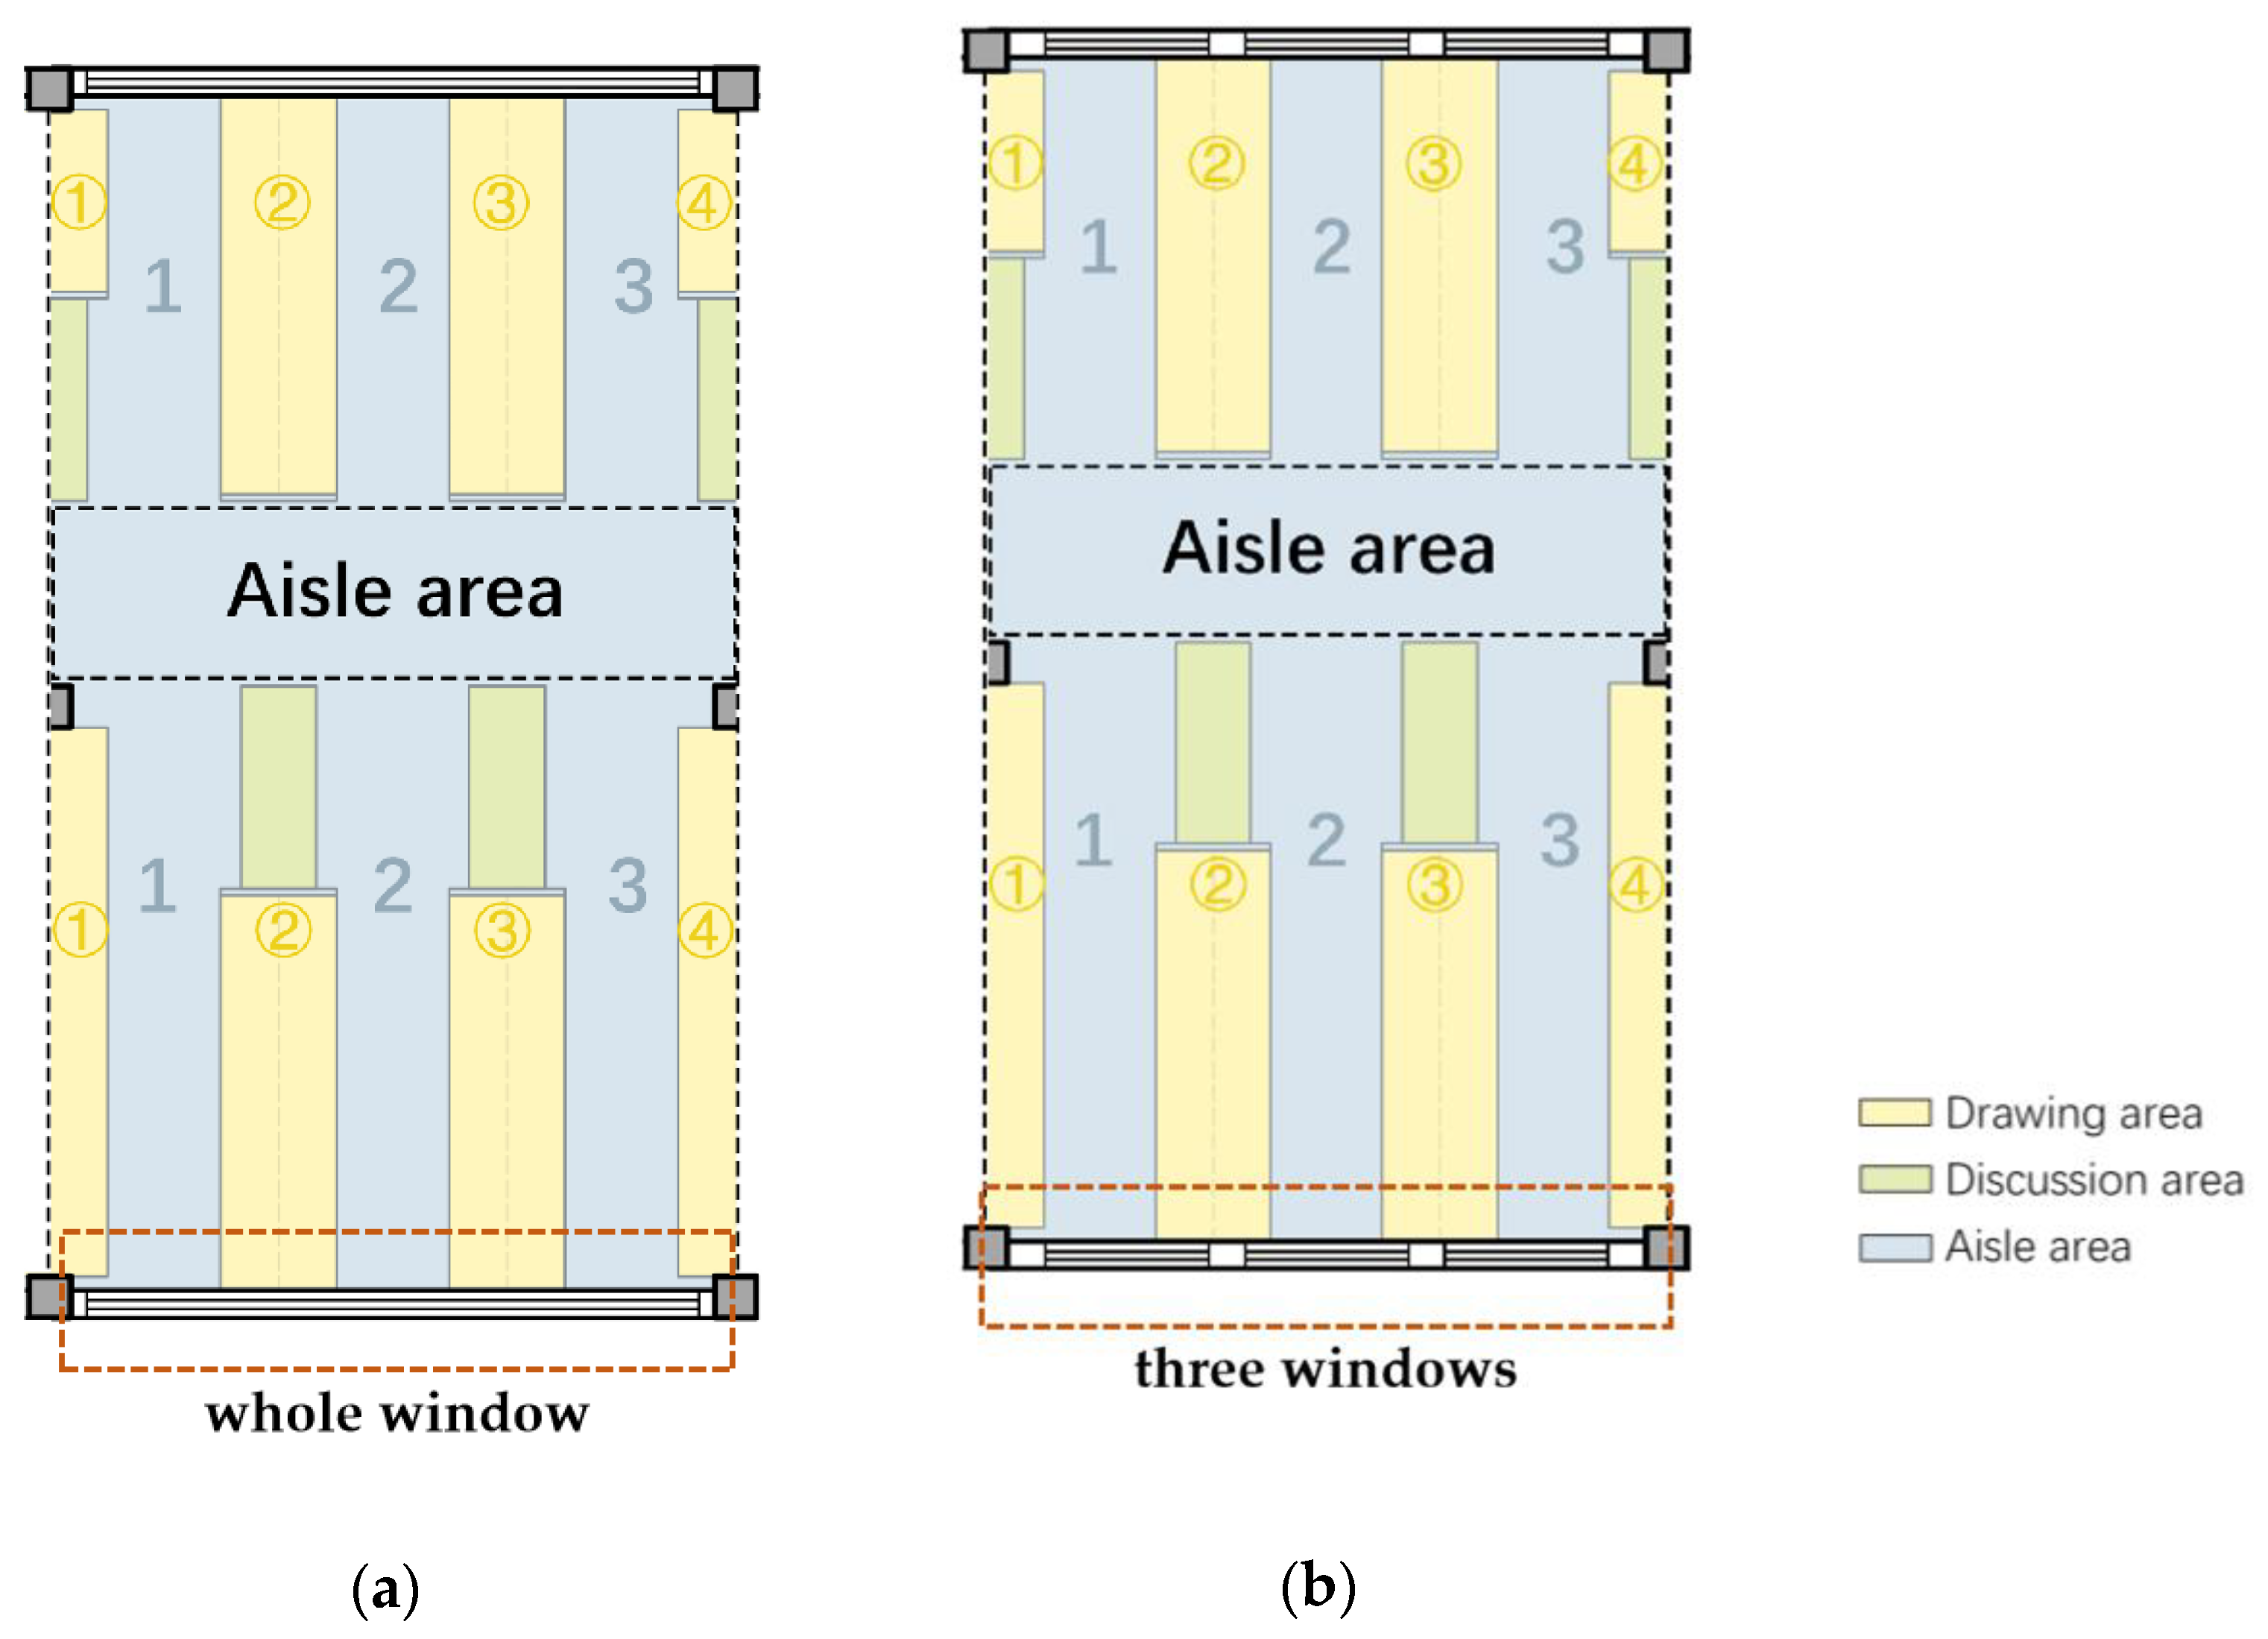
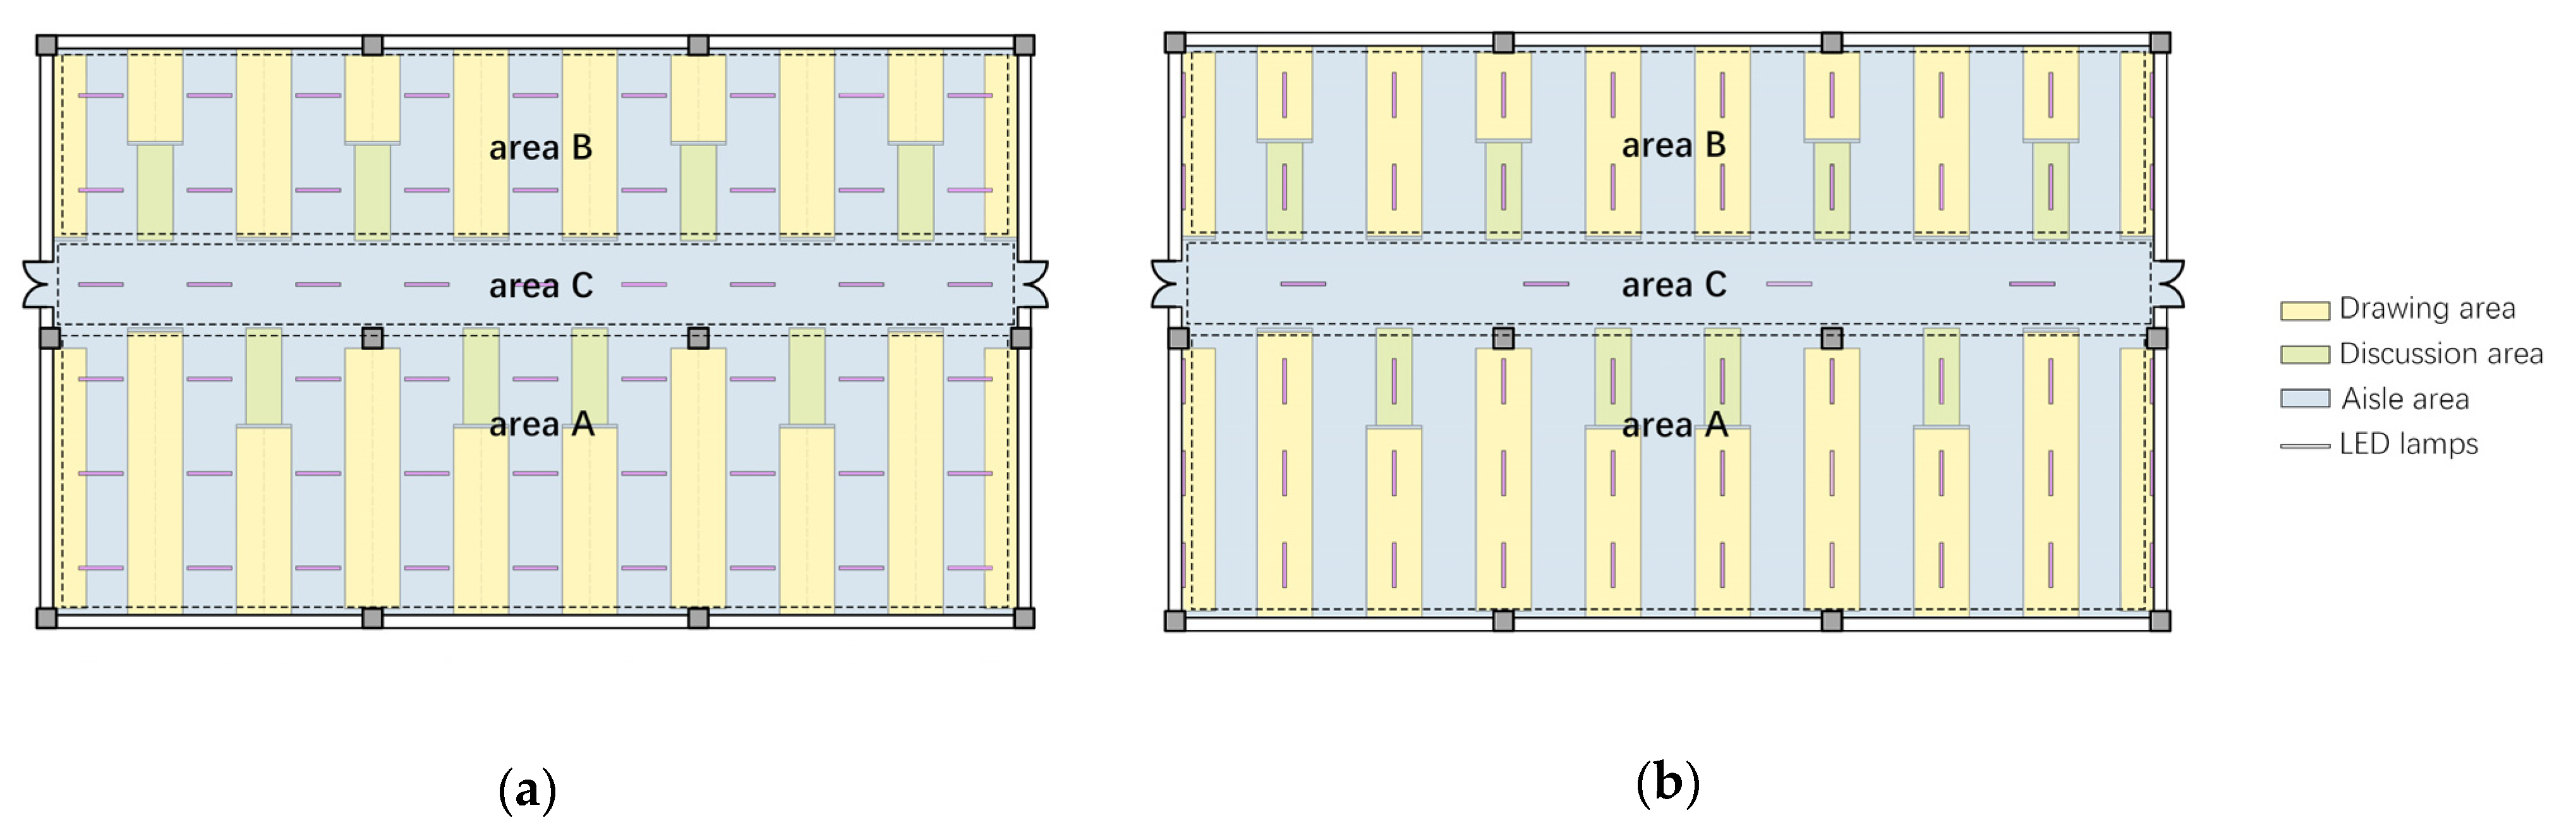
3.3. Lighting Layout
3.4. Interface Parameters
3.5. Run Settings
3.6. Value of the Independent Variable
3.7. Orthogonal Experiments
3.8. Model Screening
3.9. Statistical Analysis
4. Results
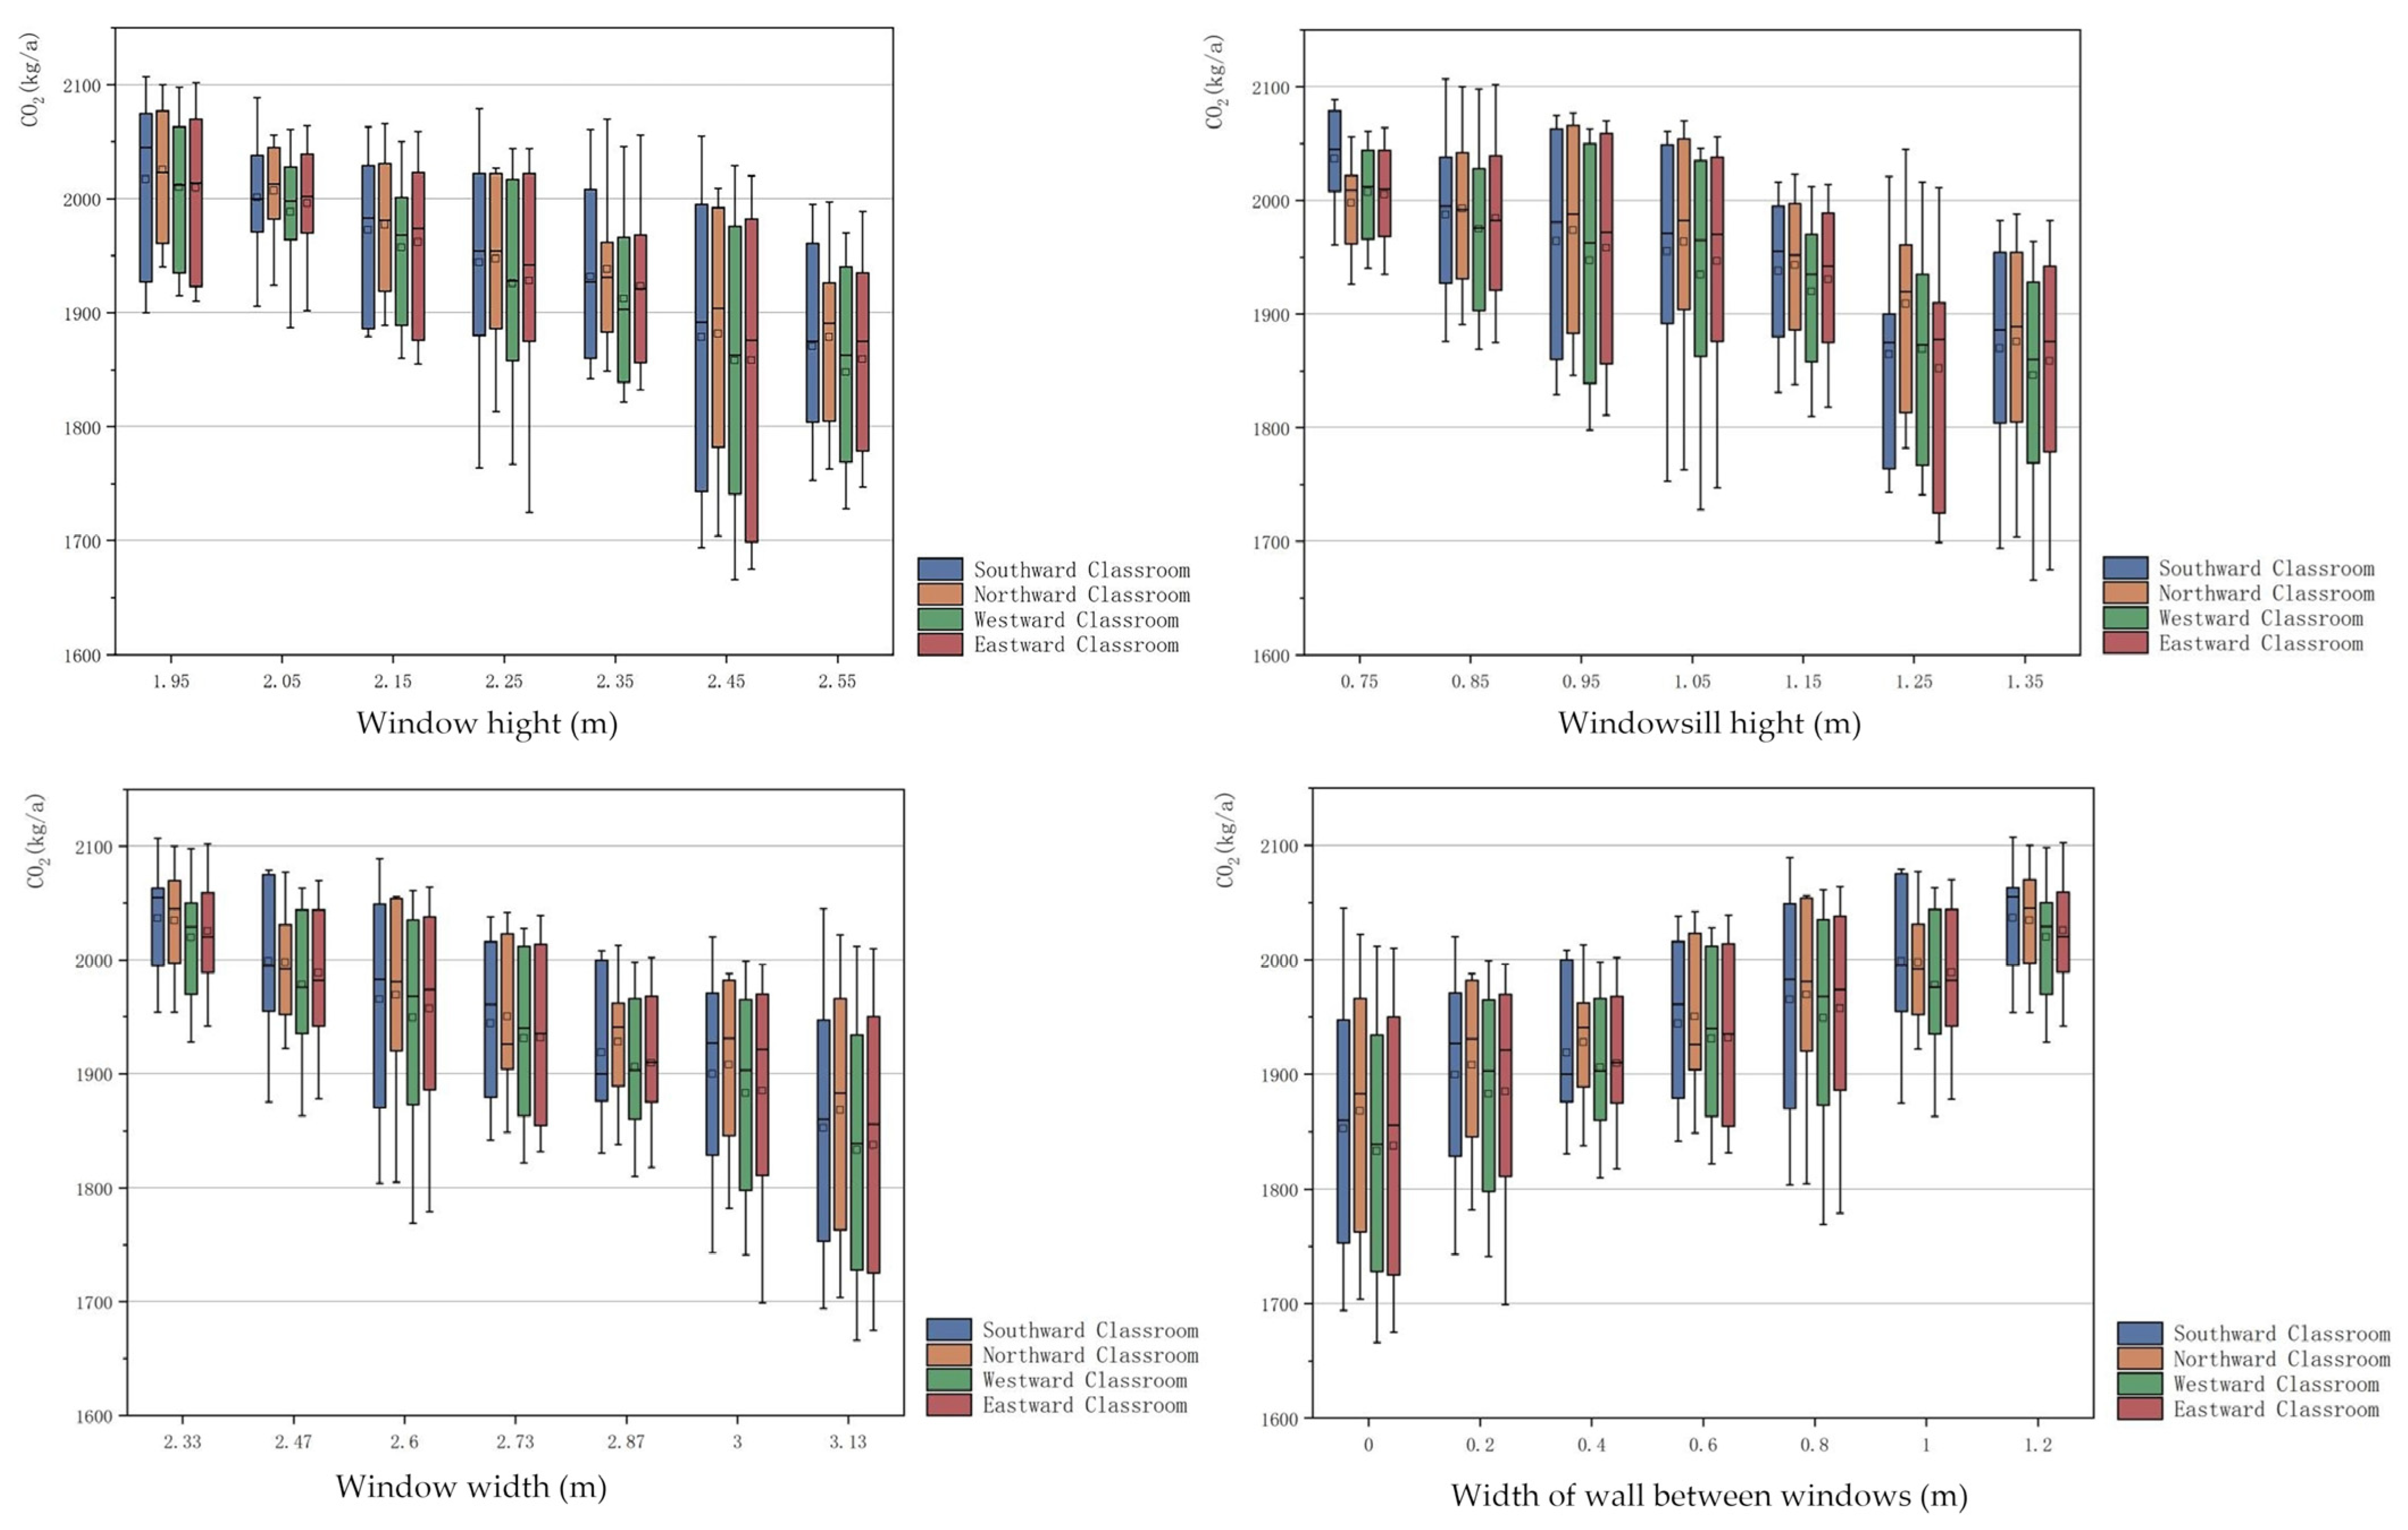
4.1. The Impact of Exterior Window Geometry on Carbon Emissions in College Professional Drawing Classroom Spaces
4.2. Influence of Different Exterior Window Geometries on Carbon Emissions in College Professional Drawing Classroom Space
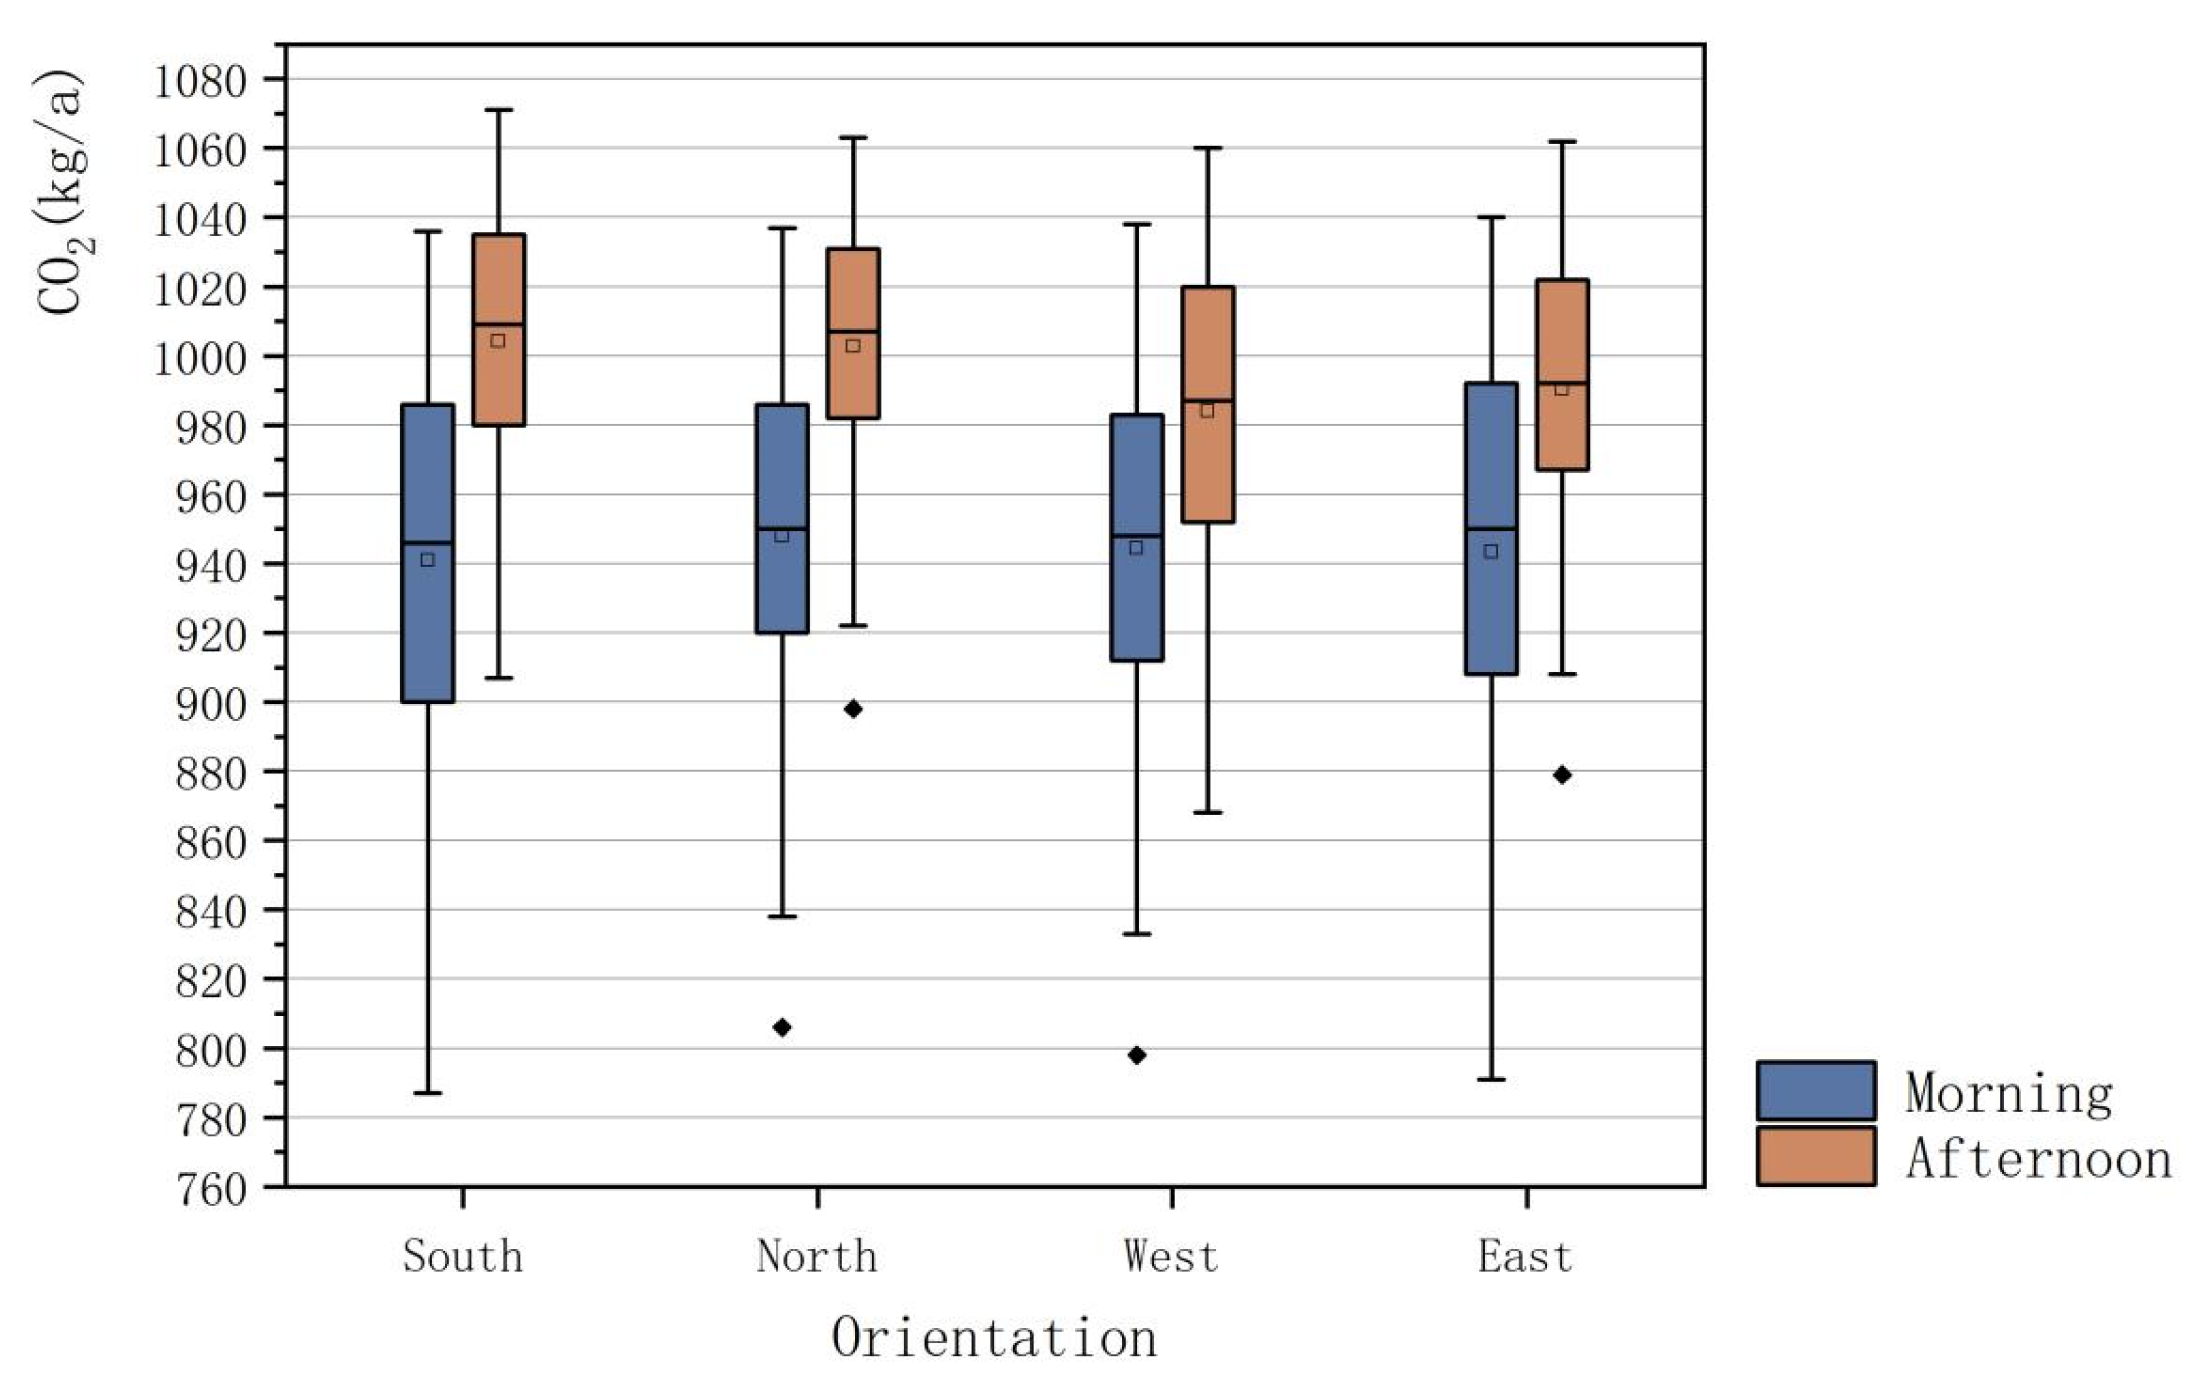
4.3. The Impact of Different Operation Periods and Different Orientations on Carbon Emissions of Professional Drawing Classroom Spaces in Universities
5. Discussion
5.1. Impact of Window Geometry
5.2. Limitations
6. Conclusions
Author Contributions
Funding
Institutional Review Board Statement
Informed Consent Statement
Data Availability Statement
Conflicts of Interest
References
- Ahmad, A.; Prakash, O.; Kumar, A.; Mozammil Hasnain, S.M.; Verma, P.; Zare, A.; Dwivedi, G.; Pandey, A. Dynamic analysis of daylight factor, thermal comfort and energy performance under clear sky conditions for building: An experimental validation. Mater. Sci. Energy Technol. 2022, 5, 52–65. [Google Scholar] [CrossRef]
- Susorova, I.; Tabibzadeh, M.; Rahman, A.; Clack, H.L.; Elnimeiri, M. The effect of geometry factors on fenestration energy performance and energy savings in office buildings. Energy Build. 2013, 57, 6–13. [Google Scholar] [CrossRef]
- Zhao, Y.; Mei, H. Dynamic simulation and analysis of daylighting factors for gymnasiums in mid-latitude China. Build. Environ. 2013, 63, 56–68. [Google Scholar] [CrossRef]
- Katunský, D.; Dolníková, E.; Dolník, B. Daytime Lighting Assessment in Textile Factories Using Connected Windows in Slovakia: A Case Study. Sustainability 2018, 10, 655. [Google Scholar] [CrossRef]
- Al Junaibi, A.A.; Al Zaabi, E.J.; Nassif, R.; Mushtaha, E. Daylighting in Educational Buildings: Its Effects on Students and How to Maximize Its Performance in the Architectural Engineering Department of the University of Sharjah. In Proceedings of the 3rd International Sustainable Buildings Symposium (ISBS 2017), Dubai, United Arab Emirates, 15–17 March 2017; Springer International Publishing: Cham, Switzerland, 2018; Volume 13, pp. 141–159. [Google Scholar]
- Michael, A.; Heracleous, C. Assessment of natural lighting performance and visual comfort of educational architecture in Southern Europe: The case of typical educational school premises in Cyprus. Energy Build. 2017, 140, 443–457. [Google Scholar] [CrossRef]
- de Rubeis, T.; Nardi, I.; Muttillo, M.; Ranieri, S.; Ambrosini, D. Room and window geometry influence for daylight harvesting maximization—Effects on energy savings in an academic classroom. Energy Procedia 2018, 148, 1090–1097. [Google Scholar] [CrossRef]
- Katunský, D.; Vertaľ, M.; Dolníková, E.; Zozuláková, S.; Hutkai, K.; Dická, Z. Mutual Interaction of Daylight and Overheating in the Attic Space in Summer Time. Sustainability 2022, 14, 15634. [Google Scholar] [CrossRef]
- Galal, K.S. The impact of classroom orientation on daylight and heat-gain performance in the Lebanese Coastal zone. Alex. Eng. J. 2019, 58, 827–839. [Google Scholar] [CrossRef]
- Mangkuto, R.A.; Koerniawan, M.D.; Hensen, J.L.; Yuliarto, B. Optimization of daylighting design using self-shading mechanism in tropical school classrooms with bilateral openings. J. Daylight. 2022, 9, 117–136. [Google Scholar]
- Lakhdari, K.; Sriti, L.; Painter, B. Parametric optimization of daylight, thermal and energy performance of middle school classrooms, case of hot and dry regions. Build. Environ. 2021, 204, 108173. [Google Scholar] [CrossRef]
- Li, D.H.W.; Cheung, K.L.; Wong, S.L.; Lam, T.N.T. An analysis of energy-efficient light fittings and lighting controls. Appl. Energy 2010, 87, 558–567. [Google Scholar] [CrossRef]
- Yu, X.; Su, Y.; Chen, X. Application of RELUX simulation to investigate energy saving potential from daylighting in a new educational building in UK. Energy Build. 2014, 74, 191–202. [Google Scholar] [CrossRef]
- Din, I.; Kim, H. Joint blind and light control for lighting energy reduction while satisfying light level and anti-glare requirements. Light. Res. Technol. 2014, 46, 281–292. [Google Scholar] [CrossRef]
- Shishegar, N.; Boubekri, M. Quantifying electrical energy savings in offices through installing daylight responsive control systems in hot climates. Energy Build. 2017, 153, 87–98. [Google Scholar] [CrossRef]
- Pellegrino, A.; Cammarano, S.; Lo Verso, V.R.M.; Corrado, V. Impact of daylighting on total energy use in offices of varying architectural features in Italy: Results from a parametric study. Build. Environ. 2017, 113, 151–162. [Google Scholar] [CrossRef]
- Li, D.H.W.; Lam, J.C. Evaluation of lighting performance in office buildings with daylighting controls. Energy Build. 2001, 33, 793–803. [Google Scholar] [CrossRef]
- Li, D.H.W.; Tsang, E.K.W. An analysis of measured and simulated daylight illuminance and lighting savings in a daylit corridor. Build. Environ. 2005, 40, 973–982. [Google Scholar] [CrossRef]
- Li, D.H.W.; Tsang, E.K.W. An analysis of daylighting performance for office buildings in Hong Kong. Build. Environ. 2008, 43, 1446–1458. [Google Scholar] [CrossRef]
- Li, D.H.W.; Lam, J.C. An investigation of daylighting performance and energy saving in a daylit corridor. Energy Build. 2003, 35, 365–373. [Google Scholar] [CrossRef]
- Li, D.H.W.; Lam, T.N.T.; Wong, S.L. Lighting and energy performance for an office using high frequency dimming controls. Energy Convers. Manag. 2006, 47, 1133–1145. [Google Scholar] [CrossRef]
- Xue, Y.; Liu, W. A Study on Parametric Design Method for Optimization of Daylight in Commercial Building’s Atrium in Cold Regions. Sustainability 2022, 14, 7667. [Google Scholar] [CrossRef]
- City Profile—The People’s Government of Shenyang Municipality. Available online: http://www.shenyang.gov.cn/wssy/scfm/csgk/ (accessed on 23 June 2023).
- Deng, J.; Yin, Y.; Li, B. A New Scheme for Climate Regionalization in China. Acta Geogr. Sin. 2010, 65, 3–12. [Google Scholar]
- GB 50176-2016; Thermal Design Code for Civil Building. China Architecture & Building Press: Beijing, China, 1993.
- JGJ 26-2018; Design Standard for Energy Efficiency of Residential Buildings in Severe Cold and Cold Zones. China Architecture & Building Press: Beijing, China, 2010.
- GB 50189-2015; Design Standard for Energy Efficiency of Public Buildings. China Architecture & Building Press: Beijing, China, 2015.
- GB 50033-2013; Standard for Daylighting Design of Buildings. China Architecture & Building Press: Beijing, China, 2013.
- Mohsenin, M.; Hu, J. Assessing daylight performance in atrium buildings by using Climate Based Daylight Modeling. Sol. Energy 2015, 119, 553–560. [Google Scholar] [CrossRef]
- ElBatran, R.M.; Ismaeel, W.S. Applying a parametric design approach for optimizing daylighting and visual comfort in office buildings. Ain Shams Eng. J. 2021, 12, 3275–3284. [Google Scholar] [CrossRef]
- GB/T 5699-2017; Method of Daylighting Measurements. China Architecture & Building Press: Beijing, China, 2017.
- Wang, M. Research on Daylighting and Energy Consumption Optimization of Reading Space in Academic Library Based on Facade Form-Take Xi’an as an Example. Ph.D. Thesis, Xi’an University of Architecture and Technology, Beijing, China, 2022. [Google Scholar]
- Illuminating Engineering Society. Approved Method: IES Spatial Daylight Autonomy (SDA) and Annual Sunlight Exposure (ASE); Illuminating Engineering Society: New York, NY, USA, 2012; IES LM-83-12. [Google Scholar]
- Tong, T. The Design Analysis and Study on Usage Status for Teaching Space of Architecture Department in Universities. Master’s Thesis, Southwest Jiaotong University, Chengdu, China, 2009. [Google Scholar]
- Architectural Design Data Set; China Architecture & Building Press: Beijing, China; Available online: https://www.amazon.com/Architectural-Design-Data-Set-5/dp/7112022231 (accessed on 6 May 2023).
- Hemmerling, M.; Seegers, M.; Witzel, D. Calculation of energy saving potential for lighting with DIALux evo. Energy Build. 2023, 278, 112475. [Google Scholar] [CrossRef]
- Roudsari, M.S.; Pak, M. Ladybug: A parametric environmental plugin for grasshopper to help designers create an environmentally-conscious design. In Proceedings of the BS 2013: 13th Conference of the International Building Performance Simulation Association, Chambéry, France, 26–28 August 2013; pp. 3128–3135. [Google Scholar]
- Kharvari, F. An empirical validation of daylighting tools: Assessing radiance parameters and simulation settings in Ladybug and Honeybee against field measurements. Sol. Energy 2020, 207, 1021–1036. [Google Scholar] [CrossRef]
- de Sousa Freitas, J.; Cronemberger, J.; Soares, R.M.; Amorim, C.N.D. Modeling and assessing BIPV envelopes using parametric Rhinoceros plugins Grasshopper and Ladybug. Renew. Energy 2020, 160, 1468–1479. [Google Scholar] [CrossRef]
- Salata, F.; Golasi, I.; Di Salvatore, M.; de Lieto Vollaro, A.J.A.E. Energy and reliability optimization of a system that combines daylighting and artificial sources. A case study carried out in academic buildings. Appl. Energy 2016, 169, 250–266. [Google Scholar] [CrossRef]
- What’s New in DIALux evo 11. Available online: https://www.dialux.com/en-GB/dialux/whats-new-in-dialux-evo-11 (accessed on 7 June 2023.).
- Weather Data. Available online: https://energyplus.net/weather (accessed on 18 June 2023).
- JGJ 310-2013; Code for Electrical Design of Educational Buildings. China Architecture & Building Press: Beijing, China, 2014.
- GB50099-2011; Code for Design of School. China Architecture & Building Press: Beijing, China, 2011.
- GB/T 31831-2015; Technical Requirements for Application of LED Indoor Lighting. China Architecture & Building Press: Beijing, China, 2016.
- GB 50352-2019; Uniform Standard for Design of Civil Buildings. China Architecture & Building Press: Beijing, China, 2019.
- Leung, Y.-W.; Wang, Y. An orthogonal genetic algorithm with quantization for global numerical optimization. IEEE Trans. Evol. Comput. 2001, 5, 41–53. [Google Scholar] [CrossRef]


| Serial Number | Name of Teaching Building | Classroom Type | Space Geometry |
|---|---|---|---|
| 1 | Drawing Room, Department of Architecture, Tsinghua University, Beijing, 1911 | Undergraduates—Large Space Classroom Graduate Students—Studio |  |
| 2 | Drawing Room, Department of Architecture, Tongji University, Shanghai, 1907 | Undergraduates—Large Space Classroom | |
| 3 | Drawing Room, Department of Architecture, South China University of Technology, Guangzhou, 1952 | Undergraduates—Large Space Classroom | |
| 4 | Drawing Room, Department of Architecture, Xi’an University of Architecture and Technology, Xi’an, 1895 | Undergraduates—Large Space Classroom Undergraduate Senior—Studio | |
| 5 | Drawing Room, Department of Architecture, Southeast University, Nanjing, 1902 | Undergraduates—Large Space Classroom | |
| 6 | Drawing Room, Department of Architecture, Tianjin University, Tianjin, 1895 | Undergraduates—Large Space Classroom | |
| 7 | Drawing Room, Department of Architecture, Northeastern University, Shenyang, 1923 | Undergraduates—Large Space Classroom | |
| 8 | Drawing Room, Department of Architecture, Harbin Institute of Technology, Harbin, 1929 | Undergraduates—General Small Classroom |  |
| 9 | Drawing Room, Department of Architecture, Chongqing University, Chongqing, 1920 | Undergraduates—General Small Classroom Graduate Students—Tutor’s Studio |
| Symbols and Signs | Significance |
|---|---|
| Hw | window height |
| Hws | windowsill height |
| Wwbw | width of wall between windows |
| Ww | width of window |
| WWR | window-to-wall ratio |
| WFR | window-to-floor ratio |
| DA | daylight autonomy |
| sDA | spatial daylight autonomy |
| DF | daylight factor |
| C | carbon emissions with daylight-controlled artificial lighting |
| Surface Parameters | Specification Requirements | Model Setup |
|---|---|---|
| Roof Reflectance Ratio | 0.60–0.90 | 0.75 |
| Wall Reflectance Ratio | 0.30–0.80 | 0.55 |
| Floor Reflectance Ratio | 0.10–0.50 | 0.30 |
| Worktop Reflectance Ratio | 0.20–0.60 | 0.40 |
| External Window Transmission Ratio | ≥0.40 | 0.40 |
| Level | Window Height | Windowsill Height | Width of Wall between Windows |
|---|---|---|---|
| 1 | 1.95 m | 0.75 m | 0.00 m |
| 2 | 2.05 m | 0.85 m | 0.20 m |
| 3 | 2.15 m | 0.95 m | 0.40 m |
| 4 | 2.25 m | 1.05 m | 0.60 m |
| 5 | 2.35 m | 1.15 m | 0.80 m |
| 6 | 2.45 m | 1.25 m | 1.00 m |
| 7 | 2.55 m | 1.35 m | 1.2 m |
| Orientation | Index | Hw | Hws | Wwbw | Ww | WFR | WWR |
|---|---|---|---|---|---|---|---|
| South | CO2 (Daytime) | −0.529 ** | −0.563 ** | 0.581 ** | −0.581 ** | −0.794 ** | −0.794 ** |
| North | CO2 (Daytime) | −0.599 ** | −0.463 ** | 0.591 ** | −0.591 ** | −0.848 ** | −0.848 ** |
| West | CO2 (Daytime) | −0.578 ** | −0.527 ** | 0.579 ** | −0.579 ** | −0.825 ** | −0.825 ** |
| East | CO2 (Daytime) | −0.547 ** | −0.524 ** | 0.585 ** | −0.585 ** | −0.809 ** | −0.809 ** |
| Orientation | Adjusted R2 | Sig | DW | Independent Variable | Standardized Coefficients | t | Sig | VIF |
|---|---|---|---|---|---|---|---|---|
| South | 0.940 | 0.000 | 2.068 | Constant | —— | 58.747 | 0.000 | —— |
| Hw | −0.562 | −15.924 | 0.000 | 1.000 | ||||
| Hws | −0.576 | −16.341 | 0.000 | 1.000 | ||||
| Ww | −0.541 | −15.341 | 0.000 | 1.000 | ||||
| North | 0.926 | 0.000 | 1.519 | Constant | —— | 63.830 | 0.000 | —— |
| Hw | −0.598 | −15.214 | 0.000 | 1.000 | ||||
| Hws | −0.487 | −12.377 | 0.000 | 1.000 | ||||
| Ww | −0.574 | −14.578 | 0.000 | 1.000 | ||||
| West | 0.962 | 0.000 | 1.822 | Constant | —— | 71.841 | 0.000 | —— |
| Hw | −0.629 | −22.467 | 0.000 | 1.000 | ||||
| Hws | −0.544 | −19.406 | 0.000 | 1.000 | ||||
| Ww | −0.510 | −18.218 | 0.000 | 1.000 | ||||
| East | 0.913 | 0.000 | 2.032 | Constant | —— | 49.529 | 0.000 | —— |
| Hw | −0.552 | −12.982 | 0.000 | 1.000 | ||||
| Hws | −0.528 | −12.396 | 0.000 | 1.000 | ||||
| Ww | −0.579 | −13.604 | 0.000 | 1.000 |
Disclaimer/Publisher’s Note: The statements, opinions and data contained in all publications are solely those of the individual author(s) and contributor(s) and not of MDPI and/or the editor(s). MDPI and/or the editor(s) disclaim responsibility for any injury to people or property resulting from any ideas, methods, instructions or products referred to in the content. |
© 2023 by the authors. Licensee MDPI, Basel, Switzerland. This article is an open access article distributed under the terms and conditions of the Creative Commons Attribution (CC BY) license (https://creativecommons.org/licenses/by/4.0/).
Share and Cite
Ding, J.; Zou, X.; Lv, M. Influence of Opposing Exterior Window Geometry on the Carbon Emissions of Indoor Lighting under the Combined Effect of Natural Lighting and Artificial Lighting in the City of Shenyang, China. Sustainability 2023, 15, 12972. https://doi.org/10.3390/su151712972
Ding J, Zou X, Lv M. Influence of Opposing Exterior Window Geometry on the Carbon Emissions of Indoor Lighting under the Combined Effect of Natural Lighting and Artificial Lighting in the City of Shenyang, China. Sustainability. 2023; 15(17):12972. https://doi.org/10.3390/su151712972
Chicago/Turabian StyleDing, Jianhua, Xinyi Zou, and Murong Lv. 2023. "Influence of Opposing Exterior Window Geometry on the Carbon Emissions of Indoor Lighting under the Combined Effect of Natural Lighting and Artificial Lighting in the City of Shenyang, China" Sustainability 15, no. 17: 12972. https://doi.org/10.3390/su151712972