Article

Experiment Study of Stemming Length and Stemming Material Impact on Rock Fragmentation and Dynamic Strain

1
School of Resources and Safety Engineering, Central South University, Changsha 410083, China
2
Fankou Lead-Zinc Mine, Shaoguan 512325, China
*
Author to whom correspondence should be addressed.
Sustainability 2023, 15(17), 13024; https://doi.org/10.3390/su151713024
Submission received: 4 August 2023 / Revised: 25 August 2023 / Accepted: 28 August 2023 / Published: 29 August 2023

Abstract

:
Stemming length and stemming materials are crucial factors in blasting design, which affect the sustainability of mining. This study investigates the influence of stemming length and stemming material on rock fragmentation, stemming recoil, and surface strain response through 15 small-scale model blasting tests. The results indicate that when using clay as a stemming material, increasing the stemming length facilitates rock fragmentation and reduces the stemming recoil area. The strain measurements show that both tensile and compressive strain peaks on the blasting crater surface increase with the growth of stemming length, while the strain peaks on the upper surface decrease. A comparative analysis of different stemming materials reveals that clay performs the best, exhibiting the highest total weight of fragments, blasting crater size, and fragmentation energy utilization. Strain results indicate that clay stemming generates more significant strain peaks and higher strain loading rates on the blasting crater surface, favoring a more concentrated application of explosive energy on the crater surface and improving rock fragmentation. Sand + clay stemming yields fragments more concentrated in medium-sized particles than clay stemming. If the blasting goal is to increase the utilization efficiency of explosive energy and reduce the hazards of stemming recoil, it is recommended to use clay stemming. In addition, if uniform fragmentation is desired (reducing large and fine particles), a combination of sand + clay stemming can be used. These findings have practical implications for optimizing blasting design and engineering applications.

1. Introduction

The development of the mining industry is intricately linked to sustainability, and improving blasting efficiency is a critical factor in achieving sustainable mining practices. As global mineral demand continues to surge, mining companies are not only required to boost production but also consider environmental sustainability. This includes rational control of vibrations and noise during blasting to minimize adverse impacts on the surrounding ecological environment. Nevertheless, the current utilization efficiency of explosives employed for rock fragmentation remains relatively low, with a significant portion of the blast energy being dissipated as vibrations or air shock [1,2,3]. Consequently, there is an urgent need to enhance the energy efficiency of explosives in rock fragmentation and mitigate secondary disasters, thereby facilitating sustainable development in the mining industry. Stemming plays a crucial role in optimizing the utilization of explosive energy [4,5,6,7]. Nevertheless, many mine managers and workers still opt to forego stemming or employ insufficient stemming in practical blasting operations to save time. Furthermore, uncertainties persist regarding the selection of appropriate stemming materials. These existing phenomena lead to a poor fragmentation effect and increase the risk of stemming recoil (violent expulsion of stemming material from the blast holes) and ore loss. Therefore, it is essential to investigate the effects of stemming length and stemming materials on rock fragmentation.
Stemming length is a crucial parameter in blasting design, and its rational application to enhance energy utilization has been substantiated in various studies [8,9,10]. Compared to non-stemming, appropriate stemming facilitates the retention of a more significant portion of blast energy and prolongs the duration of waves within the blast hole, consequently improving rock fragmentation efficiency and reducing under-break extents in tunnels induced by blasting [11,12,13,14]. Furthermore, stemming length influences blast performance and directly impacts fly-rock and ground vibrations [15,16]. During the propagation of detonation waves from the explosive charge to the stemming material, differences in properties between the blast products (high-pressure and high-temperature gases) and the stemming material can influence the propagation of shock waves and stress waves, as well as the ejection of gas and stemming. Thus, an investigation into stemming materials becomes essential. However, previous research has mainly focused on comparing stemming with non-stemming or analyzing stemming movement and optimizing stemming length [4,17,18,19,20,21], leaving relatively limited attention to studies specifically targeting stemming materials. Zhang et al. investigated the rock fragmentation effects and gas ejection when using steel stemming [22]. However, due to safety concerns, the practical application of steel stemming is not allowed or recommended in actual production blasting. Several research efforts have explored alternative stemming materials to improve rock fragmentation and reduce fly-rock generation. These alternatives include plaster stemming, synthetic rubber-assisted stemming (rubber plug), crushed aggregates, and angular aggregates [15,23,24,25,26]. While these materials have demonstrated potential benefits, they are often less common, may be relatively expensive, and might have limited availability regarding raw material sources. By comparison, clay and sand have the advantage of being more widely available regarding sources. Additionally, their application in underground mining blasting offers several benefits, including ease of transportation, lower cost, and non-toxicity. Moreover, water, a common substance, facilitates reducing blast dust and potentially reduces blast hole blockage after deep-hole blasting. However, the research on utilizing clay, sand, or water as a stemming material still needs to be completed and requires further investigation.
Standard methods for studying rock fragmentation and dynamic effects include theoretical analysis, numerical simulation, model, and field tests. Although small-scale model tests have certain limitations, they offer operability, cost-effectiveness, and time efficiency advantages compared to field testing. Furthermore, model tests are more targeted and capable of analyzing complex problems than theoretical analysis. Additionally, they are valuable for validating various numerical simulation codes, making them commonly employed for rock fragmentation and fracture testing [8,22,27,28,29,30,31,32,33,34,35], as well as for dynamic impact studies of brittle materials such as rocks [36,37,38]. In the past, small-scale model tests focused primarily on studying rock fragmentation mechanisms, fragment size analysis, and blasting crater analysis [39,40,41,42,43,44]. There has been limited research on the influence of stemming length and material on the dynamic strain response of test block surfaces, and few studies have addressed the measurement of stemming material recoil and ejection extent.
Based on the description above, this study devised 15 small-scale blasting model blocks, with four strain gauges arranged on the upper surface and bottom of the block. Initially, tests were conducted using clay stemming at varying stemming lengths. Subsequently, tests were carried out with a combination of water + clay stemming and sand + clay stemming. After blasting, measurements were taken for blasting crater size, fragment size, and stemming material recoil extent and analyzed for strain signals, enabling the assessment of the effects of stemming length and the three different stemming methods on rock fragmentation and strain response of test blocks.

2. Experimental Design and Method

2.1. Experimental Design

2.1.1. Mortar Test Block and Explosive Properties

In this study, as a rock-like material, mortar test blocks were used to replace natural rock due to their superior characteristics, including greater integrity, uniformity, consistency in strength, and fewer joints. Additionally, mortar has the advantage of a broader range of raw material sources, making it more suitable for studying blasting fragmentation. The mortar models used in this study had dimensions of length × width × height = 40 × 40 × 30 cm and were prepared by mixing rod-mill tailings (particle size: 1~5 mm) with high-strength 42.5 # ordinary Portland cement in a 1:1 ratio. The model adopts one-time pouring and uses a vibrating rod to mix and compact the mortar, making the slurry more uniform and reducing bubbles. The blasting tests were conducted on the mortar specimens after 28 days of curing, during which the specimens reached their ultimate strength. The mortar blocks have a density of 2150 kg/m3, a uniaxial compressive strength of 20.5 MPa, a longitudinal wave velocity of 3590 m/s, an elastic modulus of 13 GPa, and a Poisson’s ratio of 0.28.
The tests only used one digital electronic detonator for the blasting, without any other explosives. The digital electronic detonator had a diameter of approximately 8 mm, and the explosive charge inside the detonator had a length of about 30 mm. The explosive charge inside the detonator mainly consisted of 0.35 g of DDNP (Diazodinitrophenol) and 0.65 g of RDX (Hexogen). The densities of DDNP and RDX are 0.7 g/cm3 and 1.68 g/cm3, respectively. The explosive heat for DDNP and RDX is 1400 KJ/kg and 5600 KJ/kg, respectively, while the detonator velocity for DDNP and RDX is 3800 m/s and 8400 m/s, respectively [45,46,47,48]. Based on the mass ratio of the two explosives, the detonator explosive charge’s calculated density and detonation velocity are 1.13 g/cm3 and 6800 m/s, respectively [46,48].

2.1.2. Experimental Design

The explosion experiments were conducted in the Fankou Lead–Zinc Mine blasting laboratory. During the blasting process, the test specimens were placed on a steel plate, and two square bricks were used to support the specimen, ensuring that the bottom surface of the specimen was free. As shown in Figure 1a, a 300 mm long, 8 mm diameter borehole was centrally positioned in the specimen, penetrating through the upper and lower surfaces of the test block.
The detonator is inserted from the bottom of the test block with the energy cavity facing upward. The detonator’s other parts were utilized as part of the burden, as depicted in the right figure of Figure 1a. Figure 1b shows that this study employed three stemming methods: clay, water + clay, and sand + clay. Water and sand (ordinary river sand with a particle size of less than 2 mm) were filled into small-sized balloons, with the clay and balloon diameters being approximately 8 mm, nearly equal to the diameter of the blast hole. A total of 15 sets of blasting tests were conducted with different burden lengths (W) and varying stemming lengths (S), as shown in Table 1.
Researchers have been continuously striving to optimize the utilization of explosive energy for rock fragmentation while minimizing the impact of air shock and ground vibrations. For instance, in long-hole blasting for underground mining, people hope to use the blasting energy as much as possible to crush the lower orebody while minimizing the effects of blasting vibrations, stemming recoil, and air shock on the upper chamber. Two strain gauges were placed on the test block’s bottom (the surface that forms a crater). These strain gauges can indirectly reflect the energy of the explosive used for rock fragmentation. Additionally, two strain gauges were positioned on the upper surface of the test block to indirectly reflect the energy used for generating air shock, stemming recoil, and blasting vibrations. This setup enabled the assessment of the influence of stemming length and material on rock fragmentation and the surface response of the test block. The distance between the strain gauges and the blast hole was set to 80 mm to minimize the gauge damage caused by rock fragmentation and blasting craters. The tangential strain gauges were labeled as 1# and 3#, and the radial strain gauges were labeled as 2# and 4#, as shown in Figure 1a.
The strain gauges and signal transmission lines were welded to ensure accurate data monitoring, and the joints were wrapped with insulating tape. Multi-core shielded cables were used as the measurement connecting cables. The strain gauges were connected to the ultra-dynamic data monitoring system through the Wheatstone bridge box. A voltage regulator was also equipped to provide a stable power supply for the instruments. The strain gauges used in the tests are 120 Ω resistance strain gauges produced by Ningbo YaoNan Electromechanical Equipment Co. (Ningbo, China). They had a grid size of 2.8 mm × 5 mm and a sensitivity coefficient of 2.11 ± 0.01. The dynamic data monitoring system used in the test was the TDEC NUXI-1004 instrument produced by Sichuan Topelec Co. (Chengdu, China). The sampling rate was set to 1 MHz (1 μs data acquisition interval), sufficient for data collection in this test. Moreover, necessary filters were selected based on testing requirements to filter out interference signals outside the frequency range of the measured signals.
Furthermore, in some vertical hole blasting, such as in large-diameter long-hole mining [39,49,50] and VCR (Vertical Crater Retreat) mining methods for stope blasting, stemming materials often violent ejection from the blast holes. This phenomenon, known as “stemming recoil”, can cause damage to support structures like roof steel mesh and anchors in the upper chamber. To assess the influence of different stemming lengths and materials on the recoil extent, a whitepaper with scale lines was placed on the upper surface of the test block, and the recoil area of the stemming on the whitepaper was measured after each blast. The final configuration of the test block is illustrated in Figure 2.

2.2. Evaluation Method

This study conducted analyses from various perspectives, including fragment size analysis, blasting crater size, recoil area, and fragmentation energy, to evaluate the fragmentation effects of the test blocks after blasting.

2.2.1. Fragment Size Analysis Method

  • Total Weight
After each blasting, the fragments produced by each test block were collected and weighed. Subsequently, a sieving process was employed to classify the fragments, and the size distribution was analyzed. Particular attention was paid to the collection of fines, i.e., particles smaller than 1 mm [51]. We implemented a series of precautions, such as thoroughly collecting fragments post-blasting and during sieving, ensuring that all fragments were collected. Additionally, plastic film was used to enclose the lower part of the specimen, particularly the portion supported by bricks. Thus, any mass loss is minimal, and while some fragments might have been reduced to dust, their overall mass is minimal, roughly estimated to be less than 1%.
2.
Mean Fragment Size
The average fragment size partially represents the degree of rock fragmentation. A smaller mean fragment indicates a finer overall fragmentation of the test block.
3.
Fractal Dimension
Following the sieving process of the fragments, the fractal dimension was used to analyze the rock’s fragmentation effectiveness. Generally, a higher fractal dimension indicates a more favorable fragmentation outcome. The relationship between the cumulative mass probability of the fragments and the characteristic size was expressed as follows:
lg y ( d ) M = ( 3 D ) lg x i x max
where D is the fractal dimension of the fragment, xi stands for the grain size of the particles, xmax is the maximum scale of the fragmentation, y(d) denotes the cumulative mass of fragments smaller than xi, and M is the total mass of the fragments. From Equation (1), it can be deduced that the slope of the line in the coordinate graph formed by lg[y(d)/M] and lg(xi/xmax) is equal to 3 − D.

2.2.2. Blasting Crater Size and Recoil Range

  • Blasting Crater Area and Mean Radius
The blasting crater’s mean radius and area were measured using the method illustrated in Figure 3. Firstly, the average radius of the crater was obtained by taking the mean of the radii from eight directions within the blasting crater. Subsequently, the area of the blasting crater was calculated using a dedicated area measurement tool.
2.
Recoil Range
After the blasting of the test block, different-sized marks are generated on the whitepaper placed on the upper surface. The explosion of the explosive charge and the stemming material likely produces these marks. To some extent, these marks can reflect the extent of the blasting energy in propelling the stemming material upwards. Furthermore, they can serve as an indicator to evaluate the effectiveness of stemming (due to the fragility of the paper, when measuring the recoil area, only the yellow mark area is considered, while the torn areas are not included). As shown in Figure 4, we can easily measure the rebound range by referencing the scale on the whitepaper. Although this statistical method may be relatively crude, the discrepancies in rebound range resulting from different blasting schemes are evident. Hence, it indicates the degree of stemming material recoil.

2.2.3. Fragmentation Energy Consumption Utilization Rate

In blasting operations, it is essential to maximize the energy of explosives used for rock fragmentation as much as possible, which improves production efficiency and saves production costs. In addition, to some extent, this is also beneficial for reducing secondary disasters caused by blasting. Generally, the ratio of the energy used for rock fracturing and fragmentation (fragmentation energy, Ep) to the total chemical energy of the explosives (Es) is defined as the fragmentation energy consumption utilization rate (η) [48,52], as shown in Equation (2). A higher energy utilization rate indicates less waste of explosive energy and is more favorable for rock fragmentation.
η = E p E s = E p H Q
where H is explosive heat, KJ/kg, Q is the quantity of the explosive charge.
Numerous research findings indicate that the energy used for rock fracturing and fragmentation is related to the newly increased surface area (Ax) during the rock fracture process [2,47,48,53,54]. Ax can be calculated by subtracting the original surface area of the rock block (Ay) from the total surface area of all fragmented rock blocks (As). The original surface area of the fragmented rock block corresponds to the blasting crater area, as measured in the previous section.
Typically, to simplify the calculation, fragmented rock blocks are often considered as regularly shaped objects, such as spheres or cubes. In this case, the rock blocks are assumed to be cubes, and the fragments are classified using sieving. Then, the total surface area of the fragmented rock blocks can be calculated using the following formula:
A s = i = 1 n M t y ( d i ) y ( d i 1 ) 6 d ¯ i 2 ρ d ¯ i 3 = i = 1 n 12 M t y ( d i ) y ( d i 1 ) ρ ( d i 1 + d i )
where ρ is the density of the rock block, Mt is the total mass of the rock blocks in each size fraction, and y(di) represents the cumulative mass percentage of the rock blocks in each size fraction.
Thereby, the rock fragmentation energy consumption based on the newly formed surface area of the rock block can be obtained as:
E p = 2 K 2 E 12 M t ρ i = 1 n y ( d i ) y ( d i 1 ) ( d i 1 + d i ) A y
where K is the fracture toughness coefficient of the test block and E is the elastic modulus.

3. Experimental Results and Analysis

3.1. The Stemming Material Is Clay, Analyze the Stemming Length

3.1.1. Fragments, Crater Size, and Recoil Area

Based on Figure 5a–c, it can be observed that when the stemming material is clay and the burden W is 4, 5, and 6 cm, the total weight of fragments, the area, and the average radius of the blasting crater all increase with the increase of stemming length S.
Regarding the total weight of fragments, for W = 4 cm, as S increases from 0 to 4 cm, the total weight increases from 35.24 g to 113.43 g, representing a growth of 221.9%; for W = 5 cm, as S increases from 0 to 5 cm, the total weight increases from 46.66 g to 207.96 g, showing a growth of 345.7%; for W = 6 cm, as S increases from 0 to 6 cm, the total weight increases from 0 g to 293.42 g, demonstrating growth of approximately 293%. As for the area of the blasting crater, under the three W, it increases by 106.6%, 360.8%, and 270%, respectively, with the increase of S. Similarly, the mean radius of the blasting crater increases by 52.6%, 184%, and 920%, respectively, with the increase of S.
Figure 5d illustrates the variation of average fragment size with the stemming length for different burdens. It is evident that the average fragment size for all three W shows a trend of increasing and then decreasing with the increase of S. For W = 4 cm, the average fragment size reaches its maximum at a stemming length of 2 cm. In addition, for W = 5 cm and 6 cm, the average fragment size reaches its maximum at a stemming length of 4 cm. Only at very small or considerable stemming lengths does the overall fragment size tend to be smaller.
Based on the sieving results of the fragments and Equations (2) to (4), the fragmentation energy consumption utilization rate of different schemes was calculated, and the results are presented in Figure 6a. It is evident that under the three W, the energy utilization rate increases with the increase of S.
In particular, when W is 6 cm, without stemming, no blasting crater or fragments will be produced, resulting in an energy utilization rate of 0 for this scheme. However, by increasing the stemming length, the energy utilization rate gradually rises to 3.15%, representing an increase of approximately 315%. Some fragments are produced for W = 4 cm, even without stemming, but the fragment weight is minimal, leading to an energy utilization rate of only 0.79%. However, when the stemming length is increased to 4 cm, the energy utilization rate increases by 179.7%. The most significant increase in energy utilization rate occurs at W = 5 cm. When the stemming length increases from 0 cm to 5 cm, the utilization rate increases by 2116.9%. Figure 6b illustrates that under the three W, the recoil area decreases with increased stemming length, reducing 64.15%, 89.13%, and 95.18%, respectively.

3.1.2. Dynamic Strain

The impact of stemming on explosion energy can be reflected through monitoring the strain signals on the surface of the test blocks. Stemming affects the strain peak value and may also influence the rise time of the peak strain, strain loading rate, and strain duration. In the 15 sets of blasting tests, 60 strain gauges were arranged, but due to signal interference and breakage of gauge leads et al., only 46 valid data were obtained. In this section, the influence of stemming length on the surface strain of the test blocks is analyzed based on the dynamic strain signals.
Figure 7 presents a typical dynamic strain signal using the W = 6 cm and S = 2 cm scheme as an example. Firstly, strain gauges 1# and 2# show phenomena where the peak strain of 1# is negative (compressive strain, and the larger the negative value, the higher the peak). In contrast, the peak strain of 2# is positive (tensile strain, and the larger the positive value, the higher the peak). This phenomenon is consistent with the trends obtained in previous research [48], and it is observed that the peak strain of 2# is much larger than that of 1#, indicating that the reflected tensile wave plays a significant role in the formation of the blasting crater on the bottom surface of the test block. On the other hand, the strain variations of 3# and 4# are similar, showing an initial compressive strain followed immediately by tensile strain. The waveform exhibits sustained compressive-tensile oscillations before eventually returning to around zero. Based on the time the stress wave reaches the strain gauges, it can be inferred that the energy of the stress wave generates the initial compressive and tensile strains in the waveforms. Therefore, when analyzing the strains of 3# and 4#, the peak compressive and tensile strains are separately recorded.
It is also worth noting that the waveforms do not start changing around 0 ms, indicating that 0 ms is not the initiation time of the explosion, which might be related to the trigger mode employing internal triggering in the instrument used. In addition, some delay in the detonator itself, which occurs during the transition from the initial impulse to the initial charge, as well as potential delay scatter of the electronic detonator, can impact the initiation time of strain.
The peak strains and peak rise times of 1# and 2# strain gauges under three W are counted, respectively, and then the strain loading rate is calculated. Similarly, the peak compressive and tensile strains of 3# and 4# were determined, along with their corresponding compressive and tensile strain loading rates. However, the relationship between strain loading rates and stemming length is insignificant, and due to the complexity of most strain waveforms, it is challenging to precisely determine the duration of strain (time taken for a strain to rise from the beginning to return to zero eventually). As a result, only the variation of peak strains with stemming length was observed. Figure 8 depicts the changes in peak strains with stemming length.
Based on Figure 8a, it can be observed that under the three W, the peak strains of strain gauges 1# and 2# on the bottom surface of the test block increase with the increase of stemming length. Specifically, For W = 4 cm, as S increases from 0 to 4 cm, the peak tensile strain increases by 10.2%, and the peak compressive strain increases by 84.6%. For W = 5 cm, the peak tensile strain increases by 39.3%, and the peak compressive strain increases by 32.4%. For W = 6 cm, the peak tensile strain increases by 39.0%, and the peak compressive strain increases by 88.2%. Figure 8b,c show that the peak compressive and tensile strains of strain gauges 3# and 4# on the upper surface decrease with the increase of stemming length. The compressive strain decreases by 21.2~99.7%, and the tensile strain decreases by 55.92~85.42%.

3.2. The Stemming Length Is the Same, Analyze the Stemming Material

3.2.1. Fragments, Crater Size, and Recoil Area

As shown in Figure 9a–c, when W is the same, using clay stemming results in the highest total weight of fragments, area, and average radius of the blasting crater. Sand + clay stemming comes next, while water + clay stemming yields the smallest values for all three metrics. Compared to clay stemming, using sand + clay stemming leads to a decrease of 45.63% in the total weight of fragments, a decrease of 39.32% in the blasting crater area, and a decrease of 21.15% in the blasting crater mean radius. When using water + clay stemming, the three metrics decrease by 4.2~66.7%, 13.79~41.66%, and 3~20.99%, respectively.
In Figure 9d,e, it is evident that for the mean fragment size and fractal dimension, all test results indicate that water + clay stemming leads to smaller values compared to using full clay stemming. On the other hand, when using sand + clay stemming, the average fragment size is the largest, and the fractal dimension is the smallest. These conclusions indicate that compared to clay stemming, the fragmentation effect of water + clay and sand + clay stemming is worse. The water + clay stemming is more common in small particle sizes, while the sand + clay stemming leads to a concentration of intermediate-sized fragments.
Figure 10a shows the sieving results of three types of stemming materials under different burdens (W). It can be observed that, compared to clay stemming, water + clay stemming allows more fragments to pass through in the smaller particle size range (below 2 mm), while there is little difference in the cumulative mass passing through in the more extensive particle size range (over 10 mm). When using sand + clay stemming, the cumulative mass passing through is the highest in the intermediate particle size range (2~10 mm). At the same time, it is relatively lower in the smaller and larger particle size ranges.
Figure 10b shows the numerical results obtained through three given mass percentages (1%, 10%, and 50%). For all test schemes, at the particle size corresponding to 1% mass passing percentage, water + clay stemming yields smaller sizes than clay stemming, whereas sand + clay stemming shows the largest particle size. At the particle size corresponding to 10% and 50% mass passing percentages, water + clay stemming results in larger sizes than clay stemming, while sand + clay stemming yields smaller sizes than the other two stemming methods. Taking 10% mass passing percentages as an example, the particle sizes for clay stemming are 7.5 mm, 3.5 mm, and 2.2 mm. In contrast, for water + clay stemming, they are 13 mm, 4.5 mm, and 4 mm. Thus, the particle size for 10% mass passing in water + clay stemming is 1.29 to 1.82 times larger than that in clay stemming.
Moser and Grassedeck pointed out that most of the surface area of all fragments in model blasting is related to particles smaller than 1 mm [51], while the newly formed surface area of fragments is positively correlated with the utilization rate of fragmentation energy. Figure 10a shows that water + clay stemming shows a higher cumulative mass in particle sizes below 1 mm. Additionally, based on the particle size corresponding to the 1% mass passing percentage, water + clay exhibits much smaller particle sizes. However, this does not mean water + clay stemming has a higher energy utilization efficiency.
The fragmentation energy utilization rate of the test blocks with different stemming methods is plotted in Figure 11a. It is found that clay stemming has the highest energy utilization rate, followed by sand + clay stemming, and water + clay stemming is the lowest. This suggests that although water + clay stemming generates more particles below 1 mm, its quality is similar to clay stemming and sand + clay stemming. Moreover, the proportion of water + clay stemming in particles larger than 1 mm is relatively smaller. In practical mining production, having more fine particles might help reduce crushing and grinding costs. However, it can also lead to increased losses during shoveling and ore transportation (scraper might not capture fine particles, and small particles are more likely to fall during transportation).
In the comparison of the recoil area shown in Figure 11b, for the three stemming methods, water + clay stemming results in the largest recoil area, followed by sand + clay stemming, and clay stemming has the smallest recoil area. Therefore, in practical production, using water + clay stemming in underground mining may lead to the stemming material rebounding towards the chamber’s roof. In open-pit mining, water + clay stemming may cause the stemming material to fly out of the blast holes and pose safety threats.

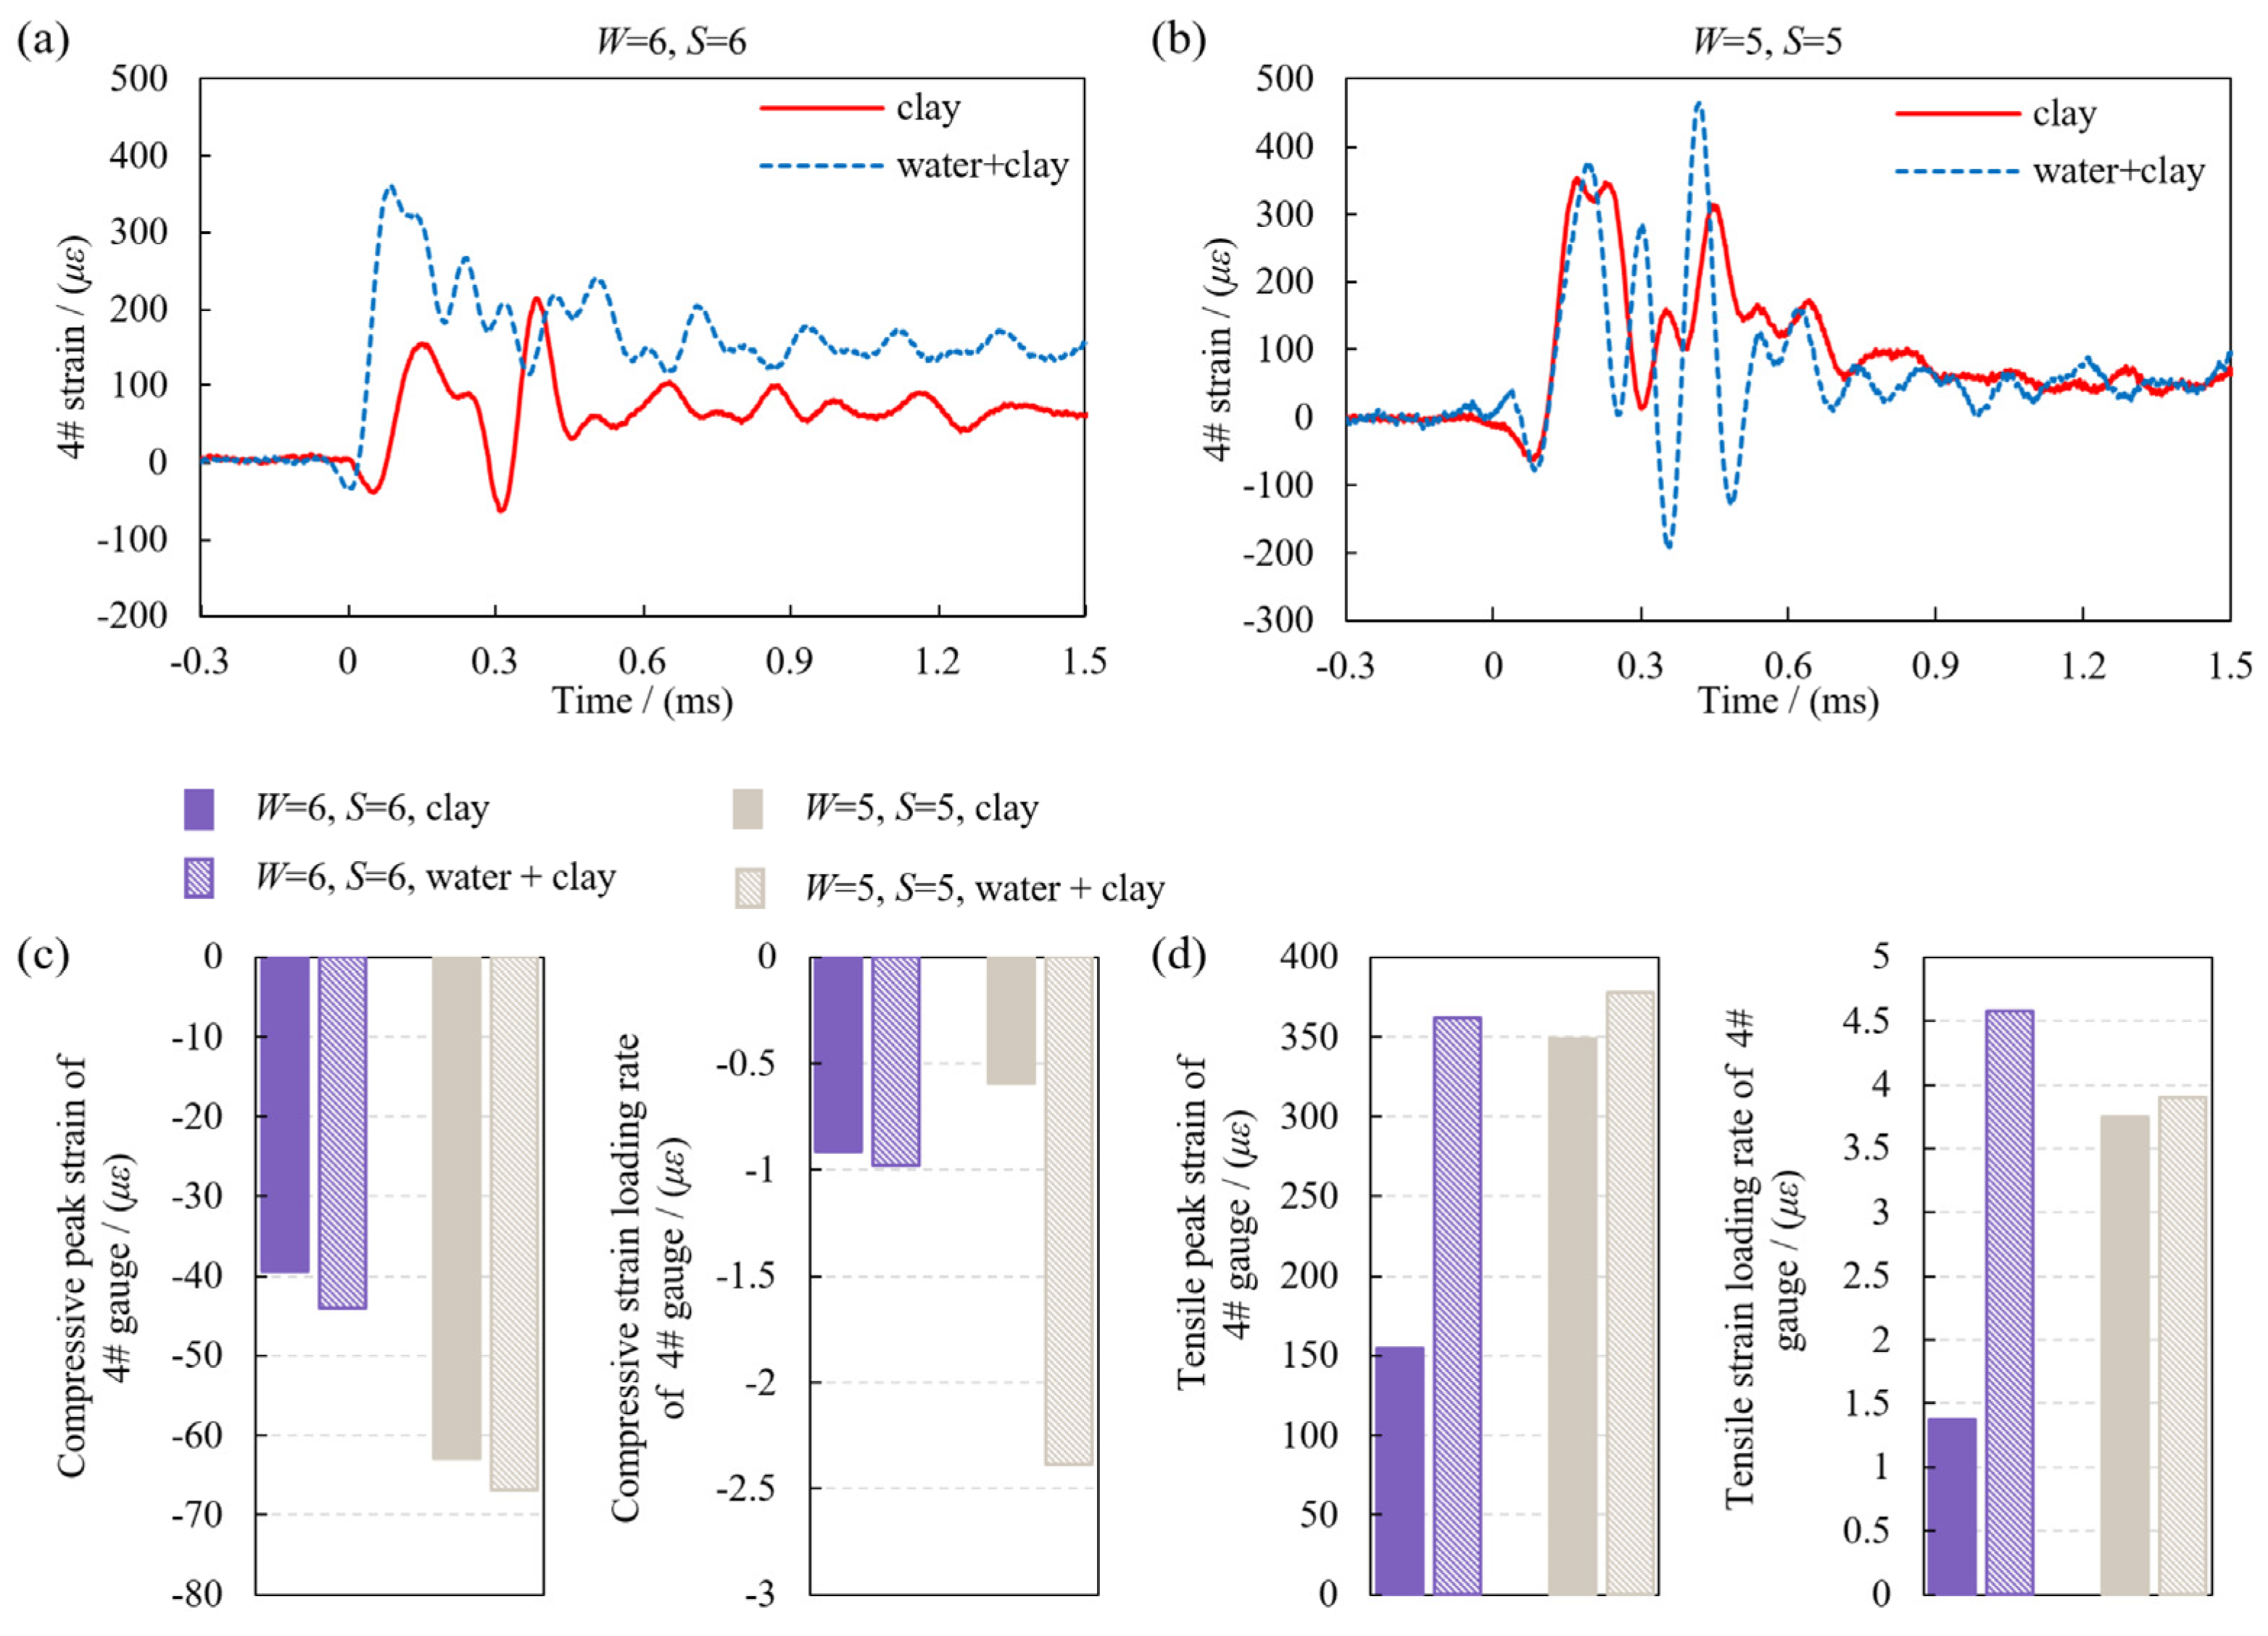
3.2.2. Dynamic Strain

This section analyzes the three stemming methods’ impact on the test blocks’ surface strain based on the acquired dynamic strain signals.
Firstly, the strain variations on the bottom surface of the test block (the surface where the blasting crater is formed) are analyzed. Figure 12a,b displays the strain waveforms measured with the burden (W) of 6 cm and 5 cm, respectively. It can be observed that the strain waveforms are similar to those obtained in Section 3.1.2, where strain gauge 1# shows a negative peak, and strain gauge 2# shows a positive peak, with the magnitude of the peak for gauge 2# being much larger than that of gauge 1#.
Different stemming methods affect the magnitude of strain peaks and the strain loading rates. The peak strains of 1# and 2# under different stemming methods are recorded, and the strain loading rates are calculated based on the peak rise time and strain peak value. The results are presented in Figure 12c,d. From the figures, it can be observed that when using clay stemming, both the peak compressive strain and the compressive strain loading rate are the highest, as well as the peak tensile strain and the tensile strain loading rate. In contrast, these values are the lowest when using water + clay stemming, and sand + clay stemming falls between the two. Specifically, when using sand + clay stemming, the peak tensile strain and the tensile strain loading rate are 36.7% and 38.6% lower than those of clay stemming, respectively. When using water + clay stemming, the peak compressive strain and the compressive strain loading rate are 30.1~30.7% and 27.1~34.0% lower, and the peak tensile strain and the tensile strain loading rate are 43.8~78.9% and 32.3~78.4% lower than those of clay stemming, respectively.
Analyzing gauge 3# strain variations on the top surface of the test block, Figure 13a displays the strain waveforms obtained under three W, similar to the strain waveforms measured in Section 3.1.2. The waveforms show an initial compressive strain, followed by a tensile strain, and then the waveform exhibits continuous compressive-tensile oscillations before eventually returning to approximately zero. Peak compressive and tensile strains are recorded for different stemming methods from the strain signals, and the compressive and tensile strain loading rates are calculated based on the peak rise time and strain peak value. The results are shown in Figure 13b. From the figure, it can be observed that when using clay stemming, both the peak compressive strain and the compressive strain loading rate, as well as the peak tensile strain and the tensile strain loading rate, are the smallest. On the other hand, when using water + clay stemming, these values are the largest, while sand + clay stemming falls between the two.
Specifically, when using sand + clay stemming, the peak compressive strain and the compressive strain loading rate are 201.7% and 79.1% higher, respectively, than those of clay stemming. The peak tensile strain and the tensile strain loading rate are 28.7% and 65.9% higher, respectively. When using water + clay stemming, the peak compressive strain and the compressive strain loading rate are 316.7~35412.2% and 187.0~8778.0% higher than those of clay stemming. The peak tensile strain and the tensile strain loading rate are 24.4~117.3% and 51.6~194.4% higher, respectively.
In the end, the gauge 4# strain variations on the top surface of the test block were analyzed. Figure 14a,b shows the strain waveforms measured under two W, which exhibit similar trends to those discussed in the previous sections. Peak compressive and tensile strains are recorded from the strain signals, and the compressive and tensile strain loading rates are calculated. The results are presented in Figure 14c,d. From the figures, it can be observed that when using clay stemming, both the peak compressive strain and the compressive strain loading rate, as well as the peak tensile strain and the tensile strain loading rate, are smaller than those of water stemming. Specifically, when using water + clay stemming, the peak compressive strain and the compressive strain loading rate are 6.0~11.7% and 6.7% to 301.4% higher, respectively, than those of clay stemming. The peak tensile strain and the tensile strain loading rate are 8.3~133.5% and 4.0~234.1% higher than those of clay stemming when using water + clay stemming.

4. Discussion

4.1. Characteristic Impedance of Stemming Materials

The stemming length affects the length of the detonation wave in the blast hole. The total length of the detonation wave in the blast hole increases with the increment in detonation time, Ts. Ts is related to the stemming length. Compared to the unstemmed condition, the increment in Ts caused by stemming can be calculated using the equation Ts = 2S/cs, where S represents the stemming material length, and cs is the wave velocity of the stemming material [5]. It can be determined through a calculation that adding a 2 cm clay will result in an 11.5 μs time increment in the detonation wave. Typically, 11.5 μs of time in the shockwave contains substantial energy. Increasing the stemming length will consequently increase the length of the detonation wave in the blast hole, which may be one of the reasons why a longer stemming length leads to a higher fragmentation energy utilization rate.
When the detonation wave propagates from the explosive to the stemming material, the characteristic impedance of the stemming material (i.e., the product of its density and P-wave velocity) influences the amplitude of the final wave in the blast hole. Suppose the characteristic impedance of the stemming material is greater than that of the explosive. In that case, the amplitude of the final wave in the blast hole will be greater than that of the original detonation wave. On the other hand, if the characteristic impedance of the stemming material is smaller than that of the explosive, the amplitude of the final wave in the blast hole will be smaller than that of the original wave [5,22,55]. The characteristic impedance of explosives in digital electronic detonators is calculated as Ze = 1130 × 6800 = 7.648 × 10⁶ kg/m2s, while the characteristic impedance of the clay material (Zclay) is calculated as Zclay = 2600 × 3480 = 9.048 × 10⁶ kg/m2s. It can be observed that the characteristic impedance of the clay is greater than that of the explosive, resulting in an increase in detonation wave pressure within the blast hole. For comparison, the characteristic impedance of water is calculated as Zw = 1000 × 1430 = 1.43 × 10⁶ kg/m2s, the characteristic impedance of sand is calculated as Zsand =1500 × 110 = 0.165 × 10⁶ kg/m2s, and the characteristic impedance of air is calculated as Zair = 1.145 × 316 = 3.62 × 10² kg/m2s. The above calculation results indicate that when water, sand, or no stemming is used, the detonation wave pressure in the blast hole will decrease. The above findings explain the higher peak strain values and strain loading rates observed in the strain gauges at the bottom surface (1# and 2#) when using stemming materials like clay compared to cases with no stemming, water stemming, or sand stemming. The greater the characteristic impedance of the stemming material compared to the explosive, the more favorable it is for rock fragmentation, and there are higher strain peaks and strain loading rates on the crater formation surface.
Indeed, increasing the stemming length offers various advantages, such as improving fragmentation energy utilization. However, it is essential to acknowledge that because the stemming is inert, it also consumes detonation energy. When the detonation wave propagates into the stemming material, the stemming material undergoes compression and deformation, both of which consume energy. The amount of energy consumed by the stemming material is dependent on the length of the stemming and the impedance of the stemming material. Generally, longer stemming materials with higher impedance tend to consume more energy. This phenomenon may help explain the observed decrease in tensile and compressive strain peak values of 3# and 4#, recoil areas on the upper surface of test blocks with increasing stemming length, and the peak compressive and tensile strain, strain loading rate, and recoil range during clay stemming are smaller than those during sand + clay stemming and water + clay stemming.

4.2. Impact of Burden

The final fragmentation effect of the test block is not only related to the stemming length but also to the burden. It is observed that when the burden is 6 cm, no blasting crater will be generated without stemming. However, upon stemming, blasting craters and fragmented blocks are produced. Furthermore, the total weight of fragments, the area and average radius of the crater, and the fragmentation energy consumption utilization rate all increase with the increase in stemming length. A 6 cm stemming length enhances the utilization rate by approximately 315%. Hence, for a burden of a certain magnitude, increasing the stemming length can yield more efficient rock fragmentation. However, in subsequent tests with a burden of 7 cm, it was discovered that neither stemming nor increasing the stemming length to 7 cm would form a blasting crater. This indicates the presence of a critical burden for crater blasting. Once the critical burden is exceeded, even increasing the stemming length will not lead to rock fragmentation. In this model test, the critical burden is 7 cm.
At W = 6 cm and S = 2 cm, the fragmentation energy consumption utilization rate is 0.58%, with a total fragments mass reaching 82.42 g. This value exceeds the energy utilization rate of 0.53%, and a total mass of 46.66 g was obtained at W = 5 cm and S = 0 cm. Similarly, at W = 5 cm and S = 2 cm, the energy utilization rate is 1.32%, and the total mass is 90.28 g. This value exceeds the energy utilization rate of 0.79%, and a total mass of 35.24 g was obtained at W = 4 cm and S = 0 cm. These results demonstrate that increasing the stemming length is advantageous in enhancing the burden before surpassing the critical burden.
There exists an optimal matching relationship between stemming length and burden. For instance, at W = 5 cm and S = 5 cm, the energy utilization rate reaches the highest value among all schemes, achieving 11.75%. Similarly, at W = 6 cm and S = 6 cm, the total mass of fragments reaches the highest value of 293.42 g among all schemes. However, optimizing the matching relationship between the burden and the stemming length is a problem with multiple evaluation criteria. Determining the best scheme requires further research. Due to limitations in experimental costs, the stemming lengths used in this study were within the burden. Additional stemming length schemes should be explored in future research to gain more insights into the optimal configurations.

4.3. Applications

Increasing the stemming length can improve the fragmentation energy consumption utilization rate when using clay stemming. Still, it may also elevate the risk of blast hole plugging and increase the workload for post-blast hole unblocking [36]. Experimental findings in this study reveal that when W = 6 cm and S = 6 cm, after blasting, the holes with clay stemming are not completely unblocked, while those water + clay or sand + clay stemming are unblocked, which may be related to the friction coefficient between the stemming material and the borehole wall, in addition, water may have some scouring and cleaning effects on the borehole wall.
As shown in Figure 9 to Figure Figure 11, regarding fragmentation characteristics, clay stemming resulted in the highest total mass of fragments (293.4 g, 208.0 g, and 113.4 g) and the smallest recoil area (3.4 cm2, 3.98 cm2, and 13.39 cm2), sand + clay stemming yielded fewer large and fine particles, with the bulk of the fragments concentrated in the middle size range. Therefore, if the goal is to enhance the utilization of explosive energy and reduce the hazards of stemming recoil (this is beneficial for both mining enterprises and environmental sustainability), it is recommended to use clay and ensure an ample stemming length (generally approximately equal to the burden). Conversely, if a uniform fragment is desired (reducing large and fine particles), sand + clay stemming can be employed. Water + clay stemming may reduce the likelihood of blast hole plugging, generating more fine particles and more substantial recoil. The experimental setup in this study does indeed appear to be carried out for single free surface long-hole blasting, such as VCR (Vertical Crater Retreat mining method) stopes and large-diameter long-hole stopes. Whether the conclusions drawn from these tests are applicable to tunnel excavation blasting would require further research.

5. Conclusions

In this study, based on 15 small-scale model blasting tests, the influence of stemming lengths and three types of stemming materials on rock fragmentation and dynamic strain were investigated using blasting crater, fragment size, and recoil area measurements, as well as strain testing. The following conclusions were obtained:
(1) When using clay stemming, increasing the stemming length is beneficial for rock fragmentation and reduces the area of stemming recoil. The total weight of fragments, the area and mean radius of the blasting crater, and the fragmentation energy consumption utilization rate all increase with the increase in stemming length, while the recoil area decreases with the increase in stemming length.
(2) The stemming length significantly influences the peak strains on the bottom surface (blasting crater formation surface) and the upper surface of the test block. The peak tensile and compressive strains on the bottom surface increase with the increase in stemming length. On the other hand, both the peak compressive and tensile strains on the upper surface of the test block decrease with the increase in stemming length. Increasing the stemming length causes a more significant portion of the explosive energy to act on the blasting crater formation surface and less energy to act on the upper surface of the test block.
(3) By comparing different stemming materials, it was observed that clay stemming results in the highest total weight of fragments, the largest area and mean radius of the crater, and the highest energy utilization rate under the same burden. Compared to clay stemming, water + clay stemming produces fragments that are more concentrated in smaller particle sizes (below 2 mm), while sand + clay stemming results in fragments that are more concentrated in medium particle sizes (2–10 mm).
(4) Stemming material affects the strains of the test block significantly, not only in peak strains but also in strain loading rates. Clay stemming results in the highest peak compressive and tensile strains and strain loading rates on the blasting crater formation surface. The strain signals on the upper surface of the test block exhibit the opposite trend. Compared to water + clay stemming and sand + clay stemming, clay stemming is more effective in directing explosive energy to act on the blasting crater formation surface while minimizing its effect on the upper surface of the test block.

Author Contributions

X.S.: Supervision, writing—review & editing. Z.Z.: Investigation, project administration, writing—original draft. X.Q.: Writing—review & editing. Z.L.: Investigation. Writing—review. All authors have read and agreed to the published version of the manuscript.

Funding

This study is supported by the Fundamental Research Funds for the Central Universities of Central South University (Grant Nos. 2022ZZTS0083), Postgraduate scientific research innovation project of Hunan Province (Grant Nos. CX20220171), the National Natural Science Foundation Project of China (Grant Nos. 52004329), and the National Basic Research Development Program of China (Grant Nos. 2022YFC2904602).

Institutional Review Board Statement

Not applicable.

Informed Consent Statement

Not applicable.

Data Availability Statement

The data used to support the findings of this study are available from the corresponding author upon request.

Acknowledgments

The authors fully acknowledged the Fundamental Research Funds for the Central Universities of Central South University (Grant Nos. 2022ZZTS0083), the Postgraduate scientific research innovation project of Hunan Province (Grant Nos. CX20220171), the National Natural Science Foundation Project of China (Grant Nos. 52004329), and the National Basic Research Development Program of China (Grant Nos. 2022YFC2904602). The authors gratefully acknowledge the help and comments of reviewers and editors.

Conflicts of Interest

The authors declare no conflict of interest.

References

  1. Peng, J.; Zhang, F.; Du, C.; Yang, X. Effects of Confining Pressure on Crater Blasting in Rock-like Materials under Electric Explosion Load. Int. J. Impact Eng. 2020, 139, 103534. [Google Scholar] [CrossRef]
  2. Sanchidrián, J.A.; Segarra, P.; López, L.M. Energy Components in Rock Blasting. Int. J. Rock Min. Sci. 2007, 44, 130–147. [Google Scholar] [CrossRef]
  3. Ouchterlony, F.; Nyberg, U.; Olsson, M.; Bergqvist, I.; Granlund, L.; Grind, H. Where Does the Explosive Energy in Rock Blasting Rounds Go? Sci. Technol. Energ. 2004, 65, 53–64. [Google Scholar]
  4. Oates, T.E.; Spiteri, W. Stemming and Best Practice in the Mining Industry: A Literature Review. J. S. Afr. Inst. Min. Metall. 2021, 121, 1–11. [Google Scholar] [CrossRef]
  5. Zhang, Z. Rock Fracture and Blasting: Theory and Applications; Butterworth-Heinemann: Oxford, UK; Elsevier: Oxford, UK, 2016; ISBN 978-0-12-802688-5. [Google Scholar]
  6. Ur Rehman, A.; Emad, M.Z.; Khan, M.U. Improving the Environmental and Economic Aspects of Blasting in Surface Mining by Using Stemming Plugs. J. S. Afr. Inst. Min. Metall. 2021, 121, 369–377. [Google Scholar] [CrossRef]
  7. Boshoff, D.; Webber-Youngman, R.C.W. Testing Stemming Performance, Possible or Not? J. South. Afr. Inst. Min. Metall. 2011, 111, 871–874. [Google Scholar]
  8. Zhang, Z.; Hou, D.; Guo, Z.; He, Z. Laboratory Experiment of Stemming Impact on Rock Fragmentation by a High Explosive. Tunn. Undergr. Space Technol. 2020, 97, 103257. [Google Scholar] [CrossRef]
  9. Fourney, W.L.; Barker, D.B.; Holloway, D.C. Model Studies of Explosive Well Stimulation Techniques. Int. J. Rock Mech. Min. Sci. Geomech. Abstr. 1981, 18, 113–127. [Google Scholar] [CrossRef]
  10. Choudhary, B.S.; Rai, P. Stemming Plug and Its Effect on Fragmentation and Muckpile Shape Parameters. Int. J. Min. Miner. Eng. 2013, 4, 296–311. [Google Scholar] [CrossRef]
  11. Cui, Z.; Yuan, L.; Yan, C. Water–Silt Composite Blasting for Tunneling. Int. J. Rock Min. Sci. 2010, 47, 1034–1037. [Google Scholar] [CrossRef]
  12. Hong, Z.; Tao, M.; Cui, X.; Wu, C.; Zhao, M. Experimental and Numerical Studies of the Blast-Induced Overbreak and Underbreak in Underground Roadways. Undergr. Space 2023, 8, 61–79. [Google Scholar] [CrossRef]
  13. Kojovic, T. Influence of Aggregate Stemming in Blasting on the SAG Mill Performance. Miner. Eng. 2005, 18, 1398–1404. [Google Scholar] [CrossRef]
  14. Dally, J.W.; Fourney, W.L.; Holloway, D.C. Influence of Containment of the Bore Hole Pressures on Explosive Induced Fracture. Int. J. Rock Mech. Min. Sci. Geomech. Abstr. 1975, 12, 5–12. [Google Scholar] [CrossRef]
  15. Choudhary, B.S.; Agrawal, A. Minimization of Blast-Induced Hazards and Efficient Utilization of Blast Energy by Implementing a Novel Stemming Plug System for Eco-Friendly Blasting in Open Pit Mines. Nat. Resour. Res. 2022, 31, 3393–3410. [Google Scholar] [CrossRef]
  16. Sari, M.; Ghasemi, E.; Ataei, M. Stochastic Modeling Approach for the Evaluation of Backbreak Due to Blasting Operations in Open Pit Mines. Rock Mech. Rock Eng. 2014, 47, 771–783. [Google Scholar] [CrossRef]
  17. Chen, M.; Ye, Z.; Wei, D.; Lu, W.; Yan, P. The Movement Process and Length Optimization of Deep-Hole Blasting Stemming Structure. Int. J. Rock Min. Sci. 2021, 146, 104836. [Google Scholar] [CrossRef]
  18. Cevizci, H.; Ozkahraman, H.T. The Effect of Blast Hole Stemming Length to Rockpile Fragmentation at Limestone Quarries. Int. J. Rock Min. Sci. 2012, 53, 32–35. [Google Scholar] [CrossRef]
  19. Mpofu, M.; Ngobese, S.; Maphalala, B.; Roberts, D.; Khan, S. The Influence of Stemming Practice on Ground Vibration and Air Blast. J. S. Afr. Inst. Min. Metall. 2021, 121, 1–10. [Google Scholar] [CrossRef]
  20. Shahrin, M.I.; Abdullah, R.A.; Jeon, S.; Jeon, B.; Sa’ari, R.; Alel, M.N.A. Numerical Simulation on the Effect of Stemming to Burden Ratio on Rock Fragmentation by Blasting. In Proceedings of the International Symposium on Rock Engineering for Innovative Future, Okinawa, Japan, 1–4 December 2019. [Google Scholar]
  21. Prasad, S.; Choudhary, B.S.; Mishra, A.K. Effect of Stemming to Burden Ratio and Powder Factor on Blast Induced Rock Fragmentation—A Case Study. IOP Conf. Ser. Mater. Sci. Eng. 2017, 225, 012191. [Google Scholar] [CrossRef]
  22. Zhang, Z.; Qiao, Y.; Chi, L.; Hou, D. Experimental Study of Rock Fragmentation under Different Stemming Conditions in Model Blasting. Int. J. Rock Min. Sci. 2021, 143, 104797. [Google Scholar] [CrossRef]
  23. Sharma, S.K.; Rai, P. Investigation of Crushed Aggregate as Stemming Material in Bench Blasting: A Case Study. Geotech. Geol. Eng. 2015, 33, 1449–1463. [Google Scholar] [CrossRef]
  24. Cevizci, H. A Newly Developed Plaster Stemming Method for Blasting. J. S. Afr. Inst. Min. Metall. 2012, 112, 8. [Google Scholar]
  25. Cevizci, H. Comparison of the Efficiency of Plaster Stemming and Drill Cuttings Stemming by Numerical Simulation. J. S. Afr. Inst. Min. Metall. 2019, 119, 465–470. [Google Scholar] [CrossRef]
  26. Cevizci, H. Fragmentation, Cost and Environmental Effects of Plaster Stemming Method for Blasting at A Basalt Quarry. Arch. Min. Sci. 2014, 59, 835–846. [Google Scholar] [CrossRef]
  27. Wang, H.; Wang, Z.; Wang, J.; Wang, S.; Wang, H.; Yin, Y.; Li, F. Effect of Confining Pressure on Damage Accumulation of Rock under Repeated Blast Loading. Int. J. Impact Eng. 2021, 156, 103961. [Google Scholar] [CrossRef]
  28. Pu, C.; Yang, X.; Zhao, H.; Chen, Z.; Xiao, D. Numerical Investigation on Crack Propagation and Coalescence Induced by Dual-Borehole Blasting. Int. J. Impact Eng. 2021, 157, 103983. [Google Scholar] [CrossRef]
  29. Zhang, Z.; Hou, D.; Guo, Z.; He, Z.; Zhang, Q. Experimental Study of Surface Constraint Effect on Rock Fragmentation by Blasting. J. Rock Min. Sci. 2020, 128, 104278. [Google Scholar] [CrossRef]
  30. Chi, L.; Zhang, Z.; Aalberg, A.; Yang, J.; Li, C. Fracture Processes in Granite Blocks Under Blast Loading. Rock Mech. Rock Eng. 2019, 52, 853–868. [Google Scholar] [CrossRef]
  31. Yang, R.; Ding, C.; Yang, L.; Lei, Z.; Zheng, C. Study of Decoupled Charge Blasting Based on High-Speed Digital Image Correlation Method. Tunn. Undergr. Space Technol. 2019, 83, 51–59. [Google Scholar] [CrossRef]
  32. Tilert, D.; Svedbjörk, G.; Ouchterlony, F.; Nilsson, B.; Temun, A.; Mattsson, L. Measurement of Explosively Induced Movement and Spalling of Granite Model Blocks. Int. J. Impact Eng. 2007, 34, 1936–1952. [Google Scholar] [CrossRef]
  33. Johansson, D.; Ouchterlony, F. Shock Wave Interactions in Rock Blasting: The Use of Short Delays to Improve Fragmentation in Model-Scale. Rock Mech. Rock Eng. 2013, 46, 1–18. [Google Scholar] [CrossRef]
  34. Fourney, W.L.; Bihr, S.; Leiste, U. Borehole Pressures in an Air Decked Situation. Fragblast 2006, 10, 47–60. [Google Scholar] [CrossRef]
  35. Yan, P.; Zhou, W.; Lu, W.; Chen, M.; Zhou, C. Simulation of Bench Blasting Considering Fragmentation Size Distribution. Int. J. Impact Eng. 2016, 90, 132–145. [Google Scholar] [CrossRef]
  36. Ma, J.; Zhao, J.; Lin, Y.; Liang, J.; Chen, J.; Chen, W.; Huang, L. Study on Tamped Spherical Detonation-Induced Dynamic Responses of Rock and PMMA Through Mini-Chemical Explosion Tests and a Four-Dimensional Lattice Spring Model. Rock Mech. Rock Eng. 2023, 1–19. [Google Scholar] [CrossRef]
  37. Ma, J.; Chen, J.; Chen, W.; Huang, L. A Coupled Thermal-Elastic-Plastic-Damage Model for Concrete Subjected to Dynamic Loading. Int. J. Plasticity 2022, 153, 103279. [Google Scholar] [CrossRef]
  38. Ma, J.; Chen, J.; Guan, J.; Lin, Y.; Chen, W.; Huang, L. Implementation of Johnson-Holmquist-Beissel Model in Four-Dimensional Lattice Spring Model and Its Application in Projectile Penetration. Int. J. Impact Eng. 2022, 170, 104340. [Google Scholar] [CrossRef]
  39. Qiu, X.; Shi, X.; Zhang, S.; Liu, B.; Zhou, J. Experimental Study on the Blasting Performance of Water-Soil Composite Stemming in Underground Mines. Adv. Mater. Sci. Eng. 2018, 2018, 3523509. [Google Scholar] [CrossRef]
  40. Chen, H.; Qiu, X.; Shi, X.; Zhang, J.; Huo, X.; Li, D. Experimental Study on Fracturing Characteristics of Double-Hole Blasting Under Static Stresses. Front. Earth Sci. 2022, 9, 829258. [Google Scholar] [CrossRef]
  41. Chi, Y.; Zhang, Z.; Aalberg, A.; Yang, J.; Li, C. Measurement of Shock Pressure and Shock-Wave Attenuation near a Blast Hole in Rock. Int. J. Impact Eng. 2019, 125, 27–38. [Google Scholar] [CrossRef]
  42. He, C.; Yang, J.; Yu, Q. Laboratory Study on the Dynamic Response of Rock under Blast Loading with Active Confining Pressure. Int. J. Rock Mech. Min. 2018, 102, 101–108. [Google Scholar] [CrossRef]
  43. Chi, L.; Wang, C.; Zhang, Z.; Xu, X.; Yang, J. Experimental Investigation of Decoupled Charge Effect on Rock Fragmentation by Blasting. Rock Mech. Rock Eng. 2022, 55, 3791–3806. [Google Scholar] [CrossRef]
  44. Zhang, F.; Yan, G.; Peng, J.; Qiu, Z.; Dai, X. Experimental Study on Crack Formation in Sandstone during Crater Blasting under High Geological Stress. Bull. Eng. Geol. Environ. 2020, 79, 1323–1332. [Google Scholar] [CrossRef]
  45. Li, X. Drilling and Blasting Engineering; Cent South Univ. Press: Changsha, China, 2011. (In Chinese) [Google Scholar]
  46. Yang, R.; Li, W.; Yang, G.; Ma, X. Experimental study on the blasting effects of rich-iron ore with different explosives. Explos. Shock Waves 2020, 40, 93–104. (In Chinese) [Google Scholar]
  47. Lei, Z.; Zhang, Z.; Huang, Y.; Zhou, J.; Bai, Y. An investigation of energy consumption variation in rock blasting breaking with the resistance line. Explos. Shock Waves 2021, 41, 151–160. (In Chinese) [Google Scholar]
  48. Zhang, Z.; Qiu, X.; Shi, X.; Luo, Z.; Chen, H.; Zong, C. Burden Effects on Rock Fragmentation and Damage, and Stress Wave Attenuation in Cut Blasting of Large Diameter Long-Hole Stopes. Rock Mech. Rock Eng. 2023. ahead of publish. [Google Scholar] [CrossRef]
  49. Wang, M.; Shi, X.; Zhou, J.; Qiu, X. Multi-Planar Detection Optimization Algorithm for the Interval Charging Structure of Large-Diameter Longhole Blasting Design Based on Rock Fragmentation Aspects. Eng. Optim. 2018, 50, 2177–2191. [Google Scholar] [CrossRef]
  50. Qiu, X.; Hao, Y.; Shi, X.; Hao, H.; Zhang, S.; Gou, Y. Numerical Simulation of Stress Wave Interaction in Short-Delay Blasting with a Single Free Surface. PLoS ONE 2018, 13, e0204166. [Google Scholar] [CrossRef] [PubMed]
  51. Moser, P.; Grasedieck, A. Rock Specific Breakage Energy Functions Derived from Lab Scale Blast Experiments. In Proceedings of the 30th Annual Conference on Explosives & Blasting Technique, New Orleans, LA, USA, 1–4 February 2004; pp. 41–52. [Google Scholar]
  52. Zhou, J.; Zhang, Z.; Wang, J.; Huang, Y.; Lei, Z. Energy Analysis on the Effect of Minimum Burden on Rock Fragmentation. Chin. J. Undergr. Space Eng. 2021, 17, 135–142. (In Chinese) [Google Scholar]
  53. Liu, L.; Katsabanis, P.D. Development of a Continuum Damage Model for Blasting Analysis. Int. J. Rock Mech. Min. 1997, 34, 217–231. [Google Scholar] [CrossRef]
  54. Hamdi, E.; du Mouza, J.; Fleurisson, J.A. Evaluation of the Part of Blasting Energy Used for Rock Mass Fragmentation. Fragblast 2001, 5, 180–193. [Google Scholar] [CrossRef]
  55. Zhang, Z.; Gong, F.; Kozlovskaya, E.; Aladejare, A. Characteristic Impedance and Its Applications to Rock and Mining Engineering. Rock Mech. Rock Eng. 2023, 56, 3139–3158. [Google Scholar] [CrossRef]
Figure 1. Experimental setup for blasting, the drawings in the figure are not in scale; (a) sketch maps of specimens, charging structure of borehole, and strain gauge arrangement; (b) Three types of stemming methods.
Sustainability 15 13024 g001
Figure 2. Schematic diagram of the final set test block.
Sustainability 15 13024 g002
Figure 3. Measurement of crater radius and crater area.
Sustainability 15 13024 g003
Figure 4. Measurement of recoil area.
Sustainability 15 13024 g004
Figure 5. Influence of stemming length on the total mass of fragments, area and mean radius of blasting crater, and mean fragment size. (a) Total mass of fragments; (b) crater area; (c) mean radius of crater; (d) mean fragment size.
Sustainability 15 13024 g005
Figure 6. The variation of fragmentation energy consumption utilization rate and recoil area with stemming length. (a) Fragmentation energy consumption utilization rate; (b) recoil area.
Sustainability 15 13024 g006
Figure 7. Taking the 1# to 4# strain waveforms with W = 6 cm and S = 2cm as an example to introduce typical dynamic strain signals. (a) 1#, 2# strain waveforms; (b) 3#, 4# strain waveforms.
Sustainability 15 13024 g007
Figure 8. The variation of peak strains with stemming length; (a) The changes in the peak compressive strain of 1# strain gauge and the peak tensile strain of 2# strain gauge with stemming length; (b) The changes in the peak compressive strain of 3#, 4# strain gauge with stemming length; (c) The changes in the peak tensile strain of 3#, 4# strain gauge with stemming length.
Sustainability 15 13024 g008
Figure 9. Comparison of the total weight of fragments, blasting crater area, crater mean radius, mean size of fragments, and fractal dimension of three stemming methods under different W. (a) Total weight of fragments; (b) blasting crater area; (c) crater mean radius; (d) mean size of fragments; (e) fractal dimension.
Sustainability 15 13024 g009
Figure 10. Fragments size distribution of different stemming materials tests; (a) accumulated mass passing vs. particle size; (b) particle sizes at 1%, 10%, and 50% mass passing percentages.
Sustainability 15 13024 g010
Figure 11. Comparison of fragmentation energy utilization rate and recoil range of three stemming methods; (a) fragmentation energy utilization rate; (b) recoil range.
Sustainability 15 13024 g011
Figure 12. Strain 1# and 2# on the bottom; (a,b) strain waveform; (c) 1# peak strain and strain loading rate; (d) 2# peak strain and strain loading rate.
Sustainability 15 13024 g012
Figure 13. 3# strain on the upper surface of the test block; (a) Strain waveform; (b) The peak strain and strain loading rate of the first compressive strain, the peak strain and strain loading rate of the first tensile strain.
Sustainability 15 13024 g013
Figure 14. 4# strain on the upper surface of the test block; (a,b) Strain waveform; (c) The peak strain and strain loading rate of the first compressive strain; (d) the peak strain and strain loading rate of the first tensile strain.
Sustainability 15 13024 g014
Table 1. Parameters of the 15 tests.
Test Order123456789101112131415
Burden W/(cm)6546545
Clay length/(cm)024602450242222
Water length/(cm) 432
Sand length/(cm) 3
Disclaimer/Publisher’s Note: The statements, opinions and data contained in all publications are solely those of the individual author(s) and contributor(s) and not of MDPI and/or the editor(s). MDPI and/or the editor(s) disclaim responsibility for any injury to people or property resulting from any ideas, methods, instructions or products referred to in the content.

