


Comparative Analysis of Three Near-Surface Air Temperature Reanalysis Datasets in Inner Mongolia Region

 ,
,
Abstract
:1. Introduction
2. Data and Methods
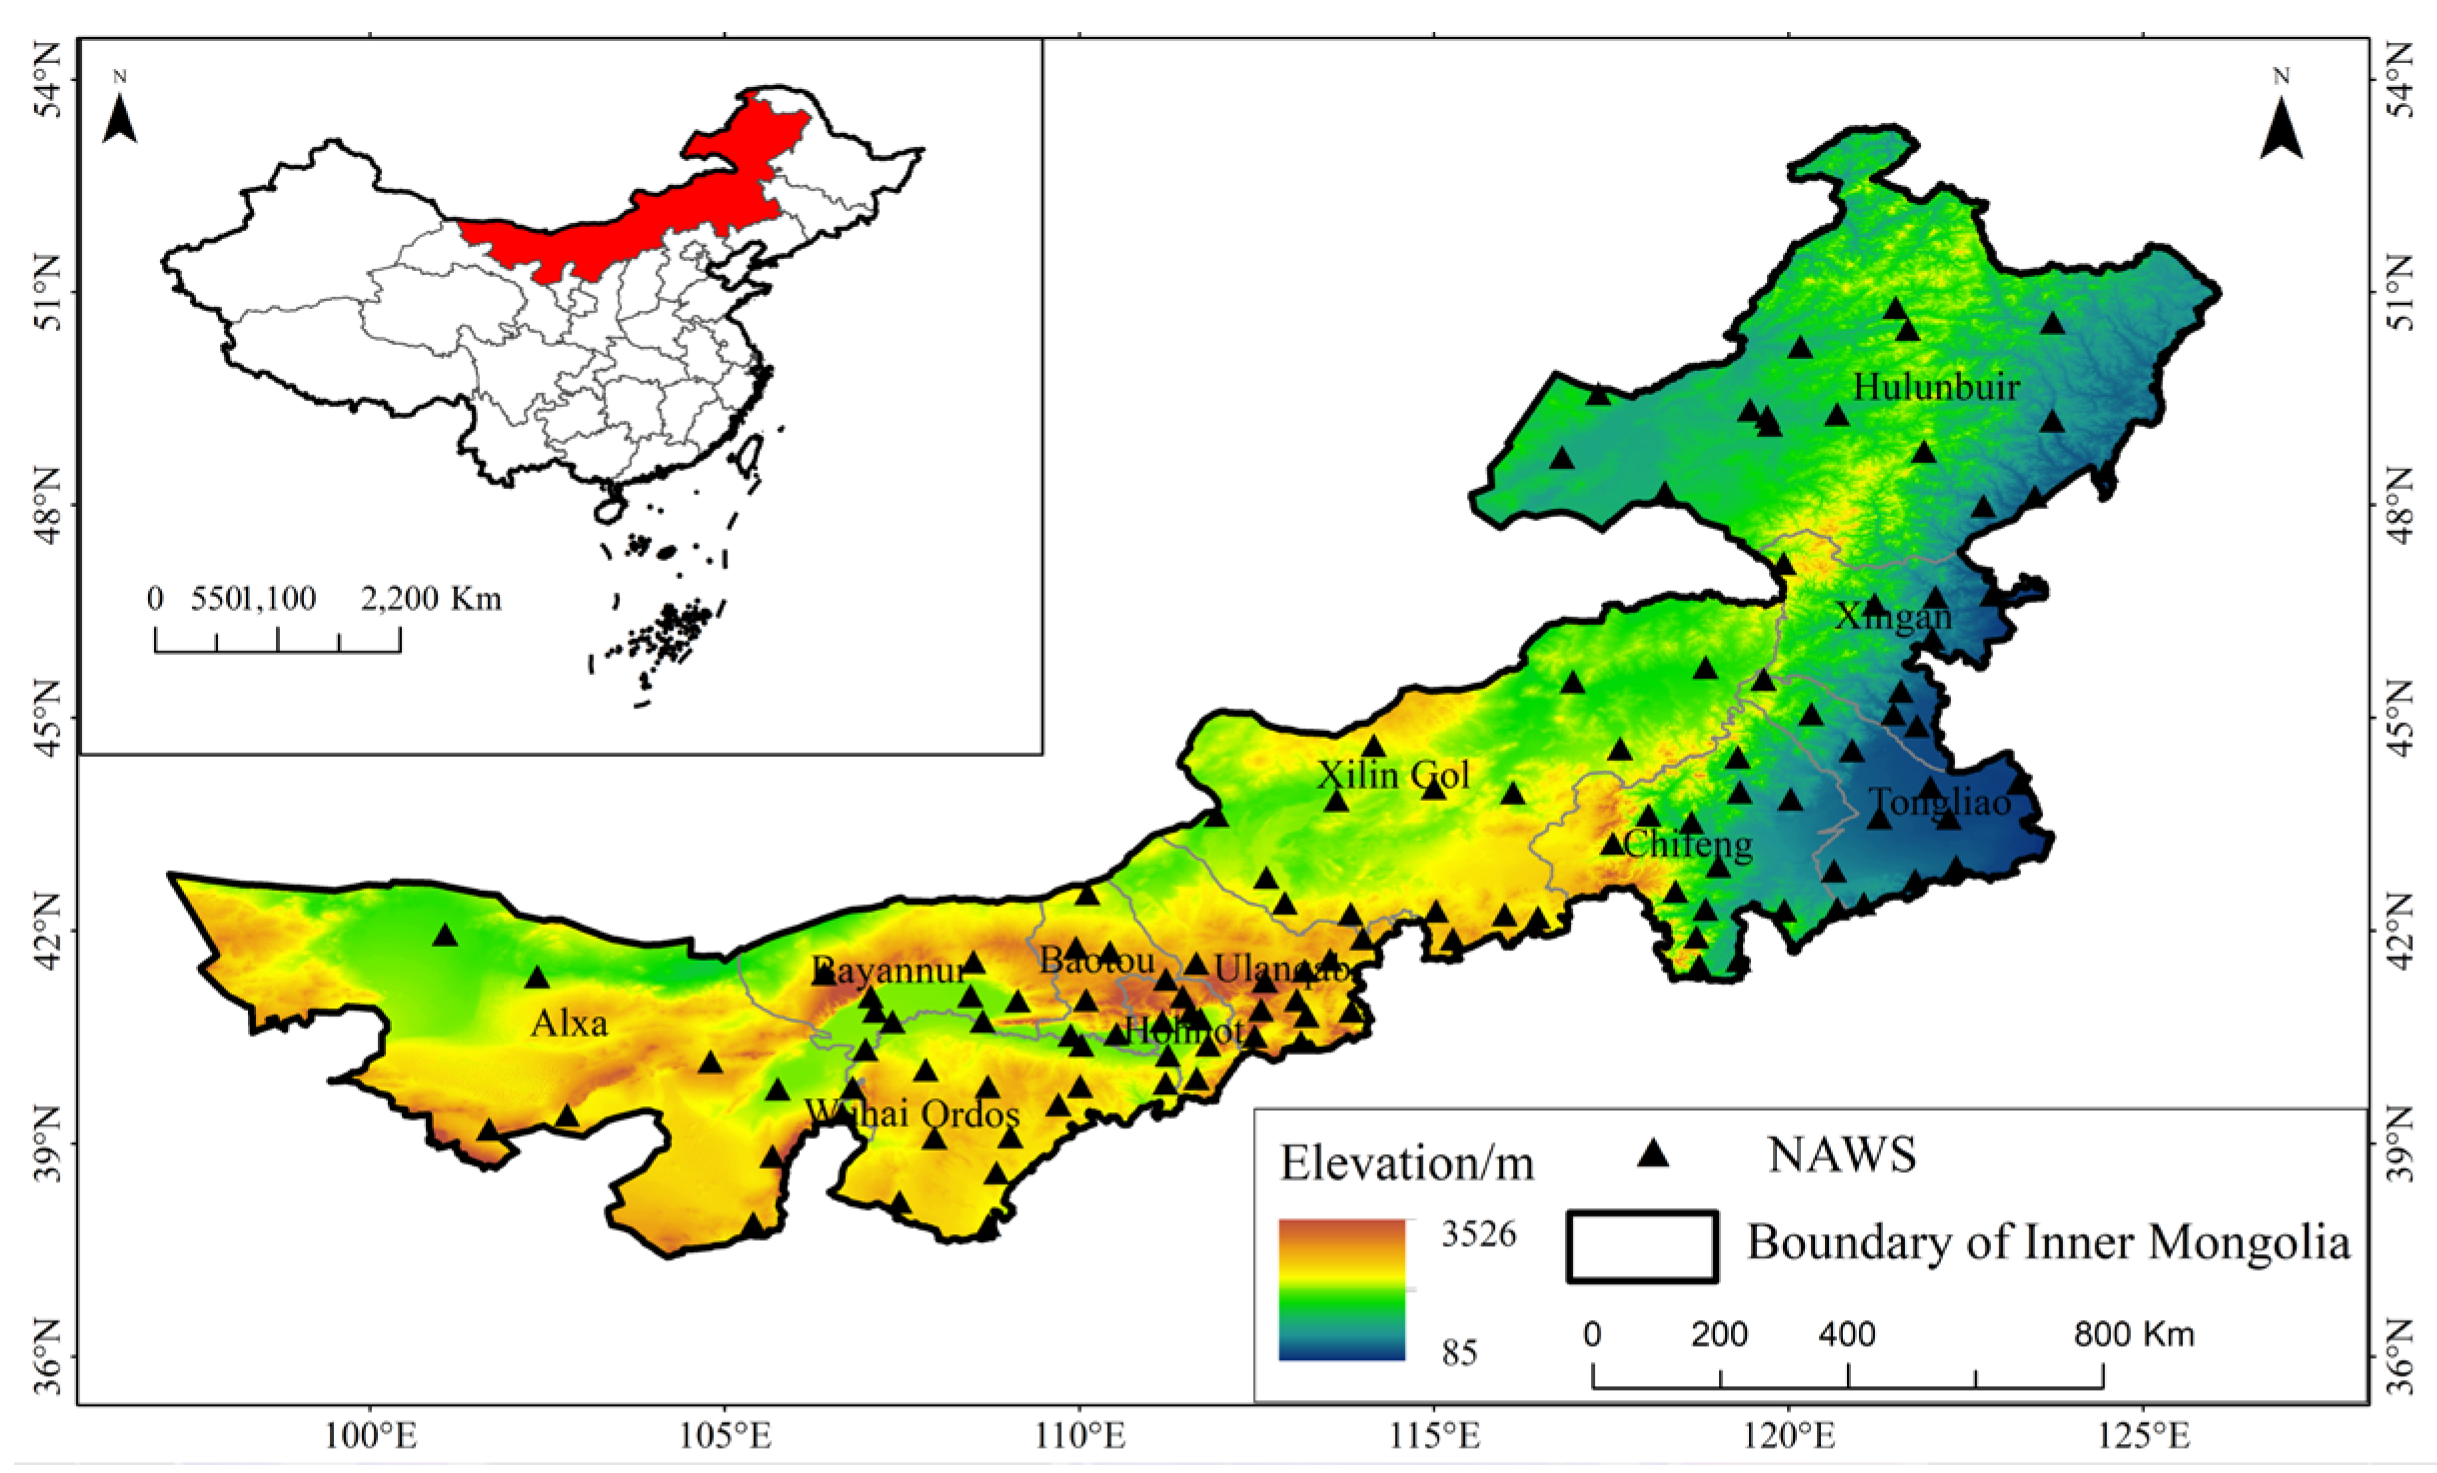
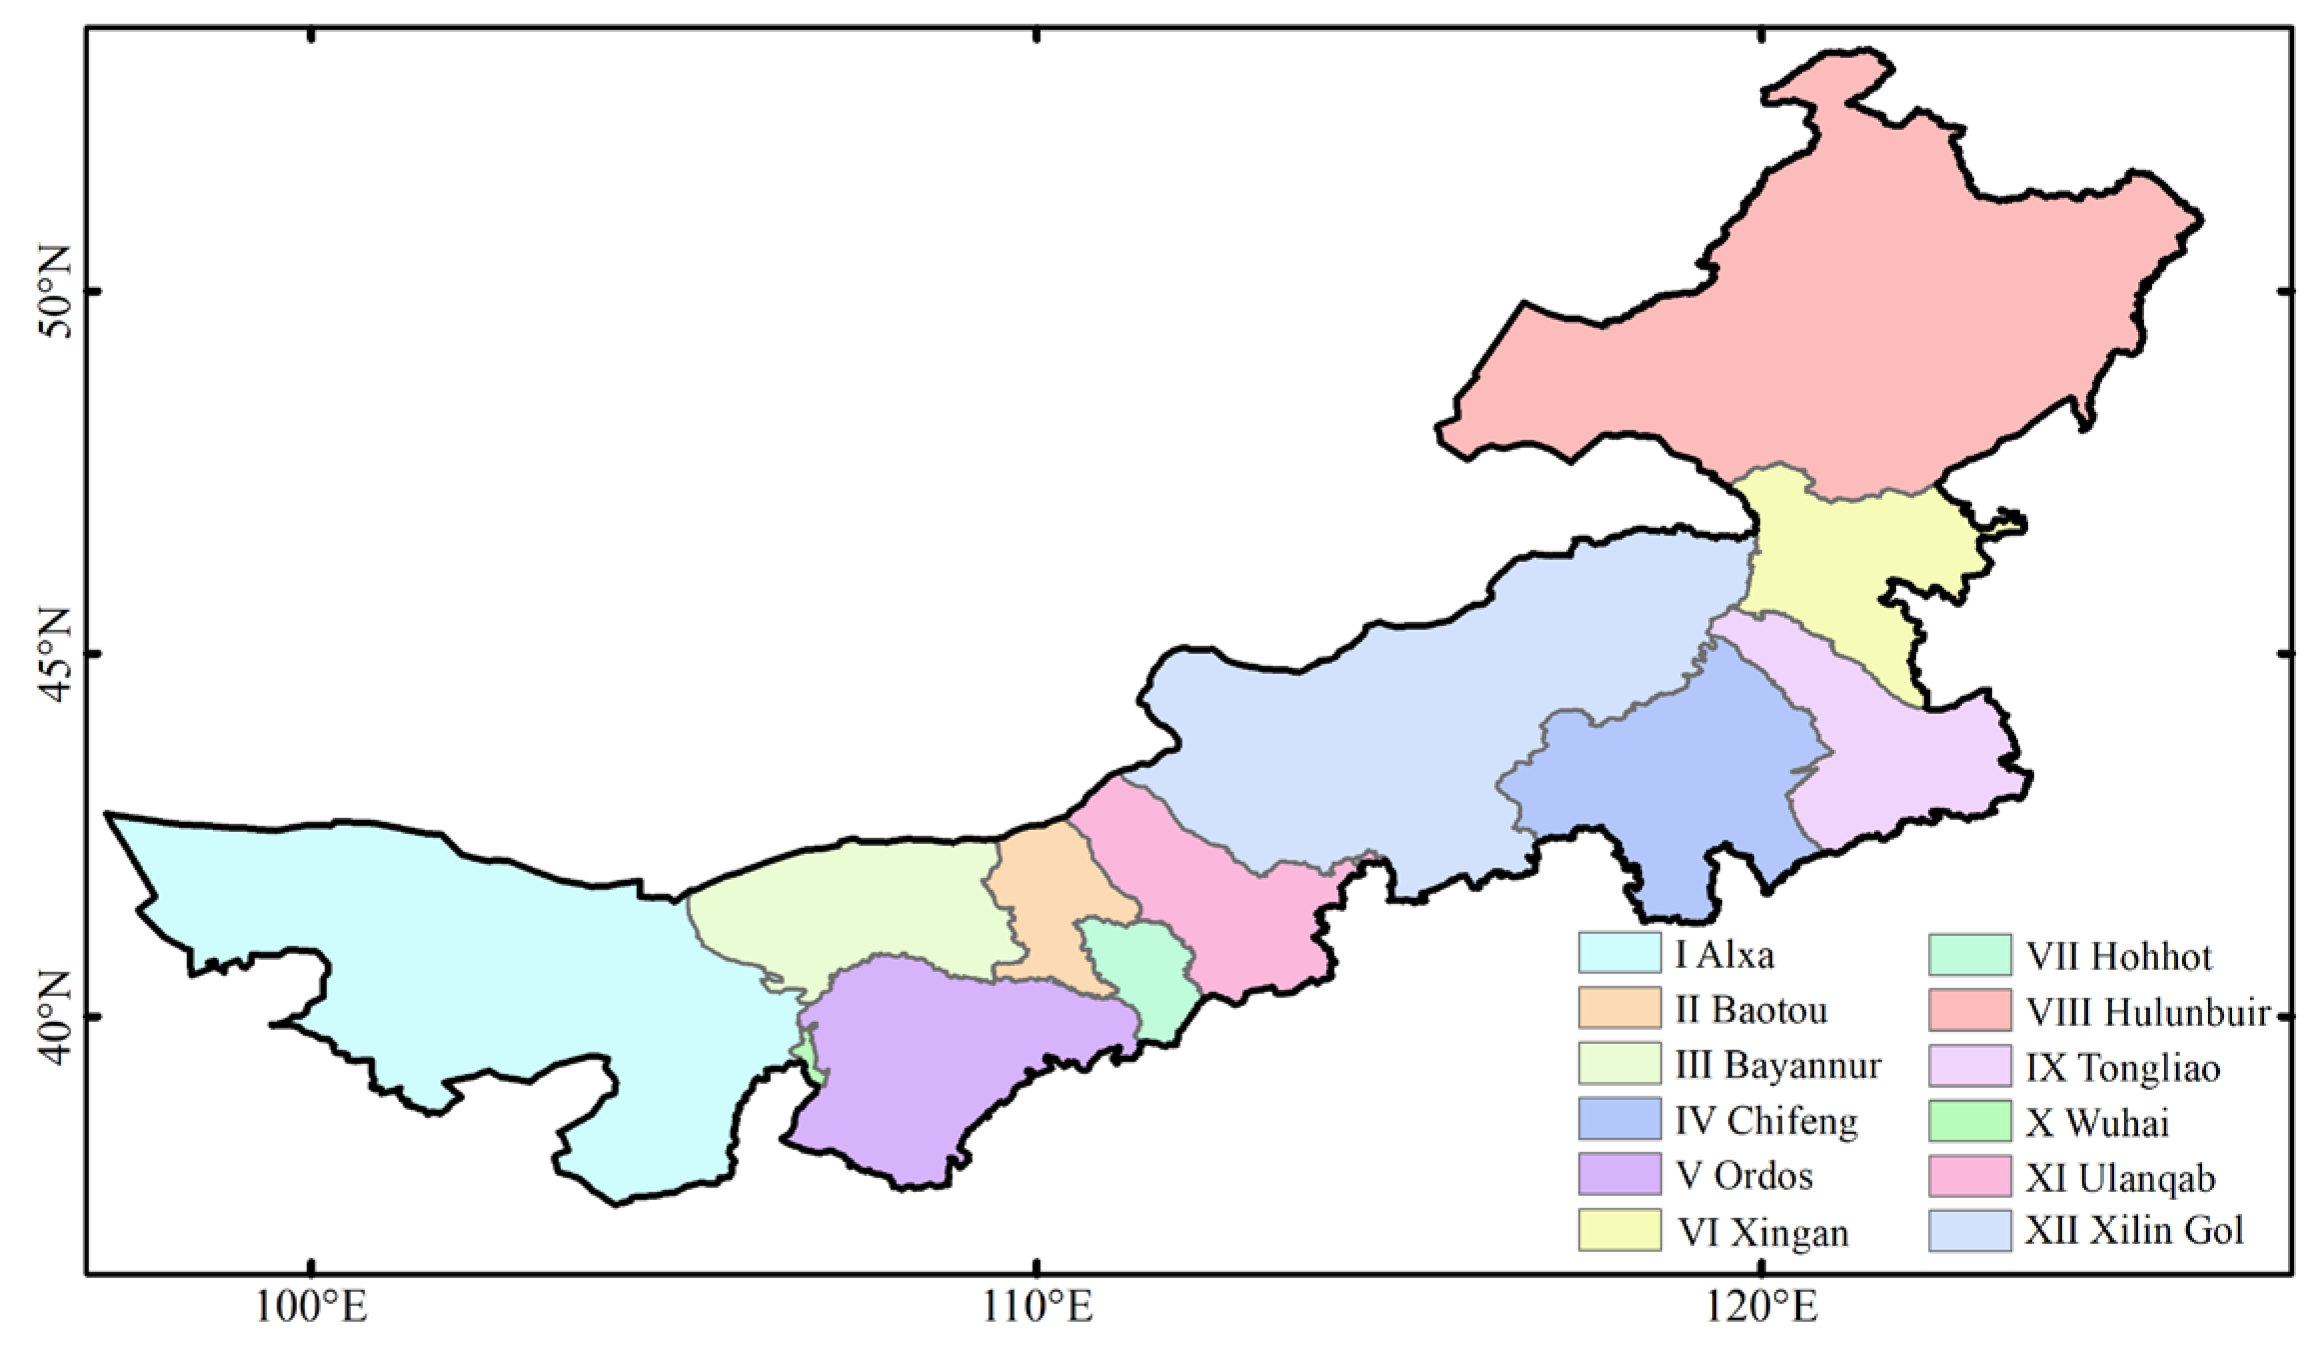
2.1. Study Regions
2.2. Data
2.2.1. HRCLDAS Data
2.2.2. ERA5-Land Data
2.2.3. GLDAS Data
2.2.4. Surface Meteorological Observation Data
2.3. Data Processing
2.4. Evaluation Indexes
3. Analysis of the Results
3.1. Evaluation of the Overall Accuracy
3.2. Temporal Test
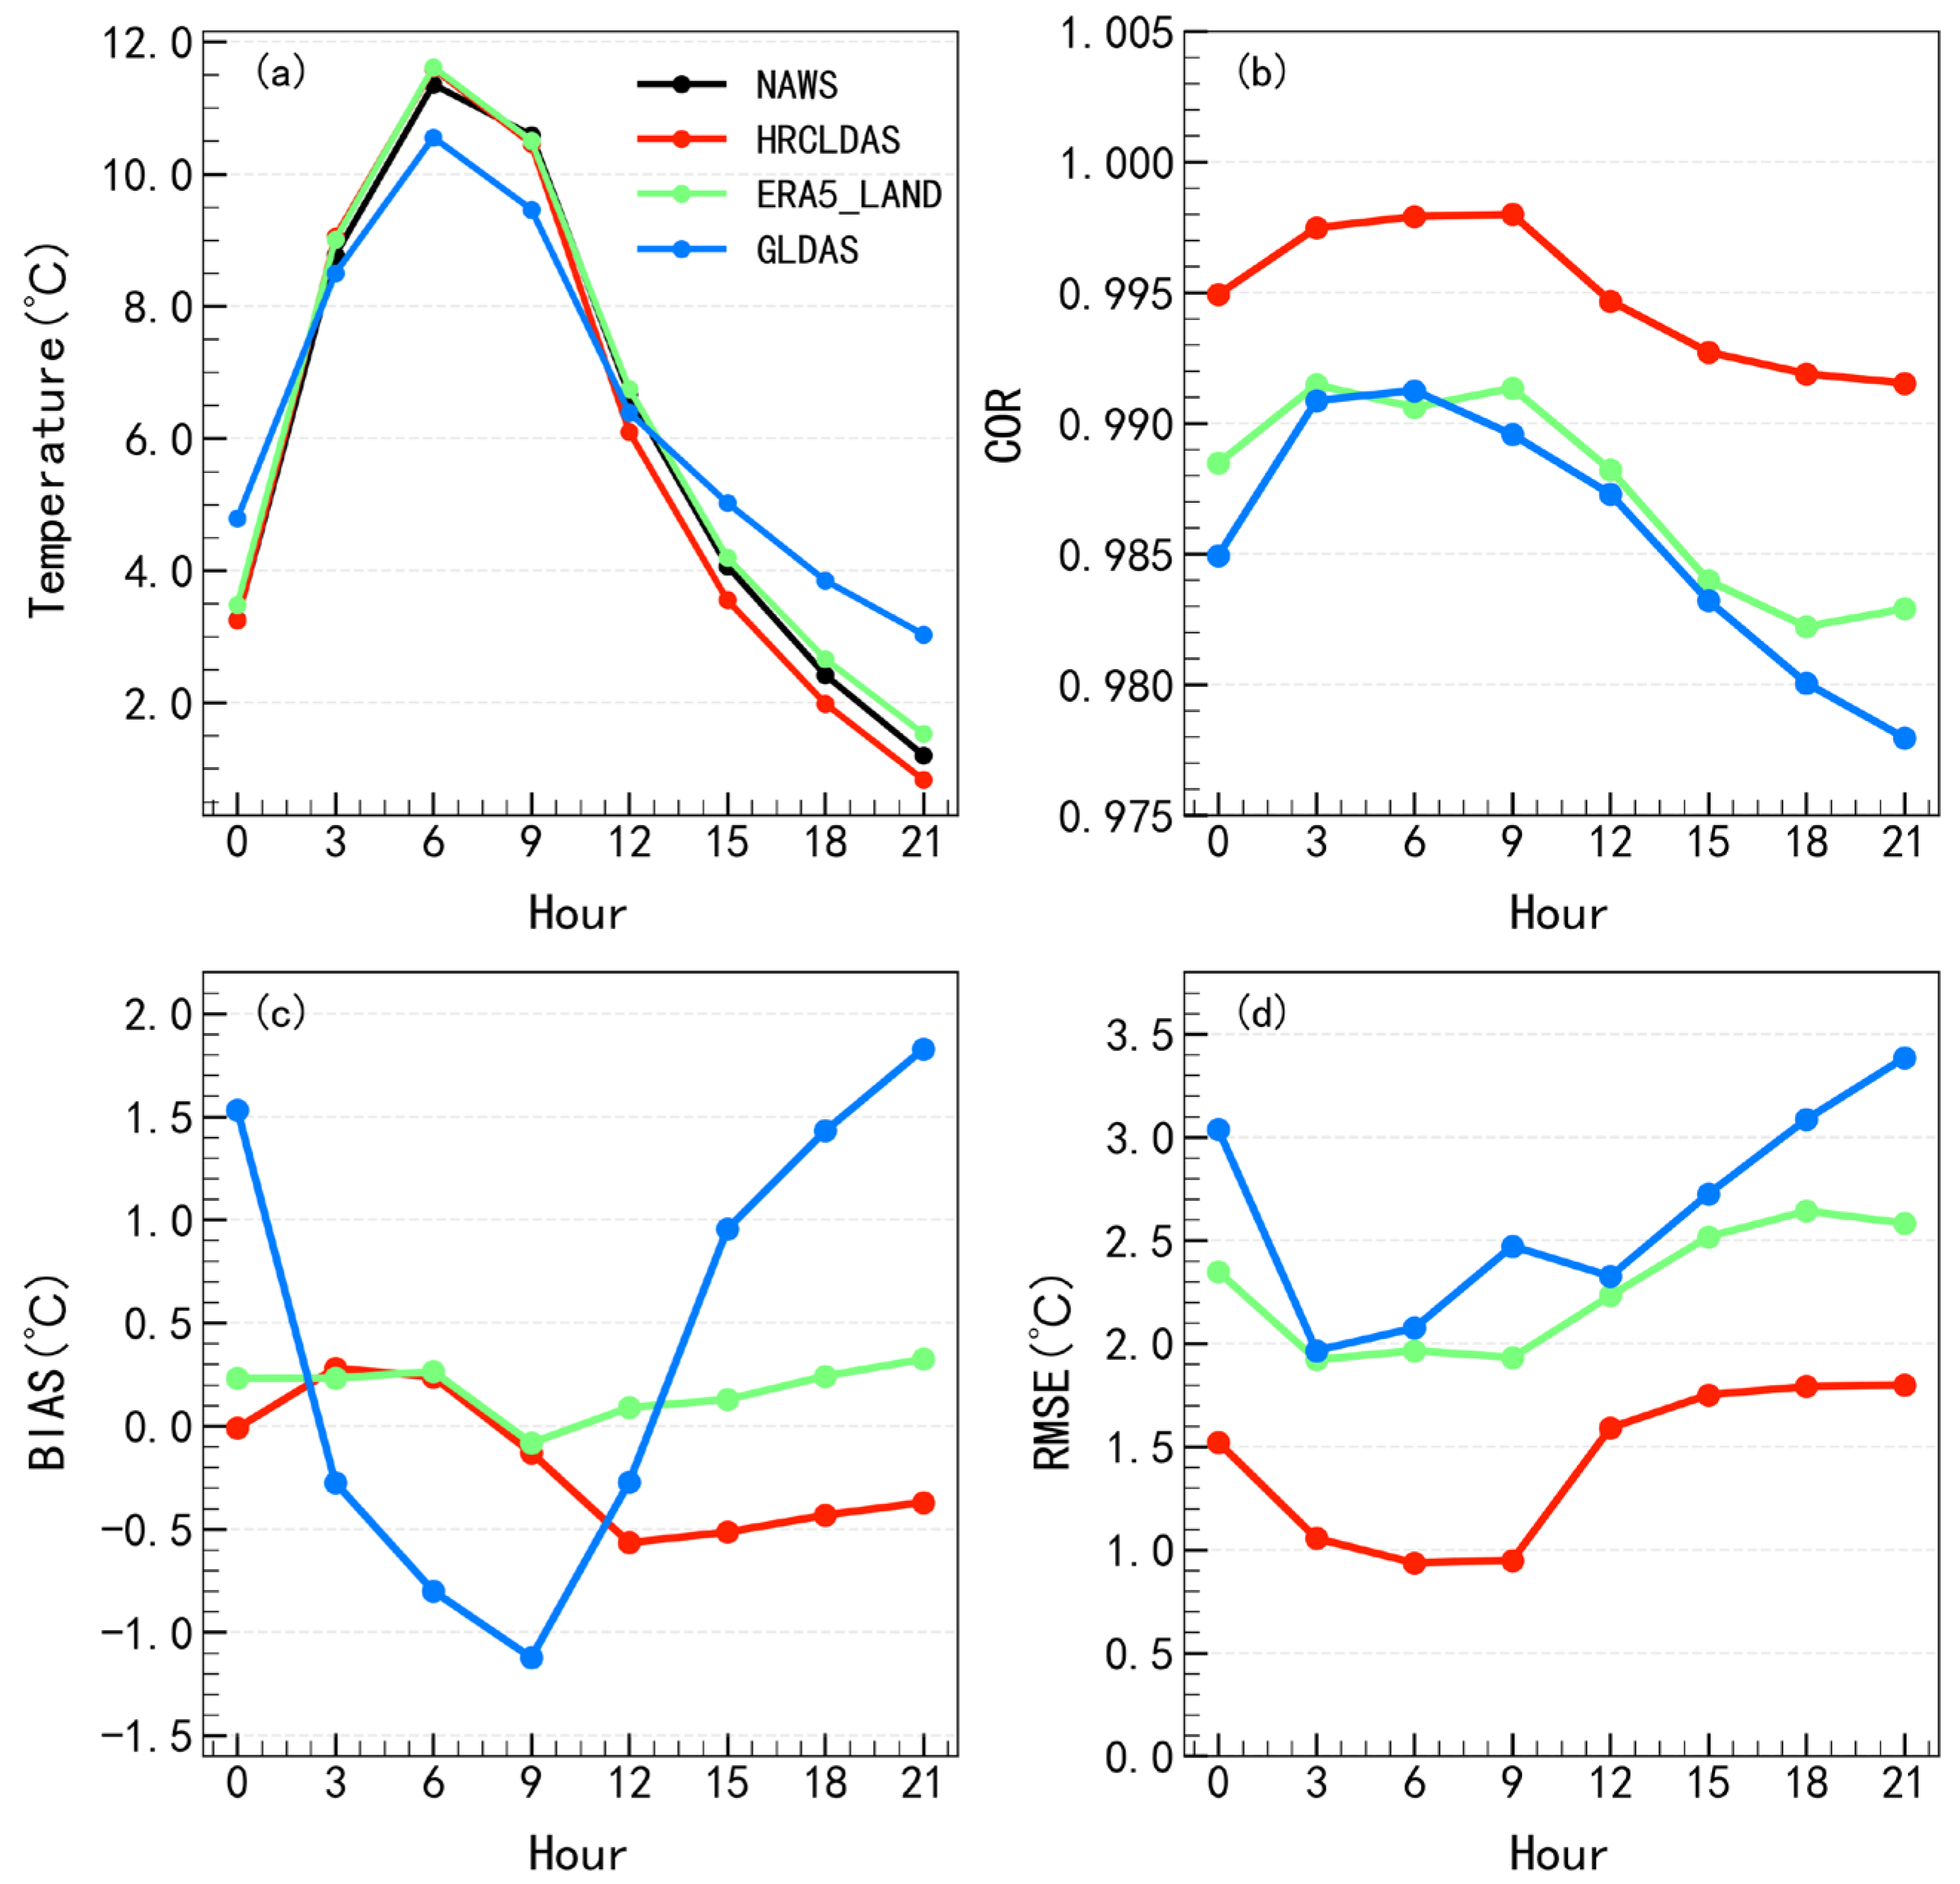
3.2.1. Diurnal Changes
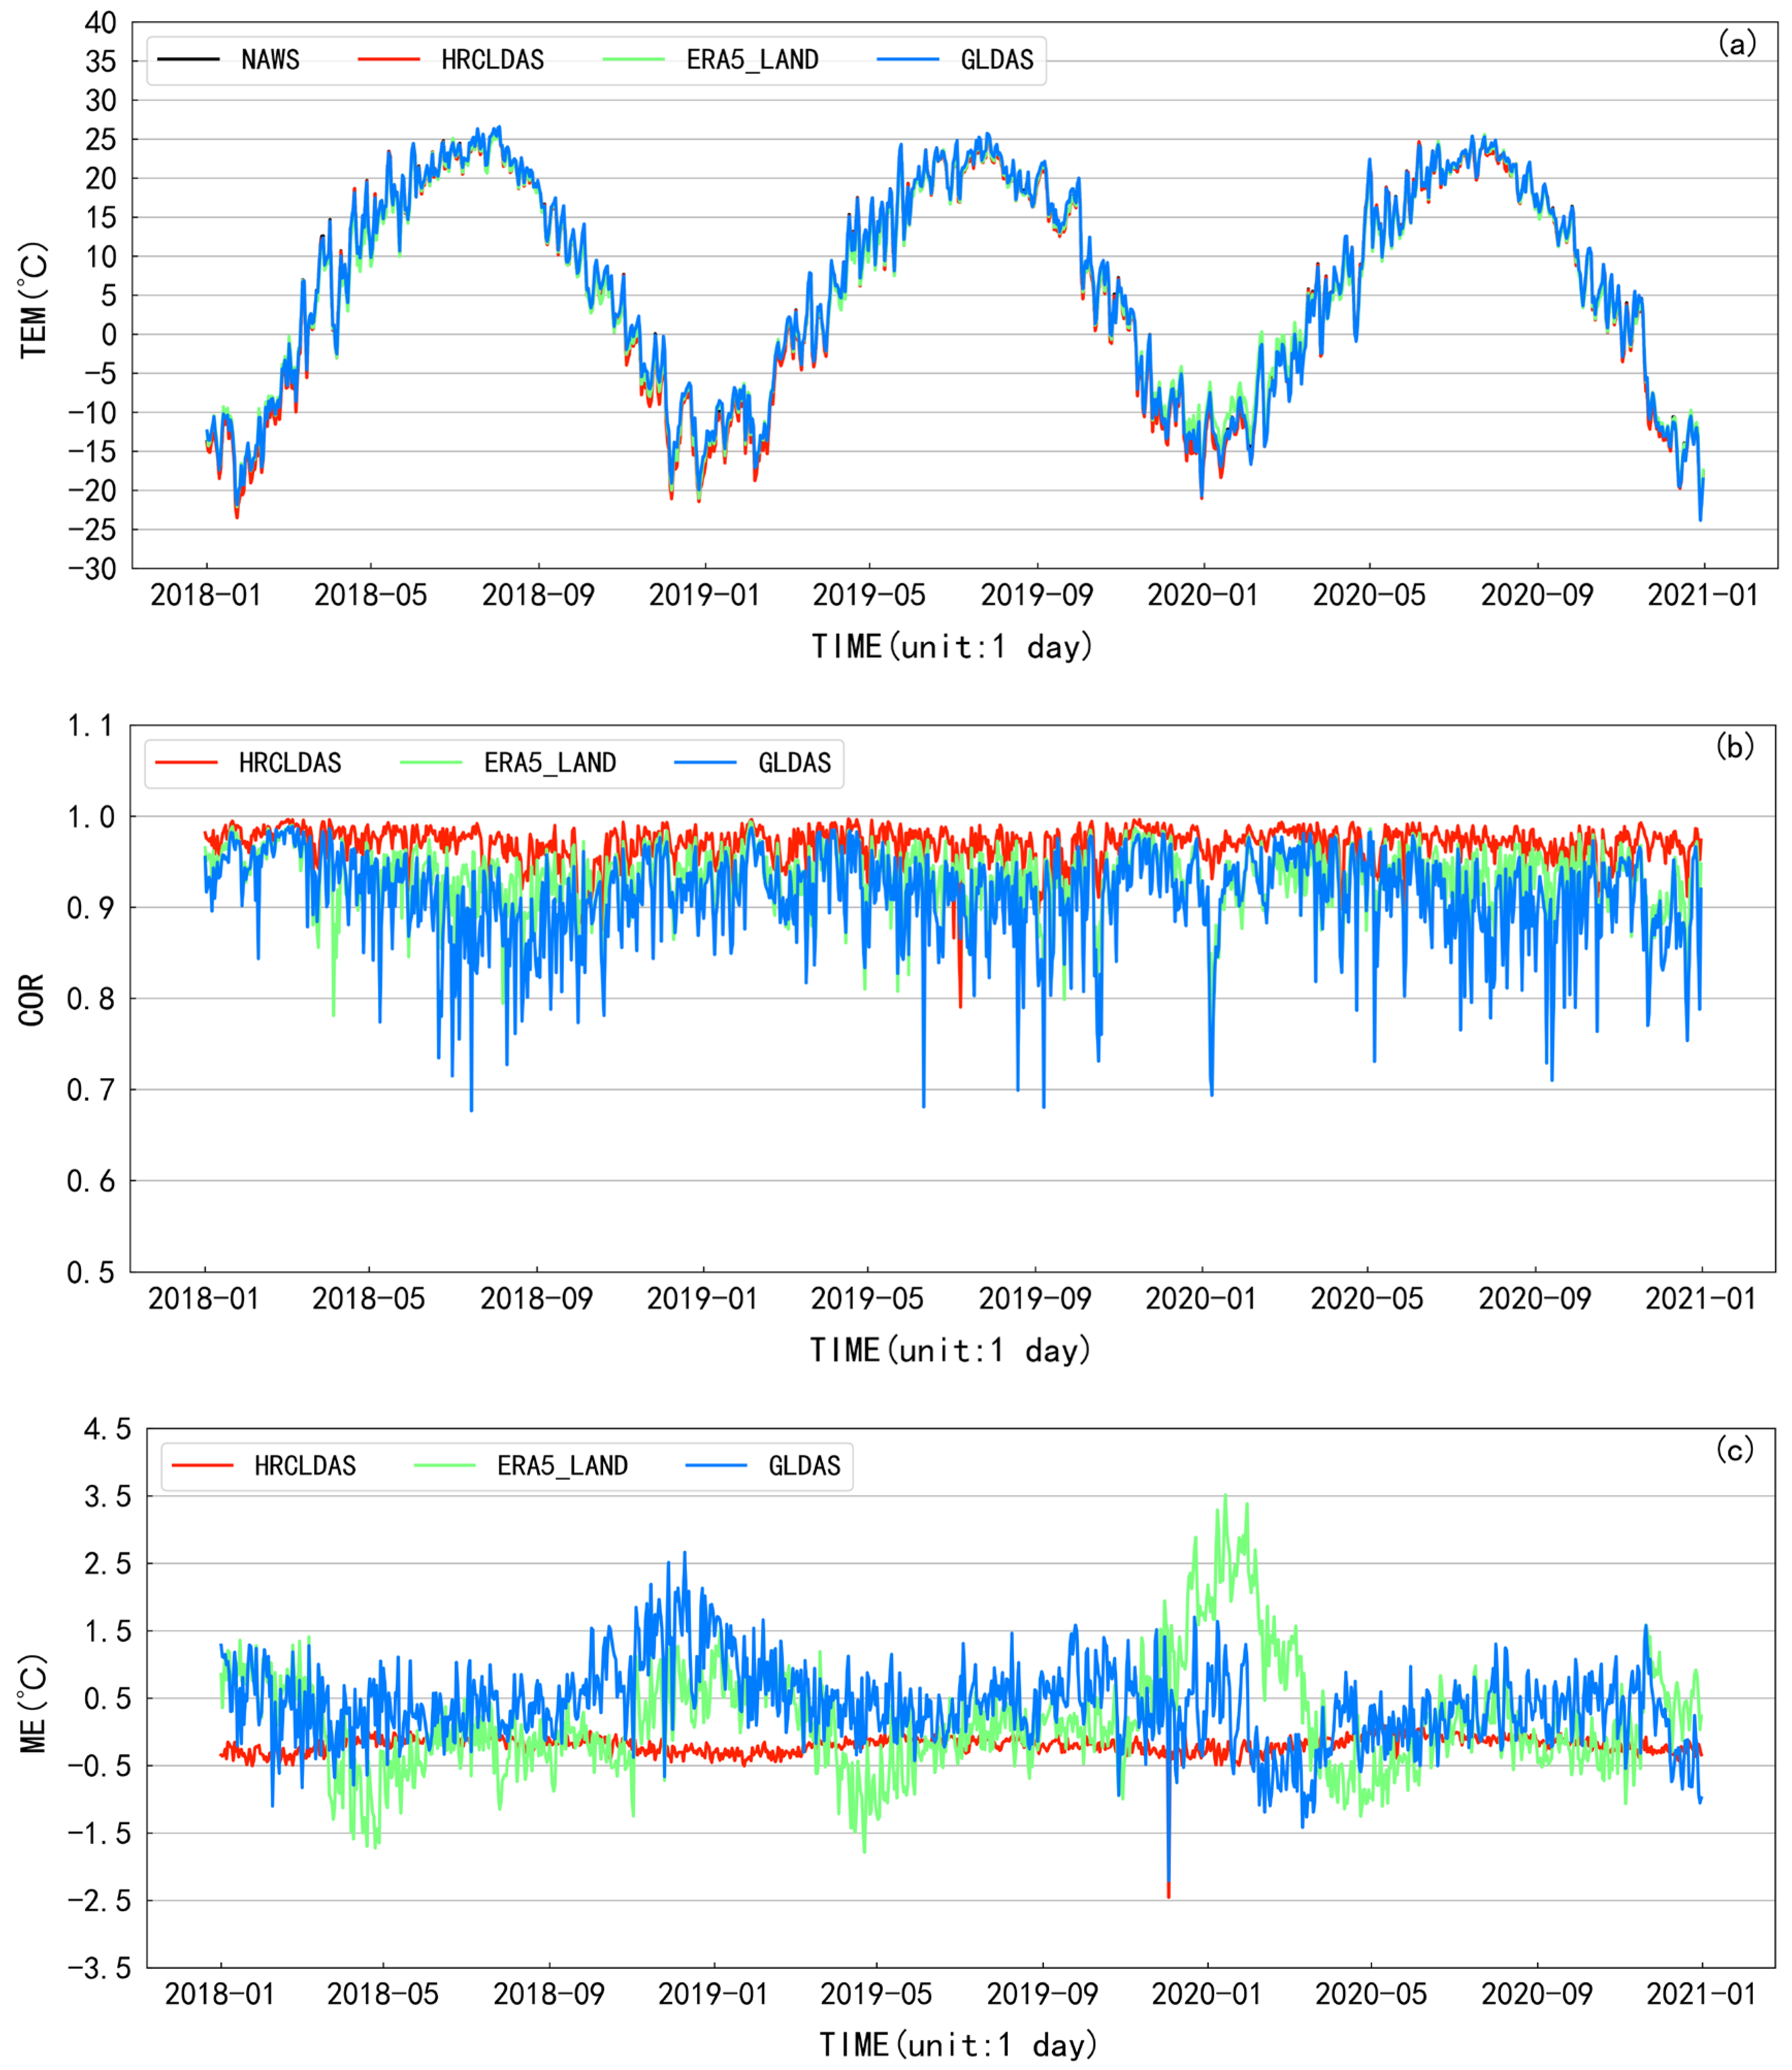
3.2.2. Daily Changes
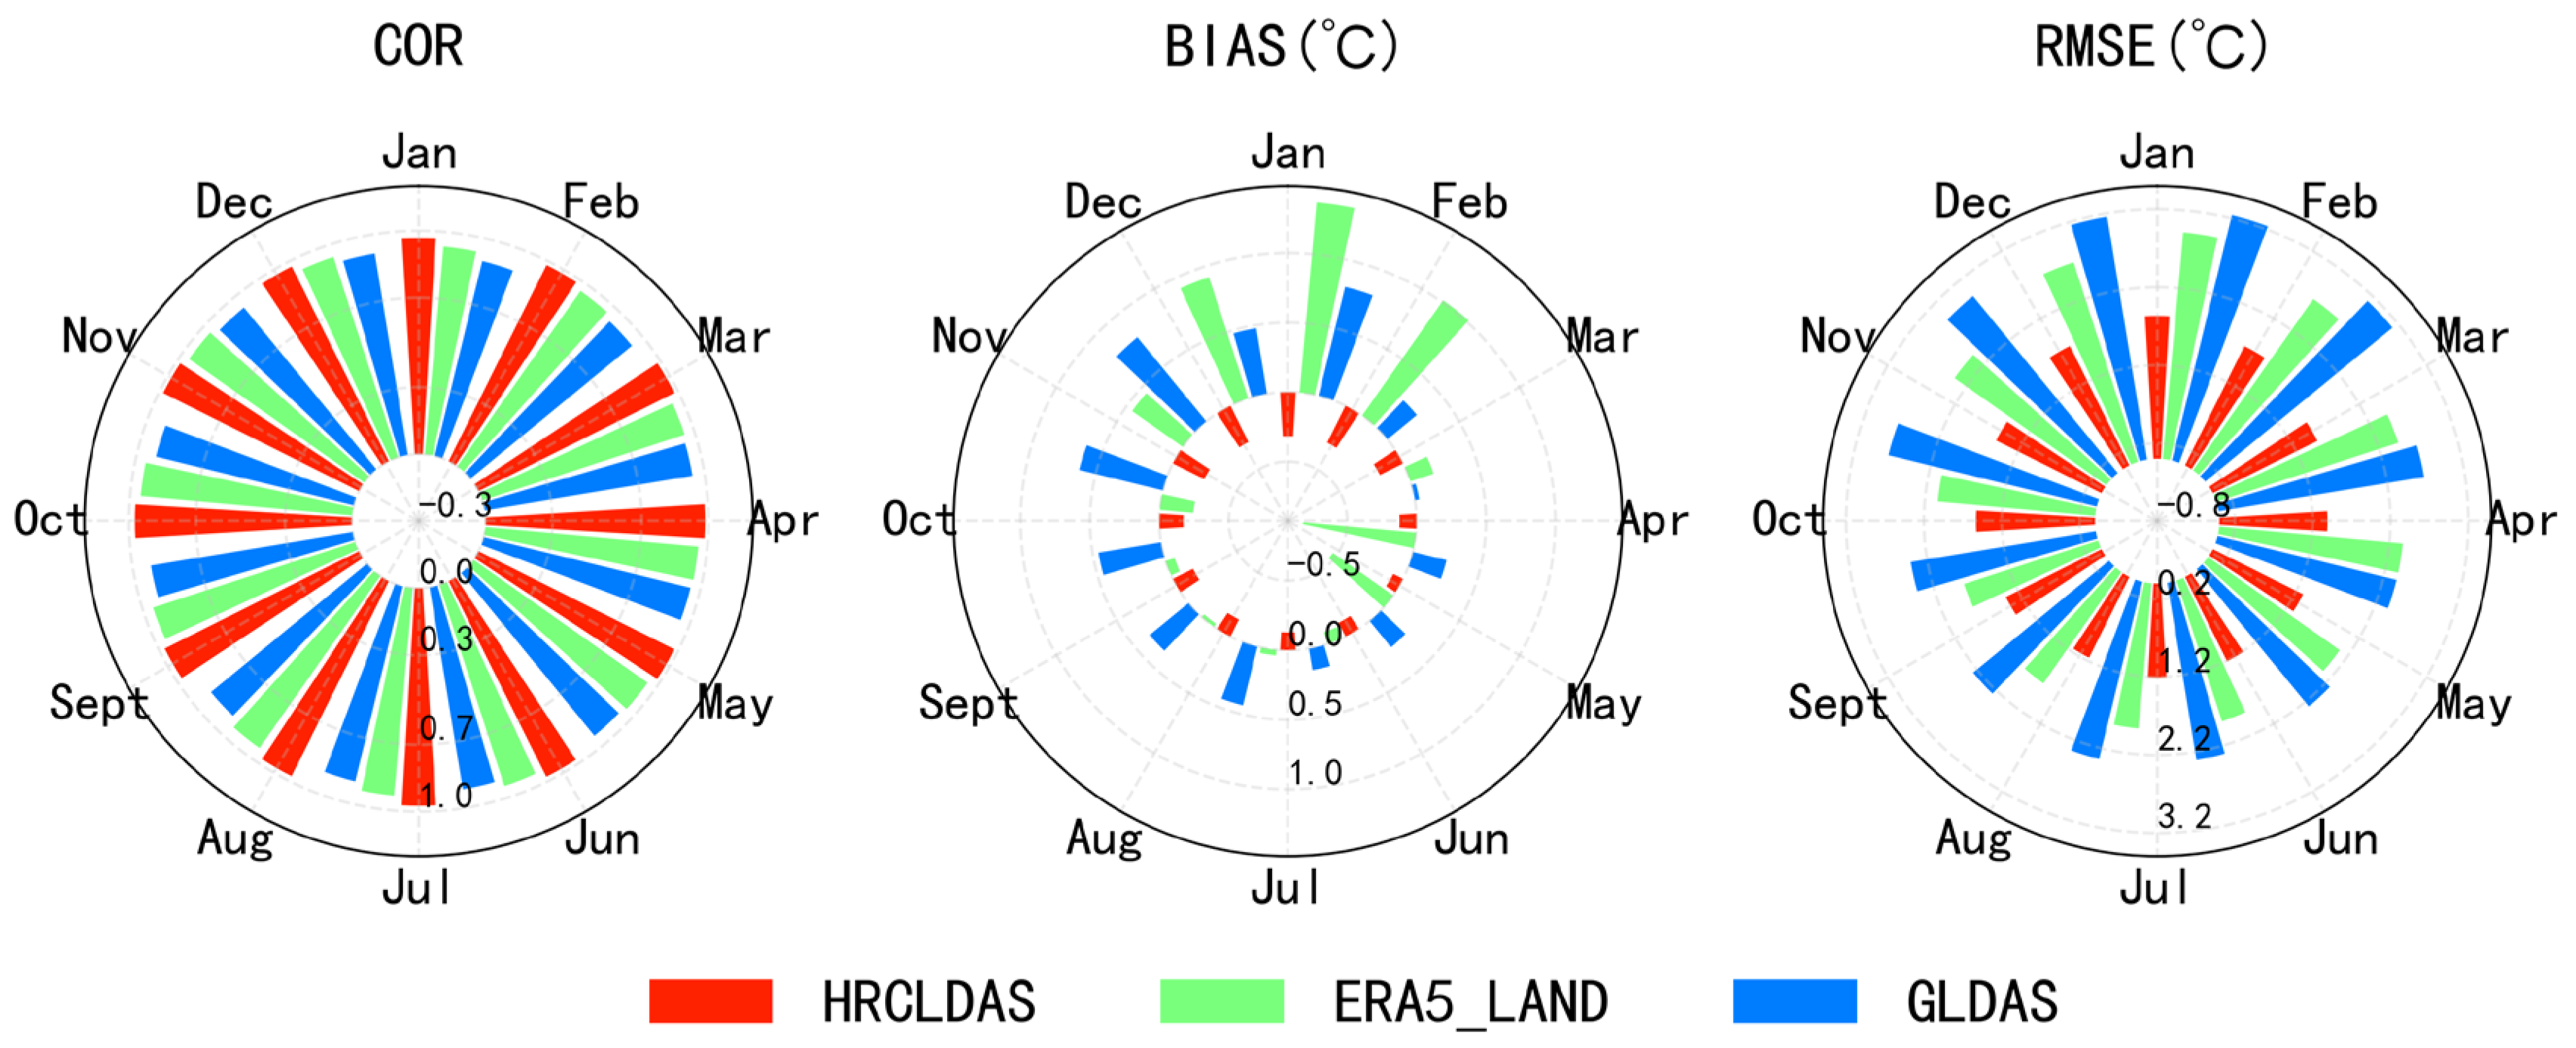
3.2.3. Monthly Changes
3.2.4. Seasonal Changes
3.3. Spatial Test
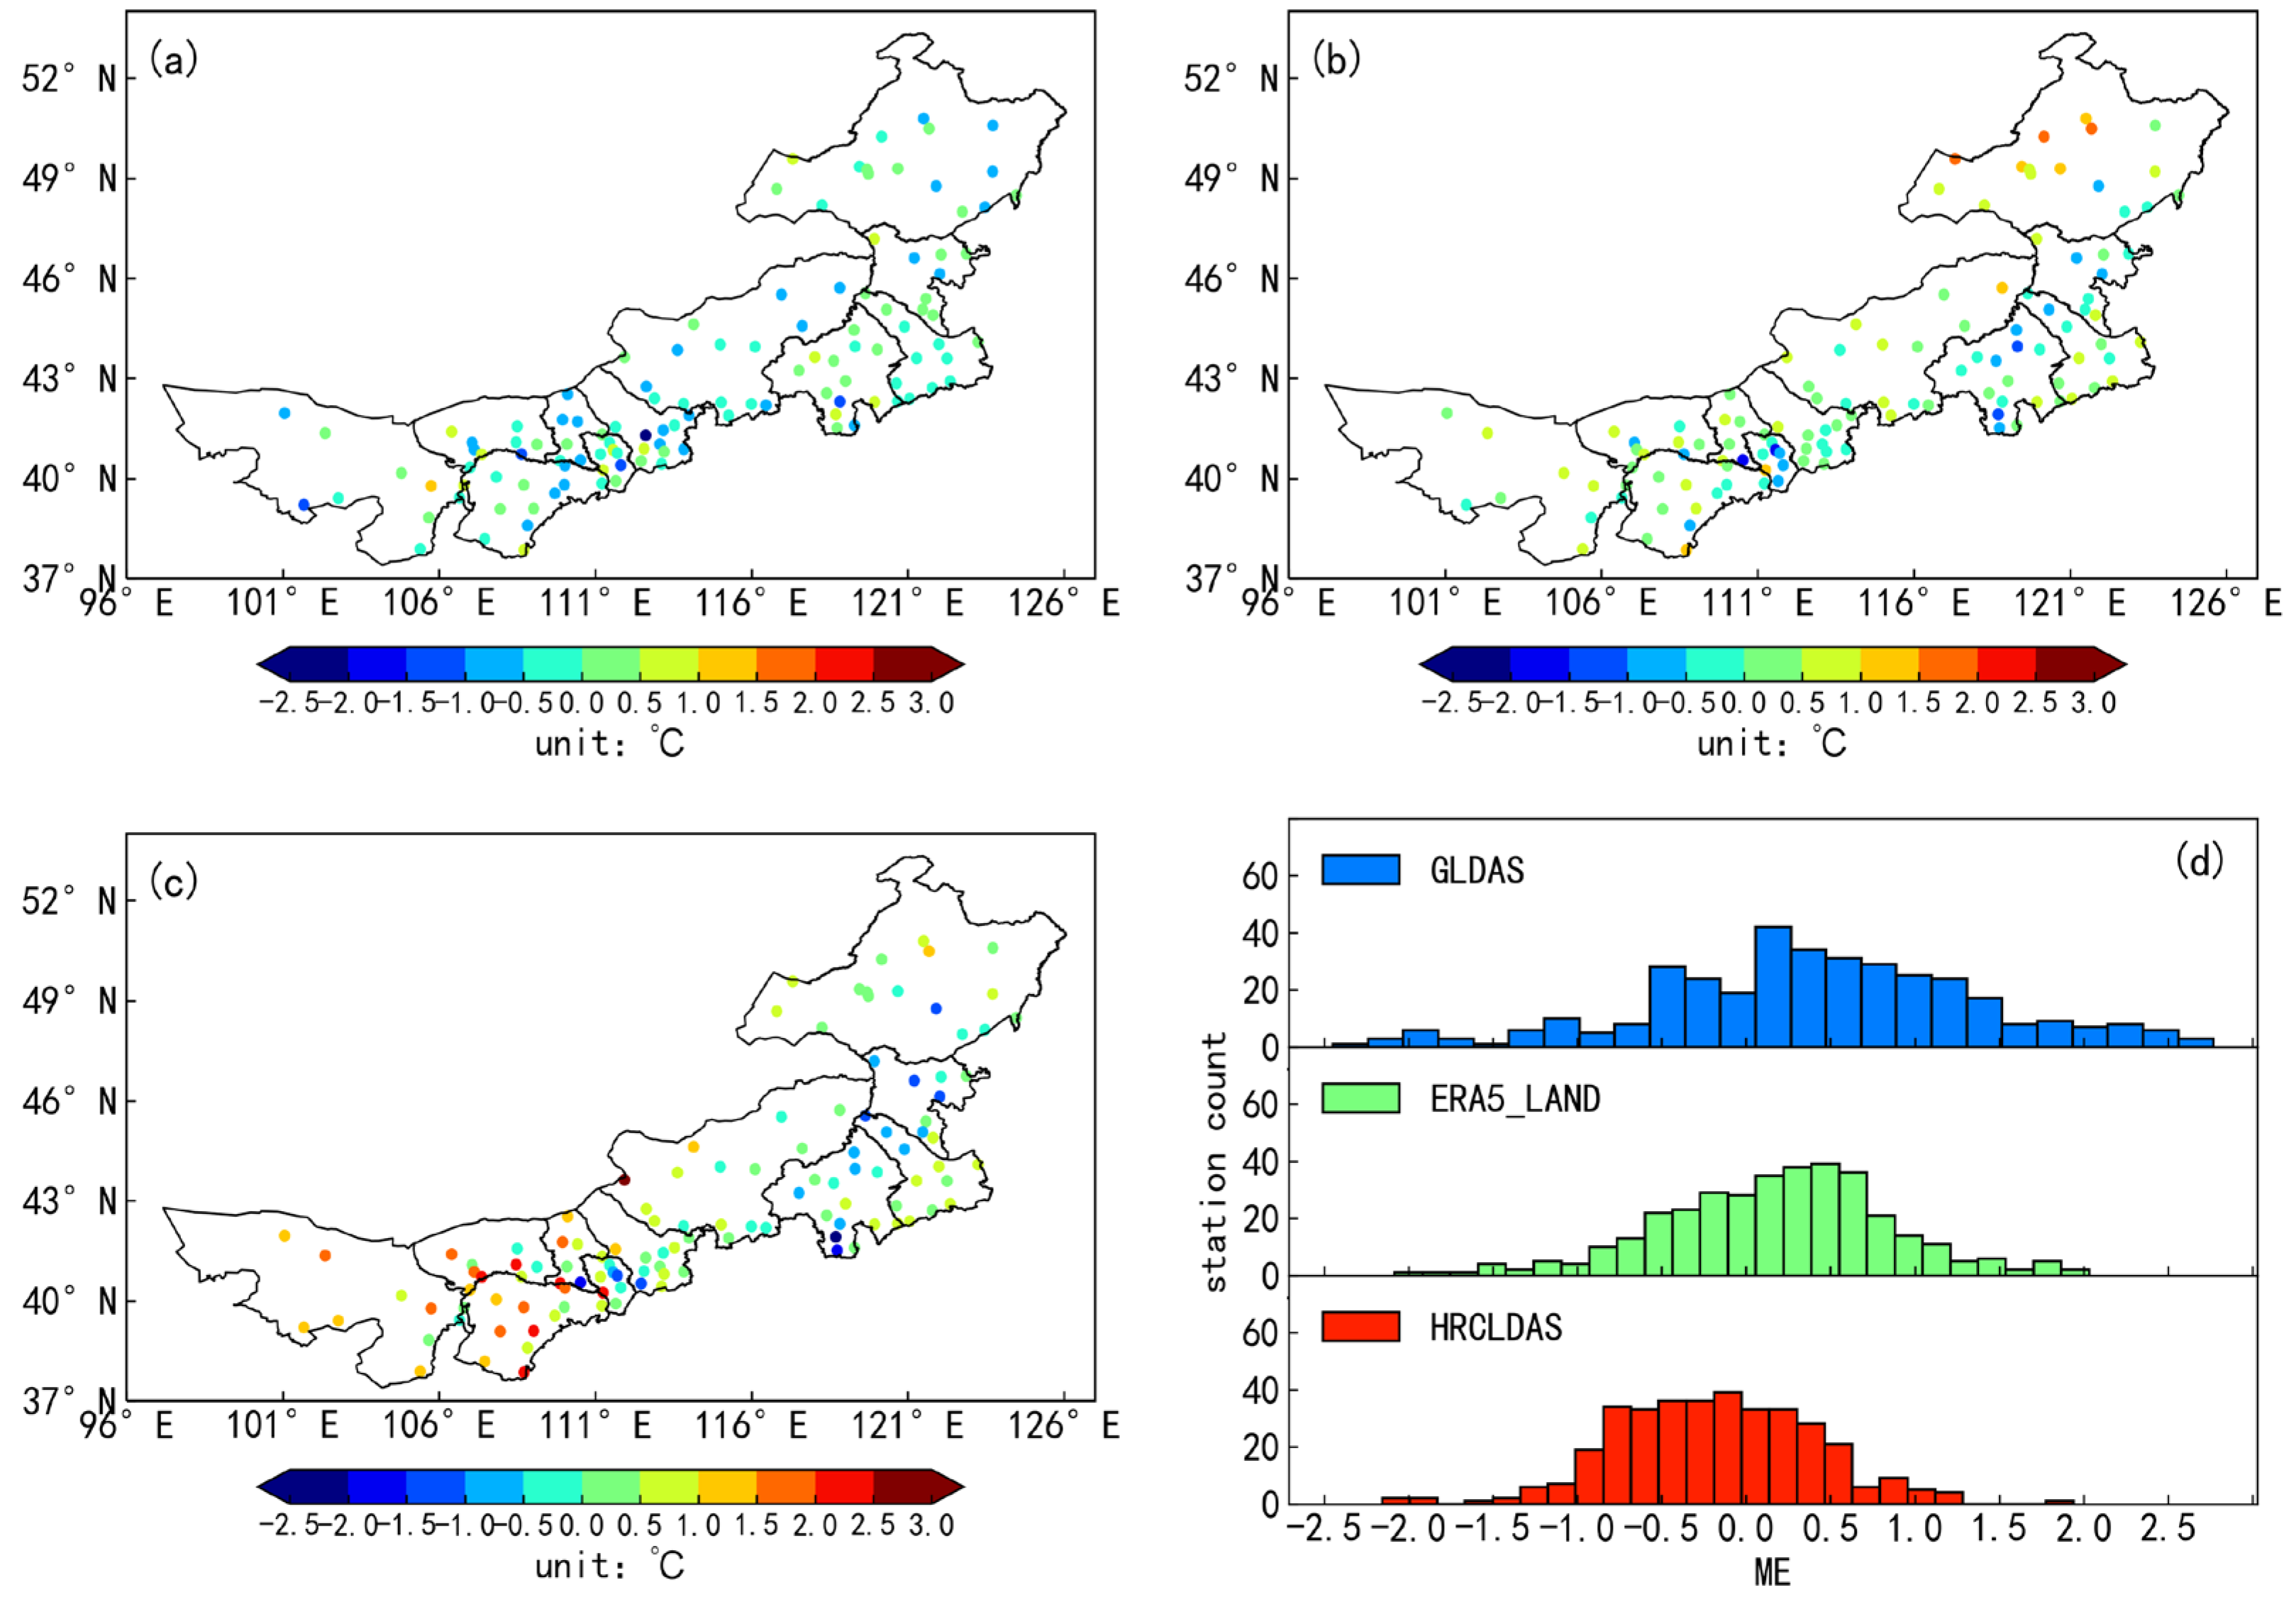
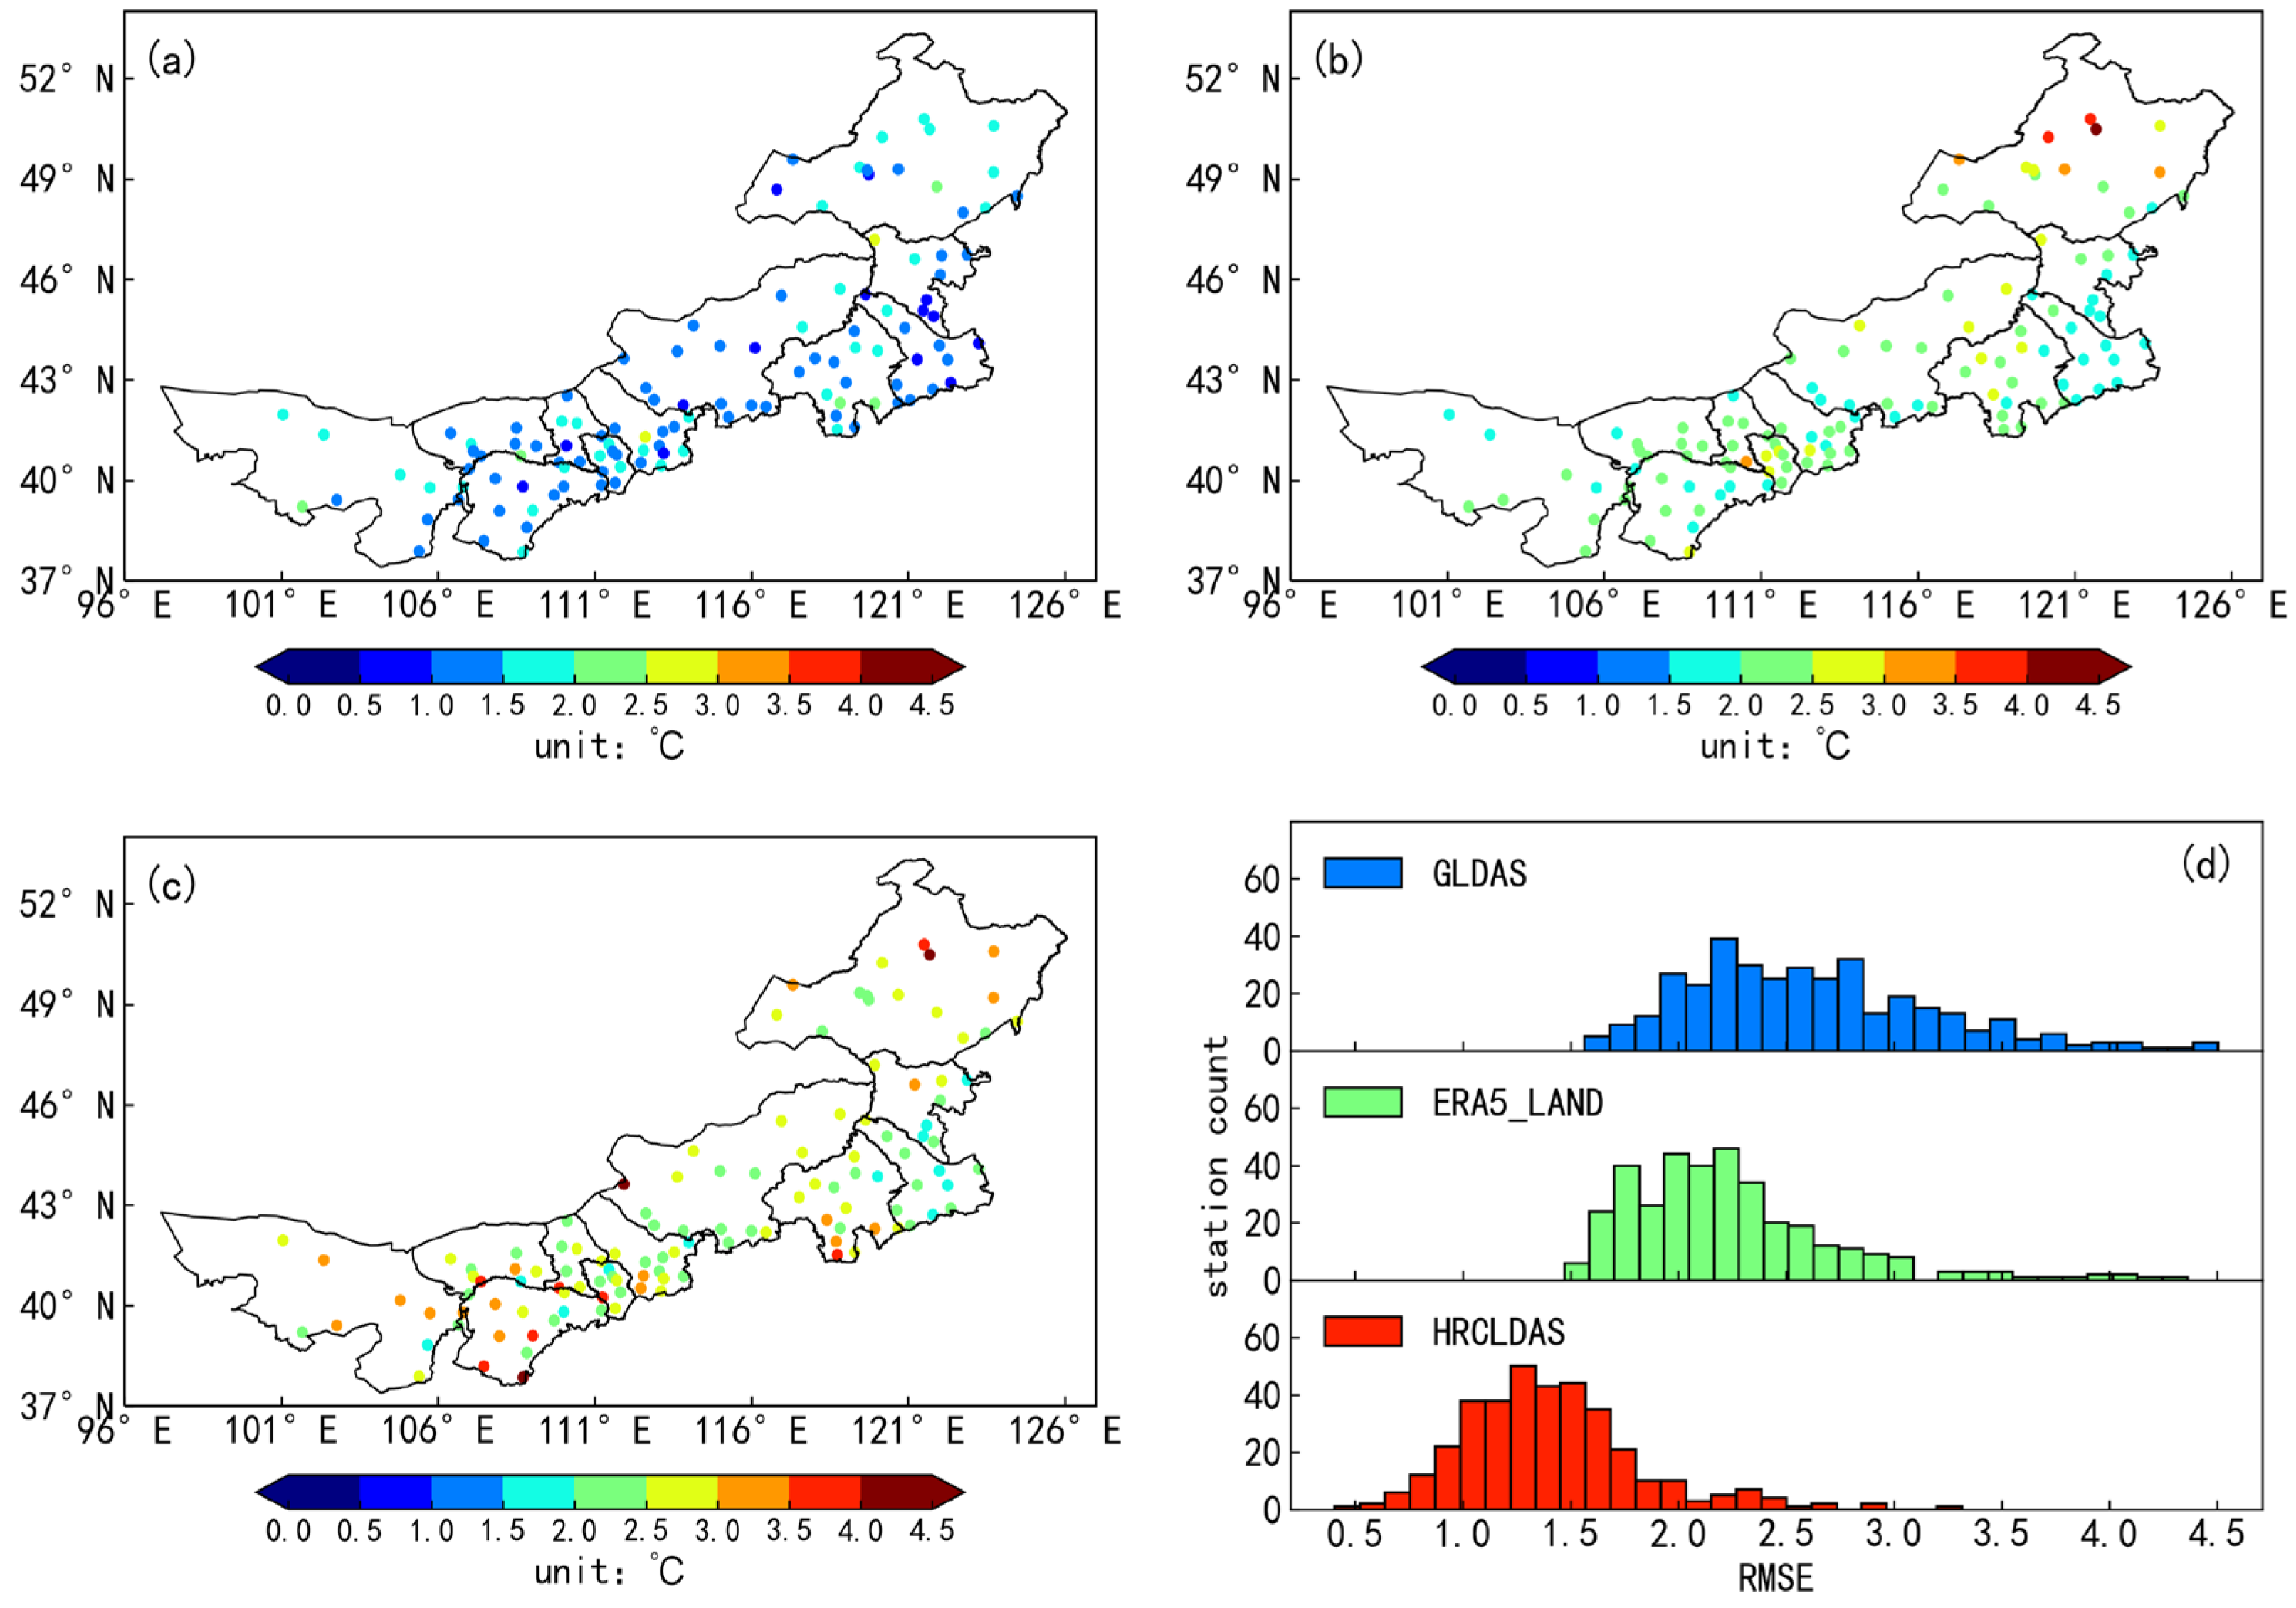
3.3.1. Station Test
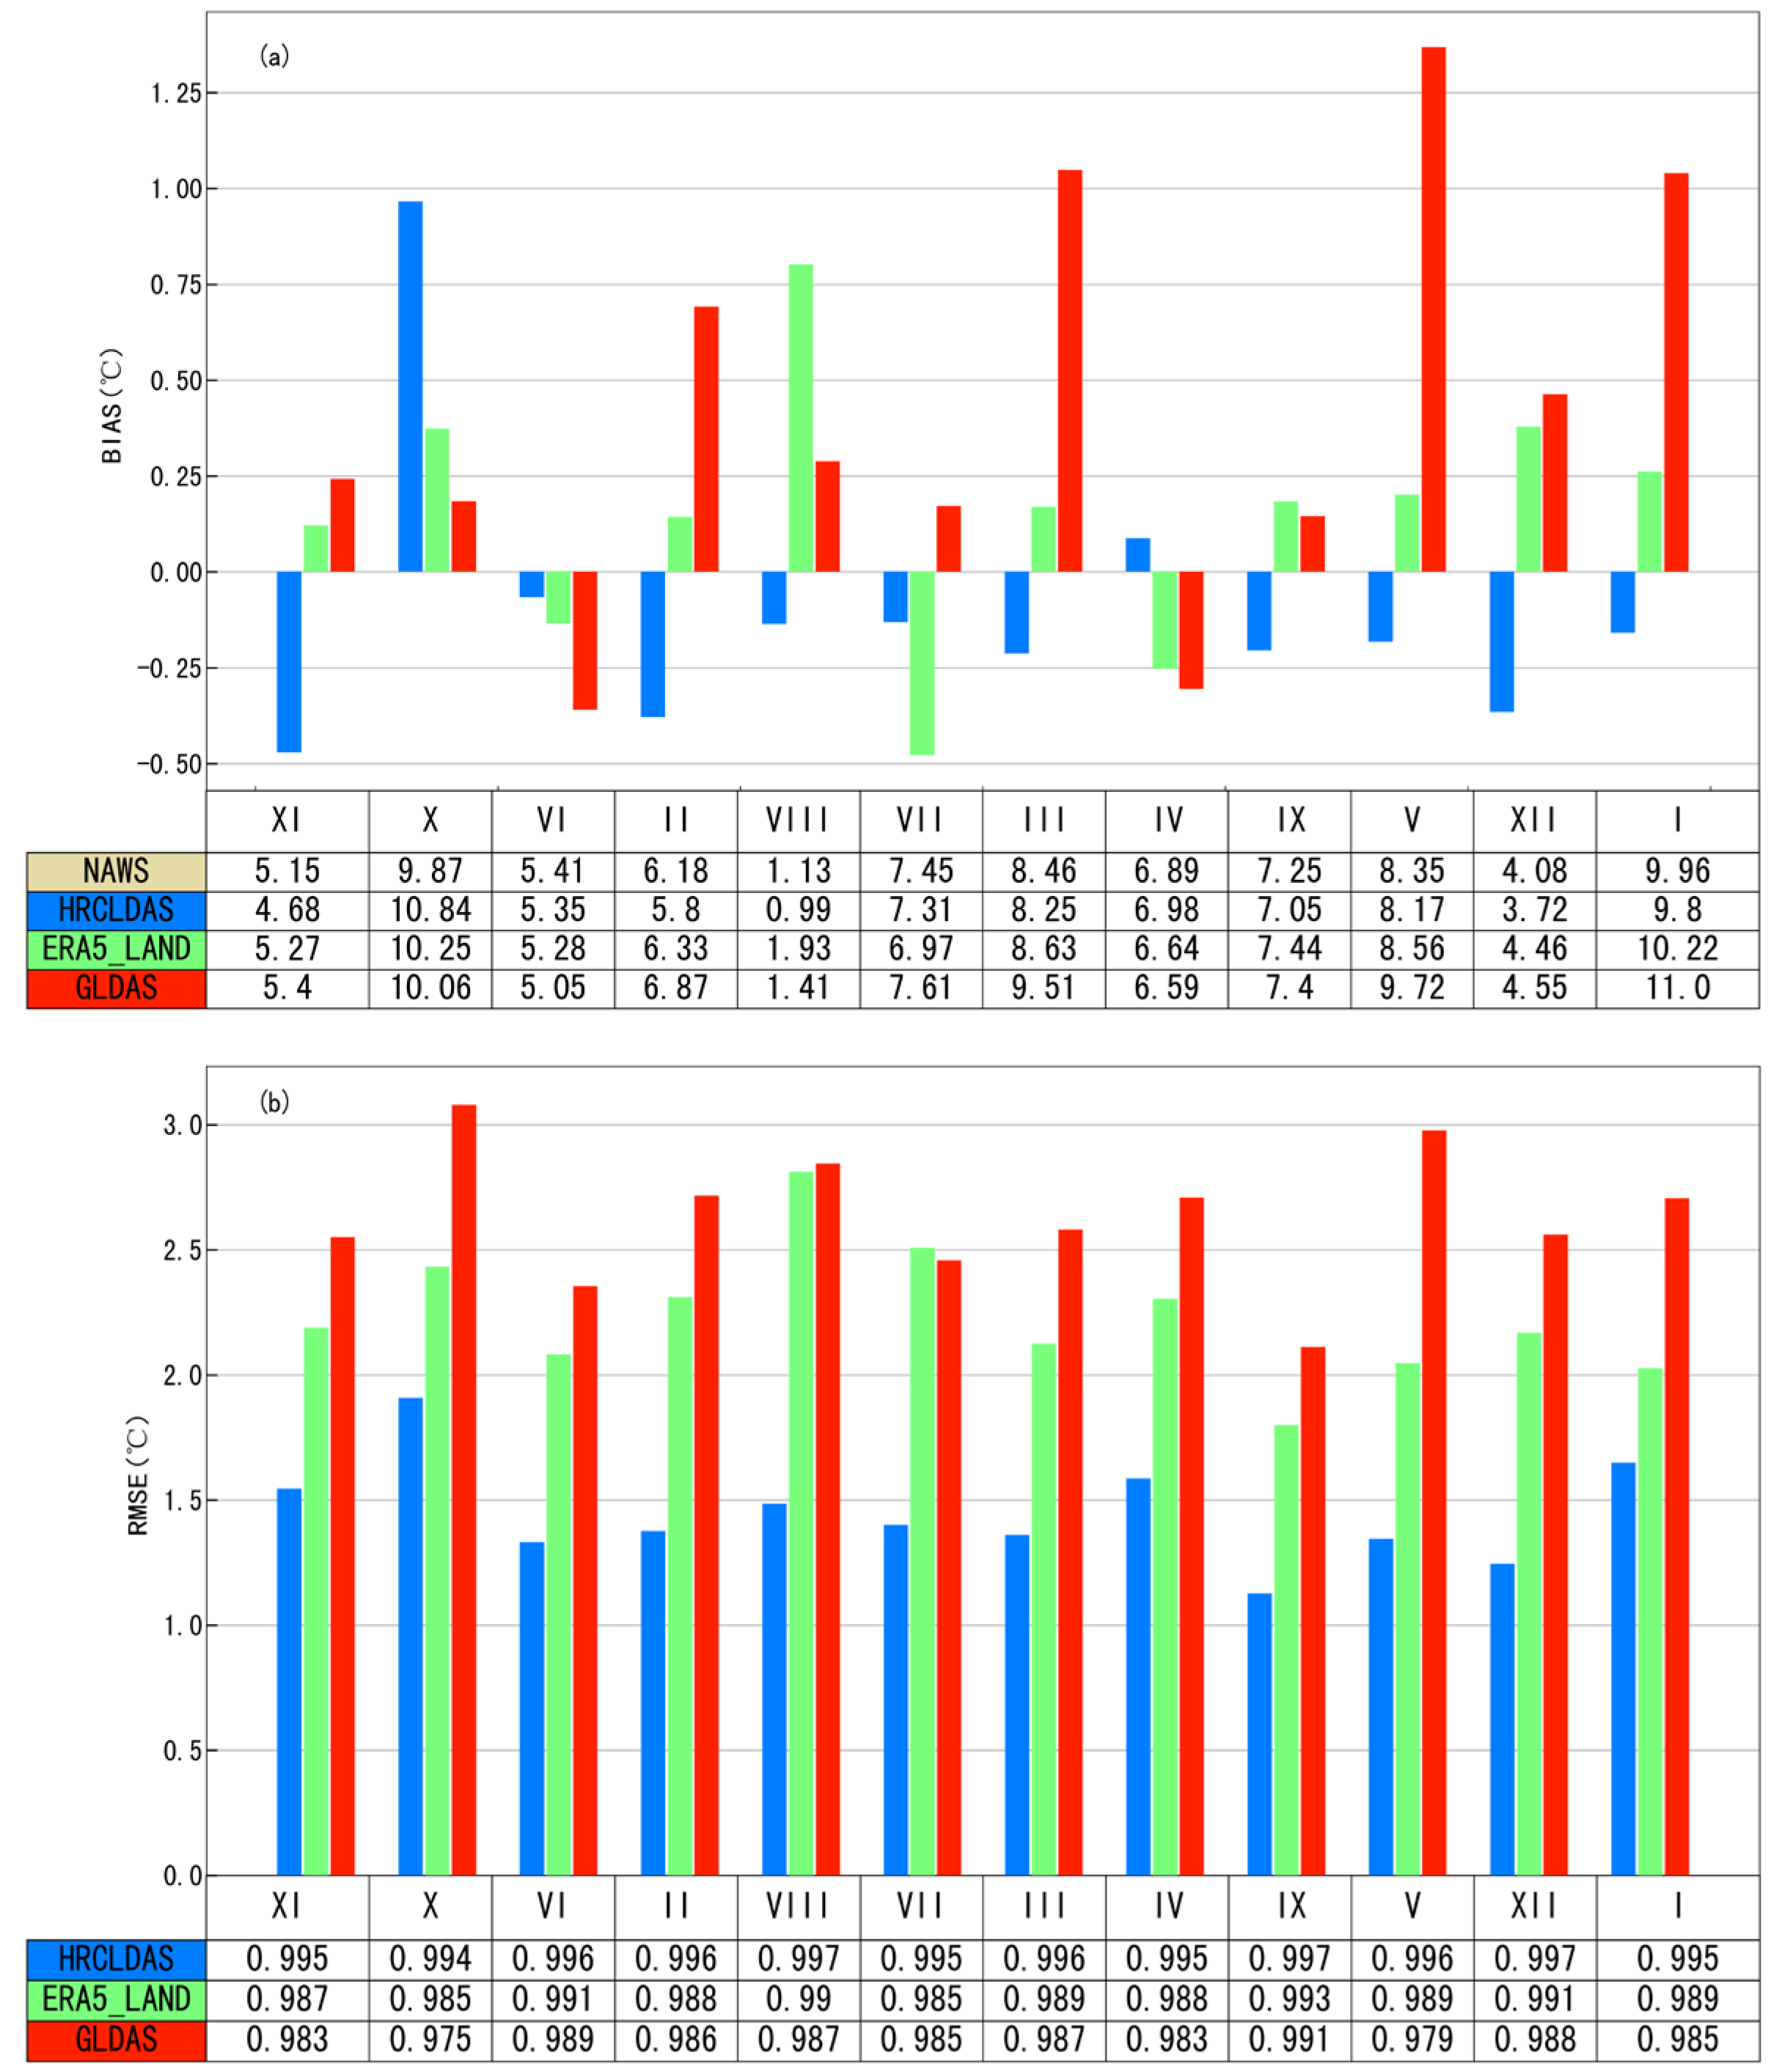
3.3.2. Sub-Region Test
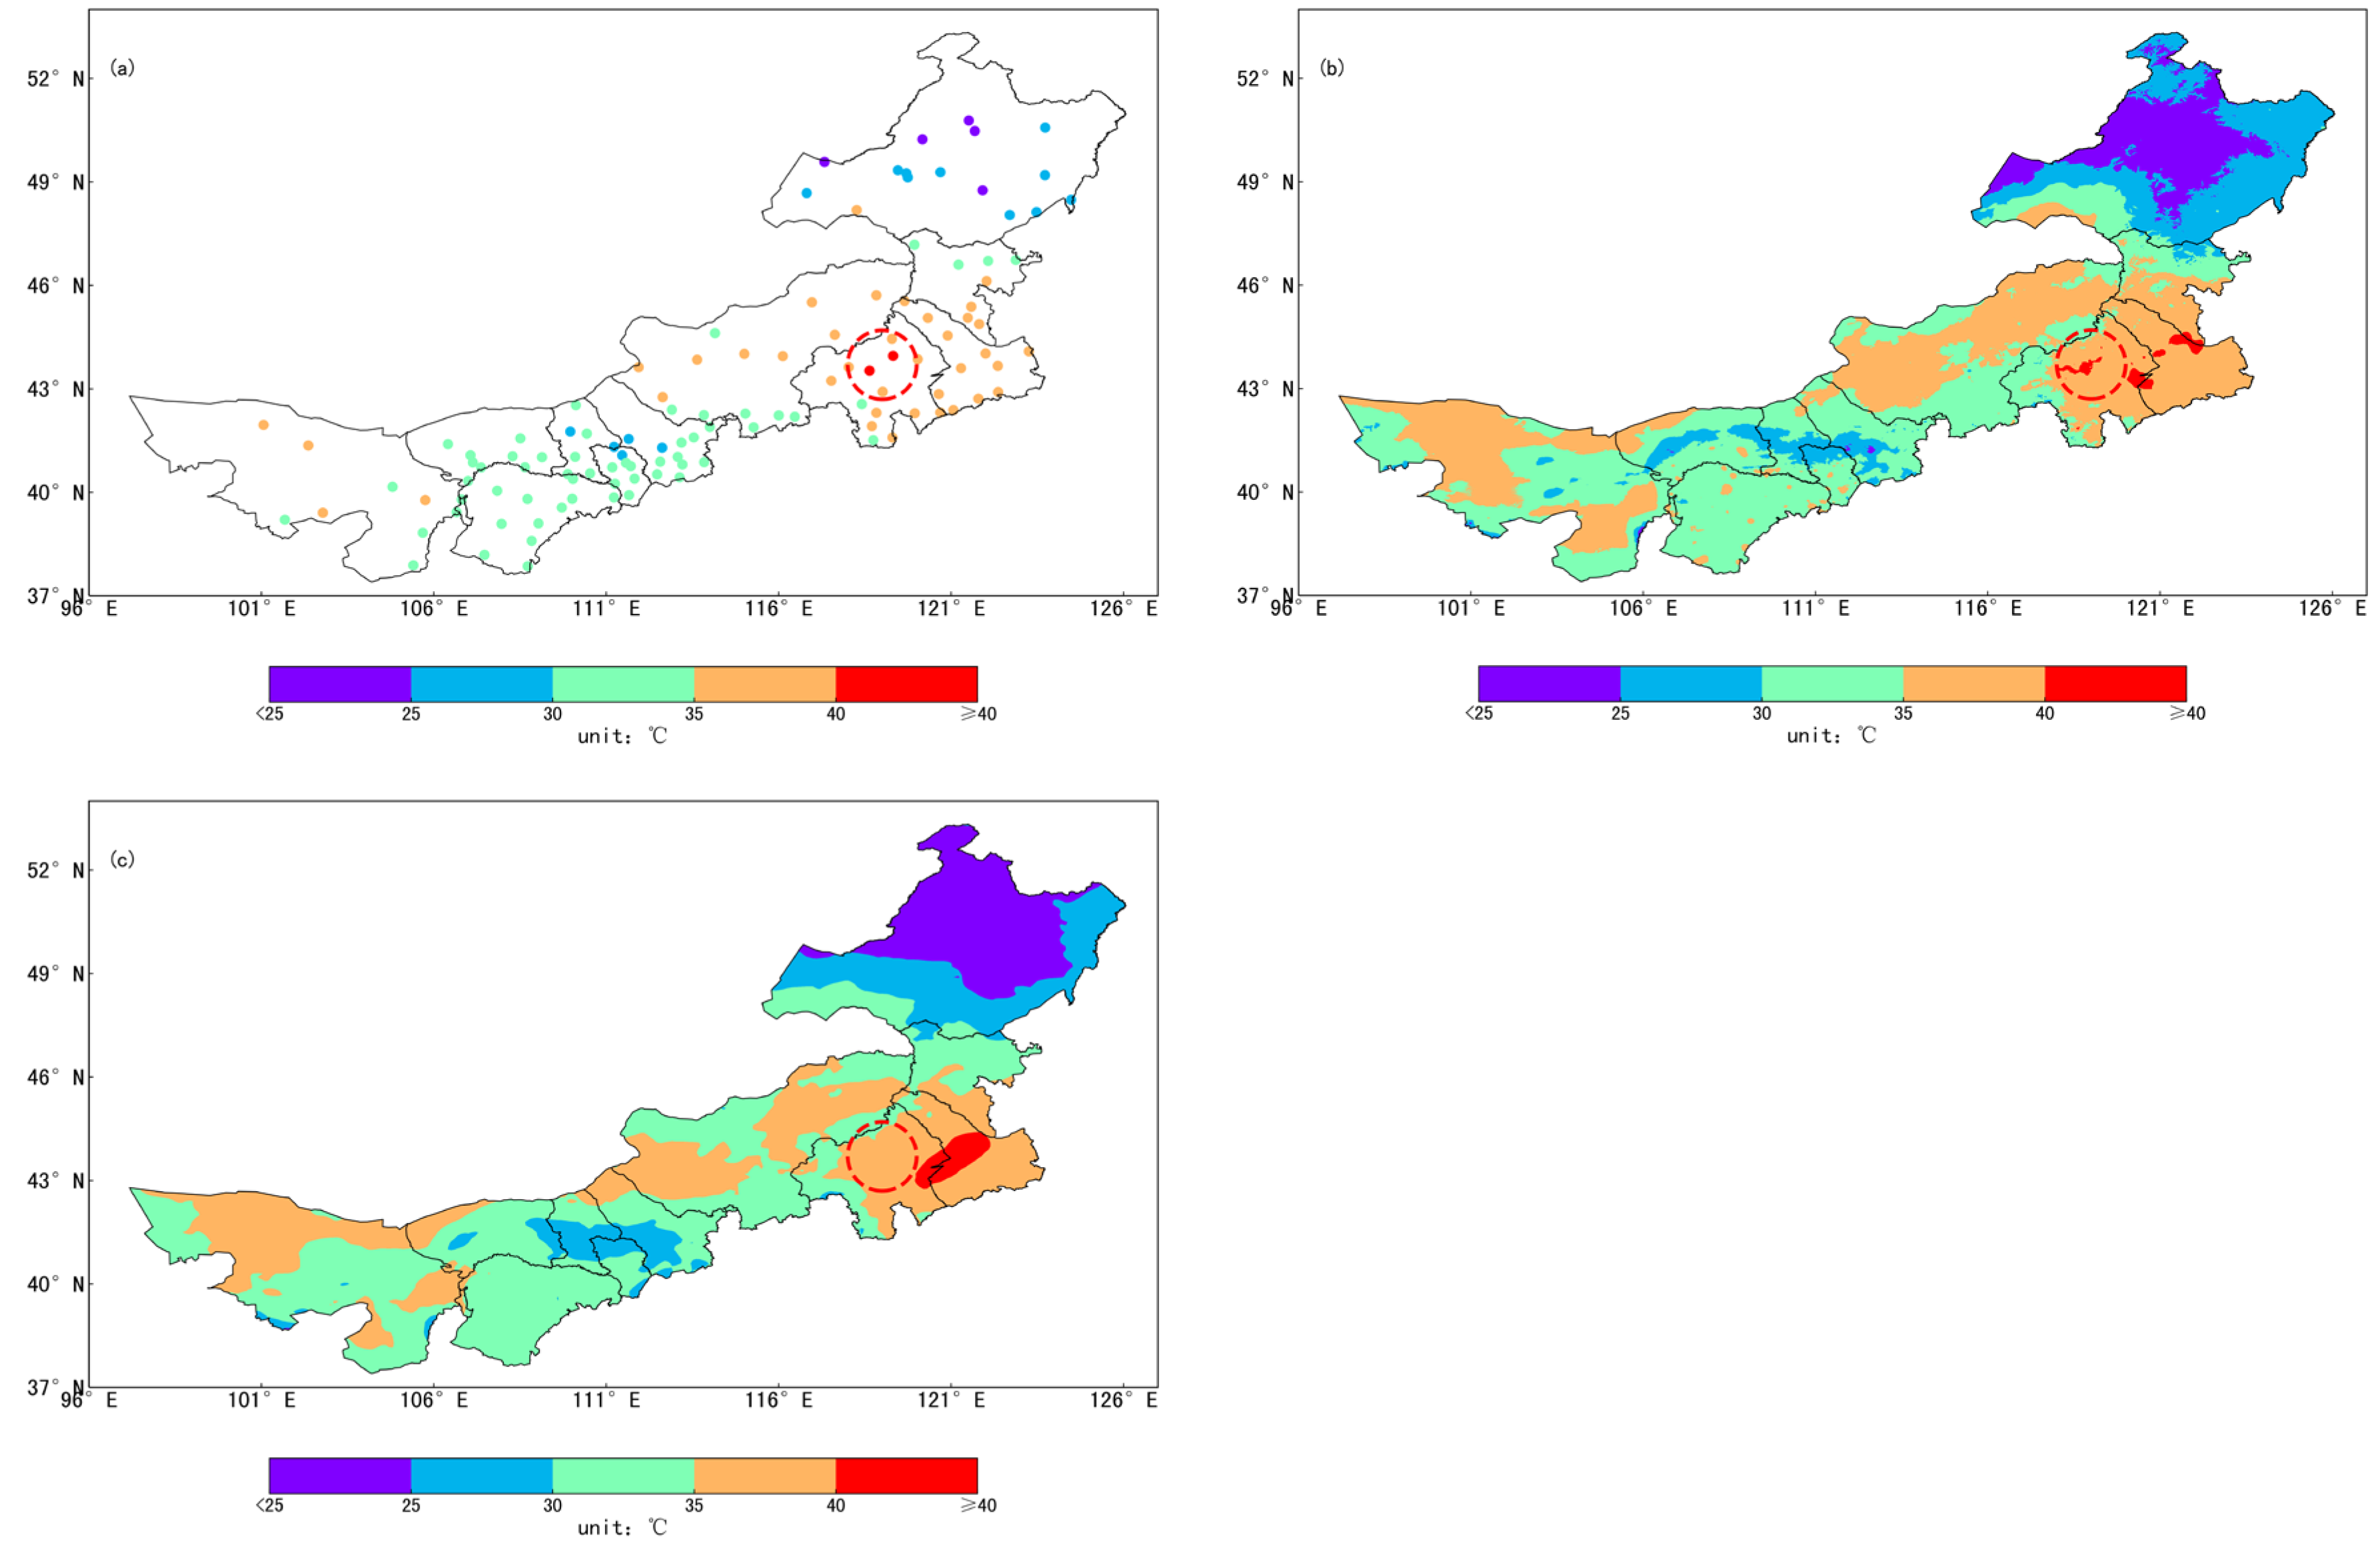
3.4. Test of High-Temperature Process
4. Discussion
5. Conclusions
- (1)
- Compared with the observation results, the three sets of reanalysis temperature products all reasonably reflect the characteristics of surface temperature changes in Inner Mongolia over time. The correlation coefficient between the three reanalysis temperature products and observations exceeds 0.85. GLDAS shows a warm bias most of the time, HRCLDAS shows a slight negative bias in time, ERA5-Land shows a warm bias in autumn and winter, and spring and summer show a cold bias.
- (2)
- The evaluation results at multiple spatial scales indicate that the accuracy and applicability of HRCLDAS are significantly superior to the other two datasets. The quality of reanalysis datasets varies at different observation stations and cities, and the quality of the three reanalysis datasets is significantly affected by terrain.
- (3)
- In terms of maximum temperature, HRCLDAS is closer to the observation results than ERA5 Land, and HRCLDAS exhibits more locally detailed features, but there are a few false reports. ERA5-Land exhibits smooth characteristics towards high temperatures, and its accuracy in reproducing high temperatures is lower than that of HRCLDAS.
Author Contributions
Funding
Data Availability Statement
Acknowledgments
Conflicts of Interest
References
- Huang, J.; Yu, H.; Guan, X.; Guo, R. Accelerated dryland expansion under climate change. Nat. Clim. Chang. 2016, 6, 116–171. [Google Scholar] [CrossRef]
- Lofgren, B.M.; Hunter, T.S.; Wilbarger, J. Effects of using air temperature as a proxy for potential evapotranspiration in climate change scenarios of Great Lakes basin hydrology. J. Great Lakes Res. 2011, 37, 744–752. [Google Scholar] [CrossRef]
- Kang, L.; Huang, J.; Chen, S.; Wang, X. Long-term trends of dust events over Tibetan Plateau during 1961–2010. Atmos. Environ. 2016, 125, 188–198. [Google Scholar] [CrossRef]
- Pörtner, H.-O.; Roberts, D.C.; Adams, H.; Adelekan, I.; Adler, C.; Adrian, R.; Aldunce, P.; Ali, E.; Begum, R.A.; BednarFriedl, B.; et al. Technical Summary. In Climate Change 2022: Impacts, Adaptation and Vulnerability. Contribution of Working Group II to the Sixth Assessment Report of the Intergovernmental Panel on Climate Change; Pörtner, H.-O., Roberts, D.C., Tignor, M., Poloczanska, E.S., Mintenbeck, K., Alegría, A., Craig, M., Langsdorf, S., Löschke, S., Möller, V., et al., Eds.; Cambridge University Press: Cambridge, UK; New York, NY, USA, 2022; pp. 37–118. [Google Scholar] [CrossRef]
- Chen, S.; Chen, W.; Wu, R.; Yu, B.; Song, L. Performance of the IPCC AR6 models in simulating the relation of the western North Pacific subtropical high to the spring northern tropical Atlantic SST. Int. J. Climatol. 2020, 41, 725. [Google Scholar] [CrossRef]
- Howarth, C.; Viner, D. Integrating adaptation practice in assessments of climate change science: The case of IPCC Working Group II reports. Environ. Sci. Policy 2022, 135, 1–5. [Google Scholar] [CrossRef]
- Ma, S.; Zhang, S.; Wang, N.; Huang, C.; Wang, X. Prolonged duration and increased severity of agricultural droughts during 1978 to 2016 detected by ESA CCI SM in the humid Yunnan Province, Southwest China. Catena 2021, 198, 105036. [Google Scholar] [CrossRef]
- Zhang, S.; Tao, F.; Zhang, Z. Rice reproductive growth duration increased despite of negative impacts of climate warming across China during 1981–2009. Eur. J. Agron. 2014, 54, 70–83. [Google Scholar] [CrossRef]
- Liu, Y.; Chen, Q.; Ge, Q.; Dai, J.; Qin, Y.; Dai, l.; Zou, X.; Chen, J. Modelling the impacts of climate change and crop management on phenological trends of spring and winter wheat in China. Agric. For. Meteorol. 2018, 248, 518–526. [Google Scholar] [CrossRef]
- Du, B.; Zhen, L.; Yan, H.; De Groot, R. Effects of government grassland conservation policy on household livelihoods and dependence on local grasslands: Evidence from Inner Mongolia, China. Sustainability 2016, 8, 1314. [Google Scholar] [CrossRef]
- Tian, H.; Cao, C.; Chen, W.; Bao, S.; Yang, B.; Myneni, R.B. Response of vegetation activity dynamic to climatic change and ecological restoration programs in Inner Mongolia from 2000 to 2012. Ecol. Eng. 2015, 82, 276–289. [Google Scholar] [CrossRef]
- Zhang, G.; Kang, Y.; Han, G.; Katsutoshi, S.; Myneni, R.B. Effect of climate change over the past half century on the distribution, extent and NPP of ecosystems of Inner Mongolia. Glob. Chang. Biol. 2011, 17, 377–389. [Google Scholar] [CrossRef]
- Ma, Z.; Yu, H.; Zhang, Q.; Cao, C. Characteristics and abrupt change of temperature and precipitation in Inner Mongolia area over the period 1960–2016. Res. Soil Water Conserv. 2019, 26, 114–121. (In Chinese) [Google Scholar] [CrossRef]
- Wang, S.; Zhang, Y.; Guo, L.; Lai, M. Variation Characteristics and Future Trend Estimation of Temperature in Inner Mongolia During 1981–2010. Meteorol. Environ. Sci. 2017, 40, 114–120. (In Chinese) [Google Scholar] [CrossRef]
- Dong, Z.; Pan, Z.; Xue, X.; Li, N.; Chen, C.; Chen, Y. An assessment of the impact threshold and risk of spring-wheat production to climate change in Inner Mongolia, China. Theor. Appl. Climatol. 2022, 149, 1391–1403. [Google Scholar] [CrossRef]
- Qiao, S.; Gao, X.; Qu, Z.; Yang, X.; Chang, X.; Yang, F.; Feng, X. Impact of climate change on the water requirements and yield of spring maize in Inner Mongolia of China from 1959 to 2018. Trans. CSAE 2022, 38, 87–97. Available online: http://www.tcsae.org (accessed on 23 August 2023). (In Chinese). [CrossRef]
- Hao, L.; Wang, S.; Cui, X.; Zhai, Y. Spatiotemporal Dynamics of Vegetation Net Primary Productivity and Its Response to Climate Change in Inner Mongolia from 2002 to 2019. Sustainability 2021, 13, 13310. [Google Scholar] [CrossRef]
- He, D.; Huang, X.; Tian, Q.; Zhang, Z. Changes in Vegetation Growth Dynamics and Relations with Climate in Inner Mongolia under More Strict Multiple Pre-Processing (2000–2018). Sustainability 2020, 12, 2534. [Google Scholar] [CrossRef]
- Ren, S.; Yi, S.; Peichl, M.; Wang, X. Diverse responses of vegetation phenology to climate change in different grasslands in Inner Mongolia during 2000–2016. Remote Sens. 2018, 10, 17. [Google Scholar] [CrossRef]
- Dhanya, C.T.; Villarini, G. An investigation of predictability dynamics of temperature and precipitation in reanalysis datasets over the continental United States. Atmos. Res. 2017, 183, 341–350. [Google Scholar] [CrossRef]
- Kobayashi, C.; Endo, H.; Ota, Y.; Kobayashi, S.; Kamahori, H. Preliminary Results of the JRA-55C, an Atmospheric Reanalysis Assimilating Conventional Observations Only. Sci. Online Lett. Atmos. 2014, 10, 2014–2016. [Google Scholar] [CrossRef]
- Kanamitsu, M.; Kistler, R.E.; Reynolds, R.W. NCEP/NCAR reanalysis and the use of satellite data. Adv. Space Res. 1997, 19, 481–489. [Google Scholar] [CrossRef]
- Saha, S.; Moorthi, S.; Pan, H.L.; Wu, X.; Wang, J.; Nadiga, S.; Tripp, P.; Kistler, R.; Woollen, J.; Behringer, D.; et al. The NCEP climate forecast system reanalysis. Bull. Am. Meteorol. Soc. 2010, 91, 1015–1057. [Google Scholar] [CrossRef]
- Hersbach, H.; Bell, B.; Berrisford, P.; Hirahara, S.; Horányi, A.; Muñoz-Sabater, J.; Nicolas, J.; Peubey, C.; Radu, R.; Schepers, D.; et al. The ERA5 global reanalysis. Q. J. R. Meteorol. Soc. 2020, 146, 1999–2049. [Google Scholar] [CrossRef]
- Kobayashi, S.; Ota, Y.; Harada, Y.; Ebita, A.; Moriya, M.; Onoda, H.; Onogi, K.; Kamahori, H.; Kobayashi, C.; Endo, H.; et al. The JRA-55 reanalysis: General specifications and basic characteristics. J. Meteorol. Soc. Jpn. 2015, 93, 5–48. [Google Scholar] [CrossRef]
- Rienecker, M.M.; Suarez, M.J.; Gelaro, R.; Todling, R.; Bacmeister, J.; Liu, E.; Bosilovich, M.G.; Schubert, S.D.; Takacs, L.; Kim, G.K.; et al. MERRA: NASA’s modern-era retrospective analysis for research and applications. J. Clim. 2011, 24, 3624–3648. [Google Scholar] [CrossRef]
- Shen, C.; Zha, J.; Wu, J.; Zhao, D.; Azorin-Molina, C.; Fan, W.; Yu, Y. Does CRA-40 outperform other reanalysis products in evaluating near-surface wind speed changes over China? Atmos. Res. 2022, 266, 105948. [Google Scholar] [CrossRef]
- Liu, S.; Su, H.; Zhang, R.; Tian, J.; Wang, W. Estimating the Surface Air Temperature by Remote Sensing in Northwest China Using an Improved Advection-Energy Balance for Air Temperature Model. Adv. Meteorol. 2016, 2016, 4294219. [Google Scholar] [CrossRef]
- Oses, N.; Azpiroz, I.; Marchi, S.; Guidotti, D.; Quartulli, M.; Olaizola, I.G. Analysis of Copernicus’ ERA5 Climate Reanalysis Data as a Replacement for Weather Station Temperature Measurements in Machine Learning Models for Olive Phenology Phase Prediction. Sensors 2020, 20, 6381. [Google Scholar] [CrossRef]
- Zhu, J.; Xie, A.; Qin, X.; Wang, Y.; Wang, Y. An Assessment of ERA5 Reanalysis for Antarctic Near-Surface Air Temperature. Atmosphere 2021, 12, 217. [Google Scholar] [CrossRef]
- Santamaría-Artigas, A.E.; Franch, B.; Guillevic, P.; Roger, J.-C.; Vermote, E.F.; Skakun, S. Evaluation of Near-Surface Air Temperature from Reanalysis over the United States and Ukraine: Application to Winter Wheat Yield Forecasting. IEEE J. Sel. Top. Appl. Earth Obs. Remote Sens. 2018, 12, 2260–2269. [Google Scholar] [CrossRef]
- Wang, S.; Liu, H.; Yu, Y.; Zhao, W.; Yang, Q.; Liu, J. Evaluation of groundwater sustainability in the arid Hexi Corridor of Northwestern China, using GRACE, GLDAS and measured groundwater data products. Sci. Total Environ. 2020, 705, 135829. [Google Scholar] [CrossRef] [PubMed]
- Wang, Q.; Li, W.; Xiao, C.; Ai, W. Evaluation of High-Resolution Crop Model Meteorological Forcing Datasets at Regional Scale: Air Temperature and Precipitation over Major Land Areas of China. Atmosphere 2020, 11, 1011. [Google Scholar] [CrossRef]
- Rodell, M.; Houser, P.R.; Jambor, U.E.; Gottschalck, J.; Mitchell, K.; Meng, C.J.; Arsenault, K.; Cosgrove, B.; Radakovich, J.; Bosilovich, M.; et al. The global land data assimilation system. Bull. Am. Meteorol. Soc. 2004, 85, 381–394. [Google Scholar] [CrossRef]
- Muoz-Sabater, J.; Dutra, E.; Agustí-Panareda, A.; Albergel, C.; Thépaut, J.-N. ERA5land: A state-of-the-art global reanalysis dataset for land applications. Earth Syst. Sci. Data 2021, 13, 4349–4383. [Google Scholar] [CrossRef]
- Jiang, Y.; Han, S.; Shi, C.; Gao, T.; Zhen, H.; Liu, X. Evaluation of HRCLDAS and ERA5 Datasets for Near-Surface Wind over Hainan Island and South China Sea. Atmosphere 2021, 12, 766. [Google Scholar] [CrossRef]
- Huang, X.; Han, S.; Shi, C. Multiscale Assessments of Three Reanalysis Temperature Data Systems over China. Agriculture 2021, 11, 1292. [Google Scholar] [CrossRef]
- Han, S.; Liu, B.; Shi, C.; Liu, Y.; Qiu, M.; Sun, S. Evaluation of CLDAS and GLDAS datasets for Near-surface Air Temperature over major land areas of China. Sustainability 2020, 12, 4311. [Google Scholar] [CrossRef]
- Yang, S.; Li, R.; Wu, T.; Hua, G.; Xiao, Y.; Du, Y.; Zhu, X.; Ni, J.; Ma, J.; Zhang, Y.; et al. Evaluation of reanalysis soil temperature and soil moisture products in permafrost regions on the Qinghai-Tibetan Plateau. Geoderma 2020, 377, 114583. [Google Scholar] [CrossRef]
- Zou, J.; Lu, N.; Jiang, H.; Qin, J.; Yao, L.; Xin, Y.; Su, P. Performance of air temperature from ERA5-Land reanalysis in coastal urban agglomeration of Southeast China. Sci. Total Environ. 2022, 828, 154459. [Google Scholar] [CrossRef]
- Yao, L.; Lu, J.; Xia, X.; Jing, W.; Liu, Y. Evaluation of the ERA5 Sea Surface Temperature Around the Pacific and the Atlantic. IEEE Access 2021, 9, 12067–12072. [Google Scholar] [CrossRef]
- Cong, F.; Wang, J.; Long, K.; Huang, X. Analysis of Applicability of Multi-Source Melting Qualification Point Data in Sichuan High Temperature Process. Plateau Mt. Meteorol. Res. 2020, 40, 65–69. (In Chinese) [Google Scholar] [CrossRef]
- Huang, X.; Han, S.; Shi, C. Evaluation of Three Air Temperature Reanalysis Datasets in the Alpine Region of the Qinghai–Tibet Plateau. Remote Sens. 2022, 14, 4447. [Google Scholar] [CrossRef]
- Yu, Y.; Xiao, W.; Zhang, Z.; Cheng, X. Evaluation of 2-m Air Temperature and Surface Temperature from ERA5 and ERA-I Using Buoy Observations in the Arctic during 2010–2020. Remote Sens. 2021, 13, 2813. [Google Scholar] [CrossRef]
- Huai, B.; Wang, J.; Sun, W.; Wang, Y.; Zhang, W. Evaluation of the near-surface climate of the recent global atmospheric reanalysis for Qilian Mountains, Qinghai-Tibet Plateau. Atmos. Res. 2021, 250, 105401. [Google Scholar] [CrossRef]
- Ma, L.; Zhang, T.; Li, Q.; Frauenfeld, O.W.; Qin, D. Evaluation of ERA40, NCEP-1, and NCEP-2 reanalysis air temperatures with groundbased measurements in China. J. Geophys. Res. Atmos. 2008, 113, D18199. [Google Scholar] [CrossRef]
- Zhang, S.; Ren, G.; Ren, Y.; Zhang, Y.; Xue, X. A Comprehensive Evaluation of Surface Air Temperature Reanalyses over China against Urbanization Bias–Adjusted Observations. Adv. Atmos. Sci. 2021, 12, 783–794. [Google Scholar] [CrossRef]
- Gao, L.; Bernhardt, M.; Schulz, K. Elevation correction of ERA-Interim temperature data in complex terrain. Hydrol. Earth Syst. Sci. 2012, 16, 4661–4673. [Google Scholar] [CrossRef]
- Song, C.; Ke, L.; Richards, K.S.; Cui, Y. Homogenization of surface temperature data in High Mountain Asia through comparison of reanalysis data and station observations. Int. J. Climatol. 2016, 36, 1088–1101. [Google Scholar] [CrossRef]
- Wang, B.; Chen, D.; Song, M. Study on the Applicability of ERA5 Reanalysis Data at Lake Taihu. J. Geosci. Environ. Prot. 2022, 10, 1–16. [Google Scholar] [CrossRef]
- Yu, X.; Zhang, L.; Zhou, T.; Liu, J. The Asian Subtropical Westerly Jet Stream in CRA-40, ERA5, and CFSR Reanalysis Data: Comparative Assessment. J. Meteorol. Res. 2021, 35, 46–63. [Google Scholar] [CrossRef]
- Zhang, Y.; Mao, G.; Chen, C.; Shen, L.; Xiao, B. Population Exposure to Compound Droughts and Heatwaves in the Observations and ERA5 Reanalysis Data in the Gan River Basin, China. Land 2021, 10, 1021. [Google Scholar] [CrossRef]
- Liu, L.; Gu, H.; Xie, J.; Xu, Y.P. How well do the ERA-Interim, ERA-5, GLDAS-2.1 and NCEP-R2 reanalysis datasets represent daily air temperature over the Tibetan Plateau? Int. J. Climatol. 2020, 41, 1484–1505. [Google Scholar] [CrossRef]
- Hu, G.; Zhao, L.; Wu, X.; Li, R.; Wu, T.; Su, Y.; Hao, J. Evaluation of reanalysis air temperature products in permafrost regions on the Qinghai-Tibetan Plateau. Theor. Appl. Climatol. 2019, 138, 1457–1470. [Google Scholar] [CrossRef]
- Sun, S.; Zhang, Q.; Singh, V.P.; Shi, C.; Wang, G.; Wu, W.; Shen, Z. Increased moist heat stress risk across China under warming climate. Sci. Rep. 2022, 12, 22548. [Google Scholar] [CrossRef]
- Rakhmatova, N.; Arushanov, M.; Shardakova, L.; Nishonov, B.; Taryannikova, R.; Rakhmatova, V.; Belikov, D.A. Evaluation of the perspective of era-interim and era5 reanalyses for calculation of drought indicators for uzbekistan. Atmosphere 2021, 12, 27. [Google Scholar] [CrossRef]
- Xue, C.; Wu, H.; Jiang, X. Temporal and Spatial Change Monitoring of Drought Grade Based on ERA5 Analysis Data and BFAST Method in the Belt and Road Area during 1989–2017. Adv. Meteorol. 2019, 2019, 4053718. [Google Scholar] [CrossRef]
- Zhu, X.; Liu, T.; Xu, K.; Chen, C. The impact of high temperature and drought stress on the yield of major staple crops in northern China. J. Environ. Manag. 2022, 314, 115092. [Google Scholar] [CrossRef] [PubMed]


| Datasets | Spatial Coverage | Spatial Resolution | Temporal Resolution | Data Type | Unit |
|---|---|---|---|---|---|
| GLDAS | 180° W~180° E; 60° S~90° N | 0.25° | 3-hourly | Grid | K |
| ERA5-Land | 180° W~180° E; 60° S~90° N | 0.1° | Hourly | Grid | K |
| HRCLDAS | 70°~140° E; 0°~60° N | 0.01° | Hourly | Grid | K |
| NAWS | Over major land areas of Inner Mongolia Autonomous Region | 119 stations | Hourly | Point | °C |
| Evaluation Indexes | HRCLDAS | ERA5-Land | GLDAS |
|---|---|---|---|
| COR | 0.94 | 0.87 | 0.85 |
| BIAS (°C) | −0.19 | 0.18 | 0.41 |
| RMSE (°C) | 1.37 | 2.17 | 2.55 |
| ≥40 °C | <40.0 °C and ≥37.0 °C | <40.0 °C and ≥37.0 °C | Total | |
|---|---|---|---|---|
| 2018 | 9 | 134 | 352 | 495 |
| 2019 | 6 | 59 | 241 | 306 |
| 2020 | 0 | 78 | 312 | 390 |
| HRCLDAS | ERA5-LAND | ||||
|---|---|---|---|---|---|
| Accuracy (≤1 °C) | Accuracy (≤2 °C) | RMSE | Accuracy (≤1 °C) | Accuracy (≤2 °C) | RMSE |
| 83.19% | 94.96% | 0.86 | 35.29% | 73.95% | 1.79 |
Disclaimer/Publisher’s Note: The statements, opinions and data contained in all publications are solely those of the individual author(s) and contributor(s) and not of MDPI and/or the editor(s). MDPI and/or the editor(s) disclaim responsibility for any injury to people or property resulting from any ideas, methods, instructions or products referred to in the content. |
© 2023 by the authors. Licensee MDPI, Basel, Switzerland. This article is an open access article distributed under the terms and conditions of the Creative Commons Attribution (CC BY) license (https://creativecommons.org/licenses/by/4.0/).
Share and Cite
Xu, Y.; Han, S.; Shi, C.; Tao, R.; Zhang, J.; Zhang, Y.; Wang, Z. Comparative Analysis of Three Near-Surface Air Temperature Reanalysis Datasets in Inner Mongolia Region. Sustainability 2023, 15, 13046. https://doi.org/10.3390/su151713046
Xu Y, Han S, Shi C, Tao R, Zhang J, Zhang Y, Wang Z. Comparative Analysis of Three Near-Surface Air Temperature Reanalysis Datasets in Inner Mongolia Region. Sustainability. 2023; 15(17):13046. https://doi.org/10.3390/su151713046
Chicago/Turabian StyleXu, Yanqin, Shuai Han, Chunxiang Shi, Rui Tao, Jiaojiao Zhang, Yu Zhang, and Zheng Wang. 2023. "Comparative Analysis of Three Near-Surface Air Temperature Reanalysis Datasets in Inner Mongolia Region" Sustainability 15, no. 17: 13046. https://doi.org/10.3390/su151713046
APA StyleXu, Y., Han, S., Shi, C., Tao, R., Zhang, J., Zhang, Y., & Wang, Z. (2023). Comparative Analysis of Three Near-Surface Air Temperature Reanalysis Datasets in Inner Mongolia Region. Sustainability, 15(17), 13046. https://doi.org/10.3390/su151713046