Article

Research on Technology System Adaptability of Nearly Zero-Energy Office Buildings in the Hot Summer and Cold Winter Zone of China

1
School of Civil Engineering, Architecture and Environment, Hubei University of Technology, Wuhan 430068, China
2
College of Design and Engineering, National University of Singapore, Singapore 117566, Singapore
3
Central-South Architectural Design Institute Co., Ltd., Wuhan 430061, China
*
Author to whom correspondence should be addressed.
Sustainability 2023, 15(17), 13061; https://doi.org/10.3390/su151713061
Submission received: 2 August 2023 / Revised: 28 August 2023 / Accepted: 28 August 2023 / Published: 30 August 2023
(This article belongs to the Special Issue Low-Carbon Buildings and Climate Change Mitigation)

Abstract

:
In the current context of huge global energy consumption and harsh climatic conditions, the energy efficiency and sustainability of buildings have received much attention. The nearly zero-energy building (nZEB) is a feasible solution for solving the energy crisis in the building sector in recent years, and it is important to study the adaptability of its technology system. However, existing studies have not addressed well the issue of the impact of complex and diverse climates on the technology systems of nZEBs. Secondly, in contrast to residential buildings, nearly zero-energy technology systems for office buildings need to be further developed. This study takes the hot summer and cold winter (HSCW) zone of China as an example and uses numerical simulations and orthogonal experiments to investigate the adaptability of nearly zero-energy office building technology systems under complex and diverse climate conditions. The results show the following: (1) Passive technologies are greatly affected by the complexity and diversity of climates. Optimal envelope thermal parameters tailored to specific zones are identified. Specifically, the optimal level of KWALL in the CT and HSCWC zones is 0.2 W/(m2·K), and the optimal level of KWALL in the HSWWT zone is 0.3 W/(m2·K); the optimal level of KROOF in the CT zone is 0.15 W/(m2·K), and the optimal level of KROOF in the HSCWC and HSWWT zones is 0.25 W/(m2·K); (2) Active technologies do not mainly receive the influence of the complexity and diversity of climates, and ED, HR, and TS measures should be adopted for office buildings; (3) The rational utilization of renewable energy is influenced by local resource conditions. This study evaluates the adaptability of GSHP, ASHP, and BIPV technologies. To better meet the requirements of nearly zero-energy office buildings, it is recommended to adopt GSHP for the CT zone and ASHP for the HCWWT zone. This study will be helpful for the development of nearly zero-energy office building technology systems in other complex and diverse climatic zones.

1. Introduction

Against the backdrop of global warming, environmental degradation, and tight energy supplies, the need to take necessary measures to reduce energy consumption and lower carbon emissions has become an urgent task [1]. This urgent task is global in scope, and the main areas of energy consumption are industry, transportation, and buildings, with the building sector accounting for about 35% of global energy consumption [2]. As the world’s second-largest economy, China’s carbon emissions accounted for 30.7% of global emissions in 2020, far exceeding those of other countries and zones. Furthermore, at the 2015 Paris Climate Change Conference, China made a solemn commitment to peak their carbon dioxide emissions around 2030 and reduce them to 60–65% of their 2005 levels [3]. To achieve “carbon neutrality” and “carbon peak”, the Chinese government proposed in the “14th Five-Year Plan” Building Energy Efficiency and Green Building Development Plan that by 2025, the energy efficiency level of new urban public buildings will increase by 20%, and 50 million square meters of ultra-low-energy-consumption and near-zero-energy-consumption buildings will be built [4]. The large-scale development of nearly zero-energy buildings and the improvement of design and evaluation standards are effective ways to achieve the “dual-carbon” goal, which is conducive to solving the problems of high energy consumption and high carbon emissions in the construction industry. China’s pathway towards future energy efficiency and zero-energy building development over the next 30 years is shown in Figure 1.
People’s quality of life has been significantly improved, resulting in a continuous growth trend in China’s building energy consumption [5], and its total energy consumption has increased from 10% in the late 70s of the 20th century to more than 30% at present [6]. Public buildings, including office buildings, commercial buildings, and school buildings, account for a large share of the building energy consumption [7], and the building energy consumption per square meter is about twice as much as that of residential buildings [8]. Of particular concern is the large-scale construction of office buildings, which are an important type of public building, accounting for about 50% of the total number of public buildings [9]. Additionally, at the same time, office buildings have high comfort requirements for temperature, humidity, and air quality [10]. As a result, the operation of a large number of heating, cooling, lighting, and ventilation equipment to meet the working and living needs of employees has led to a significant and sustained increase in the energy consumption of office buildings. Therefore, to achieve sustainable development in the construction industry, near-zero-energy office building technology systems must be fully investigated.
With an area of about 1.8 million square kilometers, a population of about 550 million, and a GDP of about 48% of the whole country, the hot summer and cold winter zone of China is one of the most densely populated and fastest economically developing zones in China [11]. As people’s standard of living improves, the demand for improved indoor thermal environments is growing. The HSCW zone is characterized as having hot and humid summers and cold and humid winters, with obvious seasonal changes. The complex and diverse climatic characteristics lead to a sharp increase in building energy consumption. Thus, it has become imperative to adopt efficient building energy-saving measures [12]. Despite the importance of this issue, existing studies [13,14,15] have primarily focused on examining building energy consumption in different cities within the established five major climate zones of China, neglecting the specific impact of the intricate and diverse climate on building energy consumption in the HSCW zone. Consequently, there is a relative dearth of research investigating the influence of various microclimatic zones on building energy consumption within a particular climate zone. Governments around the world have developed many policies to reduce the building energy consumption generated via heating equipment, meaning that most research on building performance optimization is focused on cold and severe weather zones [16]. Hence, this study aims to find nearly zero-energy office building technology systems suitable for the HSCW zone.
Indeed, reducing the cooling and heating load demand of buildings is key to improving energy efficiency and achieving nearly zero-energy buildings [17]. The cooling and heating load demand is influenced by the outdoor climatic environment, the building envelope, and the indoor microclimate environment, thus affecting human thermal comfort [18,19]. Therefore, the main focus of this study is to gain insights into the relationship between the building load demand, climatic diversity, and thermal performance of the building envelope using orthogonal experiments [20] and numerical simulations based on the complexity and diversity of the climatic characteristics of the HSCW zone [21]. Based on a clear definition of the building envelope’s performance scheme, efficient active technologies and renewable energy strategies are further applied to achieve nearly zero-energy consumption [22,23,24,25]. Huang et al. [26] used ENVI-met and Energy Plus to study the hot and humid climate zone in Taipei and found that the microclimate had a significant impact on building energy consumption. Zhao et al. [27] analyzed the effects of major thermal properties of envelope structures on energy consumption in different climate zones in China. Wu et al. [28] investigated the intelligent multi-objective optimization of near-zero-energy buildings in four climate zones in China and found that the main influencing factors and corresponding measures varied from region to region. Yang et al. [29] used the orthogonal test method and established 135 building energy consumption calculation models in DEST to investigate the influencing factors of energy consumption of near-zero-energy residential buildings in the cold and arid zones of Northwest China. Ke et al. [30] identified key influencing factors on buildings, people, and the environment to explore the energy consumption and carbon emission characteristics of nearly zero-energy residential buildings in the HSCW zone of China. It can be found that most of the studies focus on exploring the mechanism and degree of influence of nZEB energy consumption influencing factors and neglect exploring the technology systems of nearly zero-energy buildings. In addition, the adaptive strategies of nZEB technology systems have not been sufficiently emphasized regarding their applications in specific climate zones. Hence, the purpose of this paper is to carry out a study on the adaptability of nearly zero-energy office building technology systems from the perspective of complex climate characteristics in the HSCW zone.
This paper consists of four parts: the Section 1 reviews the existing literature and introduces the background of this study, the current status of nZEBs, and the research focus of this study; the Section 2 analyzes the complex and diverse climatic characteristics of China’s HSCW zone, summarizes the energy-use profile of office buildings, selects case buildings, and proposes optimization methods for the nearly zero-energy technology system; the Section 3 explores the applicability and energy-saving potential of different energy-saving technologies in the HSCW zone in terms of passive technologies, active technologies, and renewable energy applications; and the Section 4 concludes this paper and provides considerations for future research work.

2. Materials and Methods

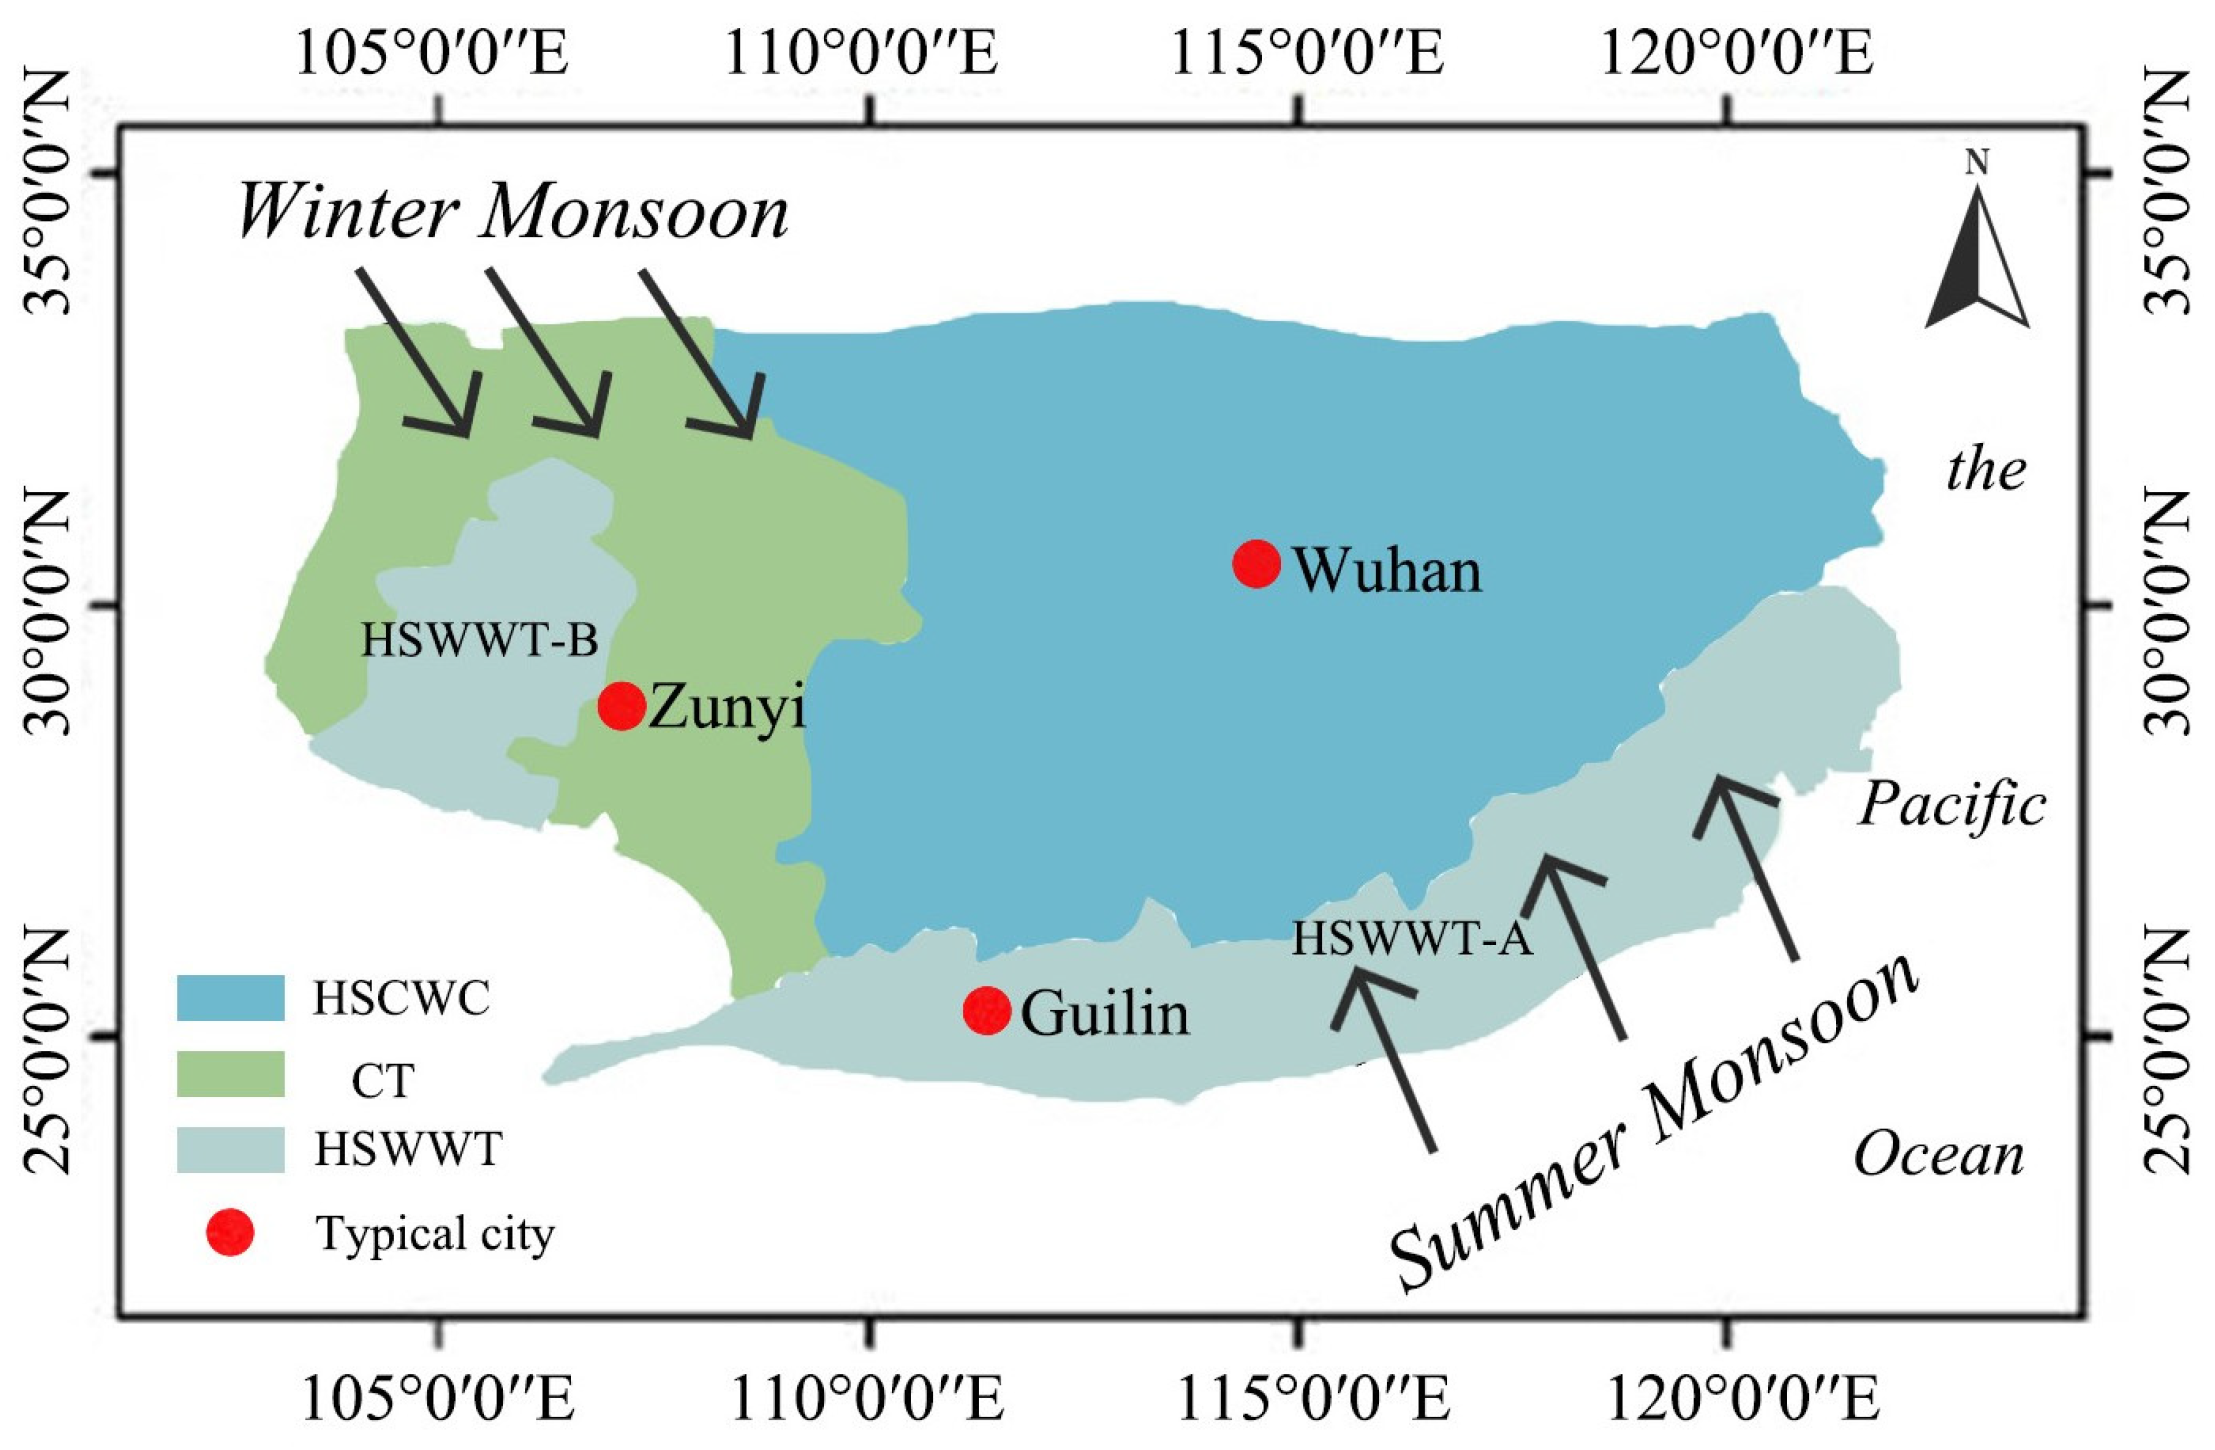
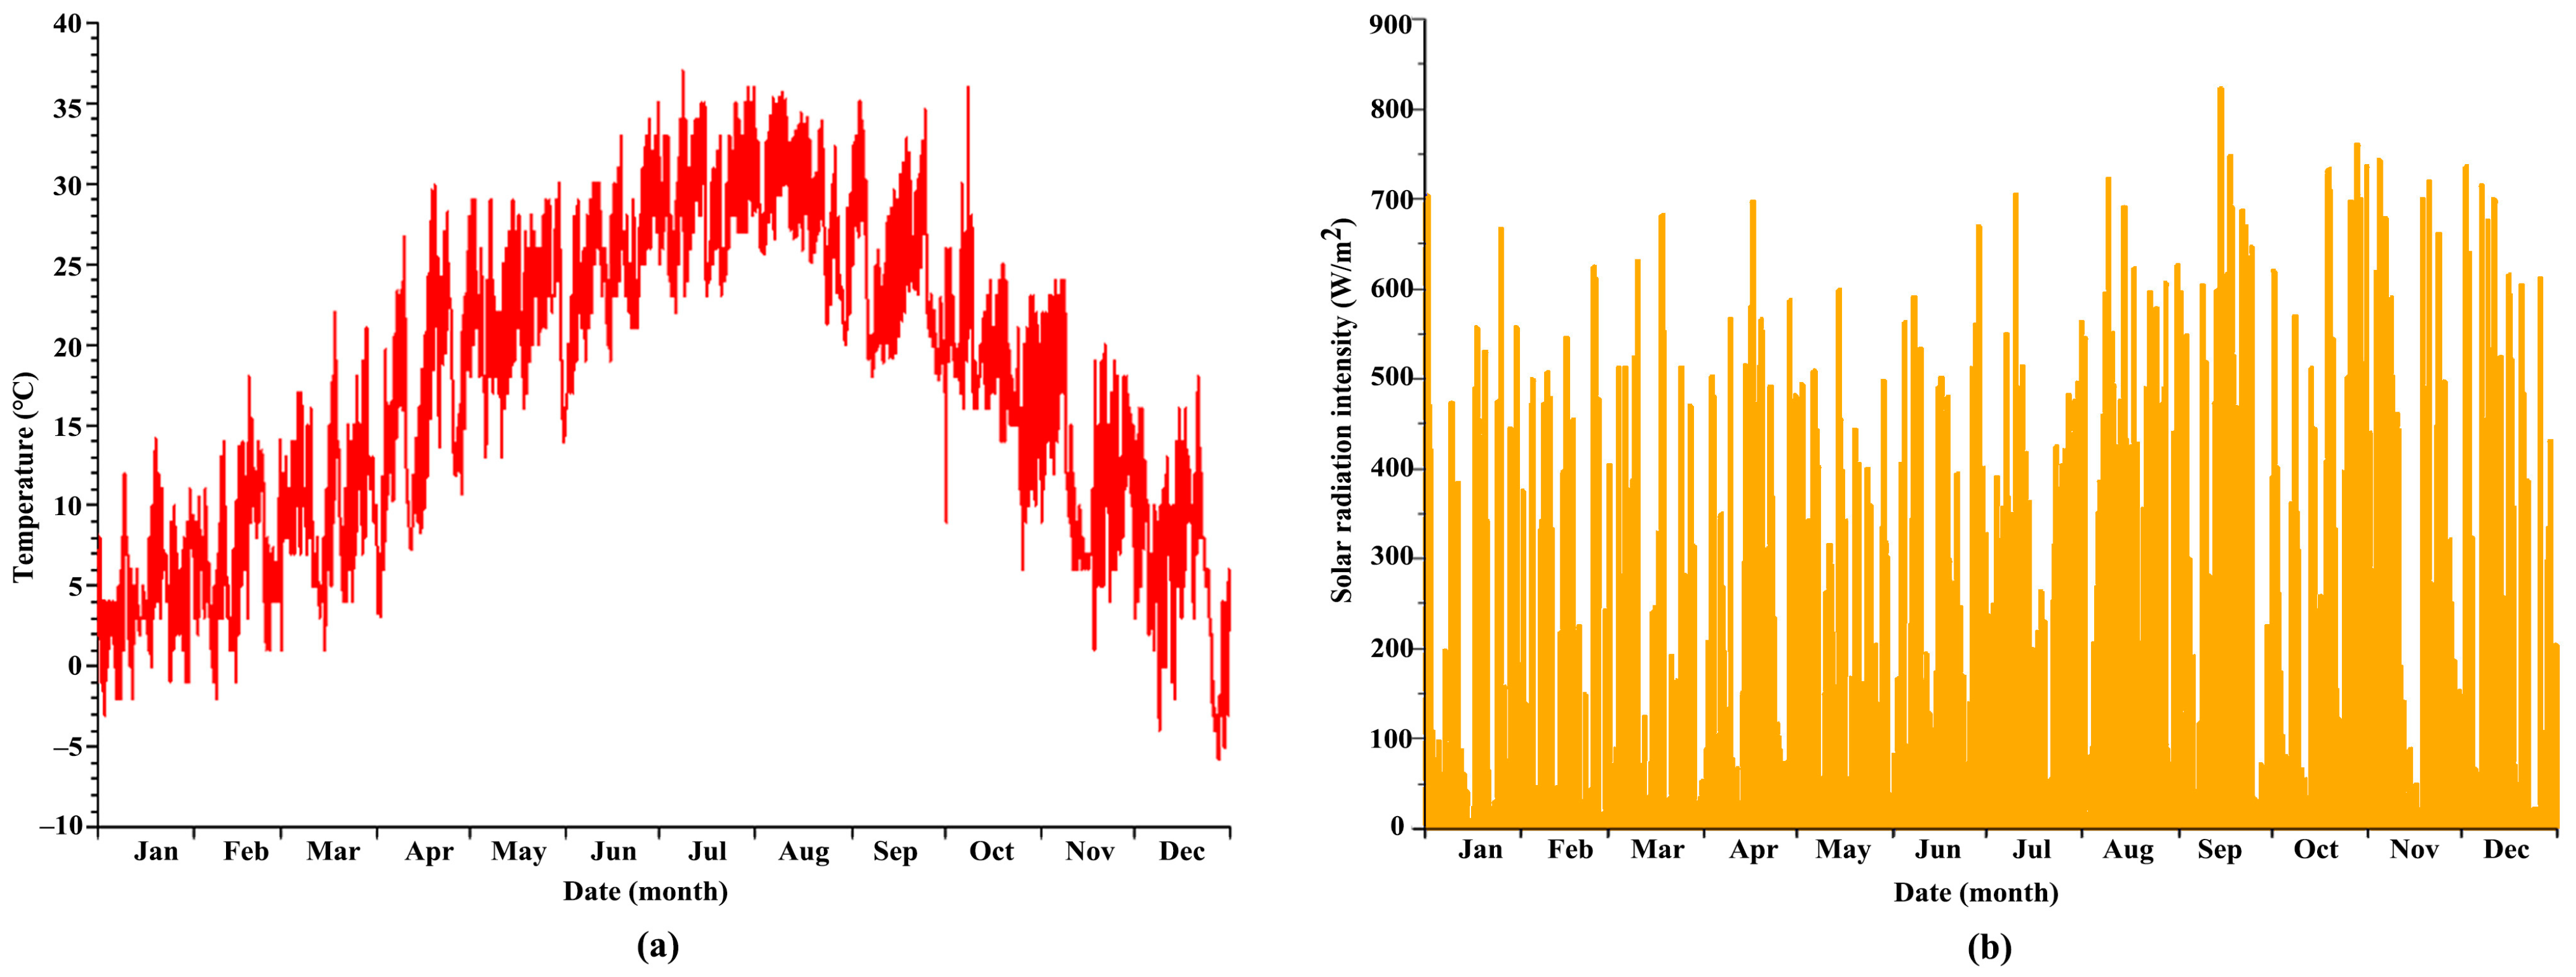
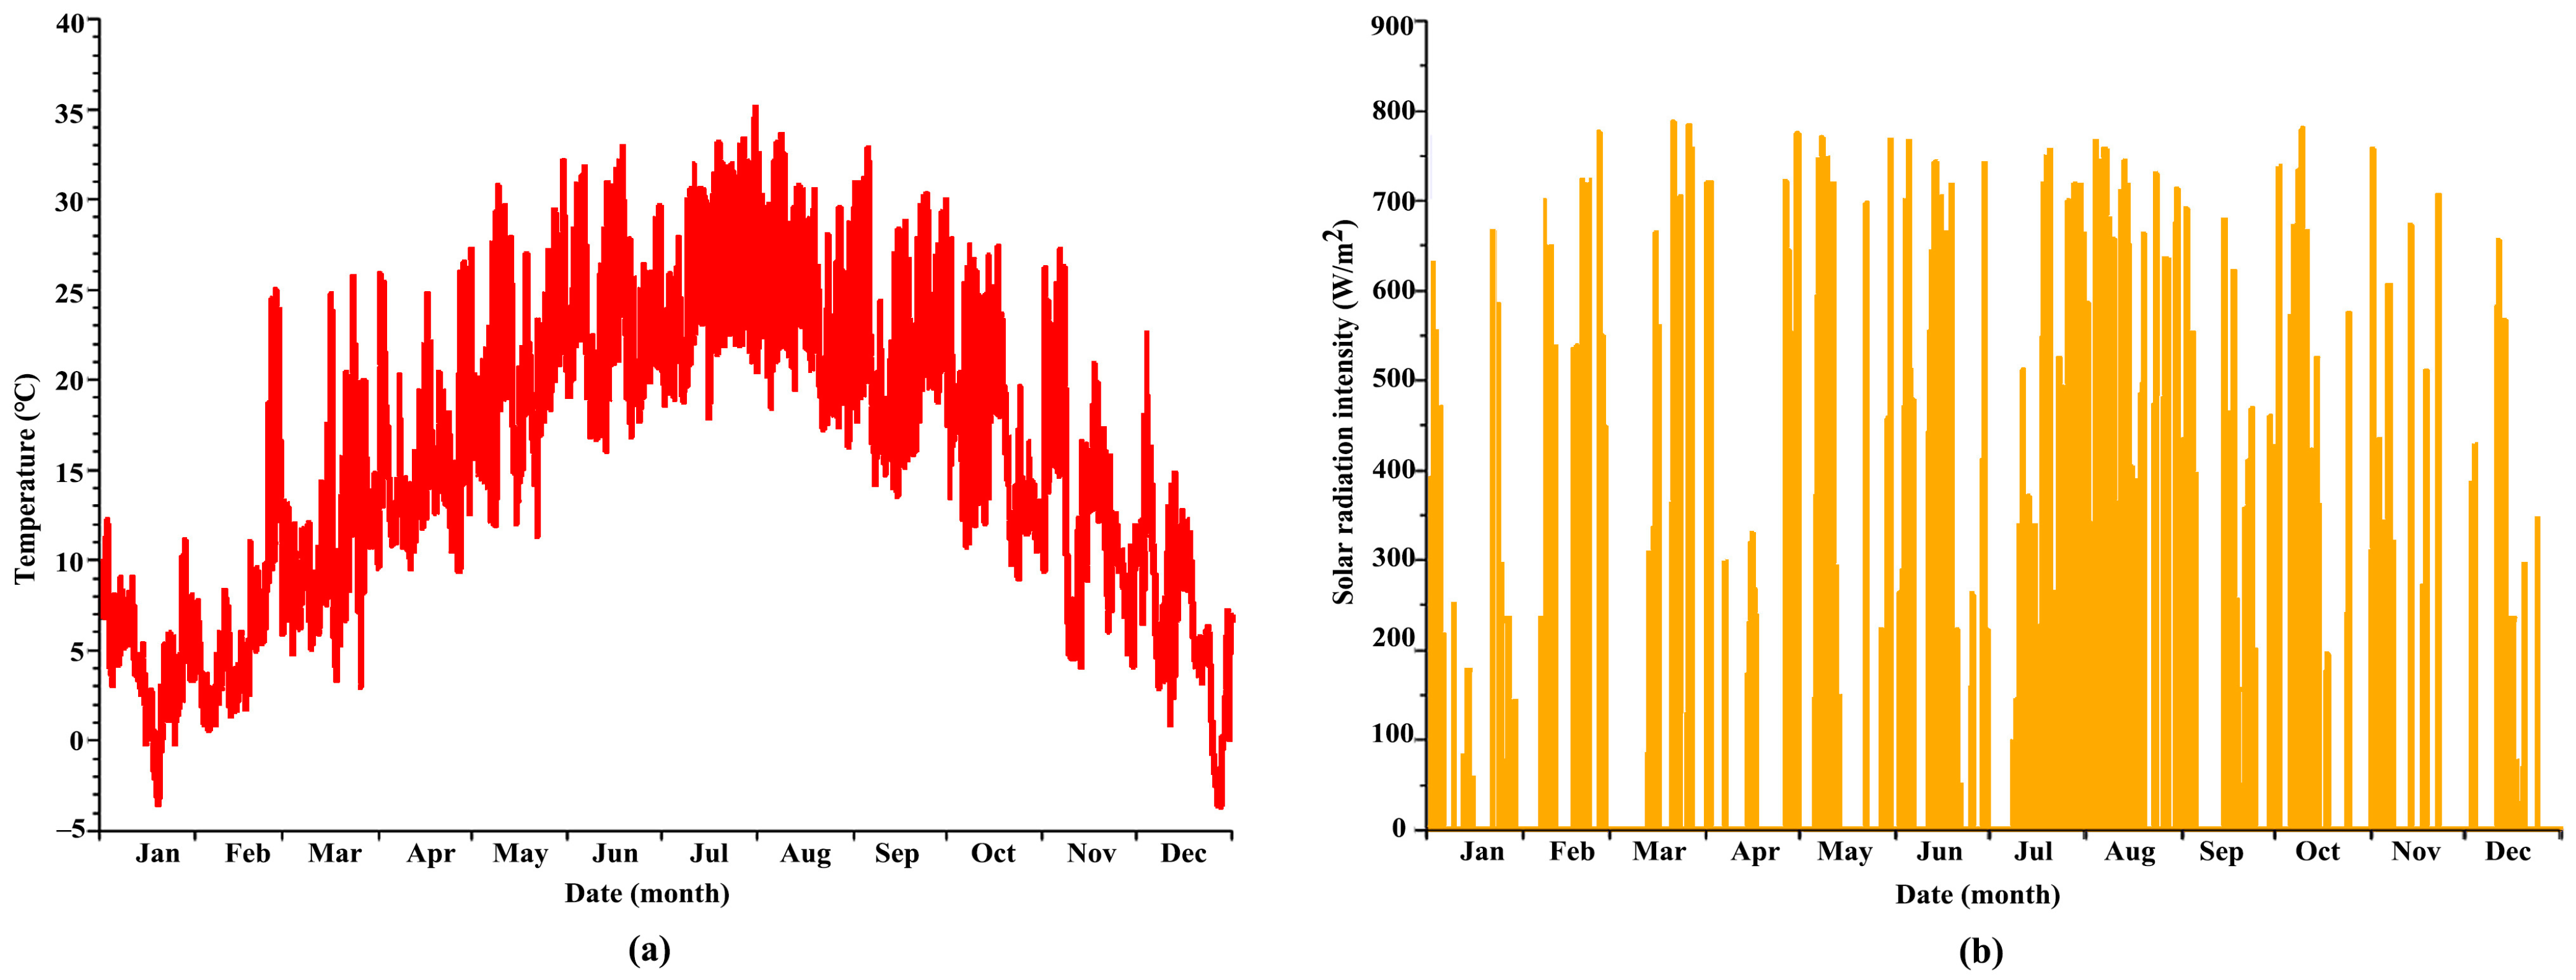
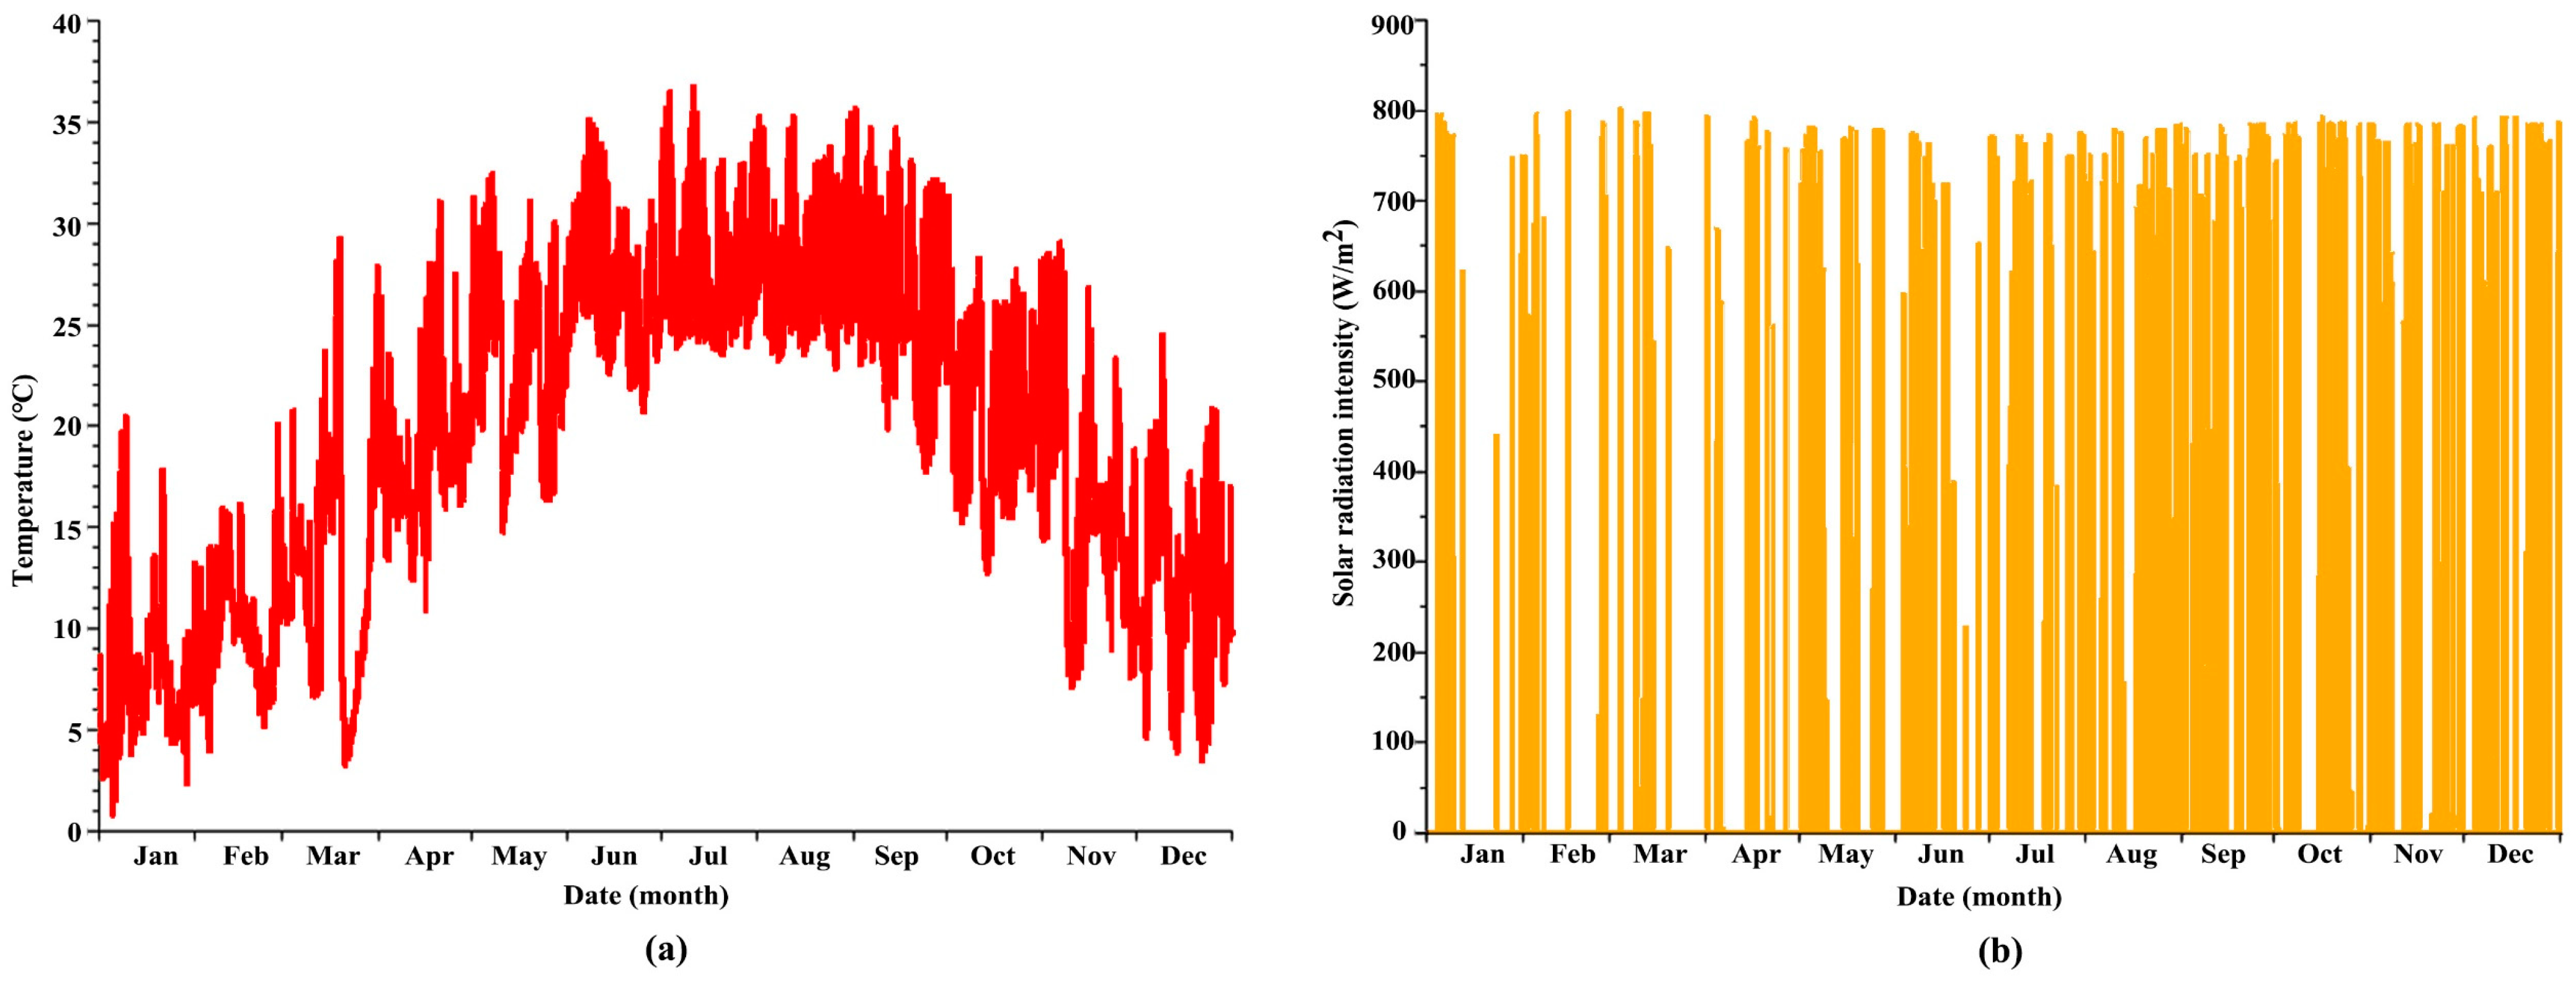
2.1. Determination of Climate Zones and Typical Cities

Climate division is the premise of building energy-saving design and has an important impact on building energy-saving design. Despite the importance of climate zoning for energy efficiency applications, there is no consensus on which climate zoning method should be applied for a particular zone [31,32]. The climate in the HSCW zone of China is complex and diverse. To better study the adaptability of nearly zero-energy office building technology systems in the HSCW zone, it is advisable to subdivide the HSCW zone into sub-climate zones. Sub-climate zoning aims to more precisely capture climatic variations within the HSCW zone, aiding in the design of building technologies and energy management strategies tailored to diverse climatic conditions. Wang et al. [21] adopted an objective clustering method guided by target building loads for the climate diversity problem in the HSCW zones of China. They established load-oriented zonal indicators with weights and proposed an estimation model to select the most appropriate hierarchical clustering criterion and obtained three climate zones: the cold transition (CT) zone, the hot summer and cold winter core (HSCWC) zone, and the hot summer and warm winter transition (HSWWT) zone, as shown in Figure 2. Xiong et al. [33] proposed a two-layer categorized climate zoning method for passive building design in their study. However, the method of zoning of Wang et al. is significantly different from that of Xiong et al. Despite the different clustering methods used, the climate zoning results of Wang et al. are generally consistent at the macro level with those of Xiong et al., which verifies the rationality of the climate zoning results. By analyzing the climatic characteristics and energy consumption patterns of the CT zone, HSCWC zone, and HSWWT zone, energy-saving technologies and solutions tailored to the specific sub-climate zones can be developed. This approach will enhance energy utilization efficiency and enable the implementation of a nearly zero-energy office building technology system for the HSCW zones, serving as the groundwork for further applicability research [34].
The CT zone, located in the west of the HSCW zone, is dominated by high mountains and plateau terrain, with an altitude of more than 500 m and a maximum altitude of 3000 m. The HSCWC zone is located in the middle east of the HSCW zone and the middle and lower reaches of the Yangtze River. The HSWWT zone is located in the southern belt hills of the HSCW zone and the basin bottom of the Sichuan Basin, with an altitude of more than 500 m. It is worth noting that the two subzones within the HSWWT zone, HSWWT-A and HSWWT-B, are categorized as the same climate zone due to their similar climatic characteristics, despite being geographically far apart and having different topography. This is because the HSWWT-B zone is located in the bottom zone of the Sichuan Basin, where there is less cold air due to topographic obstruction and cloud cover in winter, resulting in high temperatures, while in summer, its temperatures are higher than those of the surrounding basin zones due to its low elevation and occluded terrain [21]. Therefore, the HSWWT-B zone is classified as a part of the HSWWT zone, and together with the HSWWT-A zone, it belongs to the HSWWT zone.
In this study, Wuhan, Zunyi, and Guilin are selected as typical representative cities of the HSCWC, CT, and HSWWT zones, respectively, which are closest to the geometric centers of the corresponding climate zones. The hourly temperatures and solar radiation intensities of the three cities in typical meteorological annual are shown in Figure 3a,b, Figure 4a,b and Figure 5a,b.
The temperature in Wuhan usually ranges from 0 to 32 °C. The maximum temperature from June to September is high, around 30 °C, and extreme weather may be above 35 °C. The minimum temperature from December to February is above −3 °C, and extreme weather below −3 °C may occur. At the same time, Wuhan’s summer is longer than winter, and the requirement for indoor cooling is higher than the heating requirement. However, considering the daily minimum temperature and human comfort temperature, there is still a large heating demand in winter.
The temperature in Zunyi is usually between −3 and 28 °C. The maximum temperature from June to September is around 29 °C, with a maximum temperature of no more than 32 °C. The minimum temperature from December to February is above −5 °C, and extreme weather below −5 °C may occur. Heating demand is significantly greater than cooling demand.
The temperature in Guilin usually ranges from 3 to 32 °C. The maximum temperature from June to September is high, around 32 °C, and extreme weather may be above 35 °C. The minimum temperature from December to February is above 3 °C, and there is no extreme weather below 0 °C. The demand for heating is obviously greater than the demand for cooling. Cooling demand is significantly greater than refrigeration demand. Even if they belong to the HSCW zone, there are obvious differences in the climate characteristics of different cities, indicating that the cities selected in this paper are representative.

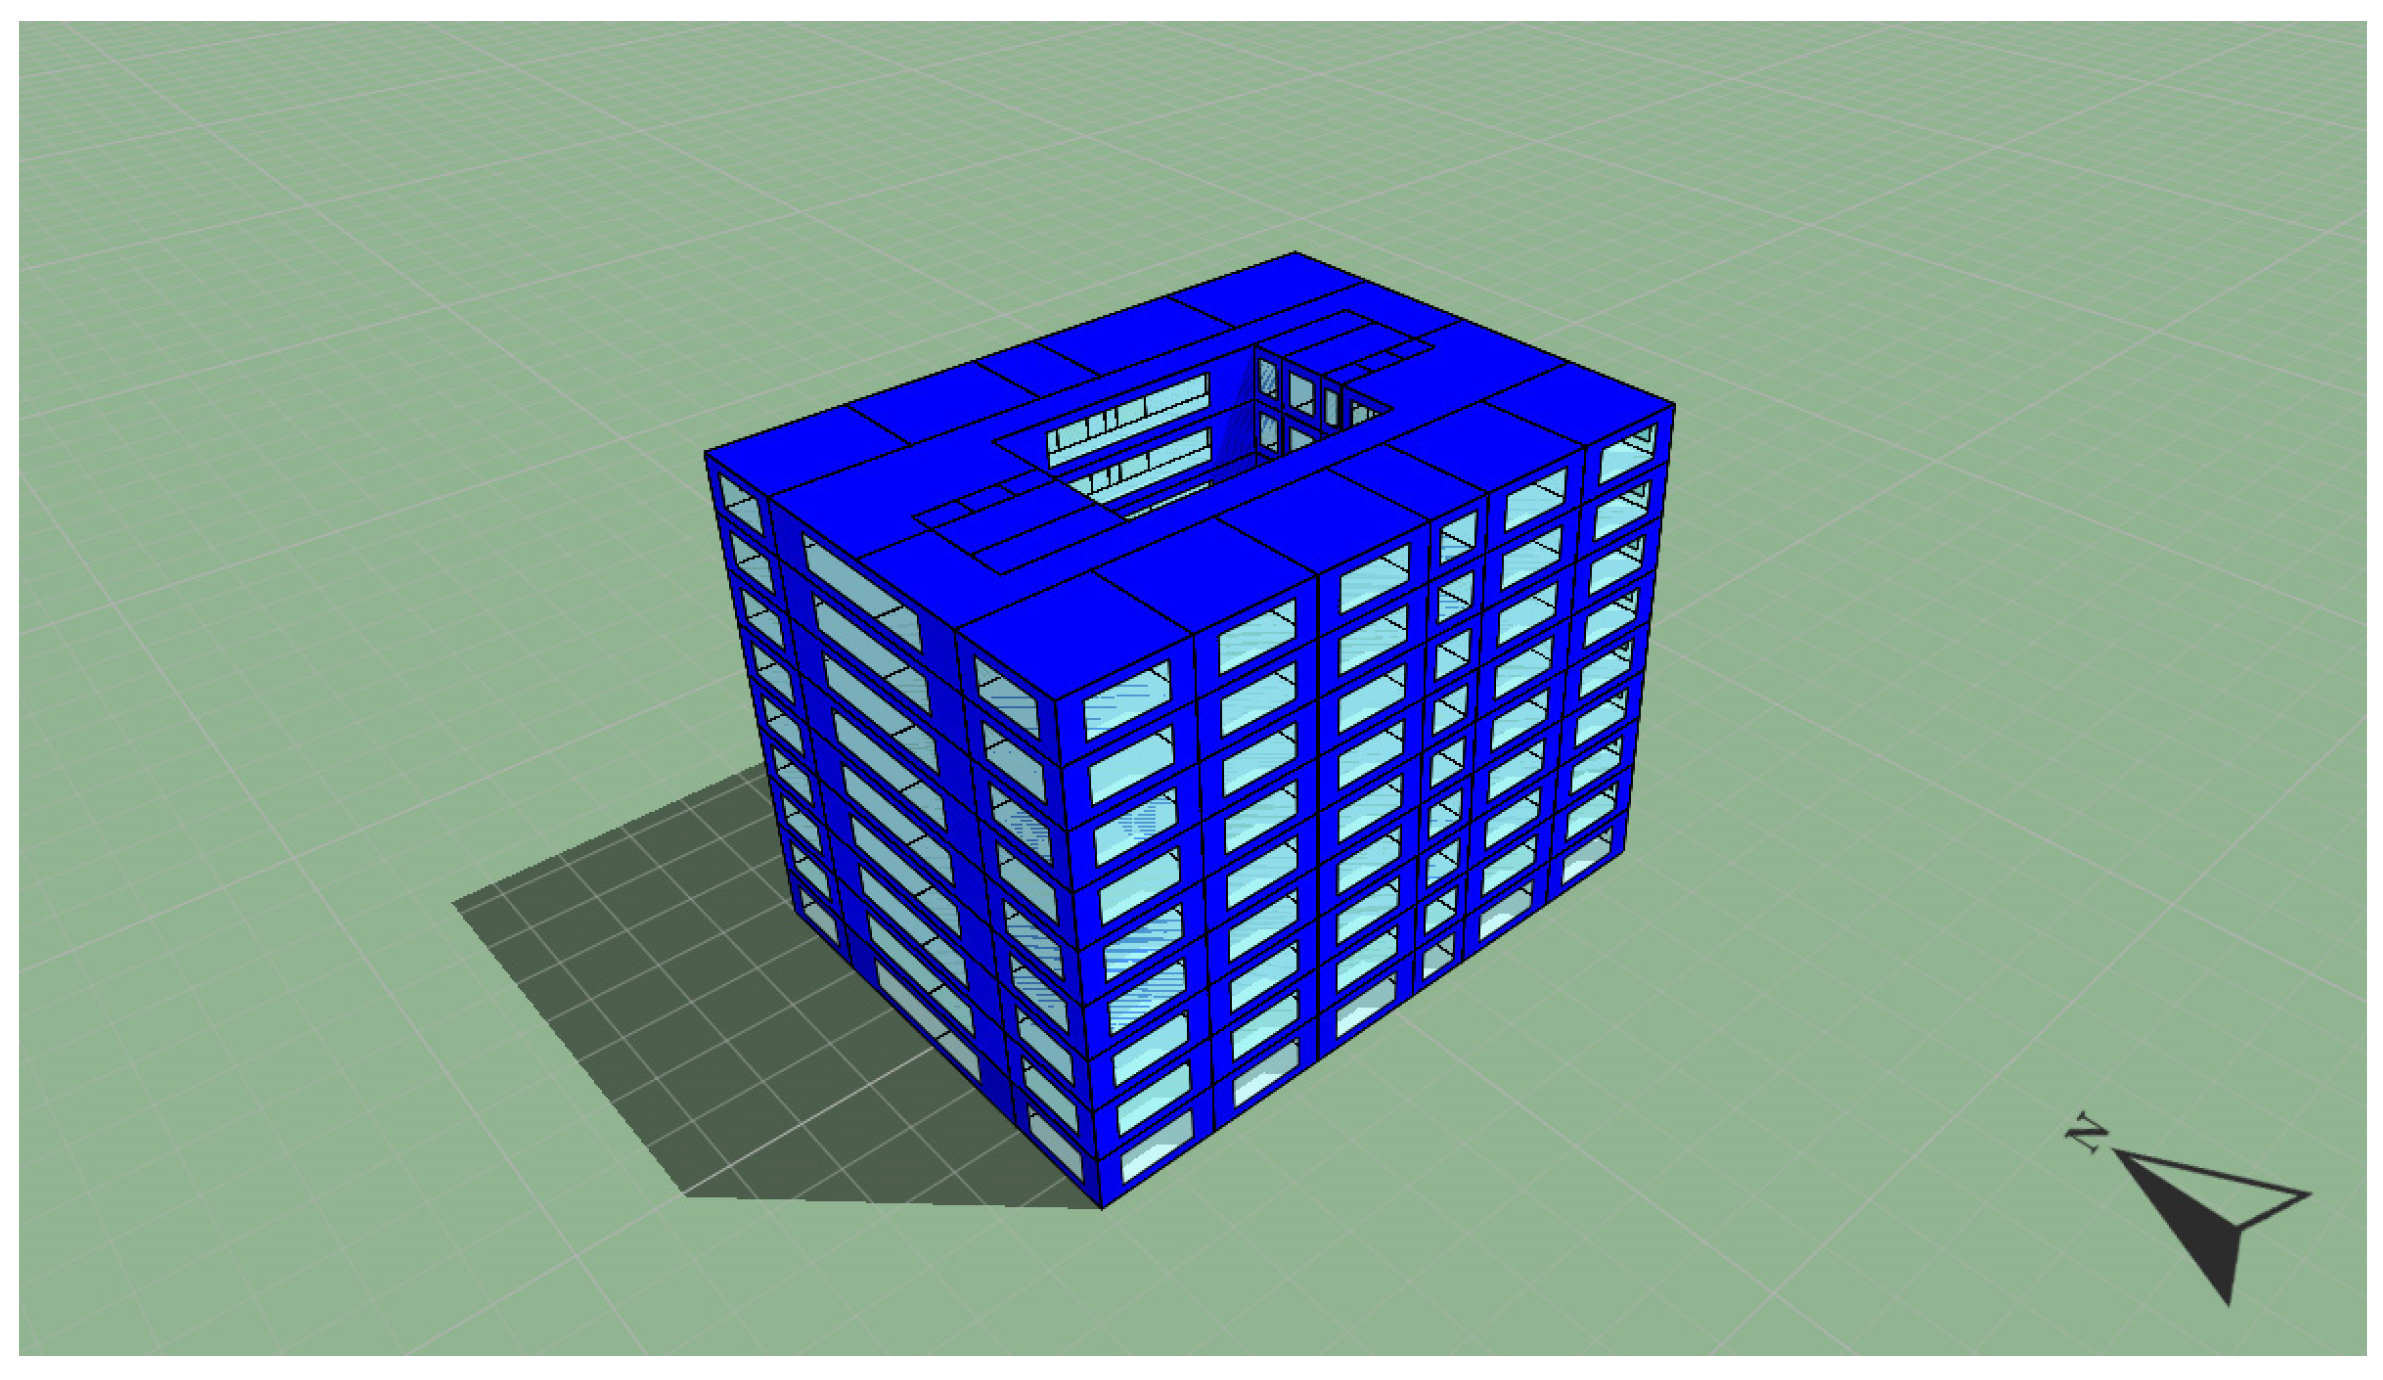
2.2. Office Building Description

The internal functions of office buildings are usually offices, intensive offices, lobby foyers, conference rooms, equipment rooms, and storage rooms. Firstly, the main energy consumption of office buildings is centered on space cooling, space heating, and lighting. A lot of cooling capacity is needed to keep the room comfortable in summer, while heating is needed to maintain the right temperature in winter. Lighting is a part of energy use in office buildings, especially in zones where light is needed in interior spaces, such as offices and conference rooms. Secondly, there are usually significant peaks in electricity use, especially during the daytime on weekdays. As the number of employees and activities change, the electricity load can also fluctuate significantly. Finally, modern office buildings are usually equipped with many electronic devices, such as computers, printers, and projectors, which also generate a corresponding demand for energy. Existing office buildings occupy about 4.5 billion square meters of the total floor zone, and less than 5% of the floor zone achieves the required energy efficiency [35].
At present, the maturity of nearly zero-energy technologies for office buildings is relatively low, and there is a lack of comprehensive and mature solutions. The integration and optimization of technologies is a complex issue, as the field involves multiple subsystems, such as building envelope, heating, ventilation, and air conditioning, which require a comprehensive consideration of the synergistic operation of multiple technologies. The nearly zero-energy consumption of office buildings requires higher energy utilization efficiency, including the integrated application of passive and active technologies. However, under the existing standards and technology systems, how to further improve the building energy utilization efficiency, especially adaptability under different climatic conditions, is still an urgent issue to be solved. Existing standards may not fully meet the requirements of near-zero-energy office buildings or lack clear guidance and requirements. There are also some differences in the definitions and standards for near-zero-energy buildings in different countries and regions, which increase the uncertainty and complexity in the design and construction of office buildings. Therefore, the optimization of nearly zero-energy technology systems for office buildings is necessary to contribute to the overall national energy efficiency goals aimed at reducing the country’s energy consumption and related negative environmental impacts.

2.3. Baseline Modeling and Energy Simulation

2.3.1. Model Establishment and Parameter Setting

The form of the baseline building model chosen for this study is the atrium type. The baseline model is based on one of the projects supported by the Central-South Architectural Design Institute. It can be found via the onsite investigation that most of the existing office buildings have the same architectural form as the baseline model, which makes our results more general and practical, and can guide most of the office buildings in the nearly zero-energy technology system. This building form can improve the ventilation and lighting of rooms and reduce the heat exchange from the external environment to the interior, thus reducing the cooling and heating loads to a certain extent, which is conducive to the improvement of energy efficiency. The case building is a 9-story building with a floor height of 4.8 m and the total building area is 13,932 m2. The baseline model adopts the air conditioning system form of fan coil + fresh air. The cooling and heating sources are electric-driven units, and the COP of the system is taken as 2.8 in summer and 1.8 in winter. According to the above characteristics of energy use in office buildings and “the Technical Standard for Nearly Zero Energy Buildings (GB/T 51350-2019)” [36], parameters are set, as shown in Table 1. The endothermic parameters for personnel, equipment, and lighting in different types of rooms are shown in Table 2.
In this research, Energy Plus’s CSWD typical meteorological year-by-hour meteorological data are selected for simulation calculations [37], and using these meteorological data for simulation calculations can more accurately reflect the climatic characteristics and energy consumption of the actual area and provide support for the reliability of this study. After determining the basic conditions of the building and the input parameters of the model, this study proposes to use the IES Virtual Environment <VE> to model (as shown in Figure 6) and perform the load simulation. IES <VE> (2019) [38] covers the functions of heat, light, and wind environment simulations, as well as the operation simulation of the HVAC system, and is equipped with a dynamic simulation computation engine that can produce reliable simulation data. Using the IES <VE> (2019) software, data on carbon emissions, energy consumption, and human comfort can be obtained, which can help designers optimize building solutions and provide strong support for the development of nearly zero-energy office building technology systems.

2.3.2. Energy Simulation Results for Baseline Buildings in Different Cities (Sub-Climate Zones)

Different climatic conditions not only determine the local demand for building cooling and heating loads but also further affect the achievement of building energy efficiency optimization goals. Therefore, Figure 7 gives the proportion of each energy consumption of buildings with the same thermal performance in Wuhan, Zunyi, and Guilin for the whole year (8760 h). The peak energy consumption of Wuhan and Guilin occurs in July, with 23.94 kWh/m2 and 25.65 kWh/m2, respectively. July is the air-conditioning season, and the refrigeration equipment starts to run. The peak of energy consumption in Zunyi occurs in January, which is about 24.17 kWh/m2. This is due to the cold winter and the increased demand for heating from the occupants. The above phenomenon shows that the energy consumption of the HVAC system accounts for a significant proportion of the total building energy consumption in each zone. In spring and fall, when the climate is mild and the HVAC system stops running, the overall building energy consumption is smaller. The demand for cooling and heating loads varies greatly between different climate zones or cities. The above data are sufficient to illustrate the importance of conducting research on the applicability of nearly zero-energy office building technology systems for different sub-climatic zones and different cooling and heating load requirements in the HSCW zone.

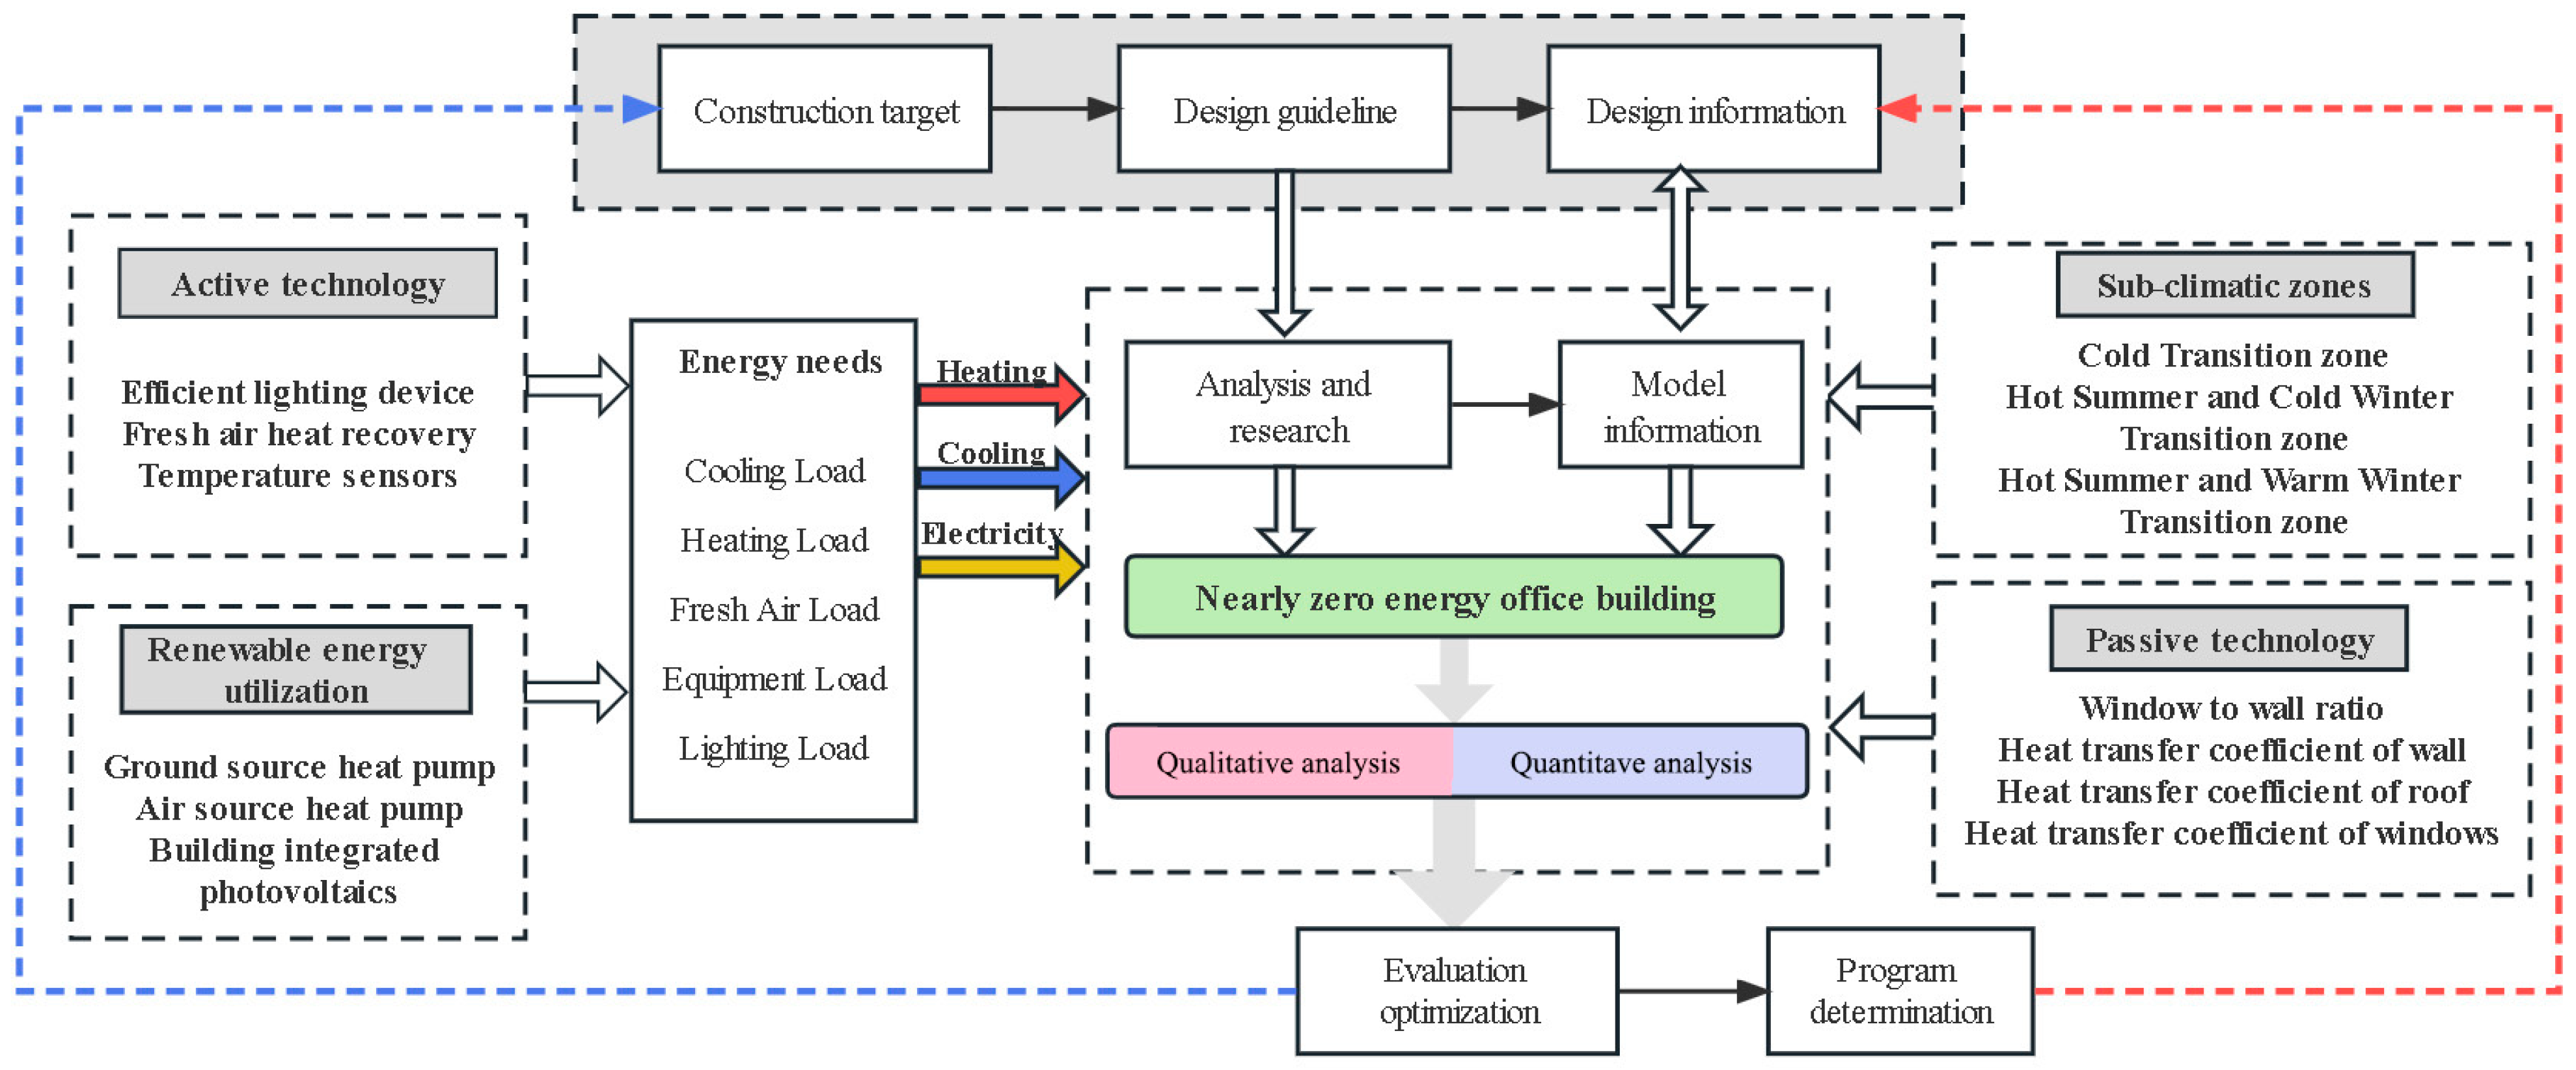
2.4. Optimization of Technical System and Energy-Saving Rate of Nearly Zero-Energy Office Buildings

2.4.1. Optimization of Technology System of Nearly Zero-Energy Office Buildings

Nearly zero-energy buildings (nZEBs), a worldwide perspective on building energy conservation and renewable energy utilization, have earned an increasing interest in the pursuit of sustainable development [39,40]. A nearly zero-energy building is a building that adapts to climatic characteristics and natural conditions, minimizes heating, cooling, and lighting needs via passive technology, maximizes the efficiency of energy equipment and systems via active technology, makes full use of renewable energy, provides a comfortable indoor environment with minimal energy consumption, and meets the standard requirements for indoor environmental parameters and energy consumption indicators [36]. The design concept and logic of nearly zero-energy buildings aim to minimize the energy demand of the building and supply the remaining energy demand using onsite renewable energy generation [41]. In the process of building planning and construction, the principle of passive design as the mainstay, supplemented with active design and combined with renewable energy design optimization, should be followed [42].
The comprehensive application of passive, active, and renewable energy utilization technologies can achieve the efficient use of building energy, reduce energy consumption, and realize the goal of net-zero-energy buildings. The development and application of these technologies are of great significance in promoting green buildings and sustainable development. The technology roadmap for nearly zero office buildings is shown in Figure 8. Commencing with the formulation of the construction target, an in-depth analysis and examination of design guidelines is undertaken. Subsequently, the architectural paradigm of a nearly zero-energy office building is meticulously fashioned, rooted in design information. Following quantitative and qualitative analyses, the enhanced building model undergoes a comprehensive evaluation to finalize project specifics. Notably, the architectural entity engenders energy demands and a diverse array of loads to cater to both occupant comfort and working requisites. Consequently, the integration of efficient active technologies and harnessing renewable energy sources becomes imperative. To curb the energy requisites of the building, a systematic exploration is undertaken into the applicability and optimization of passive technologies. This inquiry aims at enhancing the thermal performance of the building envelope, predicated on the delineation of climatic subdivisions.
By analyzing the energy consumption influencing factors of office buildings in Section 2.2, ten energy-efficient measures [43,44,45,46,47] suitable for office buildings, as shown in Table 3, were identified, categorizing them into three distinct groups to enhance comprehension of their inherent characteristics and functions. First, passive technologies, including window-to-wall ratio (WWR), external wall thermal insulation (WI), roof thermal insulation (RI), and window insulation (DI), predominantly address the building envelope and its thermal performance, achieving reduced heat transfer and losses by optimizing elements. Second, active technologies, including the heat recovery of fresh air (HR), efficient lighting (ED), and temperature sensor (TS), pertain to the building’s internal systems and equipment, achieving energy reduction. Third, renewable energy application technologies encompass ground-source heat pumps (GSHPs), air-source heat pumps (ASHPs), and building-integrated photovoltaics (BIPV), seamlessly incorporating renewable energy sources into structures to further enhance energy efficiency. The technical specification for the 10 efficient measures can be seen in Table 3. The technical parameters used in Table 3 are described as follows: K is the heat transfer coefficient, COP is the coefficient of energy efficiency, and EER is the system energy efficiency ratio. A is the area of the solar photovoltaic panels.
According to the principles of passive priority, active optimization, and the use of renewable energy, ten efficient measures were combined into five technology systems (SYSTs), as shown in Table 4. These five technology systems were applied to the model of the typical office building in the CT, HSCWC, and HSWWT zones to obtain the annual heating and cooling energy consumption, electricity energy consumption, and primary energy consumption, and the results are shown in Table 5.

2.4.2. Energy-Saving Rate and Renewable Energy Utilization Rate

Building energy consumption is a complex system whereby various influencing factors interact with each other, and even small changes can have a significant impact [48]. Due to the relatively diverse volumes and forms of office buildings, the building energy-saving rate (ESR) and renewable energy utilization rate (REP) are used as an evaluation index. For ultra-low-energy buildings, the ESR should be ≥50%; for nearly zero-energy office buildings, the ESR should be ≥60%, while the REP should be ≥10% [36]. The formulas for REP and ESR are shown in Equations (1)–(3).
R E P = E P h + E P c + E P w + E r × f + E r d × f Q h + Q c + Q w + E l × f + E e × f
E i = E E E r × f + E r d × f A
E S R = E d E b E b
where, in Equations (1)–(3), R E P is the renewable energy utilization rate, %; E P h is the utilization of renewable energy in the heating system, kWh; E P c is the utilization of renewable energy in the cooling system, kWh; E P w is the utilization of renewable energy in the domestic hot water system, kWh; f is the electric energy conversion factor, which takes the value of 2.6 according to the technology standard for nearly zero-energy buildings [36]; E r is the renewable energy power generation of the building itself, kWh/m2/a; E r d is the renewable energy generation around the building; Q h is the annual heating heat consumption, kWh; Q c is the annual cooling cold consumption, kWh; Q w is the annual domestic hot water heat consumption, kWh; E l is the annual lighting system energy consumption, kWh; and   E e is the annual elevator system energy consumption, kWh; E i is the value of energy consumption of building type i, kWh/m2/a; E E is the value of energy consumption of building without renewable energy generation, kWh/m2/a; A is the building area, m2.
E S R is the energy-saving rate of the building; E d is the value of energy consumption of the designed building; E b is the value of energy consumption of the baseline building.

3. Results and Discussion

Figure 9 demonstrates the ESR and REP for all technology systems (SYSTs). As shown in Figure 9, the same technology system has different ESR and REP values in different zones. The REPs of SYST01 and SYST02 are both 0 in different sub-climate zones because renewable energy is not adopted, while the ESRs are very low, which is far from the nZEB standard. In this paper, the adaptation of passive technology, active technology, and renewable energy applications in different sub-climate zones will be discussed, respectively.

3.1. Adaptability of Passive Technologies in Different Sub-Climatic Zones

The poor performance of building envelopes has been an important barrier to comfortable and healthy indoor environments, so the improvement of envelope performance is deemed as the first and key step of nZEB design [49]. Due to the temperature differences among various sub-climatic regions, the significance and requirements of building envelopes vary significantly [50]. Therefore, efficient thermal insulation systems should be prioritized, particularly in combination with the local climate and environment. Hence, passive technologies are mainly designed to improve the thermal performance of the envelope in this study.
In SYST 01, three passive technologies (WWR + WI + RI) were used. The energy consumption values for the heating and cooling of C-SYST01, HC-SYST01, and HW-SYST01, relative to the baseline building, were reduced by 19.52 kWh/m2/a, 26.12 kWh/m2/a, and 25.73 kWh/m2/a, respectively, and the ESRs were 13.40%, 17.88%, and 17.33%, respectively. The energy consumption for electricity was not reduced.
SYST 02 employed four passive measures (WWR + WI + RI + DI), and the energy consumption values for the heating and cooling of C-SYST02, HC-SYST02, and HW-SYST02 were reduced by 41.62 kWh/m2/a, 49.90 kWh/m2/a, and 42.90 kWh/m2/a, respectively, relative to the baseline building. With the addition of one active measure (ED), the electrical energy consumption was reduced by 14.14 kWh/m2/a. The ESRs of C-SYST02, HC-SYST02, and HW-SYST02 increased to 38.17%, 42.66%, and 39.30%, respectively. This suggested that passive technologies can significantly reduce building energy consumption, and upgrading the window insulation is the most promising passive energy-saving technology. In the development of nZEBs, research on passive measures based on climate-responsiveness has achieved many results [51,52,53,54]. However, the current building energy-efficiency design codes do not have differential design requirements for the thermal parameters of building envelopes, which may lead to substandard “actual energy efficiency rates” and increase the initial investment in the construction of energy-efficient urban buildings.
To further optimize the thermal performance of the envelope in different sub-climatic zones, this study adopted an orthogonal experimental design to analyze the influence of the thermal performance of the envelope on the building load and the energy-saving potential, and to further derive the optimal envelope design scheme for the three sub-climatic zones, laying the foundation for exploring the passive technology for nearly zero-energy office buildings.

3.1.1. Orthogonal Experiment Design

The orthogonal experimental design is a method for studying multivariate and multilevel optimization to analyze the impact of multifactorial systems on specific goals [55]. It is based on the form of a random error table with multi-factor and multi-indicator interactions and is realized via the efficient, fast, and economical arrangement of test factors. In this study, four factors were selected to analyze the thermal performance of the building envelope. Each factor contained three levels, so the orthogonal design table L9(34)) was used for the design, as shown in Table 6. The four factors were A—window-to-wall ratio (WWR), B—exterior wall heat transfer coefficient (KWALL), C—roof heat transfer coefficient (KROOF), and D—exterior window heat transfer coefficient (KWIN) [56,57,58]. Table 7 lists the level values of the relevant factors based on the Technical Standard for Nearly Zero-Energy Buildin [36]. With such an orthogonal design, only nine simulated working conditions needed to be set up to replace all eighty-one sets of the possible working conditions (3 × 3 × 3 × 3 = 81).

3.1.2. Recommended Thermal Performance Parameters for Envelopes

The nine working conditions of the orthogonal test were simulated in Zunyi, Wuhan, and Guilin using IES <VE> (2019), and the summer cooling load, winter heating load, and total annual load data were obtained for each city under different working conditions. The simulation results are detailed in Table 8a–c.
To analyze the effects of the four factors on the load at different levels, it is necessary to calculate the composite mean Kij of each factor at different levels. For example, to calculate the composite mean value of factor A at the level of 1, the following are considered:
A 1 h e a t i n g   l o a d = 9.98 + 4.63 + 0.84 = 15.45
A 1 c o o l i n g   l o a d = 56.33 + 51.76 + 50.46 = 158.46
K A 1 h e a t i n g   l o a d = A 1 h e a t i n g   l o a d / 3 = 15.45 / 3 = 5.15
K A 1 c o o l i n g   l o a d = A 1 c o o l i n g   l o a d / 3 = 158.46 / 3 = 52.82
The composite mean of the corresponding levels of the other factors was calculated separately according to this method and is detailed in Table 9a–c.
According to Table 9a, the optimal solution for Zunyi (CT zone) to minimize the heating load is A3B3C3D3, the optimal solution for cooling load is A3B3C3D3, and the optimal solution for the total load of the whole year is A3B3C3D3. This optimal solution is not found in the nine simulated conditions, which is the advantage of the orthogonal experiment and can point out the way to search for the optimal experimental conditions. The re-simulation of the optimal scenario resulted in a heating load index of 4.28 kWh/m2, a cooling load index of 38.69 kWh/m2, and a total annual load of 42.97 kWh/m2.
According to Table 9b, the minimum heating load in Wuhan (HSCWC zone) is A3B3C2D3, the minimum cooling load is A3B3C2D3, and the minimum total annual load is A3B3C2D3. The re-simulation of the optimal scheme shows that the heating load index is 3.30 kWh/m2, the cooling load index is 43.44 kWh/m2, and the total annual load is 46.74 kWh/m2.
According to Table 9c, the smallest heating load in Guilin (HSWWT zone) is A3B3C3D2, the smallest cooling load is A3B3C3D3, and the smallest total annual load is A3B2C2D3. The re-simulation of the optimal scheme shows that the heating load index is 1.09 kWh/m2, the cooling load index is 42.43 kWh/m2, and the total annual load is 43.52 kWh/m2. The parameters of the enclosure structure are shown in Table 10 below.
In addition to the thermal performance of the envelope, WWR also has a great impact on building energy consumption. A larger WWR has a better capacity for lighting and heating in winter so that it can reduce the building heat loads while increasing the summertime cooling loads. It shows a suitable WWR can lower energy consumption for cooling, heating, and lighting [59]. For the CT, HSCWC, and HSWWT zones, WWR should not be too large, or it will significantly increase summer cooling loads.

3.2. Adaptability of Active Technologies in Different Sub-Climatic Zones

The inclusion of a fresh air heat recovery system can reduce heating and cooling demands by recycling waste energy in exhausted air, thereby approaching nearly zero-energy consumption. Nearly zero-energy office buildings should give priority to heat recovery systems to meet both indoor cooling and heating requirements, with or without fewer auxiliary energy systems. The principle of temperature sensors in HVAC systems is based on the effects and properties of temperature on matter. Temperature sensors reduce heating and cooling energy consumption by sensing temperature changes in the surrounding environment and converting the temperature information into corresponding electrical or other output signals for the temperature control and regulation of the system.
As shown in Table 5, active technologies, such as ED, TS, and HR, effectively reduce building energy consumption. Analysis via C-SYST02, HC-SYST02, and HW-SYST02 reveals that the application of ED in all three sub-climate zones significantly reduces lighting energy consumption by 14.14 kWh/m2/a. Moreover, the results from C-SYST03, HC-SYST03, and HW-SYST03 indicate that the application of TS combined with HR reduces the building space heating and cooling energy consumption by 12.00 kWh/m2/a. In conclusion, active energy-saving measures are dependent on equipment performance parameters rather than climate characteristics.

3.3. Adaptability of Renewable Energy in Different Sub-Climatic Zones

Renewable energy plays a critical role in realizing nearly zero-energy buildings (nZEBs) [49] by simultaneously minimizing the use of traditional energy sources and alleviating environmental pollution problems. To achieve the target of enhancing building energy efficiency in various climatic regions, it is essential to fully consider the availability of local resources and the utilization of acceptable forms of renewable energy. Developing solar energy and geothermal energy in nZEBs, along with relatively mature associated technologies [60], holds significant potential. In China, solar energy is primarily harnessed and utilized in buildings via PV systems, solar hot water, and heating systems [61]. Geothermal energy supports building energy systems based on heat pump technologies [62].
In SYST03 and SYST04, the active and passive technologies are the same except that the renewable energy measures are different. The renewable energy sources applied in SYST03 and SYST04 are GSHP and ASHP, respectively. In Figure 9, the ESRs of C-SYST03 and C-SYST04 are 66.38% and 54.88%, respectively, and the REPs are 14.84% and 9.08%, respectively. Therefore, the energy-saving potential of using ground-source heat pumps is greater than that of air-source heat pumps in the CT zone. The ESRs of HC-SYST03 and HC-SYST04 are 64.30% and 63.12%, respectively, and the REPs are 11.54% and 10.94%, respectively, so there is not much difference in the energy-saving potential of using ground-source heat pumps and air-source heat pumps in the HSCWC zone. The ESRs of HW-SYST03 and HW-SYST04 are 55.26% and 64.48%, respectively, and the REPs are 8.72% and 13.33%, respectively, so the energy-saving potential of using air-source heat pumps is greater than that of ground-source heat pumps in the HSWWT zone.
Among CT-SYST05, HC-SYST05, and HW-SYST05, HC-SYST05 has the lowest electricity consumption of 5.43 kWh/m2/a. This indicates that the building-integrated photovoltaic (BIPV) technology in the HSCWC zone generates more power than the CT and HSWWT zones. Therefore, BIPV should be vigorously developed for the HSCWC zone. This also proves that the availability of renewable energy varies from zone to zone [63].

3.4. Determination of Technology Systems for Nearly Zero-Energy Office Buildings

As shown in Figure 9, the building saving rates of SYST01, which only adopts passive technologies, and SYST02, which adopts passive technologies and active technologies, were no more than 60%. Therefore, SYST01 and SYST02 cannot meet the standard of nearly zero-energy office buildings regardless of the sub-climatic zones. SYST03, SYST04, and SYST05, which adopt passive technology + active technology + renewable energy applications, were not able to realize nearly zero-energy office buildings in all zones. In the CT zone, only SYST03 and SYST05 could fulfill the requirement of a nearly zero-energy office building; in the HSCWC zone, SYST03, SYST04, and SYST05 could all fulfill the requirements of a nearly zero-energy office building; in the HSWWT zone, only SYST04 and SYST05 could fulfill the requirement. This also proved the significance of studying nearly zero-energy office buildings under the complex and diverse climates of the HSCW via climate sub-zones.
SYST05 met the minimum limits of nearly zero-energy office buildings in all three zones. SYST05 utilizes four passive technologies (AT + WI + RI + DI), three active technologies (HR + ED + TS), and three renewable energy systems (GSHP + ASHP + BIPV). Compared to the baseline building, the primary energy consumption values of C-SYST05, HC-SYST05, and HW-SYST05 were reduced to 30.62 kWh/m2/a, 21.11 kWh/m2/a, and 28.50 kWh/m2/a, respectively. Compared to the other technological systems, the reduction in energy consumption was the greatest in SYST05 because it incorporated all energy-saving measures. This proves that the integration of efficient and appropriate energy-saving measures can achieve nearly zero-energy office buildings or even zero-energy office buildings. However, when the economic conditions are limited, energy-efficient technologies should be selected rationally. In practical applications, the relationship between economic feasibility and energy efficiency needs to be weighed to achieve optimal energy efficiency under realistic conditions. Therefore, to promote the development of sustainable buildings, it is necessary to continue to research and develop highly efficient energy-saving technologies and to continue to explore in practice the optimal technological system for realizing nearly zero-energy office buildings under different conditions.
Passive technologies play an important role in the technology system of nearly zero-energy office buildings, and they should be designed and applied according to the local climate characteristics of different zones. In the technology system of a nearly zero-energy office building in the HSCW zone, passive technology should give priority to the following aspects:
  • For the CT zone, the appropriate heat insulation of the exterior wall and the use of high-efficiency, heat-insulating windows can reduce the heat losses considering the cold winter. The value of WWR should be taken as 0.30, the value of KWALL should be taken as 0.20 W/(m2·K), the value of KROOF should be taken as 0.15 W/(m2·K), and the value of KWIN should be taken as 1.00 W/(m2·K);
  • For the HSCWC zone, the building envelope should be designed and applied according to the local climate characteristics of different zones considering the summer sun protection and winter heat collection. The building envelope should adopt appropriate parameters. WWR takes the value of 0.30, KWALL takes the value of 0.20 W/(m2·K), KROOF takes the value of 0.25 W/(m2·K), and KWIN takes the value of 1.00 W/(m2·K);
  • For the HSWWT zone, to facilitate indoor heat dissipation in the summer night and reduce the air-conditioning load, WWR takes the value of 0.30, KWALL takes the value of 0.30 W/(m2·K), KROOF takes the value of 0.25 W/(m2·K), and KWIN takes the value of 1.00 W/(m2·K).
For active technology, the design should be optimized for the functional attributes of different buildings. In office buildings, the main personnel activities are offices and meetings, and indoor temperature, humidity, and illumination must be ensured. Therefore, lighting energy consumption, space heating, and cooling energy consumption account for a large proportion. Efficient lighting equipment was selected to reduce lighting energy consumption. Fresh air heat recovery and temperature sensors were selected to reduce heating and cooling energy consumption. Additionally, they can be used in all three sub-climate zones in the HSCW zone with good energy-saving effects.
For renewable energy applications, the decision should be based on local resources in different zones. In the HSCW zone for office buildings, the renewable energy systems that can be used are GSHP, ASHP, and BIPV. However, the HSCW is a vast zone, and according to Section 3.3, the GSHP system has a higher ESR and renewable energy utilization in the CT zone. The ASHP system has a higher ESR and REP in the HSWWT zone. There is little difference between the ESR and REP of the ground-source heat pump system and the air-source heat pump system in the HSCWC zone. The building-integrated PV has a larger ESR and REP in the HSCWC zone and smaller values in the other two zones. This is because the HSCWS zone has more solar radiation than the other two zones.

4. Conclusions

In this study, from the perspective of the complex and diverse climate of the HSCW zone, the applicability of nearly zero-energy office building technology systems in different sub-climatic zones of the HSCW zone is explored via numerical simulation and orthogonal experimental design. It is found that there are similarities and differences in the appropriate technology systems for different sub-climatic zones. This study analyzed three aspects of passive technology, active technology, and renewable energy application to obtain the energy-saving potential, the degree of impact, and the optimal level of each technology under different climatic conditions in the HSCW zone. The main conclusions are as follows:
  • Passive technologies are greatly affected by the complexity and diversity of climates. The thermal performance of the envelope in different sub-climatic zones plays an extremely important role in realizing nearly zero-energy office buildings, with windows having the greatest impact. Subsequently, based on orthogonal experiments, the optimal envelope thermal parameters and WWR for different sub-climatic zones were obtained. The results of this study found optimal performance parameters of the building envelop for different climate zones, which suggests the relevance of climate sub-division for the HSCW zone, especially in terms of the adaptability of passive technologies in different climate zones;
  • Optimizing active technology is also a way to realize nearly zero-energy consumption. In this study, according to the main energy use of office buildings in lighting, heating, and cooling, ED, HR, and TS were selected. A comparison of the technology systems in different sub-climatic zones reveals the same rate of energy savings. This suggests that the energy savings of active technologies are mainly dependent on equipment efficiency and system control;
  • Renewable energy applications are vital for achieving nearly zero-energy office buildings. In this research, GSHP, ASHP, and BIPV were selected as renewable energy technologies that could be applied in office buildings. GSHP was more applicable to the CT zone, and ASHP was more applicable to the HSWWT zone. In HSCWC zones, both GSHP and ASHP were suitable. In addition, BIPV significantly reduced electrical energy consumption. In the HSCWC zone, by integrating ED and BIPV, the electricity consumption was only 5.43 kWh/m2/a. Most renewable energy technologies can be rationally utilized based on the local resource conditions to achieve nearly zero-energy office buildings.
Through this study, it can be concluded that the joint application of key technologies is an important strategy for realizing nearly zero-energy office buildings. Specifically, the passive priority, active optimization, and application of renewable energy are the basic lines for nearly zero-energy office buildings. However, this is not a simple superimposition of energy-saving technologies, but an integrated and optimized design that fully takes into account the building type, climatic conditions, and resource conditions. In addition, it is not recommended to implement a unified system of technical and energy consumption indicators in nearly zero-energy office buildings, as attention should be paid to the impact of complex and diverse climatic conditions on energy-saving technologies, and the impact of changes in meteorological parameters, especially temperature, relative humidity, and solar radiation, should be considered at the design stage. In future studies, the full life cycle should be used to assess the energy efficiency of renewable energy technologies.

Author Contributions

Conceptualization, X.J. and H.Z.; methodology, X.J. and H.Z.; software, X.J.; validation, X.J., H.Z., Z.K. and J.Y.; formal analysis, X.J., H.Z. and Z.K.; data curation, X.J., Z.K. and J.Y.; writing—original draft preparation, X.J. and S.J.; writing—review and editing, X.J.; visualization, X.J. and X.H.; supervision, H.Z., X.Y. and L.Y.; project administration, H.Z.; funding acquisition, H.Z. All authors have read and agreed to the published version of the manuscript.

Funding

This work was supported by the Humanities and Social Science Research Project of the Ministry of Education of China grant number 22YJAZH146; it was also supported by the Local Cooperative Project of China Scholarship Council grant number 202008420322.

Institutional Review Board Statement

Not applicable.

Informed Consent Statement

Not applicable.

Data Availability Statement

Not applicable.

Acknowledgments

We are grateful to the Central-South Architectural Design Institute Co., Ltd. (CSADI) in providing the research project for this study, which was also supported by the research project of “Ultra-low energy consumption public building design and renovation in Hubei province of China”.

Conflicts of Interest

The authors declare no conflict of interest.

References

  1. Ürge-Vorsatz, D.; Novikova, A. Potentials and costs of carbon dioxide mitigation in the world’s buildings. Energy Policy 2008, 36, 642–661. [Google Scholar] [CrossRef]
  2. Roaf, S.; Brotas, L.; Nicol, F. Counting the costs of comfort. Build. Res. Inf. 2015, 43, 269–273. [Google Scholar] [CrossRef]
  3. China Daily. Full Text of President Xi’s Speech at Opening Ceremony of Paris Climate Summit. Available online: http://africa.chinadaily.com.cn/2015-12/01/content_22592476.htm (accessed on 22 July 2015).
  4. Ministry of Housing and Urban-Rural Development. Notice of the Ministry of Housing and Urban-Rural Development on the Issuance of the 14th Five-Year Plan for Building Energy Conservation and Green Building Development. Available online: https://www.gov.cn/zhengce/zhengceku/2022-03/12/content_5678698.htm (accessed on 26 July 2022).
  5. Zhou, N.; Khanna, N.; Feng, W.; Ke, J.; Levine, M. Scenarios of energy efficiency and CO2 emissions reduction potential in the buildings sector in China to year 2050. Nat. Energy 2018, 3, 978–984. [Google Scholar] [CrossRef]
  6. Enshen, L.; Yong, W. Are the relative variation rates (RVRs) approximate in different cities when the same energy-efficiency reform is taken to the same building? Build. Environ. 2005, 40, 453–464. [Google Scholar] [CrossRef]
  7. Ma, H.T.; Du, N.; Yu, S.J.; Lu, W.Q.; Zhang, Z.Y.; Deng, N.; Li, C. Analysis of typical public building energy consumption in northern China. Energy Build. 2017, 136, 139–150. [Google Scholar] [CrossRef]
  8. Jiang, P. Analysis of national and local energy-efficiency design standards in the public building sector in China. Energy Sustain. Dev. 2011, 15, 443–450. [Google Scholar] [CrossRef]
  9. Safa, M.; Safa, M.; Allen, J.; Shahi, A.; Haas, C.T. Improving sustainable office building operation by using historical data and linear models to predict energy usage. Sustain. Cities Soc. 2017, 29, 107–117. [Google Scholar] [CrossRef]
  10. Maharjan, S.; Trivedi, A.; Srinivasan, D. Rules-integrated model predictive control of office space for optimal electricity prosumption. Sustain. Energy Grids Netw. 2023, 33, 100981. [Google Scholar] [CrossRef]
  11. Li, D.H.; Yang, L.; Lam, J.C. Impact of climate change on energy use in the built environment in different climate zones—A review. Energy 2012, 42, 103–112. [Google Scholar] [CrossRef]
  12. Xu, L.; Liu, J.; Pei, J.; Han, X. Building energy saving potential in Hot Summer and Cold Winter (HSCW) Zone, China—Influence of building energy efficiency standards and implications. Energy Policy 2013, 57, 253–262. [Google Scholar] [CrossRef]
  13. Goenaga-Perez, A.; Alvarez-Sanz, M.; Teres-Zubiaga, J.; Campos-Celador, A. Cost-effectiveness and minimum requirements of nZEB for residential buildings under the new Spanish Technical Building Code. Energy Build. 2023, 287, 112986. [Google Scholar] [CrossRef]
  14. Harkouss, F.; Fardoun, F.; Biwole, P.H. Optimization approaches and climates investigations in NZEB—A review. Build. Simul. 2018, 11, 923–952. [Google Scholar] [CrossRef]
  15. Martinopoulos, G.; Tsalikis, G. Active solar heating systems for energy efficient buildings in Greece: A technical economic and environmental evaluation. Energy Build. 2014, 68, 130–137. [Google Scholar] [CrossRef]
  16. Li, H.; Wang, S.; Cheung, H. Sensitivity analysis of design parameters and optimal design for zero/low energy buildings in subtropical regions. Appl. Energy 2018, 228, 1280–1291. [Google Scholar] [CrossRef]
  17. Laetitia, M.; Song, J.Y.; Alan, S.C.; Chen, S.Q.; Wu, J.D.; Wei, Y.; Jie, X.; Zhang, Q.L.; Jian, G.; Meng, L.; et al. The hot summer-cold winter region in China: Challenges in the low carbon adaptation of residential slab buildings to enhance comfort. Energy Build. 2020, 223, 110181. [Google Scholar] [CrossRef]
  18. D’Agostino, D.; Parker, D.; Epifani, I.; Crawley, D.; Lawrie, L. How will future climate impact the design and performance of nearly zero energy buildings (NZEBs)? Energy 2022, 240, 122479. [Google Scholar] [CrossRef]
  19. Deshko, V.; Buyak, N.; Bilous, I.; Voloshchuk, V. Reference state and exergy based dynamics analysis of energy performance of the “heat source-human-building envelope” system. Energy 2020, 200, 117534. [Google Scholar] [CrossRef]
  20. Zuo, W.; Jiaqiang, E.; Liu, X.; Peng, Q.; Deng, Y.; Zhu, H. Orthogonal experimental design and fuzzy grey relational analysis for emitter efficiency of the micro-cylindrical combustor with a step. Appl. Therm. Eng. 2016, 103, 945–951. [Google Scholar] [CrossRef]
  21. Wang, Z.; Chen, Y.; Zhou, M.; Wu, J.; Zhang, M. A clustering method with target supervision for the thermal climate division of residential buildings in the Hot Summer and Cold Winter Area of China. J. Build. Eng. 2021, 43, 103156. [Google Scholar] [CrossRef]
  22. Zhu, L.; Hurt, R.; Correia, D.; Boehm, R. Detailed energy saving performance analyses on thermal mass walls demonstrated in a zero energy house. Energy Build. 2009, 41, 303–310. [Google Scholar] [CrossRef]
  23. Osanyintola, O.F.; Simonson, C.J. Moisture buffering capacity of hygroscopic building materials: Experimental facilities and energy impact. Energy Build. 2006, 38, 1270–1282. [Google Scholar] [CrossRef]
  24. Visa, I.; Moldovan, M.D.; Comsit, M.; Duta, A. Improving the renewable energy mix in a building toward the nearly zero energy status. Energy Build. 2014, 68, 72–78. [Google Scholar] [CrossRef]
  25. Marszal, A.J.; Heiselberg, P.; Jensen, R.L.; Nørgaard, J. On-site or off-site renewable energy supply options? Life cycle cost analysis of a Net Zero Energy Building in Denmark. Renew. Energy 2012, 44, 154–165. [Google Scholar] [CrossRef]
  26. Huang, K.-T.; Li, Y.-J. Impact of street canyon typology on building’s peak cooling energy demand: A parametric analysis using orthogonal experiment. Energy Build. 2017, 154, 448–464. [Google Scholar] [CrossRef]
  27. Zhao, B.; Qi, L.; Yang, T. Simulation and analysis of the energy consumption for public buildings in different climate regions of China. Procedia Eng. 2017, 205, 2940–2947. [Google Scholar] [CrossRef]
  28. Wu, X.; Li, X.; Qin, Y.; Xu, W.; Liu, Y. Intelligent multiobjective optimization design for NZEBs in China: Four climatic regions. Appl. Energy 2023, 339, 120934. [Google Scholar] [CrossRef]
  29. Yang, J.; Yuan, H.; Yang, J.; Zhu, R. Study on the Influencing Factors of Energy Consumption of Nearly Zero Energy Residential Buildings in Cold and Arid Regions of Northwest China. Sustainability 2022, 14, 15721. [Google Scholar] [CrossRef]
  30. Ke, Z.; Liu, X.; Zhang, H.; Jia, X.; Zeng, W.; Yan, J.; Hu, H.; Hien, W.N. Energy Consumption and Carbon Emissions of Nearly Zero-Energy Buildings in Hot Summer and Cold Winter Zones of China. Sustainability 2023, 15, 11453. [Google Scholar] [CrossRef]
  31. Walsh, A.; Cóstola, D.; Labaki, L.C. Review of methods for climatic zoning for building energy efficiency programs. Build. Environ. 2017, 112, 337–350. [Google Scholar] [CrossRef]
  32. Walsh, A.; Cóstola, D.; Labaki, L.C. Comparison of three climatic zoning methodologies for building energy efficiency applications. Energy Build. 2017, 146, 111–121. [Google Scholar] [CrossRef]
  33. Xiong, J.; Yao, R.; Li, B.; Wang, H.; Cao, X.; Xu, Q.; Pan, Y. Subdivision of Hot Summer and Cold Winter Zone for Building Thermal Performance. HVAC 2019, 49, 12–18. [Google Scholar]
  34. Xiong, J.; Yao, R.; Grimmond, S.; Zhang, Q.; Li, B. A hierarchical climatic zoning method for energy efficient building design applied in the region with diverse climate characteristics. Energy Build. 2019, 186, 355–367. [Google Scholar] [CrossRef]
  35. Wan, S.Y.; Ding, G.C.; Runeson, G.; Liu, Y.S. Sustainable Buildings’ Energy-Efficient Retrofitting: A Study of Large Office Buildings in Beijing. Sustainability 2022, 14, 1021. [Google Scholar] [CrossRef]
  36. GB/T51350-2019; The People’s Republic of China National Standard. Technical Standard for Nearly Zero Energy Buildings. China Building Industry Press: Beijing, China, 2019.
  37. Kim, D.-W.; Park, C.-S. Difficulties and limitations in performance simulation of a double skin façade with EnergyPlus. Energy Build. 2011, 43, 3635–3645. [Google Scholar] [CrossRef]
  38. Aldossary, N.A.; Rezgui, Y.; Kwan, A. Domestic energy consumption patterns in a hot and humid climate: A multiple-case study analysis. Appl. Energy 2014, 114, 353–365. [Google Scholar] [CrossRef]
  39. Razzaq, I.; Amjad, M.; Qamar, A.; Asim, M.; Ishfaq, K.; Razzaq, A.; Mawra, K. Reduction in energy consumption and CO2 emissions by retrofitting an existing building to a net zero energy building for the implementation of SDGs 7 and 13. Front. Environ. Sci. 2023, 10, 1028793. [Google Scholar] [CrossRef]
  40. Ding, Z.; Liu, S.; Luo, L.; Liao, L. A building information modeling-based carbon emission measurement system for prefabricated residential buildings during the materialization phase. J. Clean. Prod. 2020, 264, 121728. [Google Scholar] [CrossRef]
  41. Favoino, F.; Overend, M.; Jin, Q. The optimal thermo-optical properties and energy saving potential of adaptive glazing technologies. Appl. Energy 2015, 156, 1–15. [Google Scholar] [CrossRef]
  42. Climate Action. The UN’s 2030 Agenda. Available online: https:/u.ae/en/about-the-uae/leaving-no-one-behind/13climateaction (accessed on 23 July 2011).
  43. Huang, S.; Zhao, X.; Wang, L.; Bu, X.; Li, H. Low-cost optimization of geothermal heating system with thermal energy storage for an office building. Therm. Sci. Eng. Prog. 2023, 42, 101918. [Google Scholar] [CrossRef]
  44. Buso, T.; Becchio, C.; Corgnati, S.P. NZEB, cost-and comfort-optimal retrofit solutions for an Italian Reference Hotel. Energy Procedia 2017, 140, 217–230. [Google Scholar] [CrossRef]
  45. Liu, L.; Moshfegh, B.; Akander, J.; Cehlin, M. Comprehensive investigation on energy retrofits in eleven multi-family buildings in Sweden. Energy Build. 2014, 84, 704–715. [Google Scholar] [CrossRef]
  46. Gago, E.; Muneer, T.; Knez, M.; Köster, H. Natural light controls and guides in buildings. Energy saving for electrical lighting, reduction of cooling load. Renew. Sustain. Energy Rev. 2015, 41, 1–13. [Google Scholar] [CrossRef]
  47. Ihm, P.; Nemri, A.; Krarti, M. Estimation of lighting energy savings from daylighting. Build. Environ. 2009, 44, 509–514. [Google Scholar] [CrossRef]
  48. Lee, D.; Cheng, C.-C. Energy savings by energy management systems: A review. Renew. Sustain. Energy Rev. 2016, 56, 760–777. [Google Scholar] [CrossRef]
  49. Yang, L.; Lam, J.C.; Tsang, C.L. Energy performance of building envelopes in different climate zones in China. Appl. Energy 2008, 85, 800–817. [Google Scholar] [CrossRef]
  50. Ouedraogo, B.; Levermore, G.; Parkinson, J. Future energy demand for public buildings in the context of climate change for Burkina Faso. Build. Environ. 2012, 49, 270–282. [Google Scholar] [CrossRef]
  51. Abdou, N.; El Mghouchi, Y.; Hamdaoui, S.; El Asri, N.; Mouqallid, M. Multi-objective optimization of passive energy efficiency measures for net-zero energy building in Morocco. Build. Environ. 2021, 204, 108141. [Google Scholar] [CrossRef]
  52. Fereidani, N.A.; Rodrigues, E.; Gaspar, A.R. A review of the energy implications of passive building design and active measures under climate change in the Middle East. J. Clean. Prod. 2021, 305, 127152. [Google Scholar] [CrossRef]
  53. Wang, Z.; Zhao, J. Optimization of passive envelop energy efficient measures for office buildings in different climate regions of China based on modified sensitivity analysis. Sustainability 2018, 10, 907. [Google Scholar] [CrossRef]
  54. Pajek, L.; Košir, M. Strategy for achieving long-term energy efficiency of European single-family buildings through passive climate adaptation. Appl. Energy 2021, 297, 117116. [Google Scholar] [CrossRef]
  55. Shao, T.; Zheng, W.X.; Jin, H. Analysis of the Indoor Thermal Environment and Passive Energy-Saving Optimization Design of Rural Dwellings in Zhalantun, Inner Mongolia, China. Sustainability 2020, 12, 1103. [Google Scholar] [CrossRef]
  56. Pan, L.; Xu, Q.; Nie, Y.; Qiu, T. Analysis of climate adaptive energy-saving technology approaches to residential building envelope in Shanghai. J. Build. Eng. 2018, 19, 266–272. [Google Scholar] [CrossRef]
  57. Aburas, M.; Soebarto, V.; Williamson, T.; Liang, R.; Ebendorff-Heidepriem, H.; Wu, Y. Thermochromic smart window technologies for building application: A review. Appl. Energy 2019, 255, 113522. [Google Scholar] [CrossRef]
  58. Capeluto, I.G.; Ochoa, C.E. Simulation-based method to determine climatic energy strategies of an adaptable building retrofit façade system. Energy 2014, 76, 375–384. [Google Scholar] [CrossRef]
  59. Marino, C.; Nucara, A.; Pietrafesa, M. Does window-to-wall ratio have a significant effect on the energy consumption of buildings? A parametric analysis in Italian climate conditions. J. Build. Eng. 2017, 13, 169–183. [Google Scholar] [CrossRef]
  60. Li, D.; He, J.; Li, L. A review of renewable energy applications in buildings in the hot-summer and warm-winter region of China. Renew. Sustain. Energy Rev. 2016, 57, 327–336. [Google Scholar] [CrossRef]
  61. Privitera, G.; Day, A.R.; Dhesi, G.; Long, D. Optimising the installation costs of renewable energy technologies in buildings: A linear programming approach. Energy Build. 2011, 43, 838–843. [Google Scholar] [CrossRef]
  62. Zhai, X.; Qu, M.; Yu, X.; Yang, Y.; Wang, R. A review for the applications and integrated approaches of ground-coupled heat pump systems. Renew. Sustain. Energy Rev. 2011, 15, 3133–3140. [Google Scholar] [CrossRef]
  63. Liu, Z.; Liu, Y.; He, B.-J.; Xu, W.; Jin, G.; Zhang, X. Application and suitability analysis of the key technologies in nearly zero energy buildings in China. Renew. Sustain. Energy Rev. 2019, 101, 329–345. [Google Scholar] [CrossRef]
Figure 1. Pathway of future energy efficiency and zero-energy buildings development in China.
Sustainability 15 13061 g001
Figure 2. Results of the climate subdivision of the hot summer and cold winter zone.
Sustainability 15 13061 g002
Figure 3. Wuhan climate conditions: (a) Annual hourly temperature; (b) Solar radiation intensity.
Sustainability 15 13061 g003
Figure 4. Zunyi climate conditions: (a) Annual hourly temperature; (b) Solar radiation intensity.
Sustainability 15 13061 g004
Figure 5. Guilin climate conditions: (a) Annual hourly temperature; (b) Solar radiation intensity.
Sustainability 15 13061 g005
Figure 6. The simulation model of the typical office building in IES <VE> (2019).
Sustainability 15 13061 g006
Figure 7. Monthly final energy consumption profile in Wuhan, Zunyi, and Guilin.
Sustainability 15 13061 g007
Figure 8. Technology roadmap for a nearly zero-energy office building in the HSCW zone of China.
Sustainability 15 13061 g008
Figure 9. Energy-saving rate and renewable energy utilization rate for all technology systems.
Sustainability 15 13061 g009
Table 1. Design and operation parameter description of the typical office building.
Parameter CategoryParticular Description
EnvelopWWR0.4
KWALL0.40 W/(m2·K)
KROOF0.35 W/(m2·K)
KWIN2.2 W/(m2·K)
District heatingWinter: on (temperature maintained constant at 20 °C)1 December to 28 February
Winter: off1 March to 30 November
District coolingSummer: on (temperature maintained constant at 26 °C)1 June to 30 September
Summer: off1 October to 31 May
VentilationMechanical ventilation1.00 ACH
Infiltration0.60 ACH
LightingMaximum power consumption9.00 W/m2
Luminous energy conversion efficiency25% of electricity can be converted into luminous
Schedule8:00 a.m.–18:00 p.m.
Table 2. Endothermic settings for personnel, equipment, and lighting in different types of rooms.
Room TypeFloor Space per Capita (m2)Room Occupancy Rate (%)Equipment Power Density (W/m2)Equipment Utilization Rate (%)Lighting Power Density (W/m2)Lighting on Hours (h/month)
Office10.032.713.032.79.0240.0
Intensive office4.032.720.032.715.0240.0
Meeting rooms3.316.75.061.89.0180.0
Lobby foyer20.033.30.00.05.0270.0
Lounge3.316.70.00.05.0150.0
Equipment room0.00.00.00.05.00.0
Table 3. Technical specifications for selected efficient measures.
Technology Efficient MeasuresNomenclatureTechnical Specification
Passive technologiesWindow-to-wall ratioWWR0.4
Wall insulationWIK = 0.35 W/m2·K
Roof insulationRIK = 0.30 W/m2·K
Window insulationDIK = 1.5 W/m2·K
Active technologiesFresh air heat recovery systemHREffectiveness: 75%
Efficient lighting deviceEDLED lighting with 40% electricity consumption reduction
Temperature sensorTSTemperature set decrease to 21 °C in winter
Renewable energy technologiesAir-source heat pumpASHPHeat capacity of 18.7 kW, COP: 3.4
Ground-source heat pumpGSHPHeat capacity of 18.7 kW, COP: 3.4
Building-integrated photovoltaicsBIPVA = 2700 m2, Tilt angle 25°, 28.9 kWp, PV electricity generation efficiency: 18.8%
Table 4. Office building technology systems.
ZoneTechnology SystemPassive TechnologiesActive TechnologiesRenewable Energy
Technologies
CTC-SYST01
C-SYST02
C-SYST03
C-SYST04
C-SYST05
HSCWCHC-SYST01
HC-SYST02
HC-SYST03
HC-SYST04
HC-SYST05
HSWWTHW-SYST01
HW-SYST02
HW-SYST03
HW-SYST04
HW-SYST05
Table 5. Energy consumption simulation results for different SYSTs.
ZoneTechnology SystemEnergy Consumption for Heating and Cooling (kWh/m2/a)Energy Consumption for Electricity (kWh/m2/a)Primary Energy Consumption (kWh/m2/a)
CTBaseline107.2138.86146.01
C-SYST0187.6338.86126.49
C-SYST0265.5924.7290.31
C-SYST0331.9238.8670.78
C-SYST0440.3238.8679.18
C-SYST0518.6511.9730.62
HSCWCBaseline111.3338.80150.13
HC-SYST0185.2138.80124.01
HC-SYST0261.4324.6686.09
HC-SYST0338.1138.8076.91
HC-SYST0433.0038.8071.80
HC-SYST0515.685.4321.11
HSWWTBaseline106.3838.75145.18
HW-SYST0180.6538.75119.40
HW-SYST0263.4824.6188.09
HW-SYST0338.8338.7577.58
HW-SYST0432.1438.7570.89
HW-SYST0519.499.0128.50
Table 6. L9(34) Orthogonal table of nine simulated working conditions.
Working ConditionsWWR (A)KWALL (B)
W/(m2·K)
KROOF (C)
W/(m2·K)
KWIN (D)
W/(m2·K)
11111
21232
31323
42133
52221
62312
73122
83213
93331
Table 7. Selection of factors and levels for simulated working conditions.
FactorsLevel 1Level 2Level 3
WWR(A)0.500.400.30
KWALL (B) W/(m2·K)0.400.300.20
KROOF (C) W/(m2·K)0.350.250.15
KWIN (D) W/(m2·K)2.001.501.00
Table 8. (a) Simulation results for each simulation condition (Zunyi); (b) Simulation results for each simulation condition (Wuhan); (c) Simulation results for each simulation condition (Guilin).
(a) Working ConditionsFactorsLoad Index (kWh/m2)
ABCDHeating LoadCooling LoadTotal Load
111119.9856.3366.31
212324.6351.6756.30
313230.8450.4651.30
421330.3545.2445.59
522216.7549.2055.95
623124.1848.1452.32
731223.1642.8245.98
832130.4342.0342.46
933312.0641.4943.55
(b) Working ConditionsFactorsLoad Index (kWh/m2)
ABCDHeating LoadCooling LoadTotal Load
1111111.4962.0673.55
212326.1156.3262.43
313232.2454.4156.65
421336.3652.4358.79
522218.0753.9261.99
623125.5952.3457.93
731224.5346.7951.32
832131.8045.5247.32
933313.3645.3148.67
(c) Working ConditionsFactorsLoad Index (kWh/m2)
ABCDHeating LoadCooling LoadTotal Load
111116.5358.7265.25
212321.1753.4354.6
313232.3551.8554.2
421332.7346.7449.47
522213.3251.2654.58
623120.5049.9050.4
731220.3644.6545.01
832132.6943.6246.31
933311.2943.1944.48
Table 9. (a) Calculation of composite means at corresponding levels of each factor (Zunyi); (b) Calculation of composite means at corresponding levels of each factor (Wuhan); (c) Calculation of composite means at corresponding levels of each factor (Guilin).
(a)K-ValueABCD
Heating loadK15.154.504.866.26
K23.763.943.583.99
K31.882.362.350.54
Cooling loadK152.8248.1348.8349.01
K247.5347.6347.4947.54
K342.1146.7046.1345.91
Total loadK157.9752.6353.7055.27
K251.2951.5751.0851.53
K344.0049.0648.4846.45
(b)K-ValueABCD
Heating loadK16.617.466.297.64
K26.675.334.955.41
K33.233.735.283.47
Cooling loadK152.8257.6053.7653.31
K247.5352.9051.9251.71
K342.1145.8750.6951.35
Total loadK157.6053.7653.3153.76
K252.9051.9251.3551.82
K345.8750.6951.7150.79
(c)K-ValueABCD
Heating loadK13.353.213.243.71
K22.182.392.010.68
K31.451.381.732.59
Cooling loadK154.6750.0450.7551.06
K249.3049.4449.2549.33
K343.8248.3147.7947.40
Total loadK158.0253.2453.9954.77
K251.4849.6949.5250.00
K346.5851.8351.2649.99
Table 10. Optimal envelope design options in the CT, HSCWC, and HSWWT zones.
CT ZoneHSCWC ZoneHSWWT Zone
WWR0.300.300.30
KWALL0.20 W/(m2·K)0.20 W/(m2·K)0.30 W/(m2·K)
KROOF0.15 W/(m2·K)0.25 W/(m2·K)0.25 W/(m2·K)
KWIN1.00 W/(m2·K)1.00 W/(m2·K)1.00 W/(m2·K)
Disclaimer/Publisher’s Note: The statements, opinions and data contained in all publications are solely those of the individual author(s) and contributor(s) and not of MDPI and/or the editor(s). MDPI and/or the editor(s) disclaim responsibility for any injury to people or property resulting from any ideas, methods, instructions or products referred to in the content.

