Article

Utilization of Food Waste for the Development of Composite Bread

1
Department of Allied Health Sciences, School of Health Sciences and Technology SoHST, University of Petroleum and Energy Studies UPES, Bidholi, Dehradun 248007, India
2
School of Computer Science and Engineering, IILM University, Greater Noida 201306, Uttar Pradesh, India
3
Department of Food Science and Technology, Graphic Era (Deemed to be University), Dehradun 248002, India
4
Department of Pharmaceutical Sciences, School of Health Sciences and Technology SoHST, University of Petroleum and Energy Studies UPES, Bidholi, Dehradun 248007, India
5
Department of Eye Diseases, Peoples’ Friendship University of Russia (RUDN University), 117198 Moscow, Russia
6
Department of Biotechnology, School of Applied and Life Sciences, Uttaranchal University, Dehradun 248007, India
7
Department of Food Technology, Vignan’s Foundation for Science, Technology and Research (Deemed to be University), Vadlamudi, Guntur 522213, Andra Pradesh, India
8
Department of Physics, School of Applied and Life Sciences, Uttaranchal University, Dehradun 248007, India
*
Authors to whom correspondence should be addressed.
Sustainability 2023, 15(17), 13079; https://doi.org/10.3390/su151713079
Submission received: 29 April 2023 / Revised: 21 July 2023 / Accepted: 23 August 2023 / Published: 30 August 2023
(This article belongs to the Collection Waste Utilization and Resource Recovery)

Abstract

:
The development of highly nutritious bakery products with optimum utilization of food waste is a major challenge for the food industry. The optimum utilization of food waste for the sustainable development goal of the country is important for the growth of the nation. The aim of the present work is to prepare value-added composite flour-mixed bread from waste fruit and vegetables. The composite flour was prepared in four formulations of peel and pomace with wheat flour (PPWF), as PPWF1, PPWF2, PPWF3, and PPWF4. Composite flour was blended with a mix of vegetable and fruit pomace powders and whole wheat flour. Indian gooseberry pomace powder, apple pomace powder, bottle gourd peel powder, and potato peel powder were used with whole wheat flour to make pomace and whole wheat flour compositions such as PPWF1, PPWF2, PPWF3, and PPWF4. Out of these four flours, PPWF3 contained a good amount of fiber 8.16%, crude protein 3.18%, total phenolic content 14.48%, moisture 9.5%, vitamin C 13.64 mg/100 g, and total phenolic compound 14.48 (mg/GAE/g), which are maximum and acceptable range values as compared to the other three composite flours and the control group flour. PPWF3 is used as a partial replacement ratio for wheat flour due to its high phenolic content, vitamin C content, and richness in fibers. This composite flour is used to make bread dough, and two samples, G1 and G2, are made, out of which G2 offers better nutritional, functional, and sensory evaluations in comparison with refined wheat bread, which is taken as a control group. Thus, such utilization of food waste in bread making can generate value from waste and improve the nutritional attributes of bread, which may improve an individual’s health.

1. Introduction

Food is a major essential human need, and food waste has been investigated as a major challenge [1] facing humanity today. The food wastes are mainly organic waste, which generally comes from the kitchen, hotel industries, restaurants, and food processing industries. A significant percentage—up to 17%—of food is thrown in dustbins by different users, as per the Food Waste Index Report 2021 [2]. As the population is growing exponentially and for economic development, global attention has turned towards food waste. According to the World Bank and FAO, roughly 1.33 billion tons of food are wasted per year in the world, and this wastage can rise to 2.2 billion tons by 2025 [3]. A large volume of low-cost by-products gives economic advantages because of their potentially valuable components and environmental benefits, as shown in earlier works [4,5]. Today, food is not only needed to fulfill our hunger but also to provide the basic, important nutrients that have health benefits and protect us from several diseases. Different food nanotechnologies, smart agricultural [6], and plant disease control studies are also aligned toward human health [7] and sustainable production. Quality food production and the utilization of food waste are major challenges in every food processing industry [8]. Food that is not used by food processing industries and domestic kitchens is considered “food waste”. Nutrient recovery and awareness of bioactive compounds are crucial in food formulation. The food industry produces a huge amount of waste or by-products annually around the globe, and that waste or by-products contain many components that are beneficial for human health. Food waste is produced from many sources, and the vegetables derived from processing food waste include peels, stems, seeds, bran, juice, and sugar. Food waste can also be converted into renewable energy in some of the proposals [9,10], which offers the advantage of reducing the dependency on energy derived from fossil fuels. Food waste can be referred to as the loss of food in the later stages of the food supply chain intended for human consumption. The loss may be accidental or intentional, which ultimately leads to a shortage of food. The industrial processing of apples and gooseberries produces huge quantities of waste material that is unknowingly discarded or undervalued. Despite this, apple waste has a high content of antioxidant compounds and many valuable compounds. The skin of ripened apples and other vegetables contains enough anthocyanins that other flavanols accumulate in the peels [11]. The dried powder has been used in different soups and ready-mix powders in the food processing industry [12]. Bottle gourd and potato are mainly used for domestic and industrial purposes for their valuable compounds and offer their waste in the form of peels. Thus, the availability of this waste has given researchers scope for research [13,14] for creating some useful value-added products using this food waste. Potato peel is an inexpensive by-product from food-based industries and is a very valuable and affordable raw material for products like food additives, nutraceuticals, processed foods, etc. The valuable components that are present in food waste and by-products include polysaccharides, fats, proteins, and certain bioactive compounds. Annually, the food industry generates a large amount of waste around the world. Around 38% of food waste occurs at the time of food processing itself. Conventionally, flour for any bakery product is prepared from whole wheat and refined wheat flours. Refined wheat flour or whole wheat flour contains a good amount of gluten, which plays an efficient role in the resistance ability and viscoelastic characteristics of dough. The gas-holding capacity of gluten-rich flour bread is generally high because of its good resistance to mechanical stress [15,16]. Composite flour increases nutrition efficiency and reduces the burden of wheat production in agricultural areas in developing countries [17]. There are a lot of health benefits to plant-based flour despite the presence of anti-nutrient factors such as phytate and oxalate, which limit nutrient utilization [18]. The problem of anti-nutrients is reduced by soaking, heating, and boiling methods of food processing. Thus, making food products better and enriched with nutrients is important today due to the increasing number of nutritional deficiencies found in human diets. Composite flours are designed to fulfill nutritional needs and offer more phenolic, vitamin C, fiber, and mineral values (ash content) than wheat flours and their products. Immunity is an important aspect of maintaining good health to fight infectious diseases like the SARS-CoV-2 virus [19,20]. A good number of micronutrients play a vital role in building and developing immunity. Thus, this work offers a nutritional substitute for wheat bread with peel and pomace powder. Composite flour bread offers a solution for common food waste utilization by taking value out of it. Moreover, peel and pomace-enriched composite flours can add more phenolics, fiber, vitamin C, and minerals to food products. This detailed introduction to the work is shown systematically in Figure 1. This work offers a value-added product in the form of peel pomace composite flour bread with more nutritional attributes and the utilization of food wastes, which are mostly available in abundance everywhere in nearby places. The aim of this research study was to check the effect of the contribution of Indian gooseberry and apple pomace with the support of bottle guard and potato peel for the preparation of composite flour to enhance the nutritional quality of flour in terms of nutrients like total phenolic compounds, vitamin C, dietary fibers, and bioactive compounds. Overall challenges and contributions are given in Figure 1. For this purpose, the formulation of composite flour was prepared in 4 different ratios with the names PPWF1, PPWF2, PPWF3, and PPWF4 to analyze various changes in the nutritional and functional parameters of the flour. Several tests and analyses were performed in triplicate to check the quality parameters of four different ratios of composite flour. The proximate tests like moisture, total ash, crude protein, crude fat, fiber, carbohydrate, and energy were analyzed in triplicate by AACC standard methods. The phenolic test, ascorbic acid, and total sugar were performed to check the advanced nutritional availability of composite flour. The functional analysis of composite flour was also performed to check the basic functional quality of flour for the preparation of bread. The water and oil absorption capacities of flour and the swelling, foaming, and emulsion capacities of flour were measured to get information on the strength of flour for bread preparation. The physical parameters of the loaf were also analyzed to check the physical quality of the loaf. The selected prepared bread was further analyzed for crumbliness and softness, which were determined by a digital penetrometer. The hardness, cohesiveness, and adhesiveness of bread were analyzed by a texture analyzer. The advanced characterization of bread was determined by FTIR, GC-MS, and XRD for the determination of the active compound and solubility of bread.

2. Material and Method

The current study was carried out in the food nutrition lab of SoHST, UPES Dehradun. The PPP formulation is mixed for preparations of composite flour. The prepared composite flour is used for the formulation of bread. Nutritional and functional analysis methods are carried out on PPP powder, composite flour, and bread to estimate their nutritional and functional properties.

2.1. Pr °Curement of Raw Material

Fresh Indian gooseberry fruit waste is collected from the local juice shops of Anurag Chowk and Prem Nagar, Dehradun, and apple waste from the fruit processing unit of Dehradun, where most of the apples were from local gadwall farms in the Himalayan region, while the potato and bottle gourd peels are collected from the hostel kitchen mess as per Figure 2. Whole wheat flour and other raw products are procured from the local market in Panditwadi, Dehradun. All chemicals are analytical grade, procured from Merck and High Media. From here on, this research work is presented in three phases. The first phase shows the creation of peel and pomace powder and its nutritional and functional analysis. Then, in the second phase, peel and pomace powders are used to make composite flours such as PPWF1, PPWF2, PPEF3, and PPWF4. These composite flours were analyzed and tested for their nutritional, functional, and proximate attributes; the results are computed and shown in Section 3. Based on triplicate test results, PPWF3 stands out due to its high nutritional value and is taken further for bread creation. Then, in phase three, the dough is created using composite flours (PPWF3) and whole wheat flour. Then, the prepared bread is compared with a control group of refined wheat flour bread. The overall process and methods are shown in the following Section 2.2, Section 2.3 and Section 2.4.

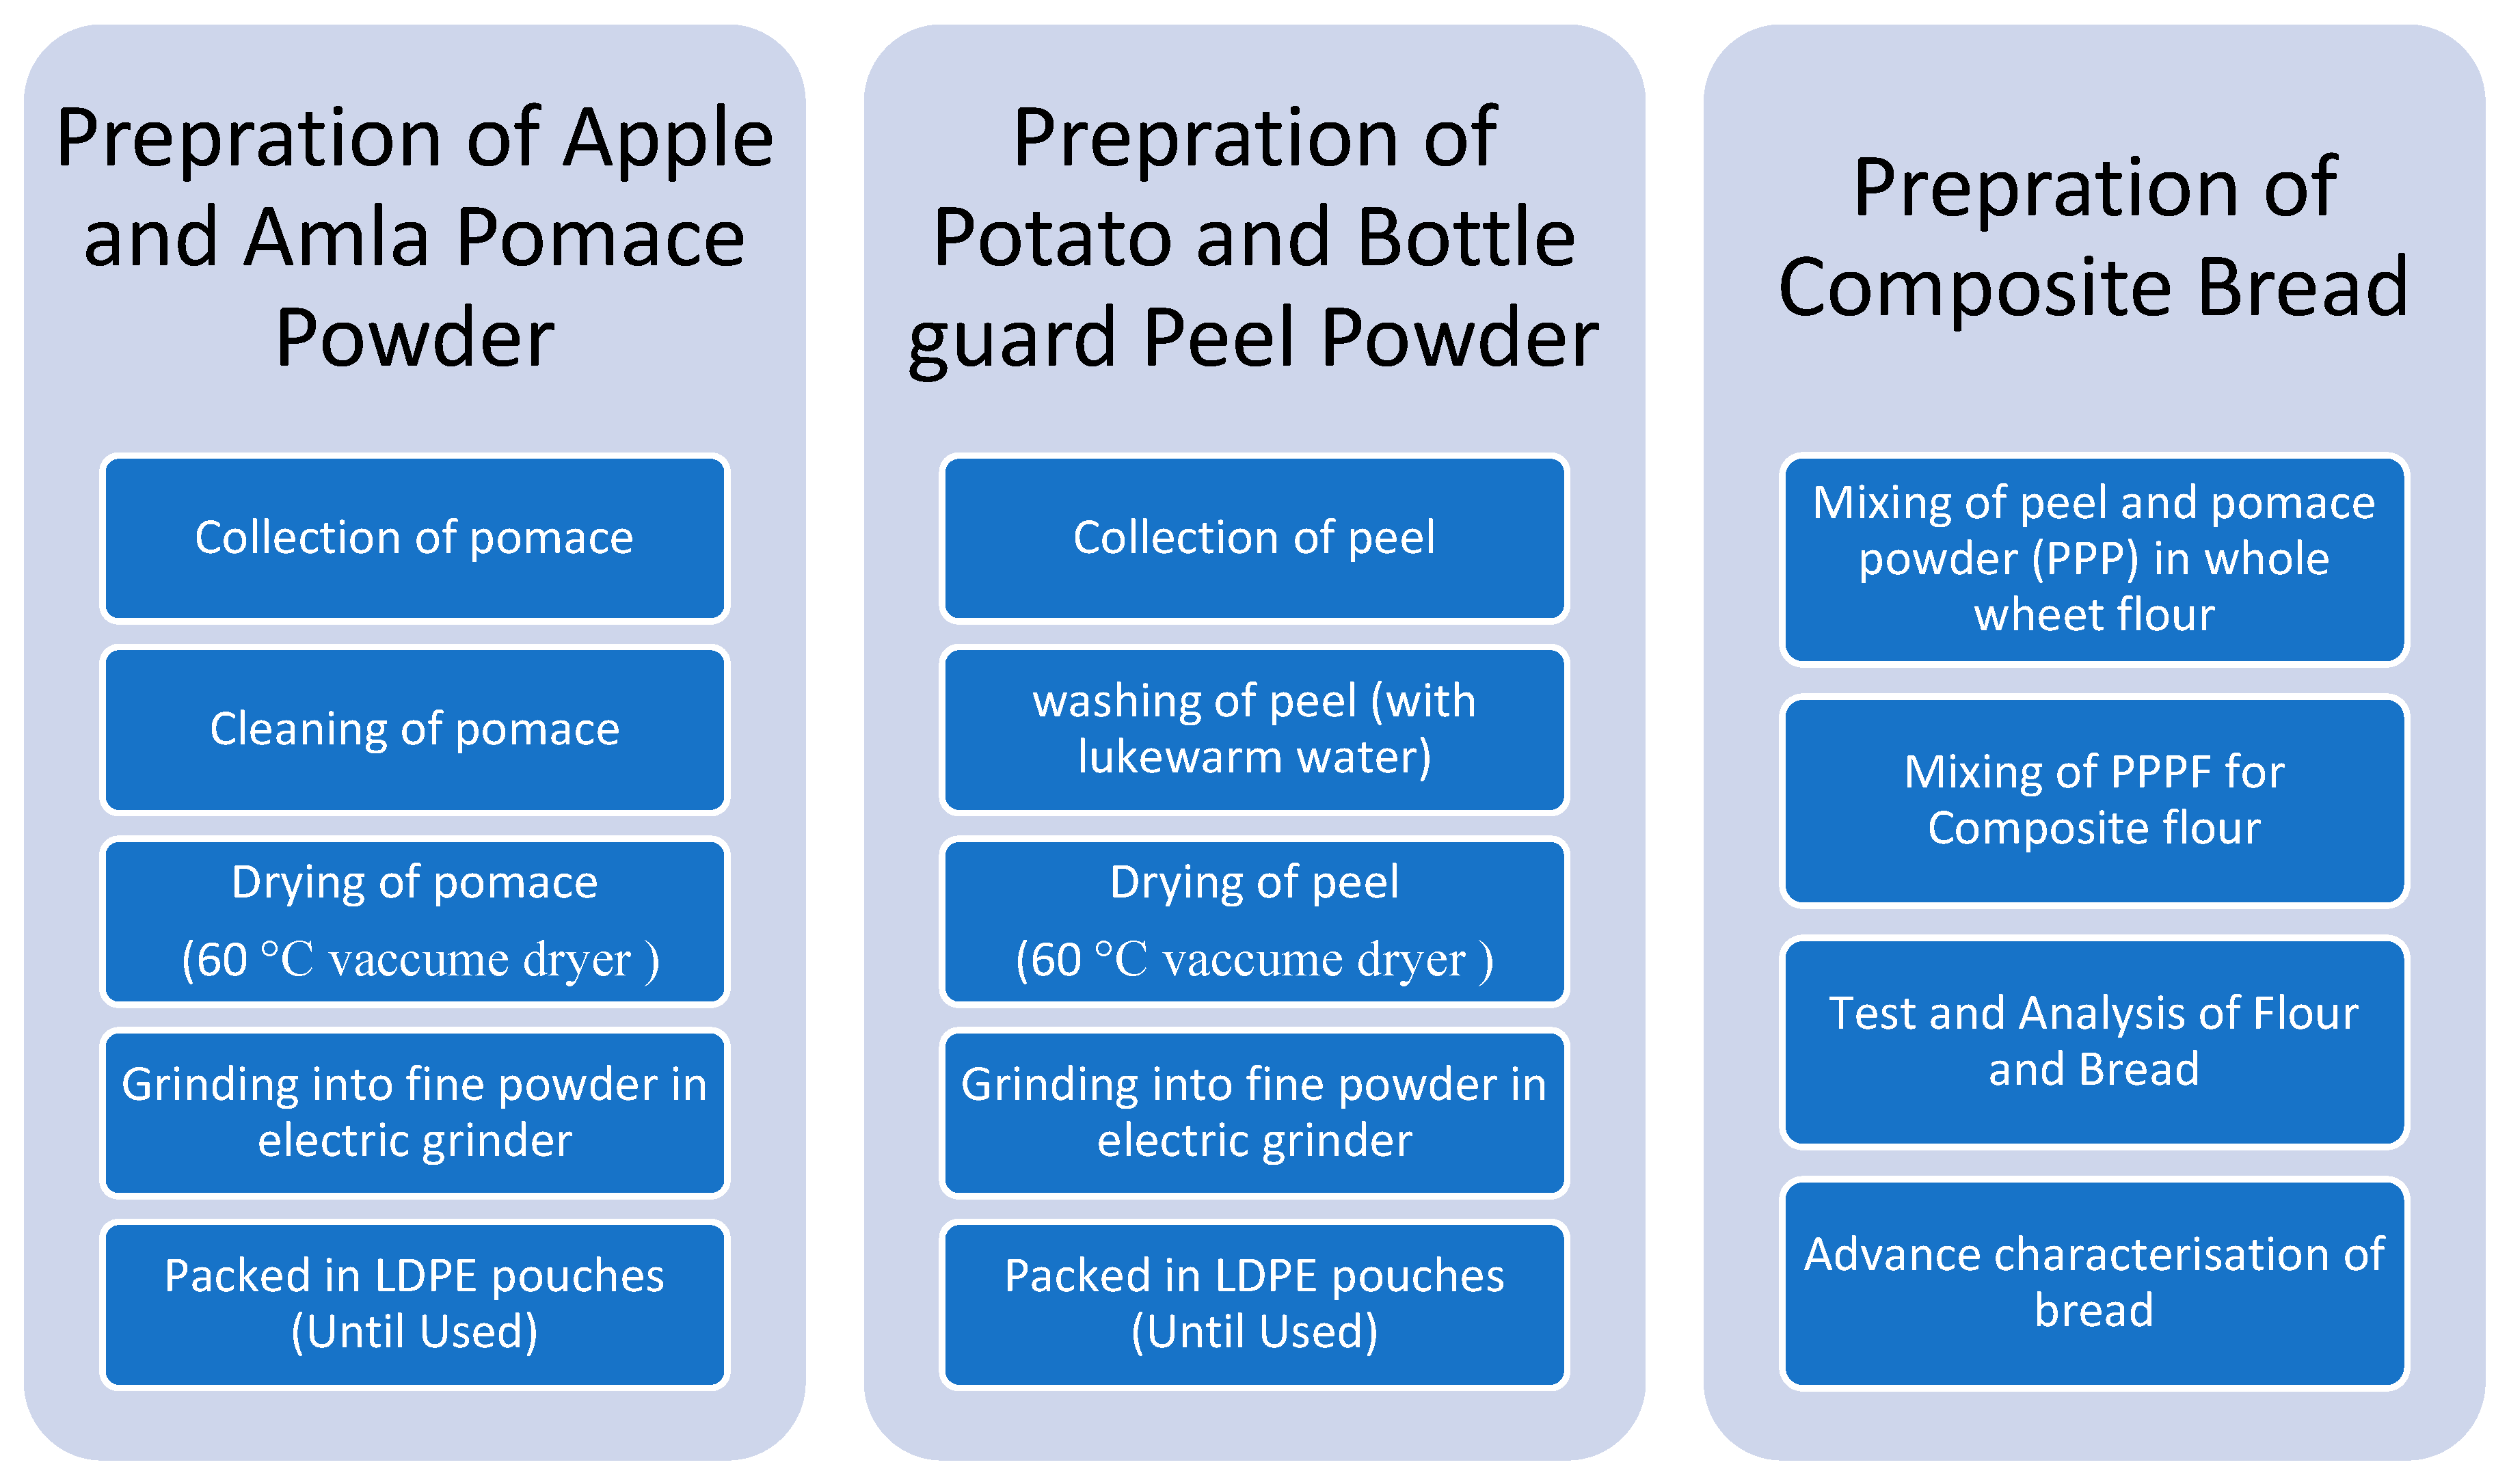
2.2. Preparation of Peel and Pomace Powder (PPP)

Peel and pomace (PP) of fruits and vegetables were washed with running tap water and then dipped in clean water. After that, they were blanched in hot water at 82 ± 2 °C with atmospheric pressure [21] for 2 min to control the activity of enzymes and stop the growth of microorganisms. The seeds contain toxic components, and they are not suitable for flour, so they are removed. All peel and pomace are separately dried in a vacuum dryer (GMP standard, model no. 140795) at 60 °C for 4–8 h until they become dry. Then dried PP is placed in a blender to make a coarse, fine powder, and then passed through a 40 mesh strainer for a smooth powder called PPP (peel and pomace powder). The prepared powder is packed in separate pouches and stored at a temperature of 20 °C. The whole process and method are shown in Figure 2.

2.3. Preparation of Peel and Pomace Powder Composite Flour

The flour is prepared in four formulations with peel and pomace. Peel-pomace-wheat-flour (PPWF), PPWF1, PPWF2, PPWF3, and PPWF4. Composite flour is blended with a mix of vegetable and fruit pomace powders and whole wheat flour. Indian gooseberry pomace powder, apple pomace powder, bottle gourd peel powder, and potato peel powder are used with whole wheat flour. The formulation of PPWF flours has been prepared based on the number of ingredients and minimum requirement of nutrients like dietary fiber, phenolic content, and vitamin C as per the estimated average requirement (EAR) [22] for adult males and females 19 to 39 years of age. After the laboratory tests on peels and pomaces, four formulations have been selected for the preparation of PPWF flours. The PPWF formulations were optimized using laboratory trials. The percentage ratio of pomace and whole wheat flour used is 24:76 (PPWF1), 43:57 (PPWF2), 62:38 (PPWF3), and 81:19 (PPWF4), respectively, as given in Table 1. On the basis of the definition, composite flour is a mixture of different flours in whole wheat flour for the enrichment of nutrients [23]. The nutritional and functional analysis is done on all PPWF flours. Their nutritional parameters are computed [24] and compared with the control sample.

2.4. Preparation of Bread

The composite bread is prepared by substituting whole wheat flour with the PPWF3 composite flour. PPWF3 is a formulation of 62% peel and pomace and 38% whole wheat flour. The straight dough method [25] was used to prepare the composite flour bread. It includes the addition of all the ingredients, i.e., flour, water, salt, yeast, sugar, etc., at the mixing stage and kneading to obtain the optimum quality of dough. The complete details of the ingredients used are given in Table 2. Different dough samples are placed in baking pans smeared with butter and covered with a moist cloth to ferment at a temperature of 29 °C for about 1 h. The dough is then baked in the oven of Bajaj, with model no. 1603 T Oven Toaster Griller (OTG) with a stainless-steel body. It was set to preheat at 238 °C for 15 min, and then the baking temperature was set at 210 °C for 20 min. The bread is prepared in triplets [26] in three different ratios (whole wheat flour: peel and pomace flour-PPWF3): tested samples of 80: 20(G1); 70: 30(G2) and control bread 100:0 (refined wheat flour with an ash content of 3.85%—control group). The physical, sensory, nutritional, and functional analyses are conducted on prepared bread after 4 h of cooling.

2.5. Nutritional Evaluations

The nutritional analysis of PPP powders and PPWF flours is conducted using the AACC standard method [27]. The moisture, total ash, crude protein, crude fat, and fiber were analyzed by methods 44–15 A, 08–01, 46–30, 30–25 A, and 32–10, respectively. Protein content in the samples was determined using the Bradford method [28]. The carbohydrate content of flour and bread was estimated by the differentiate method as given below in Equation (1), and energy can be computed as per Equation (2). All the analyses are performed in triplicates as per the method’s recommendation.
Carbohydrates% = 100 − (%Moisture + %Ash + %Fat + %Fibre + %Protein)
The total energy of flour is calculated as per the given formula:
Energy (kcal) = (Protein × 4) + (Fat × 9) + (Carbohydrates × 4)

2.5.1. Total Phenolic Content Analysis

Total phenolic content is measured as per the method used by the author, Sudha et al. [29]. The absorbance is taken at 765 nm with a UV-VIS spectrophotometer from YUCHENGTECH, Model no. 5555917, USA. The phenol contents of the samples are expressed as mg gallic acid equivalent per gram dry matter (mg/GAE/g). A standard curve of phenolic content is plotted in the range of 50–500 mg GAE/L by taking 0.1, 0.2, 0.3, 0.4, 0.5, 0.6, 0.7, 0.8, 0.9, and 1.0 mg/mL.

2.5.2. Ascorbic Acid Analysis

Ascorbic acid was measured by Kohli et al. [30] at mg/100 g by the 2, 6-dichlorophenol indophenol solution method. 52 mg of the sodium salt of the dye and 42 mg of sodium bicarbonate are added to 500 mL of distilled water. 6% metaphosphoric acids are prepared by dissolving 60 g in distilled water and making the volume 1000 mL. Standard solutions are prepared by dissolving 10 mg of L-Ascorbic acid in a 6% prepared metaphosphoric acid solution and making the volume 1000 mL. In this, 1 g of the sample is centrifuged with 9 mL of 6% metaphosphoric acid. The supernatant so obtained is used for titration against the dye. Transfer 20 mL of the standard solution to an Erlenmeyer flask. Titrate against the dye solution until the appearance of a light pink color. Note the volume of the dye used. Titrate 20 mL of sample solution against the dye solution and record the volume of dye used. The amount of ascorbic acid in 100 mL of undiluted juice is calculated by using the formula given in Equation (3) below:
AscorbicAcid (mg/100 mL) = (y/x) × 10 mg

2.5.3. Total Sugar Analysis

The total sugar (TS) [31] of samples is estimated using the phenol–sulphuric acid using glucose as a standard. The absorbance is recorded at a wavelength of 490 nm using a spectrophotometer. Reducing sugars (RS) are estimated by the method of G.L. Millar [32]. Non-reducing sugar (NRS) was estimated by the Lane and Eynon method (1923). NRS was calculated by deducting reducing sugar from total sugars as per Equation (4).
NRS = (totalinvertsugar − reducingsugar) × 0.95

2.6. Functional Analysis

2.6.1. Water Absorption Capacity

The water absorption capacity (WAC) is determined according to the standard method of Giami et al. [33]. Water hydration, or WAC, is the quantity of water absorbed by flour. This method works as follows: a 1 gram sample is mixed with 10 mL of distilled water and allowed to rest at 30 °C for 30 min. It is then centrifuged for 10 min at 2800× g. The supernatant is discarded. The weight of water absorbed by 1 g of flour is calculated and expressed as water absorption capacity.

2.6.2. Oil Absorption Capacity

The oil absorption capacity (OAC) is determined according to the method of Giami et al. [33]. 1 g of sample is mixed with 10 mL of oil and allowed to stand at ambient temperature (30 °C) for 30 min. It is then centrifuged for 10 min at 2800× g. The supernatant is discarded. The weight of oil absorbed by 1 g of flour is calculated and expressed as oil absorption capacity.

2.6.3. Swelling Capacity

The swelling capacity of flour was determined by the method described by Lim et al. [34]. This method covered a 100 mL graduated cylinder, which was filled with the sample to the 10 mL mark. The distilled water for flour testing was added to give a total volume of 50 mL. The top of the graduated cylinder of the sample was tightly covered and mixed by inverting the cylinder. The suspension was inverted again after 2 min and left to rest for a further 8 min and the volume occupied by the sample was taken after 8 min. The swelling capacity of the sample was calculated by the swelling index. It is calculated as the ratio of the final volume to the primary volume.

2.6.4. Emulsion Capacity

The emulsion capacity (EC) of composite flour was determined by the centrifuged method as per Lim et al. [34]. In this 1-g sample, it was mixed with 10 mL of distilled water and 10 mL of edible oil. This mixture was centrifuged at 448× g per gram for 5 min. The emulsion activity in percentage is computed as a ratio of the height of the emulsion to the total height of the mixture. The emulsion stability is estimated after heating the emulsion contained in the calibrated centrifuged tube at 80 °C for 30 min in a water bath. Then, under running tap water, it is cooled for 15 min, and it is centrifuged at 448 RCF for the next 15 min.

2.6.5. Foam Capacity

The foam capacity (FC) is determined by Chandra et al. [23] with slight modification. The method was used with a 1.0 g flour sample added to 50 mL of distilled water at 30 °C. This solution is mixed and shaken for 5 min to make foam. The volume of foam after whipping up to 30 sec can be given as the FC formula given in equation no. 5:
Where VAFW: Volume of Foam After Whipping (mL) and VBW: Volume of Foam Before Whipping (mL)
FC   ( % ) = ( VAFW VBF ) VBF × 100
The volume of foam is recorded after 1 h after whipping to determine foam stability as a percent of the initial foam volume.
The following test is performed on selected bread samples from the G1, G2, and control groups.

2.7. Physical Analysis
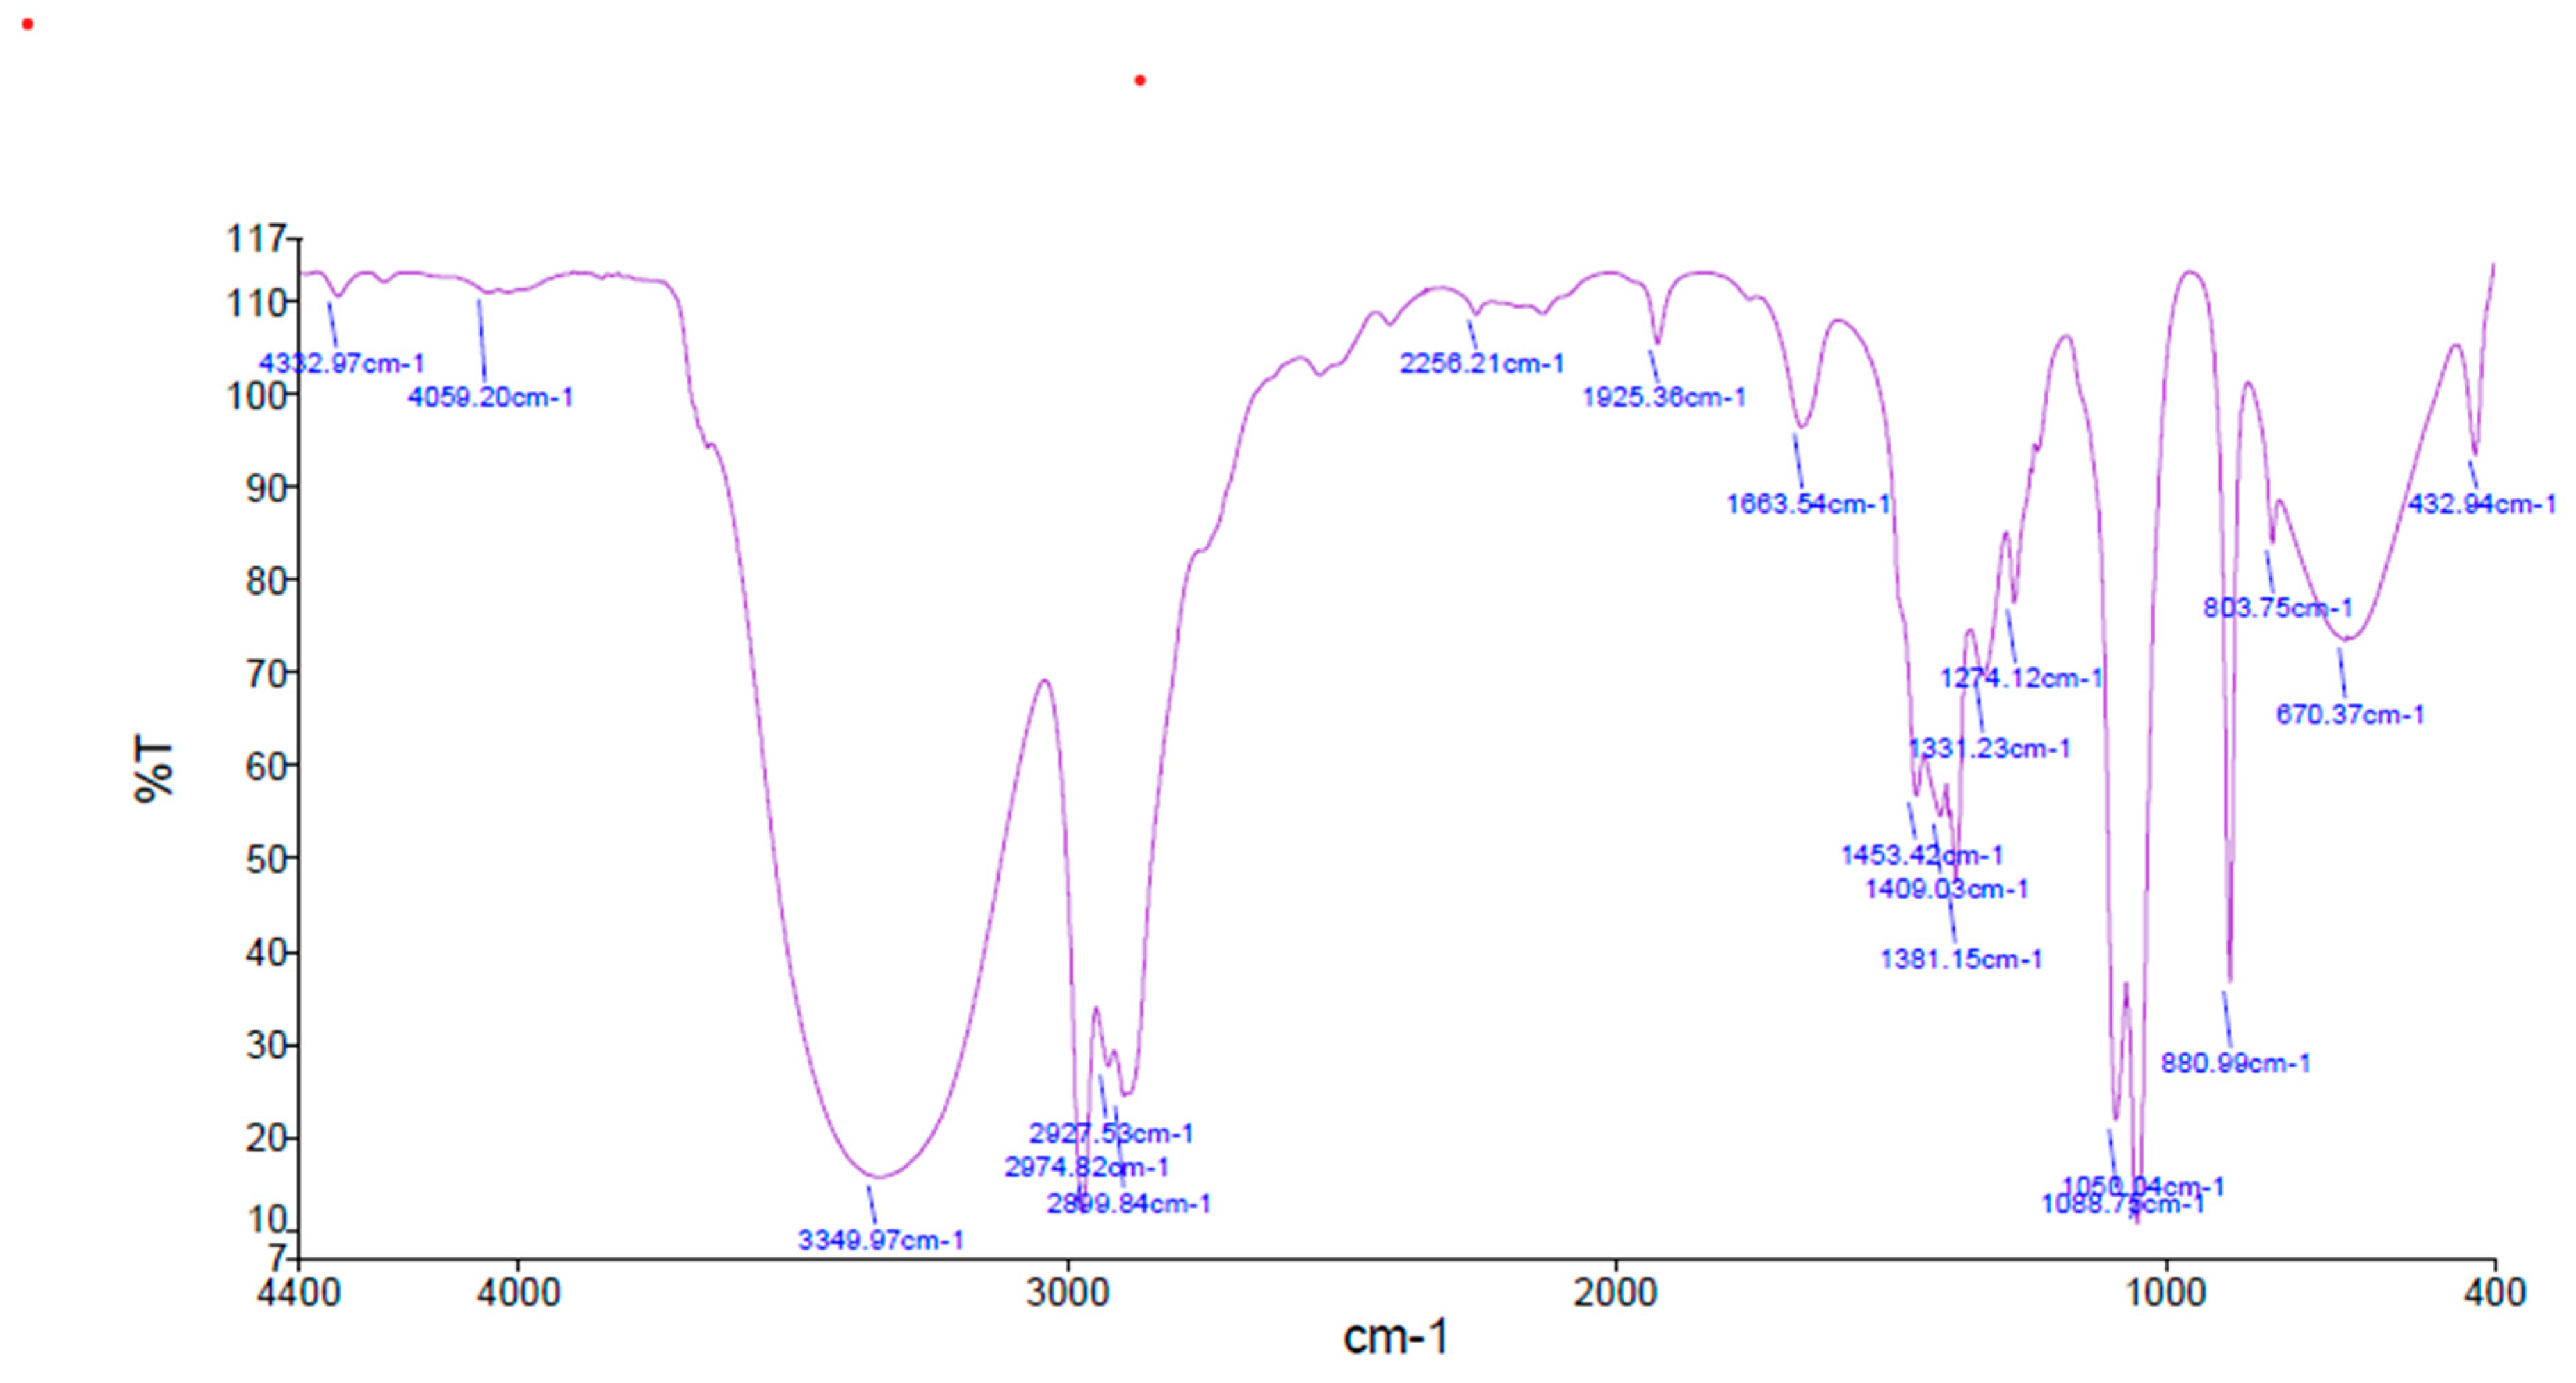
A physical analysis is performed on the loaf and the prepared bread. The digital balance is used for the determination of the weight and volume of loaf and bread samples [35]. It is determined by the displacement method. After the cooling of the obtained bread, the bread is weighed and its volume (cm3) is determined. The specific volume of the sample is determined as follows in Equation (6).
SpecificVolume   ( cm 3 ) = Loaf   Volume Loaf   weight
The breadcrumb softness was determined by a digital penetrometer, and the texture was analyzed by a Brookfield CT3 texture analyzer. The thick 2.2 cm bread was sliced, cut, and placed on a texture analyzer (speed 2 mm/s distance 10 mm, trigger: auto 5 g). [34] The hardness, cohesiveness, and adhesiveness were measured. This method was analyzed by Lim et al. [34]. The surface color of the bread was determined by measuring tristimulus L* (lightness), a* (redness), and b* (yellowness). These values have been determined using a Color Flex Spectrocolorimeter (Hunter Lab, Reston, VA, USA).

2.8. FTIR Analysis

The selected sample of bread was analyzed by an FTIR spectrophotometer (FTIR Frontier with operating range mid-IR 18300–350 cm−1 and 14700–2000 cm−1 PerkinElmer Spectrum Version 10.03.09) to detect the IR-absorption spectra of the prepared sample. The FTIR spectrum of bread was recorded by using the powdered form of bread. A similar procedure was followed for the preparation of the dough sample. The test was used to examine the variations in the bread and other ingredients that resulted from different mixing amounts and times in order to better comprehend the formulation of the sample. The region in the range of 4000–1500 cm−1 is called the functional group region, and the region below 1500 cm−1 is called the diagnostic region.

2.9. GC–MS Analysis

Gas chromatography-mass spectrometry was performed in selected bread samples (Gas Chromatograph Clarus®590/Mass Spectrometer Clarus®S Q 8 S, PerkinElmer) for the determination of bioactive compounds. The bread samples were dipped in methanol for the extraction of active compounds. The extract was identified using a perkinelmer GC Claurus 500 system and a gas chromatograph interfaced with a mass spectrometer (GC/MS). It is full-fledged and equipped with an Elite -1Fused Silica Capillary column (30 m × 0.25 mm ID). The helium gas was used to perform the test; it was used as a carrier gas for a constant performance rate of 1 mL/min. For this, the injection volume was two microliters. The temperature was 250 °C for the injector. The oven temperature for the test was 110 °C with an increased intensity of 10 °C/min.

2.10. XRD Analysis

XRD from PerkinElmer was used for the determination of the solubility of samples. It is to check the crystallite size of bread samples as per the study report conducted by X-ray diffraction (XRD), which is an advanced characterization and scanning tool that has been confirmed to be a reliable and advanced asset in analytical food particle analysis, so this scanning tool is useful for the solubility determination of the sample. The XRD has been used for the identification of polymorphism, amorphism, and crystallinity, among others. This XRD characteristic is used to understand the regulation of pomace powder’s functional characteristics, like texture and stability, under various baking processing and storage settings. This test was performed on bread samples that were processed at a high bakery temperature of 210–230 °C. The operating parameters were as follows: 0–900 intensity scanning from 10° to 90° for wide and small angle XRD.

2.11. Sensory Analysis

The effect of PPP on the sensory properties of prepared bread was analyzed by 20 untrained people from the same institute. There are ten males and ten females who are aware of tasting; they follow the Hedonic rating scale as described by Ranganna et al. [36] and Usman et al. [37]. The final composite bread and control products are evaluated for color and appearance, texture, flavor, and overall acceptability. To overcome the sensory fatigue of experts, the sensory tests are conducted in six sessions. The overall acceptability of bread is based on the mean scores obtained from all the sensory characters. The sensory quality was rated on a 9 points Hedonic scale, in which 1 is considered ’dislike extremely’, and 9 is considered ‘like extremely’.

2.12. Statistical Analysis

All data were analyzed by the mean of variance. All samples were performed in triplicate. All data are subjected to statistical analysis. For each analysis, the means and standard deviation were determined and analyzed using one-way ANOVA using SPSS-2021, IBM, USA. The significant difference was determined when p < 0.05. The lab-tested values of PPP, PPWF, and baked bread samples are evaluated statistically for their parameters like mean and standard deviation. Nutritional and functional parameters like moisture, TPC, fiber, and vitamin C are found to be statistically significantly different at p ≤ 0.05. This shows the effect of the addition of PPP powder on these parameters. Then the same Annova test and hypothesis are conducted on prepared bread samples of G1, G2, and the control sample as given below:

Hypothesis Conducted

µ0: is the mean of the control bread sample. µ1: is the mean of the G1 bread sample. µ2: is the mean of the G2 bread sample.
Then for any analyzed parameter, like ash content, means are statistically analyzed with hypothesis testing with the following hypothesis:
Null Hypothesis (H0): µ0 = µ1 = µ2
that is: all means are significantly the same.
Alternate Hypothesis-(H1): All sample means are different.
Then, based on the Annova one-way test for the ash parameter, it was found that the null hypothesis was rejected, which means all means are not the same and they are statistically significantly different (p ≤ 0.05). Then, at the next level, hypotheses are checked for null hypotheses as
µ0 = µ1
µ0 = µ2
µ1 = µ2
For ash content, we found that µ0 = µ1, µ0 ≠ µ2, µ1 ≠ µ2. It means the ash content of the control sample is significantly similar to the G1 sample but significantly different from the G2 sample. Then, accordingly, superscripts are marked as a and b. Then, as per this statistical analysis, values are superscripted as a, b, and ab.

3. Results and Discussion

In this research work, the analysis is conducted in three phases, as described in earlier sections: phase 1 PPP, their nutritional and functional analysis; phase 2 PPWF, their nutritional and functional analysis; and phase 3 composite bread baking, its nutritional, functional, physical, and sensory evaluations. Composite flour mixed with whole wheat, which was high in dietary fiber but low in foaming of bread as gluten content was low. So PPWF3 was mixed with refined wheat flour so that foaming of bread became possible. Thus, this section shows the results of lab tests performed on PPP powders as per Table 3, and in other parts, tests are performed on composite flours (PPWF formulations) as per Table 3. All tests have shown the nutritional, physical, and functional capacities of composite flour. It is performed in order to explore the possibilities of bread by using alternate composite flour to enhance maximum nutrients through the utilization of waste peel and pomace. This is an alternative flour source for sustainable development by reducing agricultural loads and food waste. Then, using this nutritious composite flour, bread is created and tested for nutritional, functional, and sensory analysis.

3.1. Nutritional Analysis Result

Adding food waste to wheat flour can be a better choice for improving the nutrient benefits of composite flour and prepared products. The nutritional attributes are observed to be much higher in such peel and pomace as compared to whole wheat flour; the detailed results are shown in Table 3. It is observed that the moisture content of apple pomace and Indian gooseberry is up to 9.31%, but it is higher in potato and bottle gourd peel, up to 11.44%. Moreover, ash content is highest in bottle gourd peel powder, with a value of 3.92%, compared to other peel pomace powders and wheat flour. The fat percentage of all PPP powders is 6.14%. Additionally, fiber content is highest in apple pomace powder, with a value of 10.15%. Thus, all such results are significantly different from the control at p < 0.05 with the addition of PP. These results are similar in value ranges related to the study of Usman et al. [30], which was also conducted on apple pomace addition in wheat flour. Moreover, pectin content is highest in apple pomace powder, with a value of 10.2%. Thus, due to these nutritional advantages, these peel and pomace powders become a better substitute for wheat flour to make composite flours. PPWF2, PPWF3, and PPWF4 have an acceptable moisture content of up to 9.5%, except PPWF1. The total moisture content of these composite flours is within the acceptable range of not more than 10%, which can enhance their storage stability by avoiding mold growth and other biochemical reactions as per Nasir et al. [38]. The moisture content is found to be statistically significant (p < 0.05). All these values can be seen in Table 4.
The ash content of the PPWF flours is in the range of 2.58–4.67%. The ash content determines the mineral content of any food, as per [39]. The ash content was found to be statistical. The analysis shows that PPWF3 stands out in terms of protein, vitamin C, total phenolic compounds, and fiber, which makes it a favorable choice for making bread in the next stage. The fat content range of PPWF varies from 1.5–5.17%. The highest fat content is found in PPWF2, while the lowest is recorded in PPWF1. The average fat value present is PPWF3, which is in the acceptable range as compared with the mean differences with the control. Treated peel causes the inactivation of enzymes and settles the physical state of the peel. It helps reduce the interference of antinutrients and enzymes in flour. The fat contents in the flours are statistically significant at p < 0.05. The protein level in various PPWF samples ranges from 2.57 to 3.18%. Results show that PPWF3 [40] has the highest level of protein. The fiber contents in PPWF flours range from 6.26 to 8.28%. Higher values of proteins are found in PPWF3 and PPWF4, but due to the higher moisture content in PPWF4, it is not suitable for dough preparation for bread. Thus, as per moisture, fiber, and fat content, PPWF3 is favorable for the further creation of bread using PPWF3 flour with whole wheat flour. This bread is made using PPWF3 with whole wheat flour. The tested bread sample is prepared in two different ratios (whole wheat flour: peel and pomace flour-PPWF3) of 80:20 (group1-G1); and 70:30 (group2-G2), and bread (the control sample) is taken at 100:0 (refined wheat flour: other flours), as shown in Table 5, which shows the nutritional and functional analysis of prepared bread samples. The tested bread samples G1 and G2 contain 30.5% and 9.11% moisture, respectively. The moisture value is in the acceptable range in G2 as compared to control bread and G1 samples. The ash value of G2 is better than G1 and the control bread sample up to a value of 5.4%, which may be due to the high values of potato and bottle gourd peel powder richness in PPWF3. Moreover, a higher percentage, i.e., 30% of PPWF3, is added to the G2 sample. The fiber values are of the same order in G2 and G2 up to the ranges of 4.95 to 5.1%, which is better than the control group. The carbohydrate estimations are better in G2 up to values of 70.36% than in G1 and control group bread. The total energy is higher in G2 up to a value of 365.46 Kcal/100 g as compared to G1 and the control group. The total sugar value of 48.5mg/gm is satisfactory and lower than the other two G1 and control groups. The total phenolic content is available in apple pomace powder and Indian gooseberry pomace powder, with values of 10.447 and 45.754 of gallic acid equivalent per gram (mg/GAE/g). These values are significantly higher than the control bread samples. The TPC is found in PPWF to be in the range between 2.23–14.48 (mg/GAE/g). The highest TPC is observed in PPWF3, i.e., 14.48 mg/GAE/g, which is 7 times higher than the control sample, while the lowest is observed in the control sample. The bread samples G1 and G2 contain 9.58 (mg/GAE/g) and G2 contains 9.26 (mg/GAE/g) of phenolic content, which is higher than the control bread.

3.2. Functional Analysis

3.2.1. Water Absorption Capacity (WAC)

The WAC in the different samples of PPP powders ranges from 316–831%. It is found that the Indian gooseberry powder absorbs more water than the other PPP powders. The WAC ranged between 424.4 and 460.4% for PPWF flours, while for the control group, it was 129.4%. The WAC is observed to be higher in PPWF3 and PPWF4, while it is lowest in wheat flour. It is reported that the lower WAC in some flours may be due to the lower availability of polar amino acids in flours. The high WAC of composite flours suggests that the flour can be used in the preparation of many foods. The observed variation in different flours may be due to different protein concentrations, their degree of interaction with water, and their conformational characteristics. Moreover, more fiber content also offers more WAC. Thus, these flours are suitable for the creation of bread due to their nutritional and functional analysis. The increase in WAC might lead to the production of more moist and soft-textured bread as well as increases in loaf weight.
The difference between TPC and PPWF3 is statistically significant (p < 0.05) compared to the control sample. The ascorbic acid level in different samples of PPP powders ranges from 2.14 to 272.71 mg/mL. Indian gooseberry, being the richest source of test ingredients and having great antioxidant properties, shows the highest level of vitamin C content among all samples, whereas potato peel powder tends to show the minimum level of vitamin C content. It is observed that vitamin C is higher in Indian gooseberries, up to a value of 272.71 mg/g. The ascorbic acid content ranges from 1.48–13.64 mg/g in PPWF flours, and whole wheat flour has the lowest vitamin C content. It is found that PPWF3 has the highest vitamin C content of the other flours. This is due to Indian gooseberry. The difference in ascorbic acid content is statistically significant (p < 0.05) in PPWF3 compared to the control sample. Vitamin C is the body’s first line of defense against diseases and infections.

3.2.2. Oil Absorption Capacity (OAC)

It indicates the rate at which the protein binds to fat in food formulations. The PPP powders carry less OAC than the wheat flour. A higher OAC is found in PPWF1 and PPWF3, while a lower OAC is found in wheat flour. Ubbor and Akobundu (2009) reported that the higher OAC shows the lipophilic nature of flour constituents [41]. The OAC is found to be significant (p > 0.05) with respect to the control group. The increase in oil absorption in PPWF1 and PPWF3 is due to the presence of more hydrophobic proteins, which show superior binding of lipids; thus, a large portion of hydrophilic groups or polar amino acids on the surface of protein molecules results in a decrease in oil absorption.

3.2.3. Swelling Capacity Results

As per Table 6, the swelling capacity of PPP powders is in the range of 15.40–19%, which is within acceptable ranges. The swelling capacity of PPWF flours ranged from 11.77 to 20.18. These details can be seen in Table 6. The swelling capacity of flour depends on the size of particles and types of processing methods or units of operations, as stated by Udomkun et al. [42].

3.2.4. Emulsion Capacity Results

As per Table 7, protein is the main component for emulsion quality [43]. PP powders have shown a range of 36.33 to 43.88% emulsion capacity. While the emulsion capacity of PPWF flours is up to a range of 48.88%, PPWF flours have shown a significance of (p < 0.05) with respect to control group flour.

3.2.5. Foaming Capacity Results

The foam capacity of a protein refers to the amount of interfacial area that can be created by the protein. Foam is a colloidal mixture of many gas bubbles trapped in a liquid or solid. Small air bubbles are surrounded by thin liquid films. The foam capacity of different PPP powders is in the range of 15.22–17.33%. Moreover, the highest foam capacity is in PPWF4, with a value of 25.36%. Then PPWF3 has a value of 24.66%. This variation in foaming capacities is based on the different flours used to substitute wheat flour.

3.3. Physical Analysis Results

The dough size and expansion show the effect of mixing flour. The volume of dough slightly decreases with the addition of PPWF flour in comparison to control flour. Significant changes and differences were observed with the fortification of PPWF flours. The dough expansion is based on the fortification of PPWF flours. The Indian gooseberry retains the water, absorbs a suitable amount of water, and increases the volume of the dough. These values and effects can be seen in Table 8. Thus, loaf volume gets maximized in G2 as compared to G1 and control bread. All the peel and pomace of PPWF3 contribute significantly to the color of the dough, which is much darker compared to the control sample. The L* value decreases as PPWF3 is added in more ratios in G2 as compared to G1 and control. It offers the value of L* as 45.5 in G2 with respect to a value of 76.5 in the control group. As per values of a*, prepared samples are redder than the control group due to the addition of PPWF3 flours. The maximum value of a* is given in G2 as 4.2. The value of b* is higher in G2 due to its yellowish appearance compared to control bread. The hardness of bread is increased with the addition of flour; thus, the highest hardness is exhibited by G2 at 464, while control bread is softer with a hardness value of 310. This is because fiber is included in the flour. This concept can also be observed in kenaf leaf addition in earlier studies and in quinoa addition in flour [44]. There are no significant changes observed in the cohesiveness of G1, G2, or control samples.

3.4. FTIR Analysis Results

The results of the FTIR spectrum are represented in Figure 3. Different bands of FTIR analysis of water populations indicated a rise in strong or weak hydrogen bonds between proteins and water molecules and a deficiency or excess of free water in the gluten protein network. The results of the composite bread sample were compared with those of the control bread. The result of the prepared G2 bread sample showed broadband between 4300 and 4000 cm−1. The peaks at 3349 cm−1 confirm the presence of O–H stretching due to hydrogen bonding; the peaks at 1663.54 and 1925.36 fall in the range between 1650 and 2000, which represents the C-H bending of aromatic compounds. The medium C-H stretching of amine is confirmed by the peak at 1088.73 cm−1; the peak at 670.37 cm−1 represents the strong bending of alkene [45].

3.5. GC-MS Analysis Results

The gas chromatography-mass spectrometry (GC-MS) spectra analysis shows various peaks for the different compounds from the GC fractions of the hexane extract of the G2 bread sample. As per Figure 4, out of many peaks, the highest peaks were identified for the determination of bioactive compounds. The peaks 28.95, 29.02, 32.32, and 32.39 were the identified peaks for the determination of bioactive compounds like oxalic acid, heptadecane, 2,6,10,15 tetramethyl, cinnamylcarbanilate, octane, 3,5-dimethyl Piperazine, isohexylneopentyl ester. The results were slightly higher than the previous study conducted on bread by Kumar Sanjay, et al. [45]. The results of bread were compared with previous studies conducted by Kumar Sanjay, et al. [45] for the study of active compounds.

3.6. XRD Analysis Result

The X-ray detector is analyzed for quantitative and qualitative parameters on the micro- and macrostructures of the native starch compound of bread as per Figure 5. The results revealed that the percentage of crystallinity is quite low and the solubility index is much better, with an intensity peak of 805–1000. This was elucidated by the appearance of diffraction peaks at reflection angles of 7 and 13 degrees. The results are compared with control bread samples. The study report of experimental bread revealed that the diffraction pattern of the composite flour changed to the V-type pattern as against the A-type pattern, characteristic of the composite flour from waste, indicating a loss in starch crystallinity and a gain in solubility.

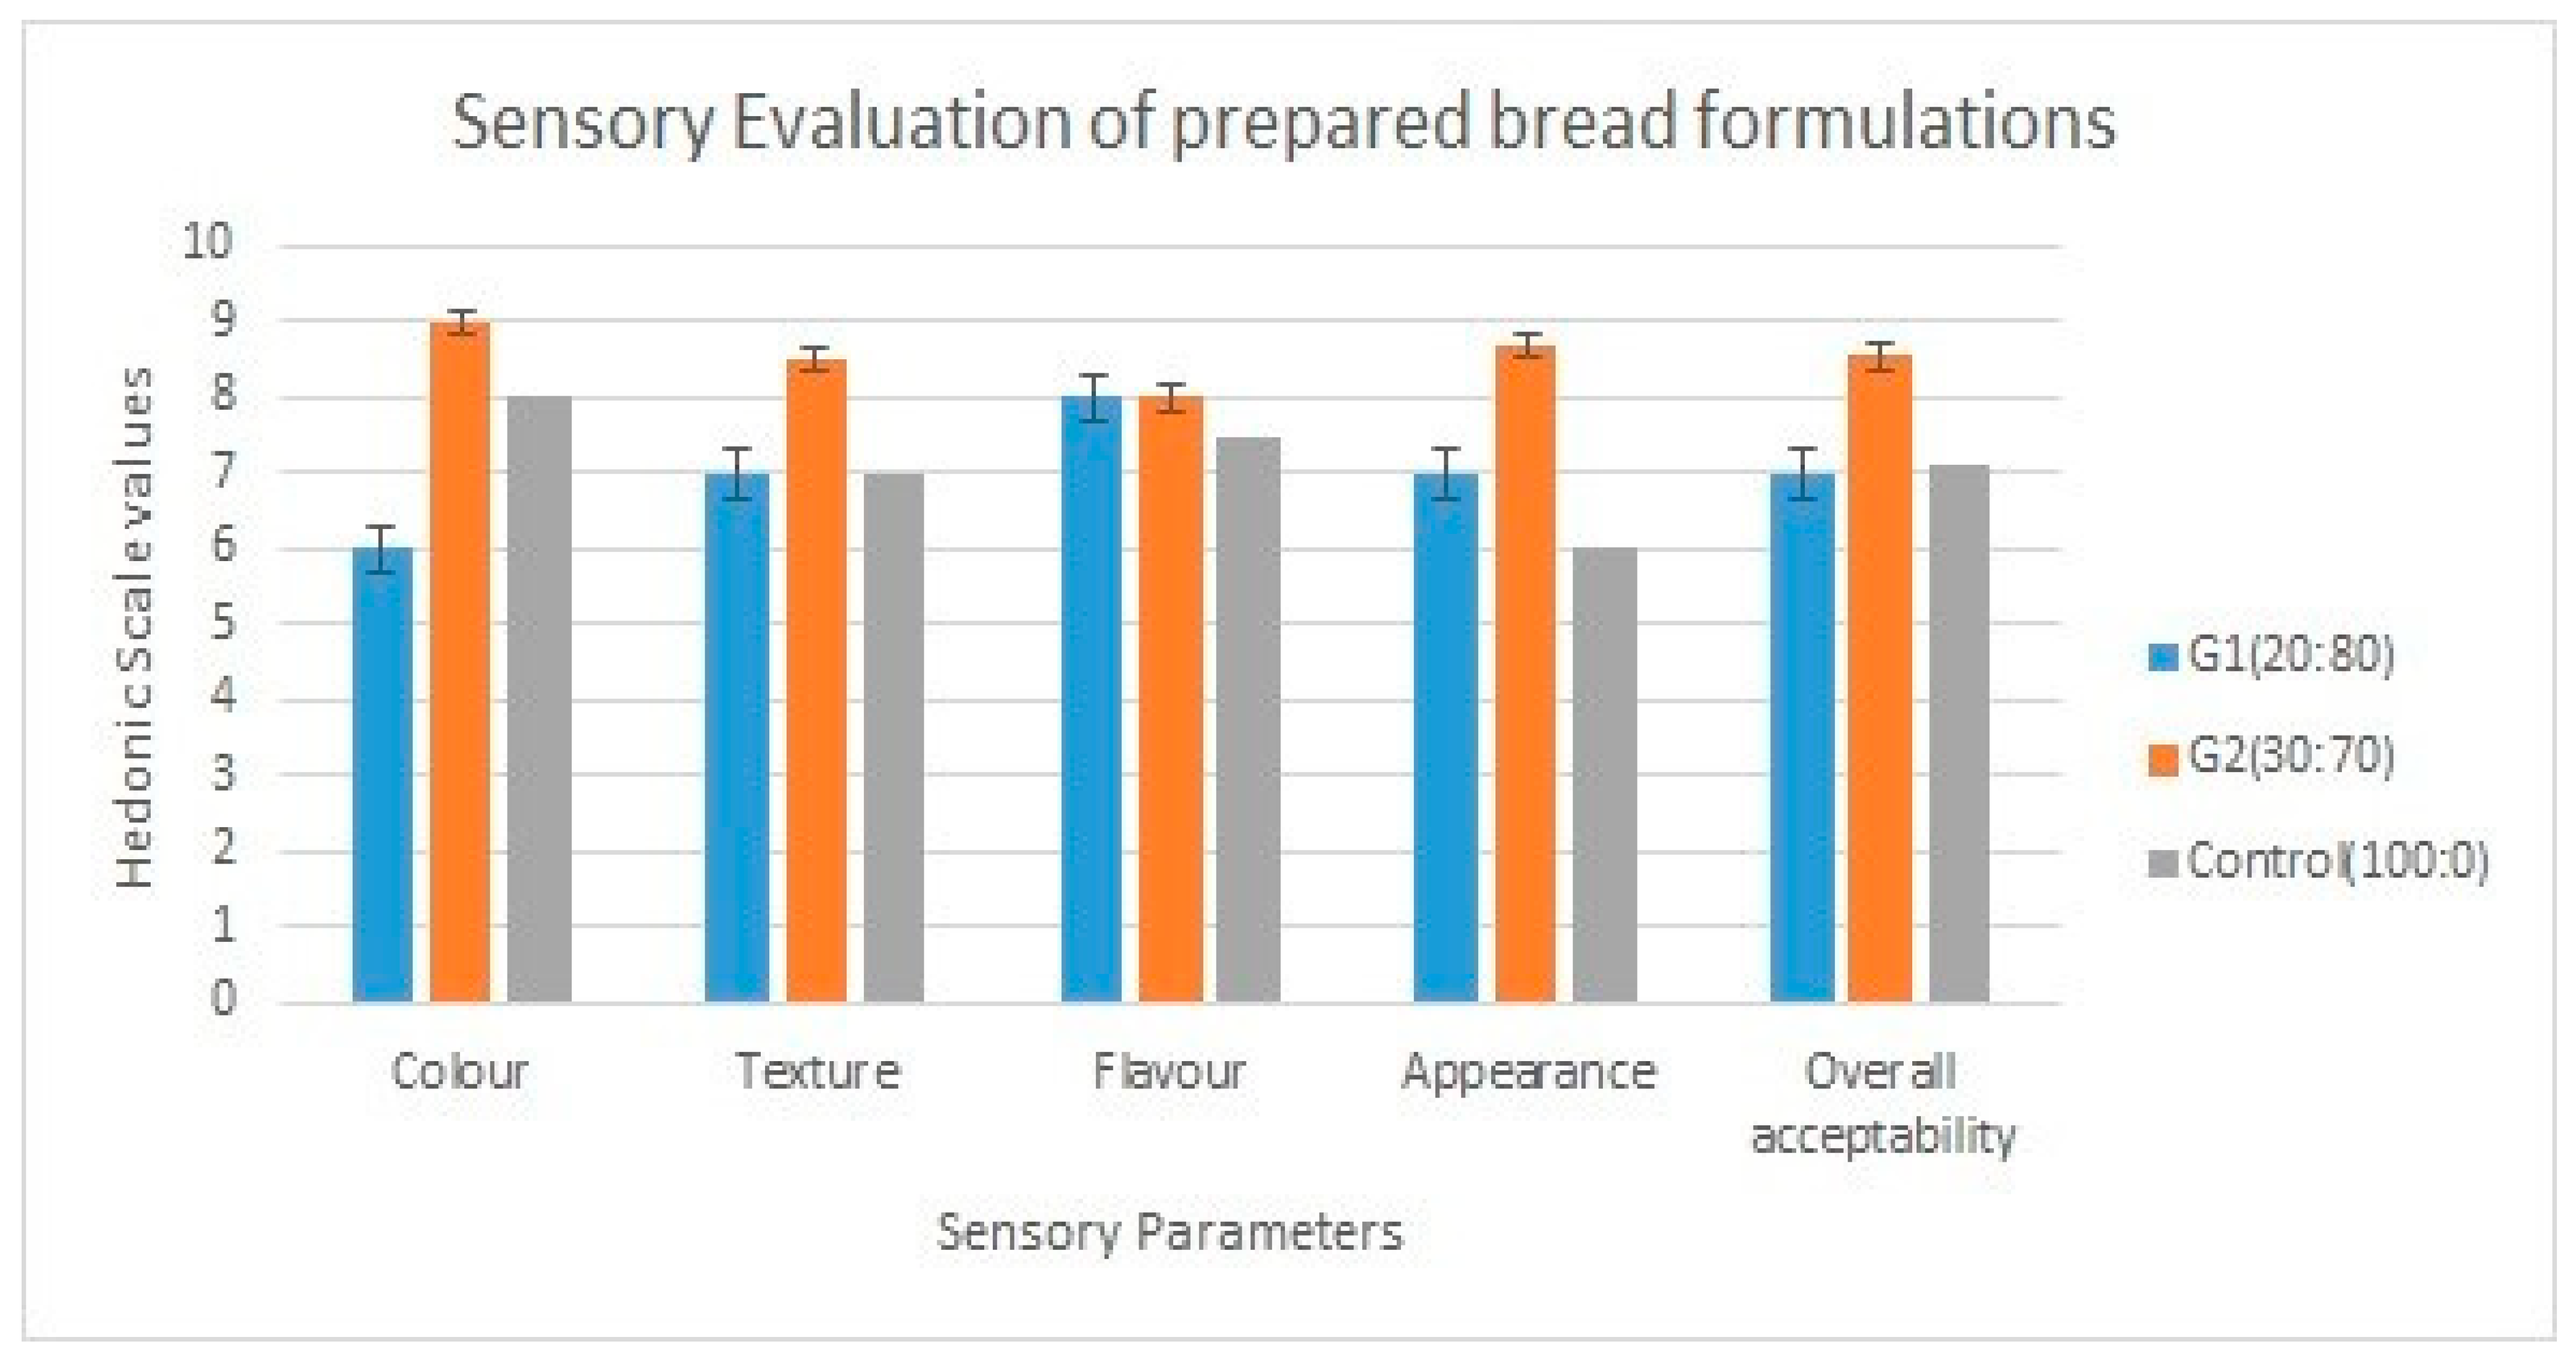
3.7. Sensory Evaluation Results

Sensory attributes may be considered a major factor in the acceptance of any product. The PPWF3 composite flour bread was prepared in two groups, where G2 (30:70) is more acceptable than G1 (20:80) because of the high amount of gooseberry and apple pomace in composite flour. It increased the palatability and color of bread; the G2 bread scored high in the taste and aroma of the bread, which increases the acceptability of bread. G1 got a lower score in color and texture than G2 because of the low ratio of peel and pomace in bread making. The G2 bread has a high color value in the Hedonic scale value, as shown in Figure 6, because of the good amount of pomace in bread preparation. The study revealed that a high amount of potato and bottle guard flour also increases the color score of prepared bread. The highest scores of texture, aroma, and taste are observed in G2, as per Figure 6. Composite-tested bread. Thus, 30% of PPWF3 flour has a balanced effect on taste and texture due to its ingredients. Similar results of the addition of pomace to increase acceptability were reported in Usman et al. [37].

4. Discussion

The formulation of composite bread from food waste for value addition in normal bread was highly effective in the presence of apple pomace. As the results show that the G2 bread was enriched with a total phenolic content of 9.58 ± 0.06 mg/GAE/g in compared to the control bread of 7.46 ± 0.08 mg/GAE/g. The important phenolic acids available in apple pomace are derivatives of hydroxycinnamic acid. The phenolic content increases the antioxidant activity of bread. The fiber content of apple pomace is the best substitute for innovative food development and processing. It acts as a water-absorbing agent in food products and improves intestinal mobility. The apple pomace fiber is comprised of pectin, cellulose, hemicellulose, and gums [37]. The presence of amla pomace to increase the content of vitamin C in composite bread is rarely seen in normal bread. Such a type of formulation with a high level of vitamin C has been used in cookies and biscuits in previous research on the utilization of food waste [30]. The absorption capacity of water in PPP flour is increased by amla and apple pomace, as fiber contents increase water absorption. Apple and amla pomace, like any other fiber source, increase the water absorption capacity of bakery flour and such formulations. The sensory characteristics were also increased by the addition of bottle-guard potato peel and apple pomace powder.

5. Conclusions

Common food wastes like peel and pomace are used as a substitute in whole wheat flour due to their high nutritive contents and as PPP powders for good moisture, fiber, and protein. This makes them suitable for use in food products to enhance the nutritional and functional properties of tested bread samples. This improves the nutritional quality of composite flour bread over wheat flour bread. The inclusion of PPP flour as a substitute for wheat flour improves the PPWF3 flour’s fiber value by 8.6%, protein value by 3.18%, moisture content by 9.5%, vitamin C content by 13.64 mg/100 g, and total phenolic compound by 14.48% compared to the wheat flour values, as their means are significantly different from the control sample. This makes good use of potato, bottle gourd peel, Indian gooseberry, and apple. Indian gooseberry pomace used in making bread increases the vitamin C and fiber content of the bread and enriches other nutritional properties of the bread. As per Figure 4 and Figure 5, the ranges of FTIR and GC-MS show the presence of the bioactive compound in prepared G2 bread. As per Figure 6, the XRD value shows the solubility of bread. The nutritional, functional, and sensory evaluations have shown that PPP, PPWF, and baked tested bread are more nutritious and functionally better in terms of moisture content 27.9%, fiber, vitamin C 2.75%, and TPC 9.26%, as these are significantly different from the control sample at p ≤ 0.05. This will help people eat a healthy variant of bread and will help them keep track of their health and immunity. Moreover, it utilizes food waste in a much more constructive way by offering nutritive bread and fetching value out of the waste.

Author Contributions

Conceptualization, S.U.; Data curation, S.M.G. and V.K.; supervision; R.T.; Investigation, S.U.; Methodology, S.U. and V.K.; Project administration, I.R. and B.S.R.; Resources, B.S.R.; Software, R.T. and D.K.; Supervision, R.T., S.K. and I.R.; Validation, R.T., D.K. and R.K.; Visualization, S.K. and S.M.G.; Writing—original draft, S.U. and R.T.; Writing—review and editing, V.K. and R.K. All authors have read and agreed to the published version of the manuscript.

Funding

This research received no external funding.

Institutional Review Board Statement

Not applicable.

Informed Consent Statement

Not applicable.

Data Availability Statement

Not applicable.

Acknowledgments

VK wants to acknowledge that this paper has been supported by the RUDN University Strategic Academic Leadership Program. S.U. wants to acknowledge R&D, /SHODH/202111 UPES and SoHST UPES for lab support and facilities.

Conflicts of Interest

The authors declare no conflict of interest.

References

  1. Morone, P.; Koutinas, A.; Gathergood, N.; Arshadi, M.; Matharu, A. Food waste: Challenges and opportunities for enhancing the emerging bio-economy. J. Clean. Prod. 2019, 221, 10–16. [Google Scholar] [CrossRef]
  2. Forbes, H.; Quested, T.; O’Connor, C. Food Waste Index Report 2021; United Nations Environment Programme: Nairobi, Kenya, 2021. [Google Scholar]
  3. Yun, Y.M.; Lee, M.K.; Im, S.W.; Marone, A.; Trably, E.; Shin, S.R.; Kim, M.G.; Cho, S.K.; Kim, D.H. Biohydrogen production from food waste: Current status, limitations, and future perspectives. Bioresour. Technol. 2018, 248, 79–87. [Google Scholar] [CrossRef]
  4. Rico, X.; Gullón, B.; Alonso, J.L.; Yáñez, R. Recovery of high value-added compounds from pineap-ple, melon, watermelon and pumpkin processing by-products: An overview. Food Res. Int. 2020, 132, 109086. [Google Scholar] [CrossRef] [PubMed]
  5. Shahidi, F.; Varatharajan, V.; Peng, H.; Senadheera, R. Utilization of marine by-products for the recovery of value-added products. J. Food Bioact. 2019, 6, 10–61. [Google Scholar] [CrossRef]
  6. Gaurav, N. Current scenario and future perspectives of nanotechnology in sustainable agriculture and food production. Plant Cell Biotechnol. Mol. Biol. 2021, 22, 99–121. [Google Scholar]
  7. Shashikant, M.; Bains, A.; Chawla, P.; Sharma, M.; Kaushik, R.; Kandi, S.; Kuhad, R.C. In-vitro antimicrobial and anti-inflammatory activity of modified solvent evaporated ethanolic extract of Calocybe indica: GCMS and HPLC characterization. Int. J. Food Microbiol. 2022, 376, 109741. [Google Scholar] [CrossRef] [PubMed]
  8. Cauvain, S.P. Other cereals in breadmaking. In Technology of Breadmaking; Springer: Berlin/Heidelberg, Germany, 2007; pp. 371–388. ISBN 0387385630. [Google Scholar]
  9. Sridhar, A.; Kapoor, A.; Senthil, P.; Ponnuchamy, M.; Balasubramanian, S.; Prabhakar, S. Conversion of food waste to energy: A focus on sustainability and life cycle assessment. Fuel 2021, 302, 121069. [Google Scholar] [CrossRef]
  10. Kumar, V.; Jaiswal, K.K.; Tomar, M.S.; Rajput, V.; Upadhyay, S.; Nanda, M.; Vlaskin, M.S.; Kumar, S.; Kurbatova, A. Production of high value-added biomolecules by microalgae cultivation in wastewater from anaerobic digestates of food waste: A review. Biomass Convers. Biorefinery 2021, 13, 9625–9642. [Google Scholar] [CrossRef]
  11. Lister, C.E.; Lancaster, J.E.; Walker, J.R.L. Phenylalanine ammonia-lyase (PAL) activity and its relationship to anthocyanin and flavonoid levels in New Zealand-grown apple cultivars. J. Am. Soc. Hortic. Sci. 1996, 121, 281–285. [Google Scholar] [CrossRef]
  12. Tulasi, G.; Deepika, U.; Venkateshwarlu, P.; Santhosh, V.; Srilatha, P. Development of millet based instant soup mix and Pulav mix. IJCS 2020, 8, 832–835. [Google Scholar] [CrossRef]
  13. Gajera, R.R.; Joshi, D.C.; Ravani, A. Processing potential of bottle gourd (L. siceraria) Fruits: An overview. Int. J. Herb. Med. 2017, 16, 16–40. [Google Scholar]
  14. Javed, A.; Ahmad, A.; Tahir, A.; Shabbir, U.; Nouman, M.; Hameed, A. Potato peel waste-its nutraceutical, industrial and biotechnological applacations. AIMS Agric. Food 2019, 4, 807–823. [Google Scholar] [CrossRef]
  15. Torbica, A.; Blažek, K.M.; Belović, M.; Hajnal, E.J. Quality prediction of bread made from composite flours using different parameters of empirical rheology. J. Cereal Sci. 2019, 89, 102812. [Google Scholar] [CrossRef]
  16. Ohimain, E.I. The prospects and challenges of cassava inclusion in wheat bread policy in Nigeria. Int. J. Sci. Technol. Soc. 2014, 2, 6–17. [Google Scholar] [CrossRef]
  17. Shittu, T.A.; Raji, A.O.; Sanni, L.O. Bread from composite cassava-wheat flour: I. Effect of baking time and temperature on some physical properties of bread loaf. Food Res. Int. 2007, 40, 280–290. [Google Scholar] [CrossRef]
  18. Chowdhury, M.A.; Hossain, N.; Kashem, M.A.; Shahid, M.A.; Alam, A.; Swieca, M.; Skeczyk, L.; Gawlik-Dziki, U.; Dziki, D.; Rekowski, A.; et al. A comparative study on the chemical composition of wild and cuntivated germaplasm of Phaseolus lunatus L. Waste Manag. 2020, 7, 296–305. [Google Scholar] [CrossRef]
  19. Chowdhury, M.A.; Hossain, N.; Kashem, M.A.; Shahid, M.A.; Alam, A. Immune response in COVID-19: A review. J. Infect. Public Health 2020, 13, 1619–1629. [Google Scholar] [CrossRef]
  20. Aman, F.; Masood, S. How Nutrition can help to fight against COVID-19 Pandemic. Pakistan J. Med. Sci. 2020, 36, S121. [Google Scholar] [CrossRef]
  21. Xiao, H.-W.; Pan, Z.; Deng, L.-Z.; El-Mashad, H.M.; Yang, X.-H.; Mujumdar, A.S.; Gao, Z.-J.; Zhang, Q. Recent developments and trends in thermal blanching—A comprehensive review. Inf. Process. Agric. 2017, 4, 101–127. [Google Scholar] [CrossRef]
  22. ICMR-NiN Short Report of Nutritional requiremnets of Indians-RDA and Estimated Average Requirements-ICMR-NiN 2020. Available online: https://www.nin.res.in/RDA_short_Report_2020.html (accessed on 28 April 2023).
  23. Chandra, S.; Singh, S.; Kumari, D. Evaluation of functional properties of composite flours and sensorial attributes of composite flour biscuits. J. Food Sci. Technol. 2015, 52, 3681–3688. [Google Scholar] [CrossRef]
  24. Paulami, G.; Upadhyay, S. Food Waste Management and Nutrient Recycling in a Sustainable Way—A Review. In International Conference on Advances and Innovations in Recycling Engineering; Springer Nature: Berlin/Heidelberg, Germany, 2021; pp. 157–164. [Google Scholar]
  25. Al-Attabi, Z.H.; Merghani, T.M.; Ali, A.; Rahman, M.S. Effect of barley flour addition on the physico-chemical properties of dough and structure of bread. J. Cereal Sci. 2017, 75, 61–68. [Google Scholar] [CrossRef]
  26. Živančev, D.; Torbica, A.; Tomić, J.; Janić-Hajnal, E. Possibility of utilization alternative cereals (millet and barley) for improvement technological properties of bread gained from flour of poor technological quality. J. Process. Energy Agric. 2016, 20, 165–169. [Google Scholar]
  27. AAACC, American Association of Cereal Chemists. Approved Methods Committee. In Approved Methods of the American Association of Cereal Chemists; Amer Assn of Cereal Chemists: St Paul, MN, USA, 2000; Volume 1. [Google Scholar]
  28. Rekowski, A.; Langenkämper, G.; Dier, M.; Wimmer, M.A.; Scherf, K.A.; Zörb, C. Determination of soluble wheat protein fractions using the Bradford assay. Cereal Chem. 2021, 98, 1059–1065. [Google Scholar] [CrossRef]
  29. Sudha, M.L.; Baskaran, V.; Leelavathi, K. Apple pomace as a source of dietary fiber and polyphenols and its effect on the rheological characteristics and cake making. Food Chem. 2007, 104, 686–692. [Google Scholar] [CrossRef]
  30. Kohli, D.; Kumar, A.; Kumar, S.; Upadhyay, S. Waste Utilization of Amla Pomace and Germinated Finger Millets for Value Addition of Biscuits. Curr. Res. Nutr. Food Sci. J. 2019, 7, 272–279. [Google Scholar] [CrossRef]
  31. Mecozzi, M. Estimation of total carbohydrate amount in environmental samples by the phenol--sulphuric acid method assisted by multivariate calibration. Chemom. Intell. Lab. Syst. 2005, 79, 84–90. [Google Scholar] [CrossRef]
  32. Chandra, P.; Singh, I.S.; Singh, S.B. Biochemical changes during flowering of sugarcane. Sugar Tech. 2005, 7, 160–162. [Google Scholar] [CrossRef]
  33. Giami, S.Y. Comparison of bread making properties of composite flour from kernels of roasted and boiled African bread fruit (Treculia Africana decne) seeds. J. Mat. Res. 2004, 1, 16–25. [Google Scholar]
  34. Lim, P.Y.; Sim, Y.Y.; Nyam, K.L. Influence of kenaf (Hibiscus cannabinus L.) leaves powder on the physico-chemical, antioxidant and sensorial properties of wheat bread. J. Food Meas. Charact. 2020, 14, 2425–2432. [Google Scholar] [CrossRef]
  35. Arya, S.S.; Shakya, N.K. High fiber, low glycaemic index (GI) prebiotic multigrain functional beverage from barnyard, foxtail and kodo millet. LWT 2021, 135, 109991. [Google Scholar] [CrossRef]
  36. Ranganna, S. Handbook of Analysis and Quality Control for Fruits and Vegetables Products; Tata Me Graw-Hill: New York, NY, USA, 2000. [Google Scholar]
  37. Usman, M.; Ahmed, S.; Mehmood, A.; Bilal, M.; Patil, P.J.; Akram, K.; Farooq, U. Effect of apple pomace on nutrition, rheology of dough and cookies quality. J. Food Sci. Technol. 2020, 57, 3244–3251. [Google Scholar] [CrossRef] [PubMed]
  38. Nasir, M.; Butt, M.S.; Anjum, F.M.; Sharif, K.; Minhas, R. Effect of moisture on the shelf life of wheat flour. Int. J. Agric. Biol 2003, 5, 458–459. [Google Scholar]
  39. Daubert, C.R.; Foegeding, E.A. Rheological principles for food analysis. In Food Analysis; Springer: Berlin/Heidelberg, Germany, 2010; pp. 541–554. [Google Scholar]
  40. Wang, Z.; Li, Y.; Yang, Y.; Liu, X.; Qin, H.; Dong, Z.; Zheng, S.; Zhang, K. New insight into the function of wheat glutenin proteins as investigated with two series of genetic mutants. Sci. Rep. 2017, 7, 3428. [Google Scholar] [CrossRef] [PubMed]
  41. Ubbor, S.C.; Akobundu, E.N.T. Quality characteristics of cookies from composite flours of watermelon seed, cassava and wheat. Pakistan J. Nutr. 2009, 8, 1097–1102. [Google Scholar] [CrossRef]
  42. Udomkun, P.; Tirawattanawanich, C.; Ilukor, J.; Sridonpai, P.; Njukwe, E.; Nimbona, P.; Vanlauwe, B. Promoting the use of locally produced crops in making cereal-legume-based composite flours: An assessment of nutrient, antinutrient, mineral molar ratios, and aflatoxin content. Food Chem. 2019, 286, 651–658. [Google Scholar] [CrossRef]
  43. Phillips, G.O.; Williams, P.A. Handbook of Hydrocolloids; Elsevier: Amsterdam, The Netherlands, 2009. [Google Scholar]
  44. Swieca, M.; Skeczyk, L.; Gawlik-Dziki, U.; Dziki, D. Bread enriched with quinoa leaves-the influence of protein-phenolics interactions on the nutritional and antioxidant quality. Food Chem. 2014, 162, 54–62. [Google Scholar] [CrossRef]
  45. Kumar, S.; Krishali, V.; Purohit, P.; Saini, I.; Kumar, V.; Singh, S.; Upadhyay, S.; Joshi, H.C.; Wilson, I.; Singh Tomar, M. Physicochemical properties, nutritional and sensory quality of low-fat Ashwagandha and Giloy-fortified sponge cakes during storage. J. Food Process. Preserv. 2022, 46, e16280. [Google Scholar] [CrossRef]
Figure 1. Challenges and Contributions for Preparing Peel-Pomace-Powder-based composite bread.
Sustainability 15 13079 g001
Figure 2. Flowchart for Preparation of Peel-Pomace-Powder.
Sustainability 15 13079 g002
Figure 3. FTIR analysis of G2 bread sample.
Sustainability 15 13079 g003
Figure 4. GC-MS spectra of G2 bread sample.
Sustainability 15 13079 g004
Figure 5. XRD image of G2 bread sample.
Sustainability 15 13079 g005
Figure 6. Sensory evaluation of prepared bread formulations Hedonic scale values: 1–9.
Sustainability 15 13079 g006
Table 1. Composition of different flour of PPWF (Peel-Pomace-Wheat-Flour).
Flour MixApple Pomace PowderIndian Gooseberry Pomace PowderPotato Peel PowderBottle Gourd Peel PowderWhole Wheat Flour
PPWF110%5%5%4%76%
PPWF215%10%10%8%57%
PPWF320%15%15%12%38%
PPWF425%20%20%16%19%
Table 2. List of all ingredients used for bread formulation.
IngredientsG1 (20–80%)G2 (30–70%)Control 100%
Refined wheat flour80 g70 g100 g
PPWF320 g30 g0 g
Lukewarm Water (43 °C)60 mL60 mL60 mL
Salt2 g2 g2 g
Baker’s yeast6 g6 g6 g
Sugar4 g4 g4 g
SoybeanCookingOil2 mL2 mL2 mL
Table 3. Nutritional and functional analysis of PPP Powders.
AttributesApple Pomace
Powder
Indian Gooseberry Pomace PowderPotato Peels
Powder
Bottle Gourd Peels PowdersWhole Wheat
Flour
Moisture (%)5.5 ± 0.289.31 ± 0.1611.44 ± 0.049.40 ± 0.0412.3 ± 0.28
Ash (%)1.89 ± 0.100.86 ± 0.092.92 ± 0.043.92 ± 0.011.5 ± 0.07
Fat (%)4.15 ± 0.196.14 ± 0.202.42 ± 0.032.43 ± 0.121.7 ± 0.36
Fiber (%)10.15 ± 1.1913.15 ± 0.298.15 ± 0.227.24 ± 0.130.3 ± 0.11
Pectin (%)10.2 ± 0.214.27 ± 0.280.64 ± 0.421.17 ± 0.21Non Detectable
Vitamin C
(mg/g)
10.54 ± 0.17272.71 ± 0.062.14 ± 0.0713.53 ± 0.051.48 ± 0.06
Protein (%)1.53 ± 0.051.77 ± 0.112.17 ± 0.072.74 ± 0.0711.79 ± 0.10
WAC (%) a418.66 ± 3.53831 ± 33.94367.33 ± 8.48316 ± 12.72129 ± 16.26
OAC (%) b132 ± 5.65454 ± 5.65168.66 ± 13.43152 ± 10.60169 ± 16.97
TPC
(mg/GAE/g) c
10.447 ± 0.0645.754 ± 0.082.144 ± 0.036.467 ± 0.032.23 ± 0.05
TS (mg/g) d121.35 ± 0.1272.54 ± 0.2041.40 ± 0.2495.33 ± 0.1825.14 ± 0.10
RS (mg/g) e16.19 ± 0.3034.71 ± 0.3223.69 ± 0.063.37 ± 0.1211.41 ± 0.13
NRS (mg/g) f99.79 ± 0.1635.75 ± 0.0517.08 ± 0.00287.33 ± 0.0813 ± 0.02
a Water Absorption Capacity, b Oil Absorption Capacity, c Total Phenolic Compound, d Total Sugar, e Reducing Sugar, f Non-Reducing Sugar.
Table 4. Nutritional and functional analysis of PPWF flours with control group refined wheat flour.
ParametersPPWF1PPWF2PPWF3PPWF4Control
Moisture (%)12.246 ± 0.309.5 ± 0.289.5 ± 0.07 a9.38 ± 0.3712.2 ± 0.28 b
Ash (%)3.30 ± 0.233.5 ± 0.282.58 ± 0.23 a4.67 ± 0.140.50 ± 0.07 a
Fat (%)1.5 ± 0.285.17 ± 0.053.3 ± 0.28 a3.15 ± 0.031.74 ± 0.36 a
Fiber (%)6.26 ± 0.117.28 ± 0.018.16 ± 0.17 a8.28 ± 0.013.16 ± 0.11 b
Protein (%)2.57 ± 0.142.82 ± 0.043.18 ± 0.06 a3.16 ± 0.0910.79 ± 0.10 b
Vitamin C
(mg/100g)
7.16 ± 0.118.28 ± 0.0113.64 ± 0.09 a4.4 ± 0.491.48 ± 0.06 b
WAC (%)424.66 ± 2.12424.4 ± 13.43431.4± 25.45 a460.4 ± 8.48129.4 ± 16.26 a
OAC (%)255.66 ± 8.48231.66 ± 24.78253 ± 2.82 a235.66 ± 13.43169 ± 16.97 a
TPC
(mg/GAE/g)
13.34 ± 0.0611.89 ± 0.0814.48 ± 0.11 a13.27 ± 0.092.23 ± 0.05 b
TS (mg/g)93.56 ± 0.31105.67 ± 0.2678.66 ± 0.29 a59.31 ± 0.1225.14 ± 0.10 b
RS (mg/g)47.48 ± 0.0366.54 ± 0.1038.05 ± 3.26 a41.55 ± 0.1511.41 ± 0.13 b
NRS (mg/g)43.77 ± 0.3337.17 ± 0.3541.14 ± 0.55 a16.87 ± 0.0313 ± 0.02 b
WAC—Water Absorption Capacity, OAC—Oil Absorption Capacity, TPC—Total Phenolic Compound, TS—Total Sugar, RS—Reducing Sugar, NRS—Non-Reducing Sugar, Mean, and standard deviation values in the same row with different superscripts differ significantly (p < 0.05).
Table 5. Nutritional and function analysis of prepared bread with control group refined wheat flour.
Parameters100%G1 (20–80)%G2 (30–70)%
Moisture Content (%)20.31 ± 0.40 a30.5 ± 0.28 b27.9 ± 0.09 b
Ash Content (%)4.7 ± 0.25 a4.8 ± 0.11 a5.4 ± 0.01 b
Fat (%)3.44 ± 0.28 a3.26 ± 0.14 a8.24 ± 0.35 b
Protein (%)2.3 ± 0.19 a2.42 ± 0.05 a2.44 ± 0.42 a
Fibre (%)2.57 ± 0.06 a5.1 ± 0.35 b4.95 ± 0.14 b
Carbohydrates (%)65.41 ± 0.26 a54.32 ± 0.57 b70.36 ± 0.15 ab
Energy (Kcal/100 gm)303.04 ± 0.04 a255.2 ± 0.21 b365.46 ± 0.52 ab
Vitamin C (mg/100g)2.18 ± 0.07 a2.11 ± 0.01 a2.75 ± 0.008 b
TPC (mg/GAE/g)7.46 ± 0.08 a9.58 ± 0.06 b9.26 ± 0.10 b
TS (mg/g)121 ± 0.14 a72 ± 60 b48.5 ± 0.05 ab
RS (mg/g)28.41 ± 0.15 a22.35 ± 0.13 b34.6 ± 0.32 ab
NRS (mg/g)88.26 ± 0.28 a47.74 ± 0.01 b13.20 ± 0.25 ab
TPC—Total Phenolic Compound, TS—Total Sugar, RS—Reducing Sugar, NRS—Non-Reducing Sugar, Mean, and standard deviation values in the same row with different superscripts differ significantly (p < 0.05).
Table 6. Swelling, Emulsion, and Foaming Capacity of PPP powders.
AttributesApple Pomace
Powder
Amla Pomace
Powder
Potato Peels PowderBottle Gourd
Peels
Swelling capacity(mL)17.60 ± 1.8515.40 ± 1.8519.00 ± 0.7117.40 ± 1.85
Emulsion capacity (%)36.33 ± 3.0538.4 ± 3.2241.66 ± 3.7743.88 ± 4.12
Foaming capacity (%)16.9 ± 4.0017.2 ± 5.315.22 ± 4.0417.33 ± 3.23
Table 7. Swelling, Emulsion, and Foaming Capacity of PPWF flours.
ParametersPPWF1PPWF2PPWF3PPWF4Control
Swelling capacity(mL)17.30 ± 1.8518.20 ± 0.8120.18 ± 0.7119.45 ± 0.5611.77 ± 0.51
Emulsion capacity (%)47.88 ± 5.1248.88 ± 4.1241.88 ± 3.5233.88 ± 5.1223.88 ± 4.12
Foaming capacity (%)20.72 ± 5.0321.12 ± 4.724.66 ± 5.525.36 ± 5.7712.42 ± 5.3
Table 8. Effect of PPWF3 flour substitution on physical characteristics of the breads.
Parameters100%G1 (20–80)%G2 (30–70)%
Loaf weight (g)93.8 ± 1.68 a96.2 ± 3.7 a96.17 ± 0.88 a
Loaf Volume (cm3)349 ± 2.6 a302 ± 24.1 a247 ± 12.4 b
Specific Volume (cm3/g)3.68 ± 0.07 a3.60 ± 0.07 a3.96 ± 0.06 b
Color
L*
74.9 ± 0.08 a55.7 ± 1.6 b42.9 ± 1.25 c
a*1.59 ± 0.17 b2.39 ± 0.70 b3.84 ± 0.46 a
b*21.6 ± 0.17 b36.0 ± 2.98 a37.0 ± 1.97 a
Hardness317 ± 62.6 c421 ± 71.2 a464 ± 76.4 b
Cohesiveness0.89 ± 0.04 a0.84 ± 0.02 a0.82 ± 0.01 a
Mean and standard deviation values in the same row with different superscripts differ significantly (p < 0.05).
Disclaimer/Publisher’s Note: The statements, opinions and data contained in all publications are solely those of the individual author(s) and contributor(s) and not of MDPI and/or the editor(s). MDPI and/or the editor(s) disclaim responsibility for any injury to people or property resulting from any ideas, methods, instructions or products referred to in the content.

