
Analysis of the Spatial and Temporal Evolution of Energy-Related CO2 Emissions in China’s Coastal Areas and the Drivers of Industrial Enterprises above Designated Size—The Case of 82 Cities

Abstract
:1. Introduction
2. Methods
2.1. Overview of the Study Area and Data Sources
2.1.1. Overview of the Study Area
2.1.2. Data Sources
2.2. Research Methodology
2.2.1. City-Scale CO2 Emission Accounting
2.2.2. Exploring Spatial Data Analysis (ESDA)
2.2.3. LMDI Model
3. Results and Analysis
3.1. Characterization of the Temporal Evolution of CO2 Emissions
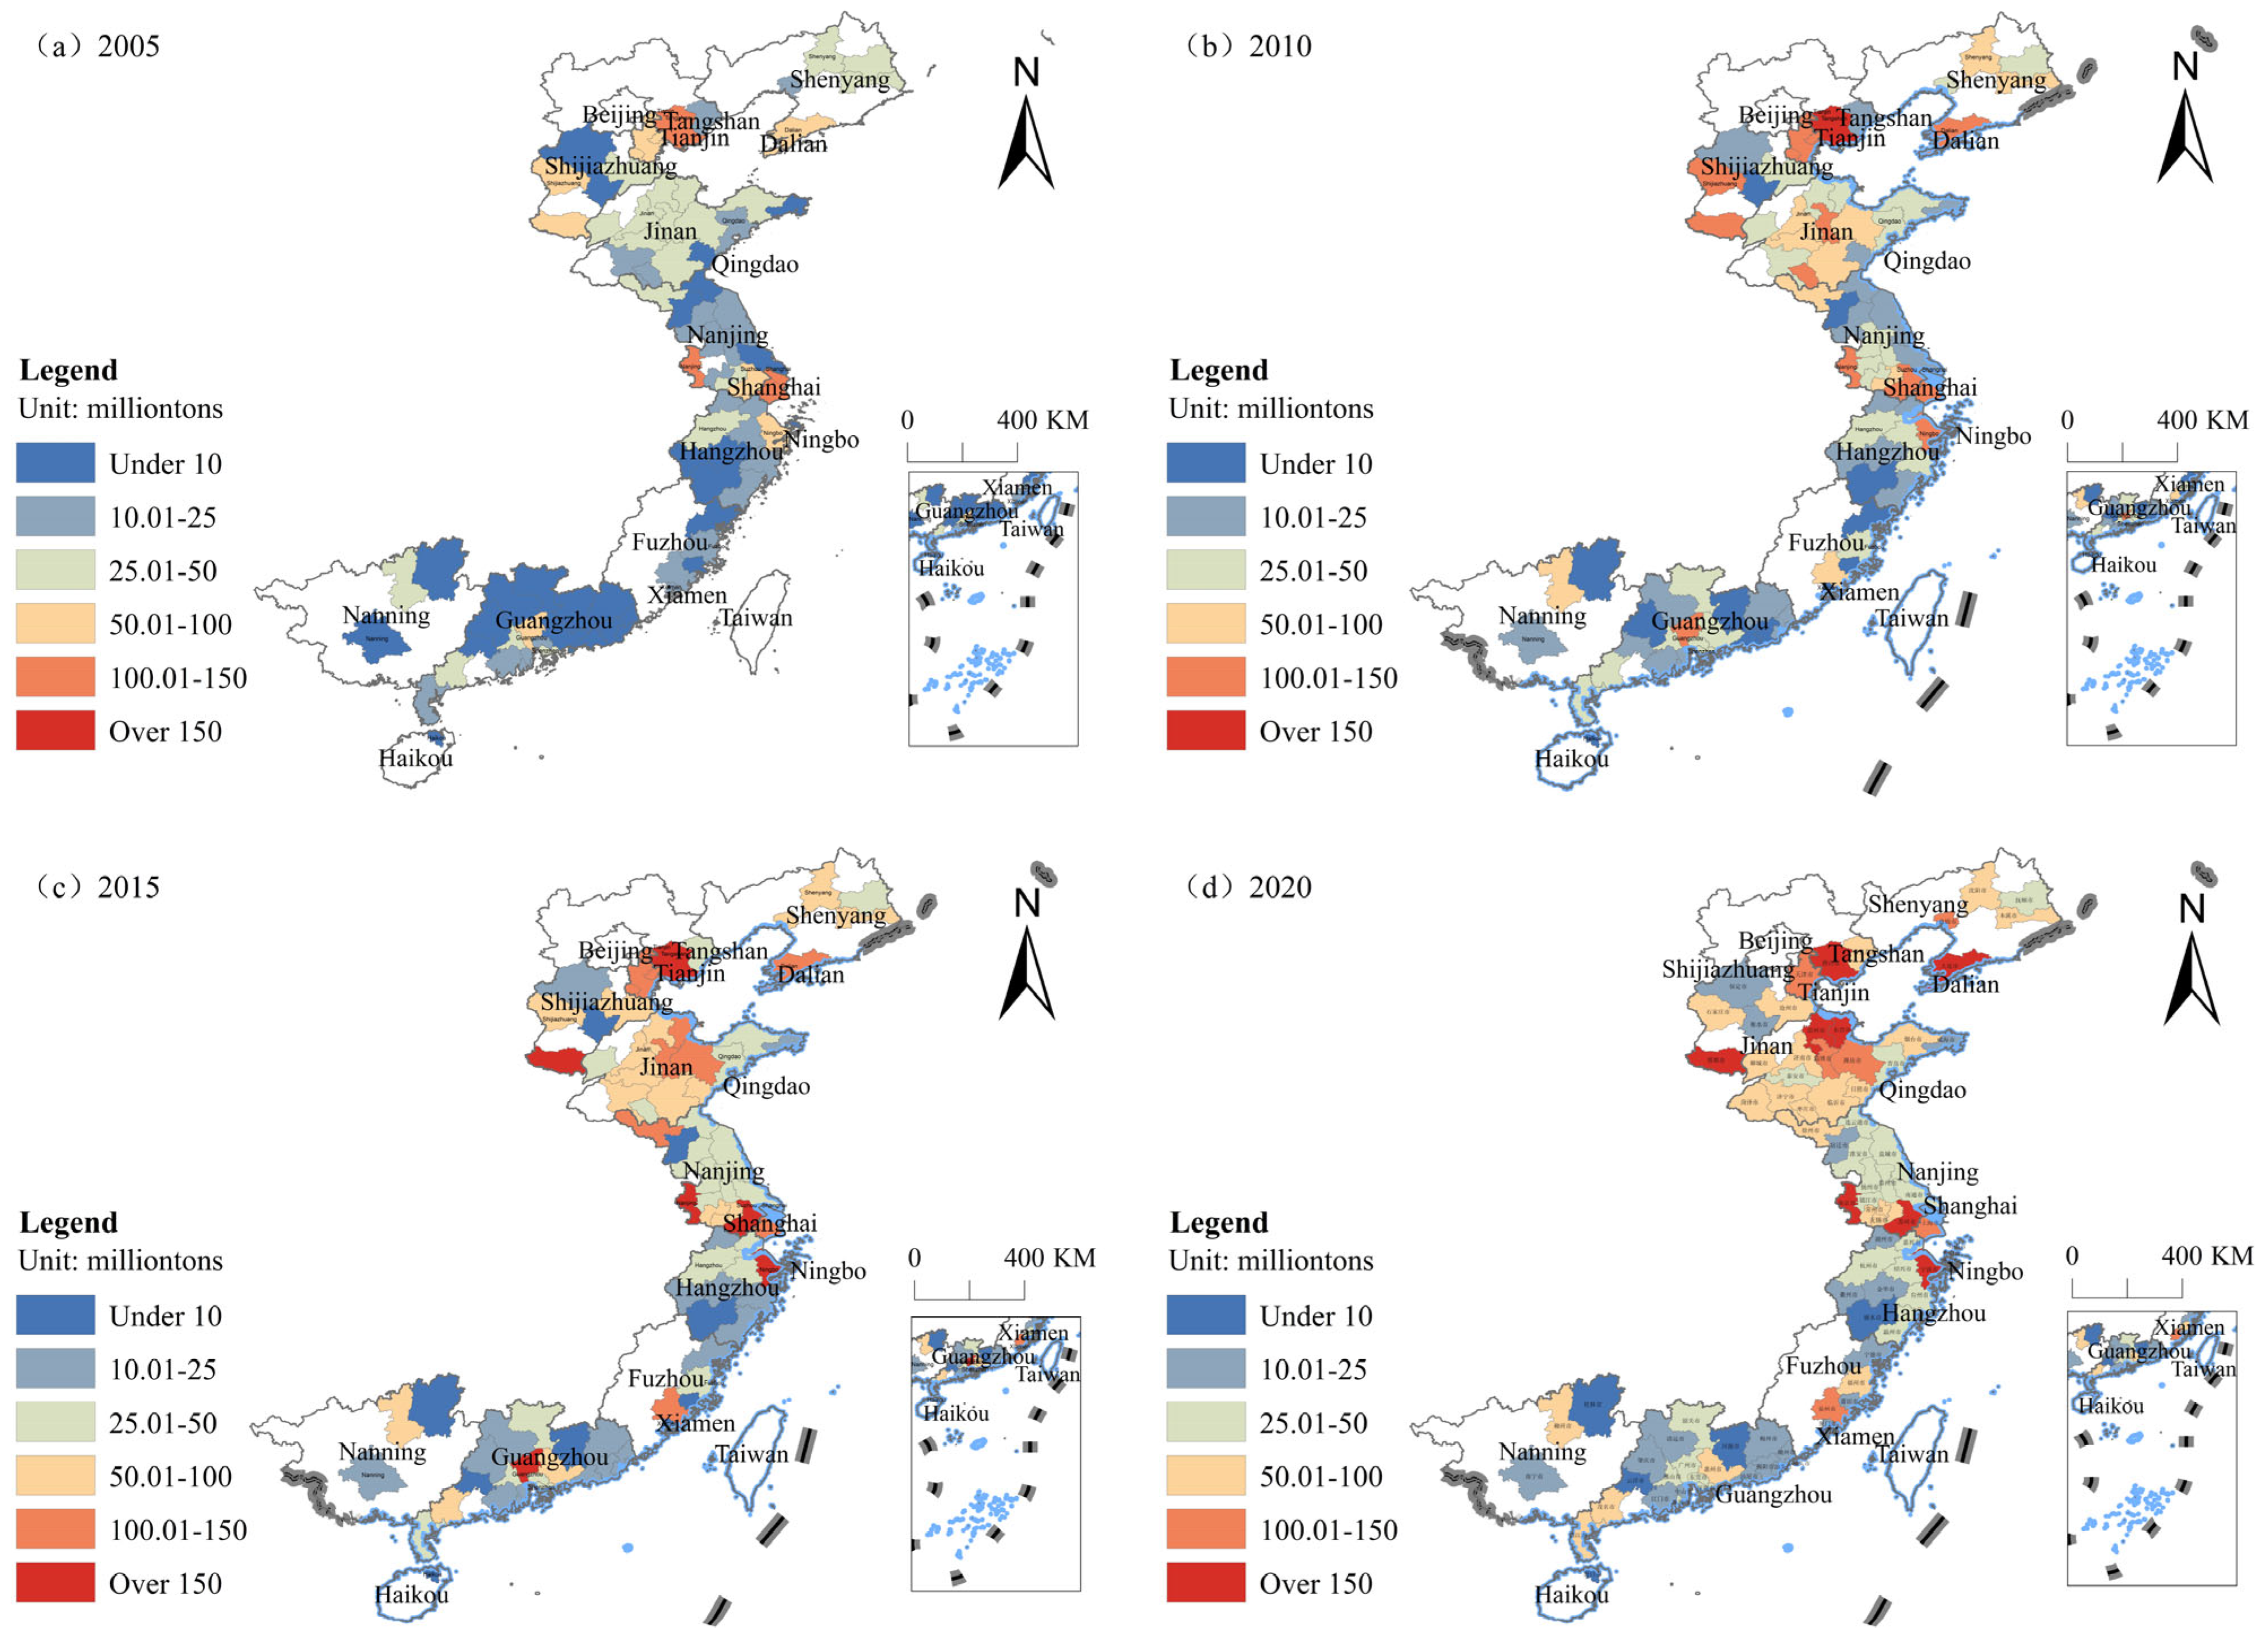
3.2. Characteristics of the Spatial Evolution of CO2 Emission Intensity
3.3. Factor Decomposition of Urban Energy-Related CO2 Emissions in China’s Coastal Region
3.3.1. Output Scale Effect
3.3.2. Labor Productivity Effect
3.3.3. Per Capita Energy Consumption Intensity Effect
3.3.4. Other Effects
4. Discussion
5. Conclusions
- (1)
- CO2 emissions in China’s coastal region are growing rapidly, from 2152.23 million tons in 2005 to 52,477.77 million tons in 2020. This represents an increase of approximately 2.5-fold, and it has an overall fluctuating upward trend.
- (2)
- The energy-related CO2 emissions of a small number of cities in China’s coastal region show a trend of steady growth to reach the peak and then a slow decline. Consequently, this type of city will be expected to realize the goals of “carbon peak” and “carbon neutrality” ahead of schedule, while resource cities will have to realize the goals of “dual carbon” and “carbon neutrality”. In order to achieve the “double carbon” goal, it is necessary to consider adjusting the energy structure and optimizing the industrial structure.
- (3)
- During the study period, the CO2 emission intensity of China’s coastal regions had obvious spatial positive correlation and spatial agglomeration characteristics, and its spatial correlation tended to weaken and then strengthen.
- (4)
- Overall, among the five factors affecting the change in CO2 emissions from energy consumption by the industrial sector in China’s coastal regions, the pull effect is higher than the inhibitory effect, the scale of economic output of the industrial sector is the biggest pull factor and the labor productivity effect is the biggest inhibitory factor.
Author Contributions
Funding
Institutional Review Board Statement
Informed Consent Statement
Data Availability Statement
Acknowledgments
Conflicts of Interest
References
- At the Forefront in Taking the Lead in Realizing Socialist Modernization (Along the Footsteps of the General Secretary-Jiangsu). Beijing: People’s Daily. Available online: http://paper.people.com.cn (accessed on 10 July 2023).
- Xi, J.P. Hold High the Great Banner of Socialism with Chinese Characteristics and Unite for Building a Modernized Socialist Country in All Aspects. People’s Daily. 2022. Available online: http://dm.china-embassy.gov.cn/eng/zgxw/202211/P020221101112630789457.pdf (accessed on 10 July 2023).
- State Council of the People’s Republic of China. Report on the Work of the Government in 2023. Available online: https://www.gov.cn/zhuanti/2023lhzfgzbg/index (accessed on 10 July 2023).
- Wang, X.M.; Wu, J.; Wang, Z.; Jia, X.T.; Bai, B. Accounting and characterization of CO2 emissions in Chinese cities. Urban Environ. Res. 2020, 8, 67–80. [Google Scholar]
- Wang, X.M.; Wu, J.; Bai, B.; Wang, Z. Spatial differentiation and drivers of CO2 emissions in China-an analysis based on data from 198 prefecture-level and above cities. Econ. Geogr. 2020, 40, 29–38. [Google Scholar]
- Tiao, Z.; Dong, K.L.; Wu, F.P. Study on the measurement of total CO2 emissions from end-use energy consumption and driving factors in Jiangsu Province. China Popul. Resour. Environ. 2015, 25, 19–27. [Google Scholar]
- Gu, Z.F.; Xu, L.H.; Ma, Q.W.; Shi, Y.J.; Lu, Z.W.; Wu, Y.Q. Spatial and temporal evolution of carbon emissions and its influencing factors in Zhejiang metropolitan area. J. Nat. Resour. 2022, 37, 1524–1539. [Google Scholar]
- Lin, X.Q.; Biao, Y.; Wang, D. Spatio-temporal evolution characteristics and influencing factors of industrial carbon emission efficiency in Beijing-Tianjin-Hebei region. Econ. Geogr. 2021, 41, 187–195. [Google Scholar]
- Cai, B.F.; Wang, J.N. Characterization of urban carbon dioxide emissions in the Yangtze River Delta region. China Popul. Resour. Environ. 2015, 25, 45–52. [Google Scholar]
- Yang, W.; Wang, B.; Xiang, D.X.; Lu, T.F.; Yu, J.; Sun, L.S. Research on decomposition of carbon emission factors of energy consumption and low carbon development in Wuhan. China Popul.-Resour. Environ. 2018, 28 (Suppl. S1), 13–16. [Google Scholar]
- Liang, Q.D.; Feng, X.Z.; Du, X.L. Research on the influencing factors of carbon emission from energy consumption based on LMDI-Taking Tangshan City as an example. Environ. Sustain. Dev. 2020, 45, 150–154. [Google Scholar]
- Du, Z.W.; Lv, L.C. Carbon emissions and urban development in Guangzhou. SAR Econ. 2012, 9, 51–53. [Google Scholar]
- Ye, B.; Liang, X.Y.; Song, Y.Z. Study on industrial carbon emission reduction pathway in Shenzhen under the goal of “carbon neutrality”. SAR Econ. 2022, 10, 17–24. [Google Scholar]
- Li, H.; Mu, H.; Zhang, M. Analysis on influence factors of China’s CO2 emissions based on Path–STIRPAT model. Energy Policy 2011, 39, 6906–6911. [Google Scholar] [CrossRef]
- Zeng, H.; Shao, B.; Biao, G. Analysis of Influencing Factors and Trend Forecast of CO2 Emission in Chengdu-Chongqing Urban Agglomeration. Sustainability 2022, 14, 1167. [Google Scholar] [CrossRef]
- Liu, W.D.; Song, T. Analysis of factors affecting carbon productivity in Chinese provinces based on hybrid geographically weighted regression. Resour. Sci. 2017, 39, 2223–2232. [Google Scholar]
- Wang, Y.N.; Zhao, T. Research on spatial differences of carbon emissions in China based on GWR model. China Popul.-Resour. Environ. 2016, 26, 27–34. [Google Scholar]
- Bai, Y.F.; Zhang, W.R.; Liu, J.P.; Yu, Y. Research on the prediction method of per capita carbon emissions in urban demonstration areas based on environmental Kuznets curve. Ecol. Econ. 2022, 38, 35–42, 84. [Google Scholar]
- Lin, S.F. Environmental Kuznets curve test of carbon dioxide emission considering the influence of multiple factors—An empirical analysis based on ARDL model. Soft Sci. 2014, 28, 127–130. [Google Scholar] [CrossRef]
- Ang, B.W. The LMDI approach to decomposition analysis: A practical guide. Energy Policy 2005, 33, 867–871. [Google Scholar] [CrossRef]
- Wang, Q.; Wu, S.D.; Lin, Y.S. Analysis of driving factors of carbon emissions from industrial energy consumption in the southeast coastal region of China. Resour. Sci. 2015, 37, 1239–1248. [Google Scholar]
- Xu, S.C.; He, Z.X.; Long, R.Y. Factors that influence carbon emissions due to energy consumption in China: Decomposition analysis using LMDI. Appl. Energy 2014, 127, 182–193. [Google Scholar] [CrossRef]
- Wang, K.; Fu, L.P. Research on the change of carbon emission intensity and driving factors of industries in Beijing-Tianjin-Hebei. China Popul.-Resour. Environ. 2017, 27, 115–121. [Google Scholar]
- Wu, X.; Che, Q.Q. Study on the influencing factors and decoupling efforts of industry carbon emissions in Gansu Province. Arid Zone Geogr. 2023, 46, 274–283. [Google Scholar]
- Wang, F.T.; Fang, K.; Yu, C. Decoupling elasticity and driving factors of decoupling industrial energy carbon emissions from economic growth in Beijing-Tianjin-Hebei—Empirical evidence based on Tapio decoupling and LMDI model. Ind. Technol. Econ. 2019, 38, 32–40. [Google Scholar]
- Shen, L.; Wu, Y.; Lou, Y. What drives the carbon emission in the Chinese cities?—A case of pilot low carbon city of Beijing. J. Clean. Prod. 2018, 174, 343–354. [Google Scholar] [CrossRef]
- Wang, C.J.; Wang, F.; Ye, Y.Y.; Zhang, X.L.; Su, Y.X.; Jiang, L.; Li, Z.; Zhang, H.O. Evolutionary characteristics of China’s coal consumption and its driving mechanism based on supply and demand perspectives. J. Nat. Resour. 2020, 35, 2708–2723. [Google Scholar]
- Zhang, S.; Lu, Y.; Xu, J. Exploring the Spatiotemporal Heterogeneity of Carbon Emission from Energy Consumption and Its Influencing Factors in the Yellow River Basin. Sustainability 2023, 15, 6724. [Google Scholar] [CrossRef]
- Wang, J.; Li, Z.G.; Gu, J.J. Decoupling elasticity and drivers of carbon emissions and economic growth in BRICS countries-an analysis based on Tapio decoupling and LMDI model. World Geogr. Res. 2021, 30, 501–508. [Google Scholar]
- Chen, L.; Zhang, N.; Wang, Y.F.; Hu, W.T. Drivers of carbon emission intensity changes in the Beijing-Tianjin-Hebei region and their attribution analysis—Based on the perspective of subdivided industries and five-year plan. China Environ. Sci. 2023, 2023, 1–17. [Google Scholar]
- Tiao, H.Z.; Ma, L. Analysis of structural factors of industrial carbon emission intensity changes in China. J. Nat. Resour. 2020, 35, 639–653. [Google Scholar]
- Yang, S.H.; Zhang, Y.Q.; Geng, Y. Analysis of transportation carbon emission changes in the Yangtze River Economic Belt based on LMDI. China Environ. 2022, 42, 4817–4826. [Google Scholar]
- Liu, Z.M.; Cui, Z.W.; Zhu, P.H.; Chen, C.C. Dynamic spatio-temporal characteristics of China’s electricity consumption and its drivers. China Popul.-Resour. Environ. 2019, 29, 20–29. [Google Scholar]
- Liu, M.; Zhang, X.; Zhang, M. Influencing factors of carbon emissions in transportation industry based on CD function and LMDI decomposition model: China as an example. Environ. Impact Assess. Rev. 2021, 90, 106623. [Google Scholar] [CrossRef]
- Yang, X.; Sima, Y.; Lv, Y.; Li, M. Research on Influencing Factors of Residential Building Carbon Emissions and Carbon Peak: A Case of Henan Province in China. Sustainability 2023, 15, 10243. [Google Scholar] [CrossRef]
- Xue, Y.; Ren, J.; Bi, X. Impact of Influencing Factors on CO2 Emissions in the Yangtze River Delta during Urbanization. Sustainability 2019, 11, 4183. [Google Scholar] [CrossRef]
- Wang, P.; Xu, H.W.; Ren, S.Y.; Cheng, B.B.; Zhao, D.Q. Evaluation of low-carbon transition paths for electricity in the Guangdong-Hong Kong-Macao Greater Bay Area based on the CGE model. China Popul.-Resour. Environ. 2021, 31, 90–104. [Google Scholar]
- Wei, Y.T.; Li, S.J.; Zhang, H. Spatial and temporal characteristics of carbon emissions in the Chengdu-Chongqing urban agglomeration and their influencing factors. China Environ. Sci. 2022, 42, 4807–4816. [Google Scholar]
- Wang, X.P.; Shen, Y.S.; Su, C. Study on the spatial and temporal differentiation of urban carbon emission efficiency and its spillover effect in the Yellow River Basin. Ecol. Econ. 2023, 39, 26–34. [Google Scholar]
- Chen, F.; Zhang, J.; Ren, J.; Xiang, Y.Y.; Li, Q. Study on spatial and temporal differences of carbon emissions and influencing factors in the Yellow River Basin based on LMDI model. Journal of Earth Environment. 2022, 4, 418–427. [Google Scholar]
- Xing, Z.H.; Li, X.Y.; Shi, Z.Y. Urban sprawl and its carbon emission effects in Liao-Zho ng-South urban agglomeration. Remote Sens. Nat. Resour. 2022, 34, 272–279. [Google Scholar]
- National Bureau of Statistics, Energy Department, National Bureau of Statistics. China Energy Statistics Yearbook; China Statistics Press: Beijing, China, 2006–2021. Available online: http://www.stats.gov.cn/english/Statisticaldata/yearbook/ (accessed on 10 July 2023).
- Ministry of Ecological Environment Protection. China Environmental Yearbook; China Environment News: Beijing, China, 2006–2014. Available online: http://www.shujuku.org/china-environment-statistical-yearbook.html (accessed on 10 July 2023).
- National Bureau of Statistics (NBS), Department of Urban Socio-Economic Survey, NBS. Statistical Yearbook of Chinese Cities; China Statistics Press: Beijing, China, 2006–2021. Available online: http://www.shujuku.org/china-city-statistical-yearbook.html (accessed on 10 July 2023).
- Intergovernmental Panel on Climate Change. 2006 IPCC Guidelines for National Greenhouse Gas Inventories; Hayama Institute for Global Environmental Strategies: Hayama, Japan, 2006. [Google Scholar]


| Energy Varieties | Standard Coal Coefficient (kgce/kg m3) | CO2 Emission Factor (104 t/104 t) | Energy Varieties | Standard Coal Coefficient (kgce/kg m3) | CO2 Emission Factor (104 t/104 t) |
|---|---|---|---|---|---|
| Raw coal | 0.7143 | 2.492 | Diesel | 1.4571 | 2.167 |
| Washed refined coal | 0.9000 | 3.212 | Fuel oil | 1.4286 | 2.219 |
| Other washed coal | 0.2850 | 2.492 | Liquefied petroleum gas | 1.7143 | 1.828 |
| Coal products | 0.6000 | 2.631 | Refinery dry gas | 1.5714 | 2.162 |
| Coke | 0.9714 | 2.977 | Petroleum brain | 1.5000 | 2.126 |
| Other coking products | 1.3000 | 2.341 | Lubricants | 1.4143 | 2.126 |
| Coke oven gas | 6.1430 | 1.288 | Solvent oil | 1.4671 | 2.126 |
| Blast furnace gas | 1.2860 | 7.523 | Paraffin wax | 1.3643 | 2.126 |
| Converter gas | 2.0700 | 1.288 | Petroleum coke | 1.0914 | 2.126 |
| Generator gas | 1.7860 | 1.288 | petroleum asphalt | 1.4000 | 2.126 |
| Other gas | 3.5710 | 1.288 | Other oil products | 1.2000 | 2.126 |
| Natural gas | 13.300 | 2.162 | Heat | 0.03412 | 3.212 |
| Liquefied natural gas | 1.1757 | 2.660 | Electric power | 1.2290 | 6.113 |
| Crude oil | 1.4286 | 2.104 | Residual heat and pressure | 0.03412 | 3.212 |
| Gasoline | 1.4714 | 1.988 | Other fuels | 1.01000 | 2.4567 |
| Year | Moran’s Index | Z Score | p-Value |
|---|---|---|---|
| 2005 | 0.3669 | 4.3004 | 0.0000 |
| 2006 | 0.2664 | 3.1221 | 0.0017 |
| 2007 | 0.1740 | 2.0779 | 0.0377 |
| 2008 | 0.2397 | 2.8100 | 0.0050 |
| 2009 | 0.2032 | 2.3967 | 0.0165 |
| 2010 | 0.2664 | 3.1221 | 0.0018 |
| 2011 | 0.1590 | 1.9087 | 0.0563 |
| 2012 | 0.1535 | 1.8481 | 0.0646 |
| 2013 | 0.1667 | 1.9964 | 0.0459 |
| 2014 | 0.1775 | 2.1229 | 0.0338 |
| 2015 | 0.1566 | 1.8882 | 0.0590 |
| 2016 | 0.1368 | 2.7974 | 0.0051 |
| 2017 | 0.2382 | 2.8364 | 0.0046 |
| 2018 | 0.2793 | 3.2679 | 0.0011 |
| 2019 | 0.2878 | 3.3352 | 0.0008 |
| 2020 | 0.2972 | 3.4389 | 0.0005 |
| Year | Total Effect | |||||
|---|---|---|---|---|---|---|
| 2006 | 64.1375 | 238.8040 | −289.7121 | 56.6335 | 379.6763 | 449.5392 |
| 2007 | 27.5501 | 156.6668 | −304.8799 | 57.7436 | 419.5108 | 356.5913 |
| 2008 | 0.2046 | −95.6445 | −265.5315 | 48.3928 | 361.4045 | 48.8259 |
| 2009 | 18.8341 | 79.4592 | −203.5542 | 26.4812 | 337.0562 | 258.2764 |
| 2010 | −98.7024 | 275.4876 | −278.1084 | 34.5775 | 477.0447 | 410.2991 |
| 2011 | 129.8239 | 433.9620 | −676.5293 | 37.5617 | 476.5764 | 401.3947 |
| 2012 | 122.2263 | 38.7568 | −411.4503 | 33.5273 | 453.6521 | 236.7123 |
| 2013 | 8.9945 | 88.1427 | −426.1942 | 27.8706 | 440.4791 | 139.2928 |
| 2014 | 509.7842 | −444.8522 | −395.3330 | 14.7173 | 360.9694 | 45.2856 |
| 2015 | −0.2155 | 128.8691 | −398.8168 | −20.2976 | 284.0955 | −6.3653 |
| 2016 | −171.2638 | 17.0535 | −51.7426 | −6.9380 | 234.8575 | 21.9666 |
| 2017 | −19.7668 | 931.3033 | −1056.5616 | 26.4942 | 267.7226 | 149.1918 |
| 2018 | −4.8924 | 751.9006 | −757.6303 | 14.2103 | 251.9699 | 255.5581 |
| 2019 | 76.6828 | 498.1247 | −597.8619 | 5.3032 | 246.2182 | 228.4669 |
| 2020 | −138.0305 | 292.8969 | −303.0942 | 56.8661 | 191.8655 | 100.5037 |
| Accumulation | 525.3667 | 3390.9305 | −6417.0004 | 413.1436 | 5183.0988 | 3095.5392 |
Disclaimer/Publisher’s Note: The statements, opinions and data contained in all publications are solely those of the individual author(s) and contributor(s) and not of MDPI and/or the editor(s). MDPI and/or the editor(s) disclaim responsibility for any injury to people or property resulting from any ideas, methods, instructions or products referred to in the content. |
© 2023 by the authors. Licensee MDPI, Basel, Switzerland. This article is an open access article distributed under the terms and conditions of the Creative Commons Attribution (CC BY) license (https://creativecommons.org/licenses/by/4.0/).
Share and Cite
Duan, Y.; Zhong, J.; Wang, H.; Sun, C. Analysis of the Spatial and Temporal Evolution of Energy-Related CO2 Emissions in China’s Coastal Areas and the Drivers of Industrial Enterprises above Designated Size—The Case of 82 Cities. Sustainability 2023, 15, 13374. https://doi.org/10.3390/su151813374
Duan Y, Zhong J, Wang H, Sun C. Analysis of the Spatial and Temporal Evolution of Energy-Related CO2 Emissions in China’s Coastal Areas and the Drivers of Industrial Enterprises above Designated Size—The Case of 82 Cities. Sustainability. 2023; 15(18):13374. https://doi.org/10.3390/su151813374
Chicago/Turabian StyleDuan, Ye, Juanjuan Zhong, Hongye Wang, and Caizhi Sun. 2023. "Analysis of the Spatial and Temporal Evolution of Energy-Related CO2 Emissions in China’s Coastal Areas and the Drivers of Industrial Enterprises above Designated Size—The Case of 82 Cities" Sustainability 15, no. 18: 13374. https://doi.org/10.3390/su151813374