Article

Air Traffic Sector Network: Motif Identification and Resilience Evaluation Based on Subgraphs

1
College of Civil Aviation, Nanjing University of Aeronautics and Astronautics, Nanjing 211106, China
2
National Key Laboratory of Air Traffic Flow Management, Nanjing University of Aeronautics and Astronautics, No. 29 General Avenue, Nanjing 211106, China
*
Author to whom correspondence should be addressed.
Sustainability 2023, 15(18), 13423; https://doi.org/10.3390/su151813423
Submission received: 3 July 2023 / Revised: 3 September 2023 / Accepted: 6 September 2023 / Published: 7 September 2023
(This article belongs to the Special Issue Sustainable Development of Airspace Systems)

Abstract

:
Air traffic control systems play a critical role in ensuring the sustainable and resilient flow of air traffic. The air traffic sector serves as a fundamental topological unit and is responsible for overseeing and maintaining the system’s sustainable operation. Examining the structural characteristics of the air traffic sector network is a useful approach to gaining an intuitive understanding of the system’s sustainability and resilience. In this paper, an air traffic sector network (ATSN) was established in mainland China using the complex network theory, and its motif characteristics were analyzed from a microscopic perspective. Additionally, subgraph resilience was defined in order to describe the network topology by analyzing changes in subgraph motif concentration and subgraph residual concentration. Our empirical findings indicated that motifs exhibit high connectivity, while anti-motifs are found in subgraph structures with low connectivity. The motif concentration of subgraphs can efficiently reflect the distribution of heterogeneous subgraph structures within a network. During the process of resilience evaluation, the subgraph motif concentration remains relatively stable but is sensitive to the transition state of the network from disturbance to recovery. The resilience of the system at the macroscopic scale is aligned with the resilience of each heterogeneous subgraph structure to some extent. Topological indicators have a more significant impact on the resilience of the ATSN than air traffic flow characteristics. This study has the outcome of uncovering the preference for connection among nodes and the rationality of sector structure delineation in ATSNs. Additionally, this research addresses the fundamental mechanism behind the network disturbance recovery process, and identifies the connection between network macro- and microstructure in the resilience process.

1. Introduction

Over the past decade, with the continuous development of the civil aviation transportation industry, the increased numbers of routes have caused an intensification of the air traffic system and an elevation in airspace complexity. More recently, the uncertainty of public emergencies has also brought inevitable impacts and influences to the air transportation system. These include, but are not limited to, COVID-19, extreme weather phenomena, and large-scale military activities. As a complex socio-technical system, the question of how to ensure the sustainable operation of the air traffic system has become an essential issue. Guimera first constructed the world-wide air traffic network to characterize the operation features of the air traffic system [1]. Since then, topology-based studies have become among the most effective ways of understanding the sustainable operation of air traffic systems. The topological characteristics of the air traffic sector system not only optimize airspace allocation, but also reduce air traffic flow congestion and flight delays [2].
To date, a considerable amount of research has examined the sustainable operation of air traffic systems with regard to their topological characteristics. Most studies primarily focus on critical node identification [3,4], robustness and vulnerability [5,6], and cascading failures and fault recovery [7]. In order to identify critical nodes in the air traffic system, Wang et al. [8] used node centrality measures to investigate critical air transportation nodes in the network subset, which includes 144 airports and 1018 edges. Wuellner et al. [9] constructed the US airport network and discussed its topology properties under different attack targets. Additionally, they proposed a rewiring technique to improve resilience in a way that considers flights number and gate restriction. Cunha et al. [10] established the US airport network and developed a module-based attack method by utilizing topological communities. Wei et al. [11] employed spectral clustering to determine the pivotal sites in the airport network of China, resulting in six distinct criticality categories. Clusella et al. [12] constructed the global airline network, which includes 3151 nodes and 27158 edges. Then, they investigated the explosion percolation phenomenon in the subset of the established network. In terms of vulnerability and robustness studies of air traffic systems, Kim et al. [13] explored the robustness of the US airport network, with 1574 airports and 28236 edges. Chen et al. [14] explored the Chinese air transportation city network’s development from a historical evolution perspective and investigated the robustness of its structure. Wilkinson et al. [15] established the European airport network and examined the vulnerability of the system, finding that spatially coherent events are far worse than uniform random events. Meanwhile, several studies have discussed the cascading failure and fault recovery strategy in air traffic systems. Qi et al. [16] established the air traffic sector network in China and investigated the cascading failure mode in the network. Wang et al. [17] modeled a multilayer cyber–physical network to describe the relationship between air traffic controllers and sectors. Then, an improved load capacity model was utilized to examine the cascading failure of the system. Mirzasoleiman et al. [18] explored failure cascades in the US airport network, which consists of 500 nodes and 2980 links. In addition, much attention has been paid in recent years to the rapid recovery strategy of the air traffic system from COVID-19 [19].
Despite the thorough investigation of sustainable air traffic systems in the above-mentioned studies, their limitations are still prominent and can be summarized in three principal manners. Firstly, the current studies are based on a macro perspective. However, different local microstructures may significantly impact the overall performance of the whole network. At the same time, networks with similar global structures may also reflect different local characteristics due to their different functions or generative mechanisms. In the field of network science, Milo first defined the concept of a ‘motif’ as the recurring structure of connections between nodes in a network [20]. Schultz et al. demonstrated that the robustness and stability of a network are related to the low-order subgraph structure within [21]. Gorochowski argued that the low-order subgraph structure in the network is a specific process that coordinates others in order to achieve an aggregated function [22]. There are still information gaps concerning microstructural changes in the sustainable operation of the air traffic system. Secondly, in most air traffic network models, nodes are usually composed of airports or route points. More studies have focused on air traffic service while neglecting to consider the role of sectors in air traffic management. As the most basic airspace unit used by air traffic controllers to carry out control measurements, sectors can effectively guarantee the regular operation of the airspace environment, reduce safety risks, and improve operational efficiency. Thirdly, these studies concentrate predominantly on the disruption process rather than the resilience process of disruption recovery. The issue of restoring the operational capability of disrupted air traffic systems is not solely an academic concern, but also has significant and practical operational implications.
More recently, many studies have been conducted concerning system resilience in the field of network science. Resilience, which originates from the Latin word “resiliere”, means the capacity to rebound [23]. Although the notion was first introduced to ecology and evolution in 1973, it has recently become an emerging concept in the field of engineering [24]. As a concept to describe both the changing patterns of system performance under special events and to propose targeted preventive measures in order to lessen the effects of external disturbances to the system, resilience provides novel insights into system operation sustainability enhancement. Nowadays, the concept of resilience is widely used in many fields, including infrastructure research [25,26,27], natural disaster and resource management [28,29], systems engineering [30], energy systems [31,32,33], and ground transportation [34,35]. Although the definition of resilience varies in different disciplines, the essence of resilience as an element of risk assessment is consistent. It describes the comprehensive capability of a given system to withstand a disaster and quickly recover from it. Francis and Bekera reviewed various approaches to defining and assessing resilience and identified three metrics used to express resilience capacity: adaptive capacity, absorptive capacity, and recoverability [36]. A. Cardoni et al. measured resilience using four indicators: robustness, redundancy, crisis management capacity, and recovery speed [37]. Stubna et al. considered resilience to be the ability of a network to recover its properties after a disturbance, and it is divided into two dimensions—vulnerability and recoverability [38]. In the field of air traffic, Wang et al. modeled the air traffic network and measured its resilience [39], and Allen et al. applied a data-driven method to discuss the resilience of the airline network [40]. However, the developing subject of air traffic system resilience still requires further consideration.
In order to clearly describe these above-mentioned gaps, Table 1 summarizes relevant studies in air traffic systems.
It is worth noting that all the studies listed in Table 1 are macro-level studies of the air transport system, while there is a lack of exploration from the micro level. It is vital to investigate the micro-composition of air traffic sector networks and the alterations in resilience. In this research, we constructed an air traffic sector network (ATSN) in mainland China and identified the microstructure composition preference. By defining the subgraph structural resilience, we investigated the performance of different microstructures in the resilience process. Meanwhile, we also employed the conventional evaluation approach to examine the resilience of the ATSN from a macro perspective. To the authors’ knowledge, this paper represents one of the first efforts to study the microstructural resilience of air traffic systems. The primary contributions of this study can be summarized as follows.
(1)
We use a technique for detecting micro subgraph patterns to reveal how small, closely interconnected components are constructed in order to link and integrate the ATSN.
(2)
This paper explores network subgraphs as a means of understanding resilience in the ATSN, and can be generalized to other relevant studies in network science and sustainability.
The remaining components of this research are organized as follows. In Section 2, we depict the methodology that was applied in this research. In Section 3, we present some basic information and outline the characteristics of the ATSN in mainland China and the data used to construct the network. In Section 4, we demonstrate the analysis and discuss the results, including an empirical study of an ATSN in mainland China. In Section 5, we review and discuss results derived from our work.

2. Methodology

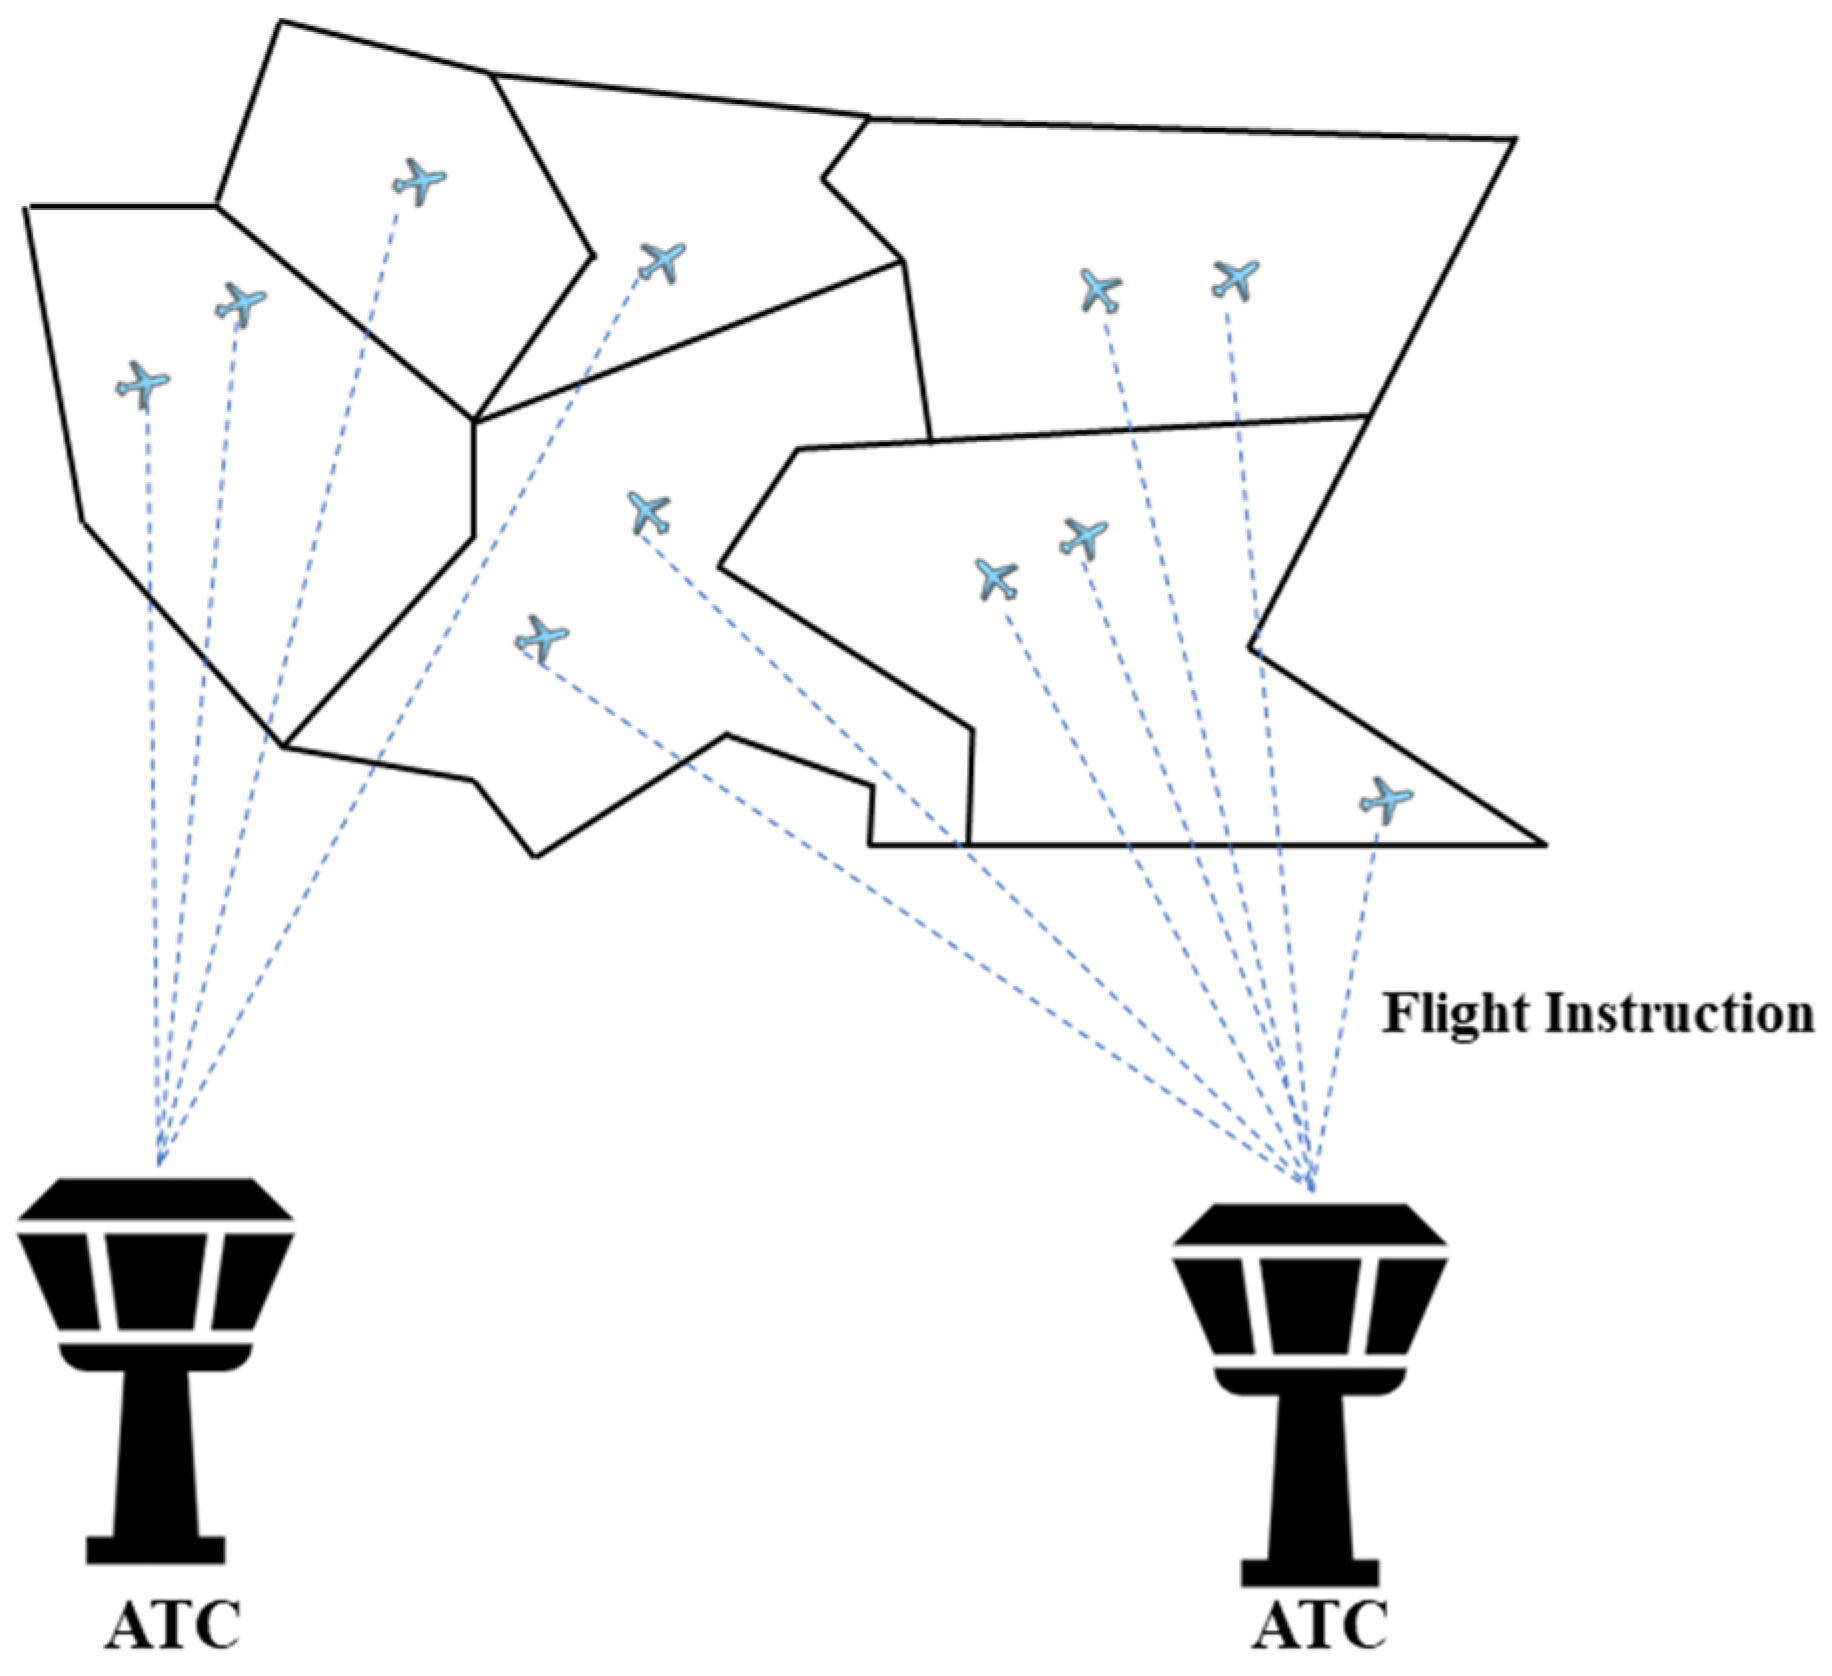
2.1. Air Traffic Sector Network Construction

The function of an air traffic system is to ensure the safe and efficient operation of air traffic flow. Drawing on complex network theory, we abstract the control sectors in mainland China as a network model consisting of nodes and connected edges. Sectors are units of airspace that are used to reduce the workload of controllers and improve their operational safety and efficiency based on the structure of the airways in the airspace and the capacity of communication, navigation, and surveillance. Generally, sectors display an irregular polygonal shape. Figure 1 illustrates the relationship between sectors, flights, and air traffic control. The air traffic sector network model construction rules are as follows.
  • Abstract each sector as a node. Create an undirected edge between two nodes if there is a flight path connecting them.
  • When there are multiple flight paths between two sectors, simplify these multiple flight paths as a single edge to represent the connection relationship.
  • If sectors of varying altitudes share a common projection on the 2-dimensional plane, such sectors are paired to a node. In other words, keep the higher sectors and remove the lower ones.
We represent the connection relationship between nodes using the adjacency matrix A = a i j M × M . If node i and j are connected, a i j = a j i = 1 ; otherwise, a i j = a j i = 0 .
Using to the rules above and actual data in mainland China, we construct an ATSN model, as shown in Figure 2. The sectors connect closely with each other, and are distributed more densely in East China, North China, South China, and Southwest China. In contrast, Northwest and Northeast China, as well as Xinjiang, possess fewer sectors despite their sparse spatial distribution, which is due to the vast area, the scattered distribution of the airports, and the low population density. The spatial and geographical distribution of control sectors in mainland China is uneven, being dense in the east and sparse in the west.

2.2. Motif of ATSN

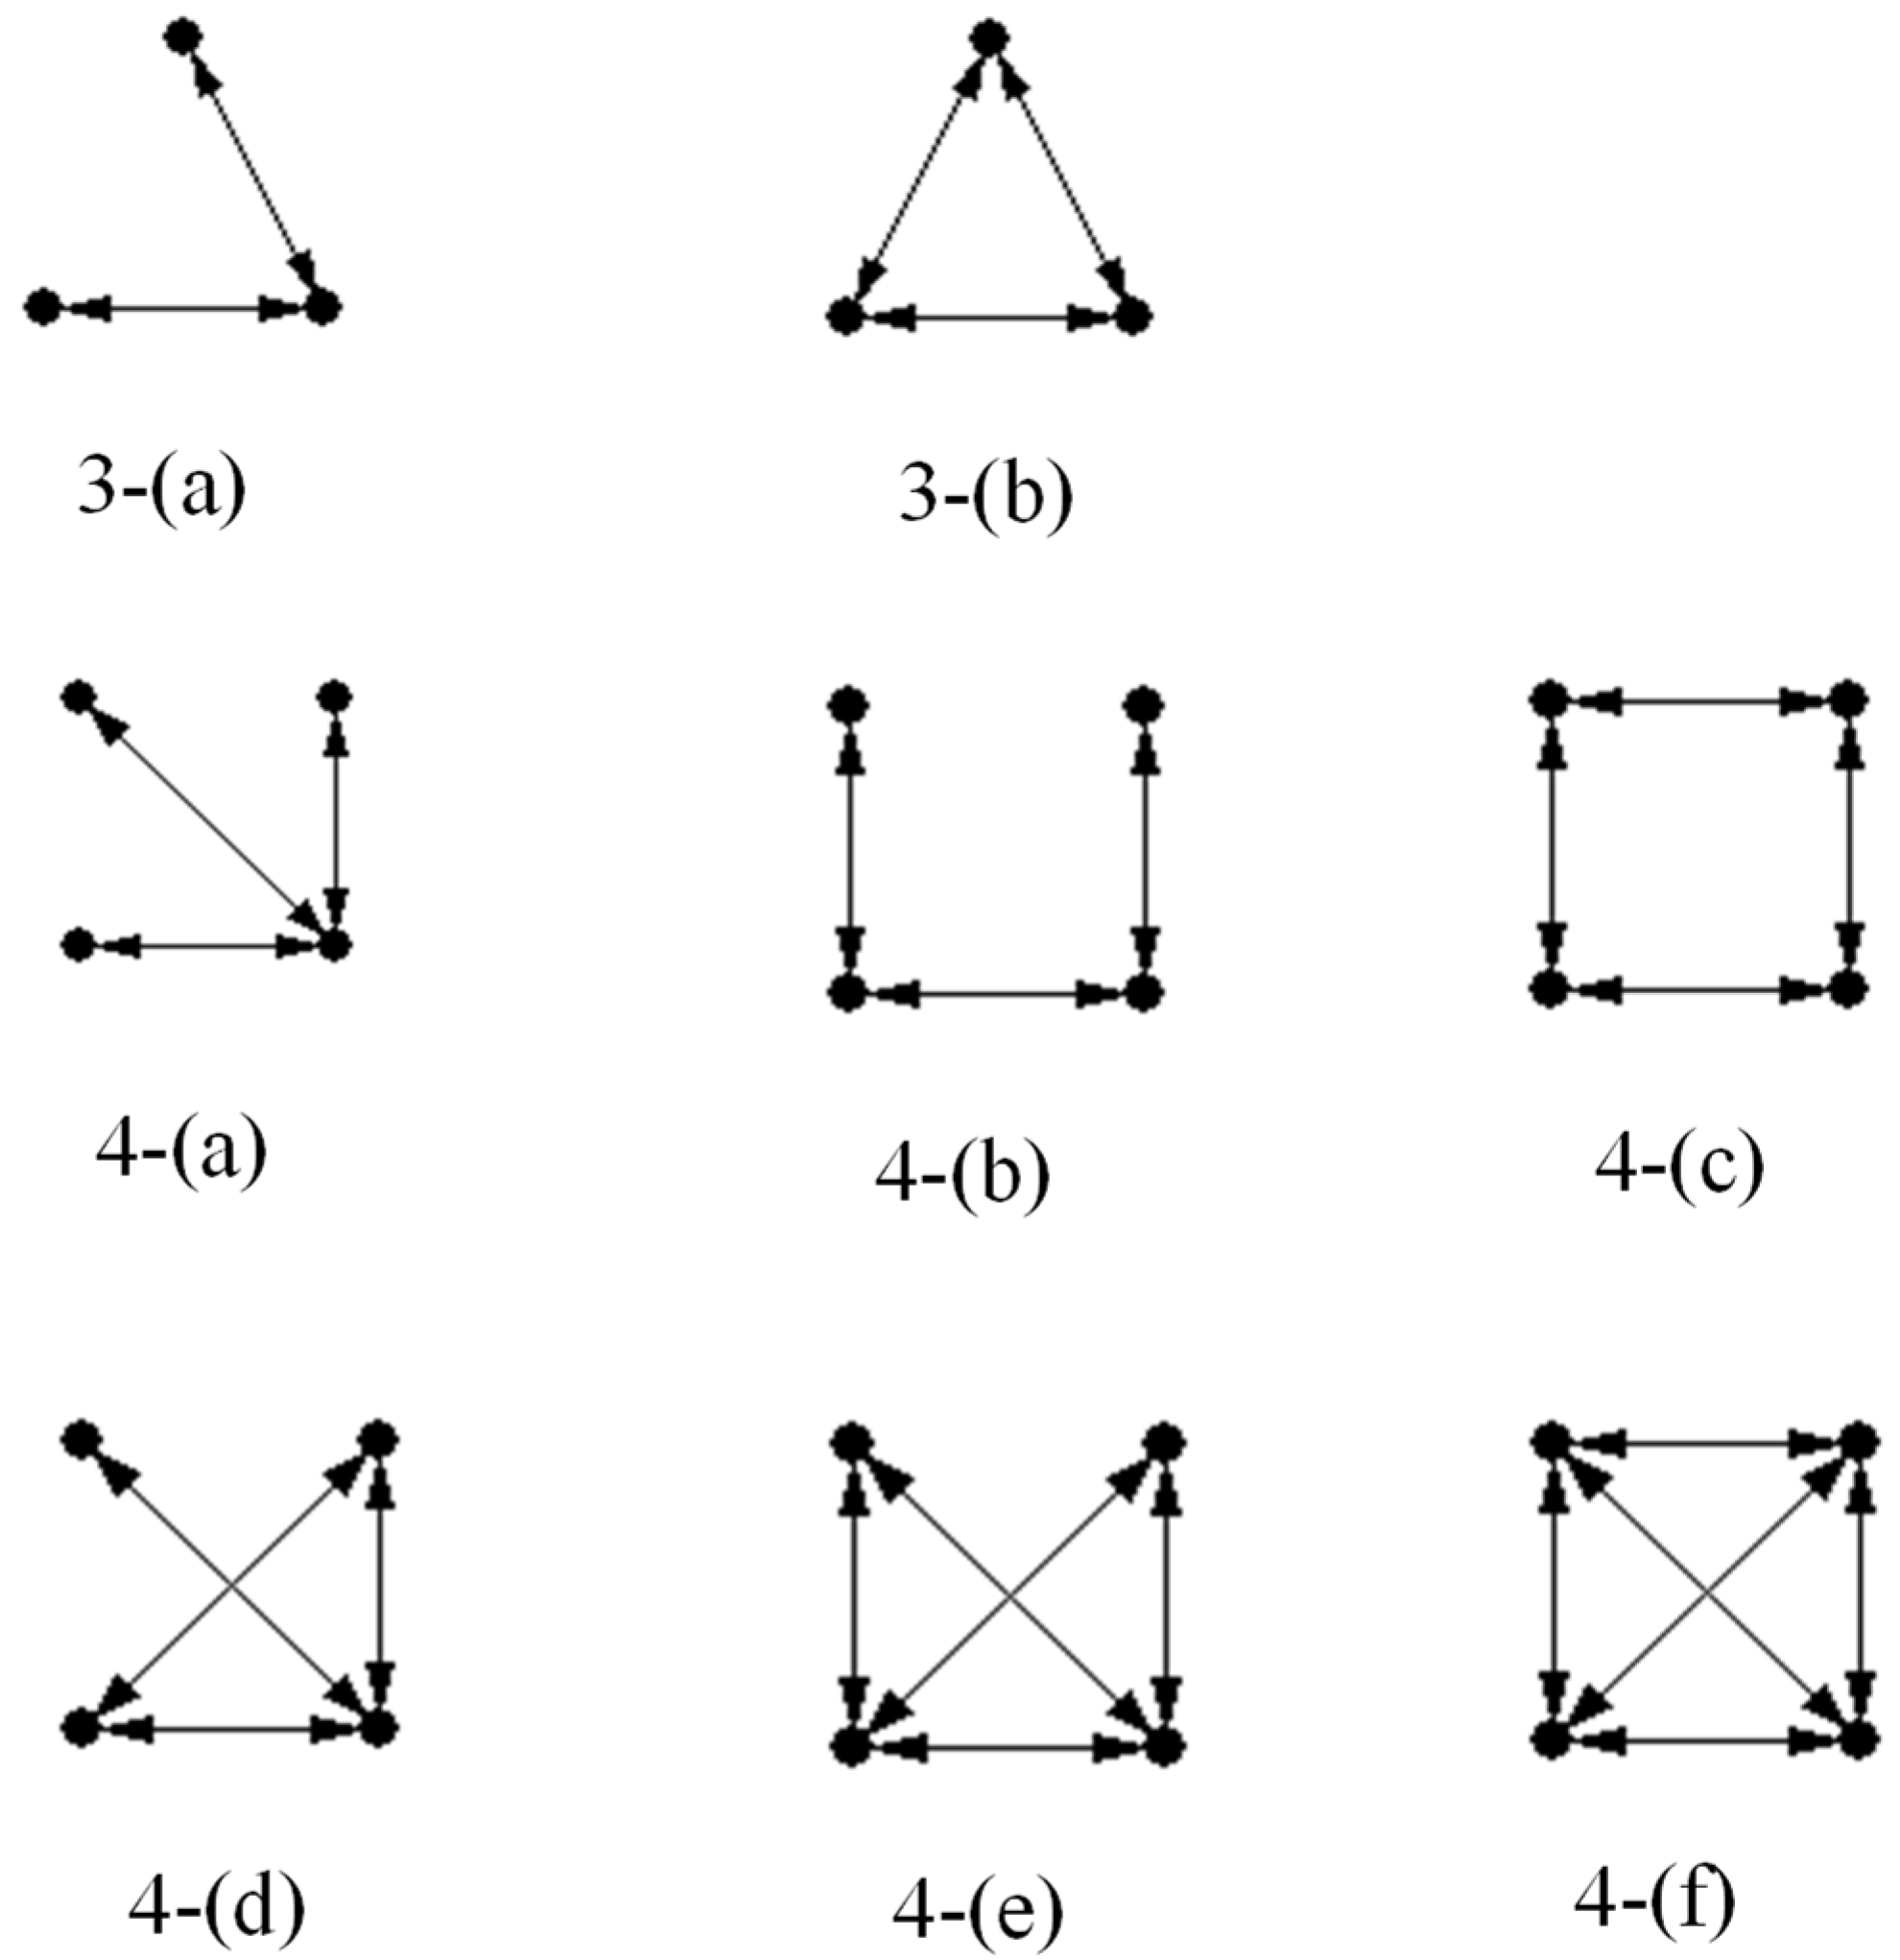
2.2.1. Network Subgraph Structure

The subgraph structure exists in the underlying topology of the sector network. In this paper, we analyze the subgraph structure (3-node and 4-node subgraph) as the smallest structural unit that constitutes the ATSN and undertakes the traffic flow transfer function. The air traffic network, as the topological carrier of civil aviation transportation security, is constructed through the continuous connection and reorganization of the subgraph structure. Figure 3 summarizes different types of heterogenous subgraphs.
As the smallest unit to achieve the network function, the subgraph structure meets the actual operational needs of the sectors through different connection modes. For the 3-node subgraph structure, 3-(a) represents two nodes with no direct flight path connecting either to another node, while 3-(b) indicates that three sectors connect with each other in pairs. For the 4-node subgraph structure, 4-(a) represents an influential sector directly connected to the other three sectors that do not have routes directly connected to each other, and the central node in this type of subgraph structure is generally the sector with the highest traffic flow; 4-(b) denotes that the two connected sector nodes connect to each of the other two nodes that are not directly connected; 4-(c) reflects that each sector has only two other sectors linked to it among the four nodes in a particular region; 4-(d) can be regarded as a substructure of the 3-(b) structure connected to an isolated sector; 4-(e) is a subgraph in which all four nodes are connected in pairs, except for two specific sectors where there is no direct flight path, and similarly, it can be regarded as indicating two 3-(b)-scale subgraph structures sharing a joint edge (sector); and 4-(f) indicates that all the nodes in the subgraph are connected to each other.

2.2.2. Subgraph Structure Motif Analysis

Studies have shown that motifs have an impact on the overall structure and properties of the network through mutual coordination and interaction. In the air traffic field, Yang et al. investigated the motif of the airline network and discussed airports’ roles in cliques [41]. Jin et al. constructed China’s passenger airline network and studied their subgraph structural characteristics via motif identification [42]. The network motif has already been an effective method for identifying local relationship patterns in air traffic systems [43].
Motifs are connected forms of subgraphs that repeatedly appear in real existing networks as opposed to randomized networks. Those randomized networks have the same single-node characteristics as real networks. In an ATSN, we consider that the motif characteristics of the subgraph structure are derived structures in sector planning, which may not have a particular physical meaning. Similar to other heterogeneous subgraphs, the structure with motif characteristics only undertakes the function of transferring traffic flow. Conversely, motifs portray the potential connection preferences among the air traffic sector nodes and reveal the network’s actual structural requirements and demands, which can be a structural criterion for sector networks.
Since the heterogeneous connectivity patterns of subgraphs increase rapidly with the number of nodes, the study of subgraph structure motifs mainly focuses on the 3-node and 4-node variants. Another reason for this is that higher-order subgraphs with complex structures can also be considered compositions of different lower-order (3-node and 4-node) subgraph structures. Hence, 3-node and 4-node subgraph structures may significantly influence the whole network’s performance. This research mainly identifies these two types of subgraphs.
Frequency of motif ( F ), p value, and significance value Z are 3 measurement indicators used to evaluate the motifs in the network. These 3 indicators are defined as follows:
  • Frequency of motif
For a given subgraph k comprising n nodes, its frequency of appearance in the actual network is n ( k ) , while the collective number of appearances of all subgraphs with n nodes in the actual network is N . Consequently, the frequency of motif is as follows:
F = n ( k ) / N
2.
p Value of motif
p represents the probability of the motif M appearing more frequently in the random network compared to the real network. A low p value signifies greater significance of the motif within the network. If the p value is less than the cut-off value (0.005 in this paper), it indicates that the occurrence of subgraphs in the network is considerably higher than that in a randomized network. These subgraphs are then identified as “network motifs”.
3.
Significance Value Z of motif
The number of times a motif appears in the real network is N real , while N rand represents that in the random network; N ¯ rand is the mean value Z of N rand and std ( N rand ) is the standard deviation. Then, the motif in the real network is defined using Equation (2):
Z k = ( N k real N ¯ k rand ) / std ( N k rand )
When Z k > 0 , the subgraph structure is identified as a motif; hence, the structural characteristic of the subgraph appears significantly in the spatial sector network compared to the random network. On the contrary, if Z k < 0 , the subgraph structure is an anti-motif, and the subgraph structure is more likely to form in the random network. A higher value of Z indicates greater importance of the motif in the network [42].
The motif detection method of the sector network consists of three steps: random network generation, subgraph search, and motif evaluation.
  • Random network generation. Motif identification is performed by comparing the frequency of subgraphs in real networks with many random networks. To detect the motifs of an ATSN, it is necessary to first generate random networks with the same size and degree distribution as the real network [44].
  • Subgraph detection. The aim of this step is to detect specific pattern subgraphs in the real network, and then, generate random networks, respectively. It can determine and categorize whether they are homogeneous subgraphs. Identifying whether the graph structure is isomorphic is an NP-hard problem. The commonly used subgraph methods include ESA, ESU, and Rand-ESU [45,46].
  • Motif evaluation. The motif properties of each heterogeneous subgraph are determined by computing the above-mentioned statistical indicators (Frequency, p and Z).
In this paper, we use the motif analysis tool FANMOD to realize ATSN motif identification based on the Rand-ESU algorithm [45,47].

2.3. Resilience of ATSN

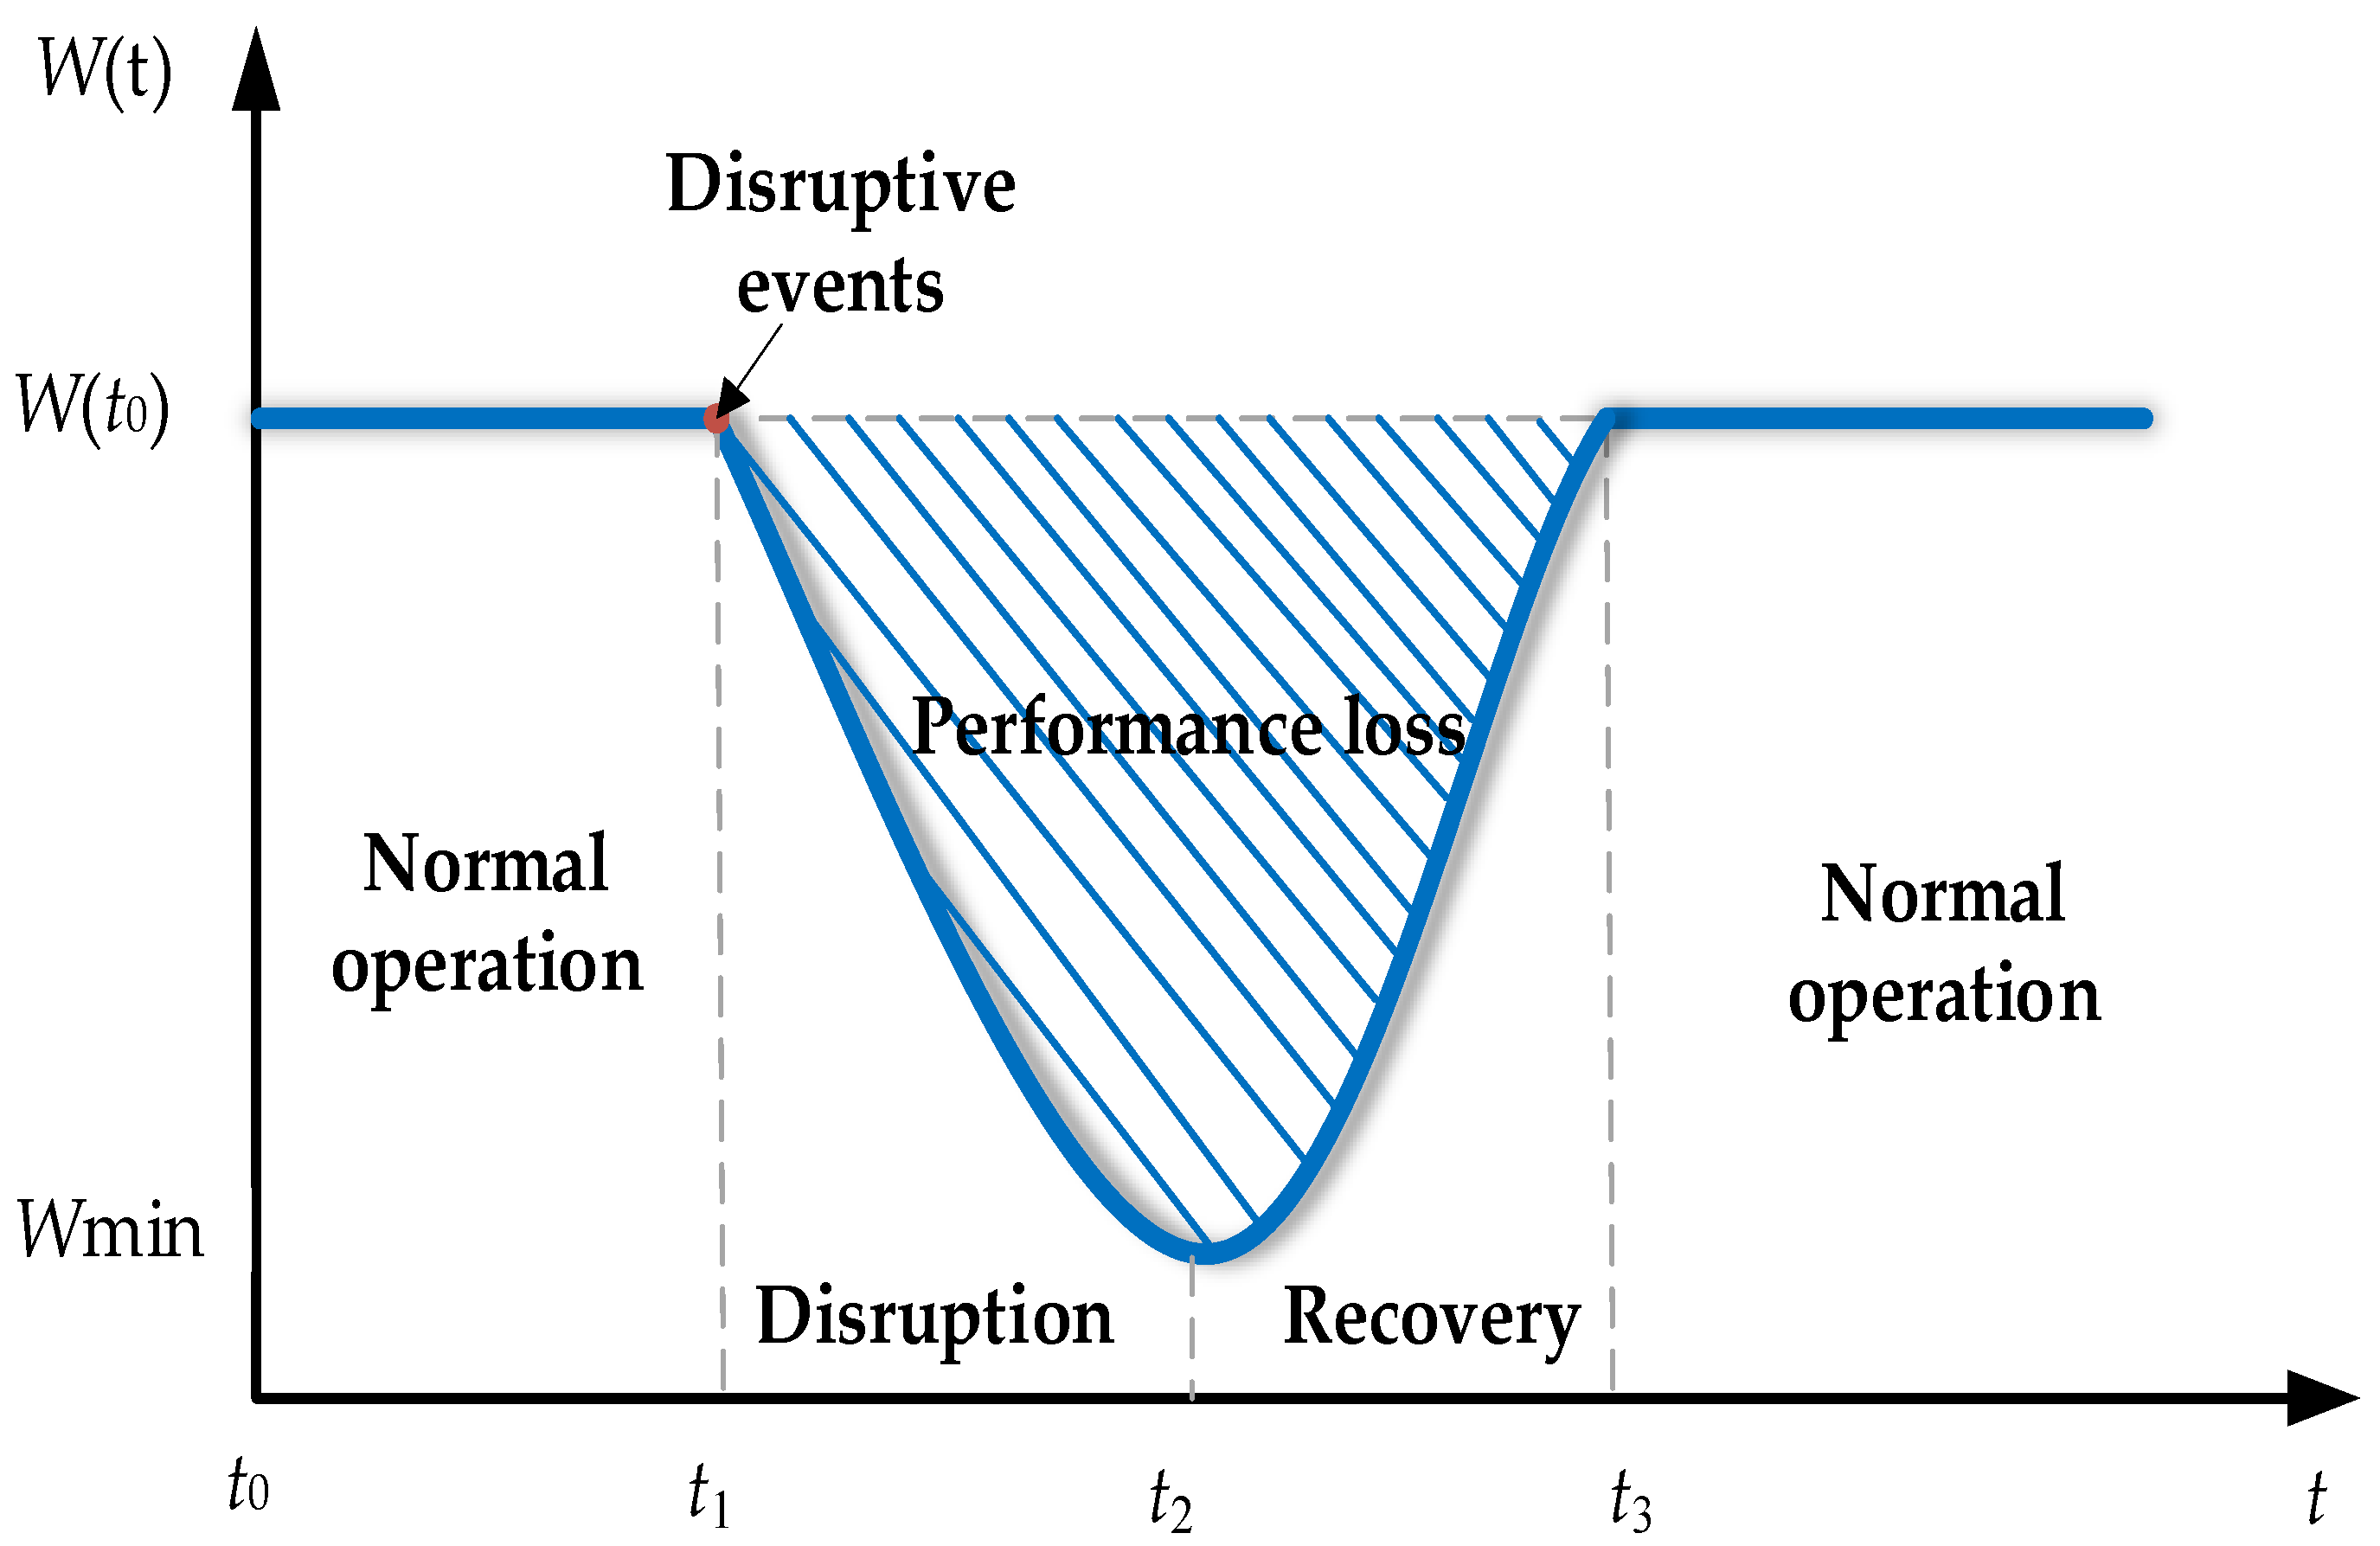
2.3.1. Resilience Conception

Resilience is a property that characterizes both the degree of structural and functional degradation and the ability to recover. The resilience of the ATSN reflects the degradation and recovery process of the network performance under the influence of special events (such as bad weather or military exercises). Disturbance caused by special events leads to changes in the operating environment of the sector and may further lead to failure of the sector nodes, and affects the regular operation of the flight flow. After the disturbance process, the nodes’ state changes from failure to regular operation again, and the network performance gradually recovers. The current research on resilient systems primarily analyzes changes in networks from the macro perspective during the disturbance-recovery process [48,49], which allows researchers to evaluate networks from a macroscopic perspective but does not describe the resilience of the microscopic structure of networks.
For ATSNs, resilience is expressed explicitly in two stages: the network failure stage (where the nodes are disturbed and fail, the overall performance of the ATSN decreases, and the guarantee of normal transportation operation of civil aviation is challenged) and the network recovery stage (where air traffic controllers take specific recovery measures and the nodes return to regular operation from failure gradually until the system reaches a relatively steady state). Figure 4 shows the system performance in the process of resilience, where t 0 is the initial moment, t 1 is the time when the network is disturbed, t 2 represents the point when ATSN performance drops to the lowest point, and t 3 indicates the point at which a network returns to the normal operation state.
In the process of t 0 ~ t 1 , the ATSN maintains a normal operating state, and its initial network performance value is W ( t 0 ) . At the moment of t 1 , the network is disturbed by sector nodes failing, and the sector failure causes a degradation in network function. The normal operation of flights is obstructed until the ATSN reaches the lowest performance value at t 2 . The failed sectors in the network gradually return to normal operation until the ATSN reaches the steady-state system performance level at t 2 ~ t 3 . t 3 is the moment when the ATSN reaches a steady state again.
The system resilience can be evaluated quantitively using the value of resilience loss, as shown in Equation (3). G 0 is the network performance at the initial moment t 0 , while G t represents the network performance at t 3 .
R l o s s = t 0 t 3 ( G 0 G t ) d t
In this paper, we use the relative value of maximum connectivity subgraph (G) as a resilience evaluation metric for the ATSN.

2.3.2. Subgraph Resilience Evaluation

In this section, we define subgraph structure resilience based on the variation in subgraph concentration in order to characterize the ability of different subgraph structures to resist and recover from network disturbances. We do not consider the comparison with the number of occurrences of subgraph structures in random networks in the subgraph resilience evaluation process. The subgraph concentration is considered only for the distribution and variation in each subgraph structure for different connectivity patterns of the same node scale in a sector network. The relevant statistical characteristics used to evaluate the subgraph include:
  • Subgraph motif concentration
The subgraph motif concentration is the proportion of each heterogeneous subgraph structure of the same size in the ATSN at the same time step.
C k = N k k N k
C k is the subgraph motif concentration value for the th-type subgraph structure at the N node scale, and N k is the number of occurrences of subgraphs of this type.
The concentration reflects the relative distribution among heterogeneous subgraph structures with the same node scale. It is irrelevant to the absolute number of subgraph structures in the ATSN. The fluctuation trend of subgraph motif concentration over time can be a microstructural metric of the network resilience process. The greater instability the subgraph motif concentration shows, the more drastic the internal changes in the ATSN, and the greater the loss of resilience in the recovery process to the initial state of the network. On the contrary, the ATSN has better resilience and more structural changes when the subgraph concentration curve shows a smooth trend.
2.
Subgraph residual concentration
The subgraph residual concentration is the ratio of the number of subgraphs at the time of disturbance and self-recovery to that in the initial moment, as shown in Equation (5).
R k t = N k t k N k 0
In Equation (5), R k t is the residual concentration of the -kth-type subgraph at time t , N k t is the occurrences of this subgraph at the time t , and N k 0 is the frequency of all heterogeneous subgraphs of size N in the network at the initial time.
The subgraph concentration index in Equation (4) can only qualitatively measure the relative trend in the number of subgraphs in the network. In contrast, the subgraph residual concentration can describe the change in the number of heterogeneous subgraphs in the process of the attack and self-recovery of the ATSN, and accurately reflects the changing trend of the same type of subgraph structure in relation to the overall network.
3.
Subgraph resilience
Subgraph resilience is the ability of each subgraph structure to resist network disturbances and recover quickly.
T k = t 0 t 3 ( R k 0 R k t ) d t
At the initial moment t 0 , the residual concentration of the subgraph k is R k 0 , the residual concentration value of the subgraph structure during the network resilience evaluation at moment t is R k t , and the network reaches the steady state condition again at moment t 3 . The subgraph structural resilience reflects the relative changes in the underlying topology layer and the structural loss value during the network resilience process. A larger subgraph resilience value indicates that the subgraph structure suffers a greater loss when the resilience of the network is being tested.
The subgraph concentration in the network only reflects the number of heterogeneous subgraphs in the actual sector network, indicating the real state of the network under the constraints of the airspace environment, regional development level, and transportation demand. Motif/anti-motif characteristics, derived from a comparison with a random network of the same size and degree distribution, reflect the network’s intrinsic evolution.

2.3.3. Resilience Simulation Rules

In this study, the system resilience evaluation of ATSNs is carried out using a simulation-based approach, consisting of three stages. (1) From t = 0 to t = 2 , the ATSN of China is in normal operation. (2) From t = 2 to t = 7 , 10% of the nodes in the ATSN are removed at set intervals until the rate of nodes in the normal operation state drops to 50%. (3) From t = 7 , the sector nodes are restored and the ATSN recovers gradually. In this stage, we also suppose that 10% of the nodes return to a normal operation state again at each time period, and that the ATSN returns normal at t = 12 .
In the process of ATSN disturbance recovery, each stage can be simulated based on different strategies. We consider the impacts of both the network’s structural properties and the operational management procedures simultaneously. Namely, degree-based, betweenness-based, and flow-based attack strategies (DA, BA, FA) were utilized to simulate a variety of disruption scenarios in the resilience process. Then, degree-based, betweenness-based and flow-based strategies (DR, BR, FR) were adopted to recover the disturbed networks, respectively.
We have several assumptions in our simulation. (1) The attack and recovery are simulated by removing the node and restoring the removed node, respectively; (2) in a time step, there is only one behavior (attack or recovery); and (3) recovery takes place only when all the target nodes have been attacked. Multiple periods are not considered in this research.

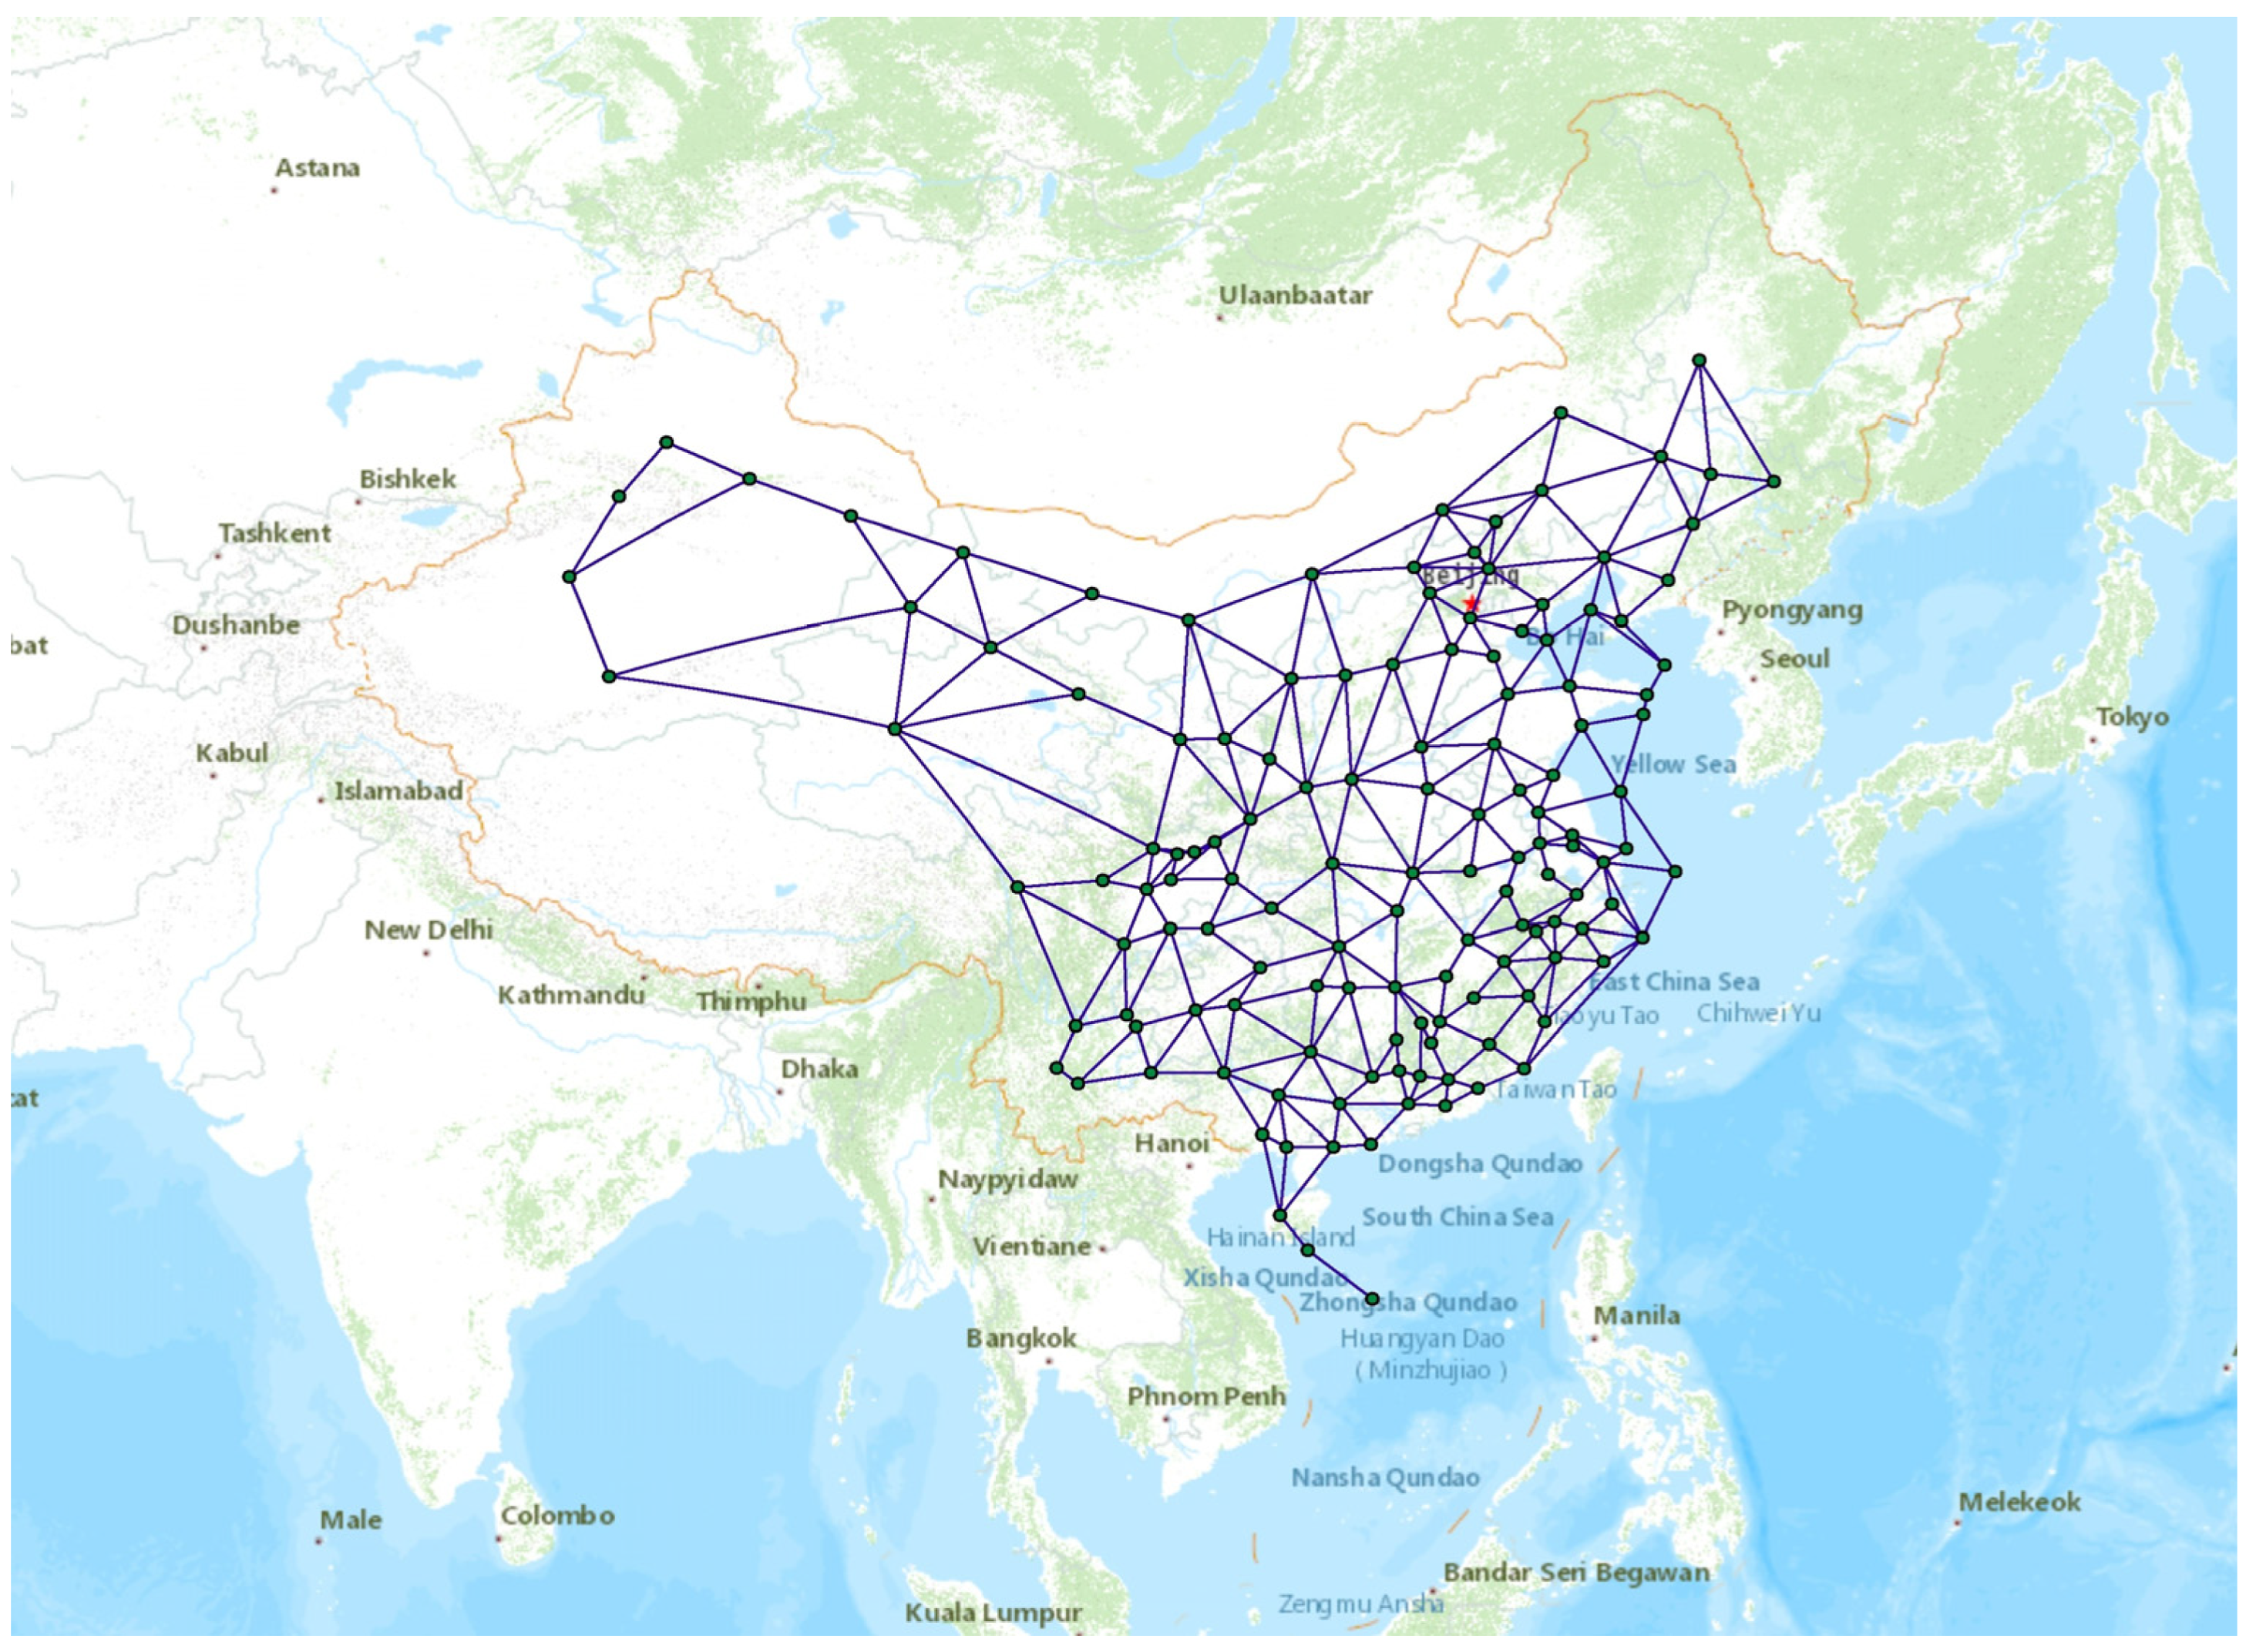
3. Data Acquisition and Description

This paper was written after obtaining the airspace sector data from AIP (Aeronautical Information Publication), a Chinese civil aviation domestic navigation data compilation. The ATSN was constructed following the rules in 2.1, and the essential topological characteristics of the ATSN were calculated [50,51].
Based on the construction of the network structure, we also considered the traffic flow of each air traffic sector, reflecting the actual operating conditions in air traffic management. We selected the ADS-B data from 15 July 2019 to 21 July 2019, including all domestic and international flights’ positional information. In order to avoid the effects of random fluctuations and potential uncertainties, we counted the average daily flow in each sector as a statistical measure.
The Chinese mainland ATSN contains 138 nodes with 308 edges. The sectors connect closely each other, and are distributed more densely in East China, North China, South China, and Southwest China. In contrast, Northwest China, Northeast China, and Xinjiang possess fewer sectors despite their sparse spatial distribution, which is due to the vast area, the scattered distribution of airports, and the small population density. The spatial and geographical distribution of the control sectors in mainland China is uneven, with the east having a denser distribution and the west having a sparser distribution.
The diameter of the ATSN is 15, indicating that the maximum distance between two connected sector nodes in the ATSN is 15. The density is 0.033, which suggests that the ATSN is a sparse network with few connecting edges between nodes. The transferability is 0.32, which means that the probability that two nodes connected to the same sector node in the ATSN are neighbors of each other is 32%. The average shortest path length is six, which denotes that flights from a sector in ATSN must pass through six sectors and receive commands from six controllers on average to reach the destination sector. During this period, pilots and controllers communicate and switch more frequently. The average degree of the ATSN is 4.46, which means that there are flight connections between one sector and the surrounding four adjacent sectors on average. The average aggregation coefficient of the ATSN is 0.33, which means that the relationships between each sector and its neighboring sectors are scattered, and that the controllers’ connections are sparse. Hence, the ATSN in mainland China has a small average aggregation coefficient, and a path length that is considerably shorter than elsewhere.

4. ATSN of China

4.1. Motif Identification

To study the micro-functional structure of the ATSN, we traversed all possible three-node and four-node undirected subgraphs of the ATSN. Ten thousand random networks with the same scale and degree values as the ATSN were constructed and used to identify motifs according to Equation (1). Table 2 includes all of the motifs and anti-motifs in the three-node and four-node subgraphs.
For the three-node subgraph structure, two widely found connectivity patterns exist in ATSNs. As shown in Table 2, 3-(a) displays the structure generated by two sectors that do not have directly connecting edges but possess edges that connect with the third sector. This V-shaped pattern exhibits an anti-motif structure. 3-(b) displays an interconnection structure formed of three fully connected sectors with a distinct motif structure. According to Milo et al.’s definition, 3-(b) serves as the structural building block of ATSNs [20].
For the four-node subgraph structure, the frequency of subgraphs 4-(d) and 4-(e) in the ATSN is higher than that in the stochastic randomized network, and they can be defined as having motif structures. The Motif 4-(d) framework has three connected sectors, one of which is connected to a fourth sector that is not attached to the other two. Motif 4-(e) shows that, apart from the structure of two sectors in the framework that are not directly connected, the rest of the nodes are connected to each other. Consequently, the count of linked edges in Motif 4-(e) is 5. The subgraph structure 4-(f) depicted in Figure 3 is non-existent in ATSNs and is therefore not included in Table 2. Of particular note, subgraph structure 4-(c) represents a square structure that forms a continuous edge relationship with only two adjacent sectors. Although the Z-value of 4-(c) is 0.810 (Z > 0), its p value fails to meet the cut off value we set (0.005). Thus, it is identified as an anti-motif with a tendency towards motif in this paper. By observing from 4-(a) to 4-(e), the number of connected edges increases gradually alongside a more complex connecting structure, and a reduced frequency is seen from 4-(a) to 4-(e). Motif 4-(e) exhibits the highest value of Z among all four-node motifs, indicating the greatest significance level.
Since the main objective of an ATSN is to increase the connectivity between sectors as much as possible in order to ensure the regular operation of flight flows and the safe handover of flights between sectors, an ideal ATSN should have more connected sectors to improve the overall performance. For a given topology size, the functional connectivity will increase with the tightness of the connections between the nodes. In a subgraph structure, the connectivity, in descending order, should be as follows:
4 - ( f ) > 4 - ( e ) > 4 - ( d ) = 4 - ( c ) > 4 - ( b ) = 4 - ( a )
According to the analysis above, subgraph structures with moderate and high connectivity should appear more often in the sector than random networks. Meanwhile, subgraph structures with low functional connectivity should occur less frequently than random networks. Hence, 4-(d), 4-(e), and 4-(f) should be motifs, and the significance positively correlates with the connectivity, while 4-(a) and 4-(b) should be anti-motifs. These two conclusions are consistent with the results in Table 2 (except for subgraph 4-(f)). Although 4-(f) possesses the highest connectivity among the four-node structures, in actual operation, it has redundant edges, leading to a waste of resources and workload increases for controllers between sectors during flight handover. Additionally, 4-(f) is often constrained by geographic space. Therefore, there is no subgraph 4-(f) in the ATSN of China’s mainland. From the perspective of subgraph topology, the ATSN of China has good functional connectivity and a reasonable design layout.

4.2. Subgraph Resilience Analysis

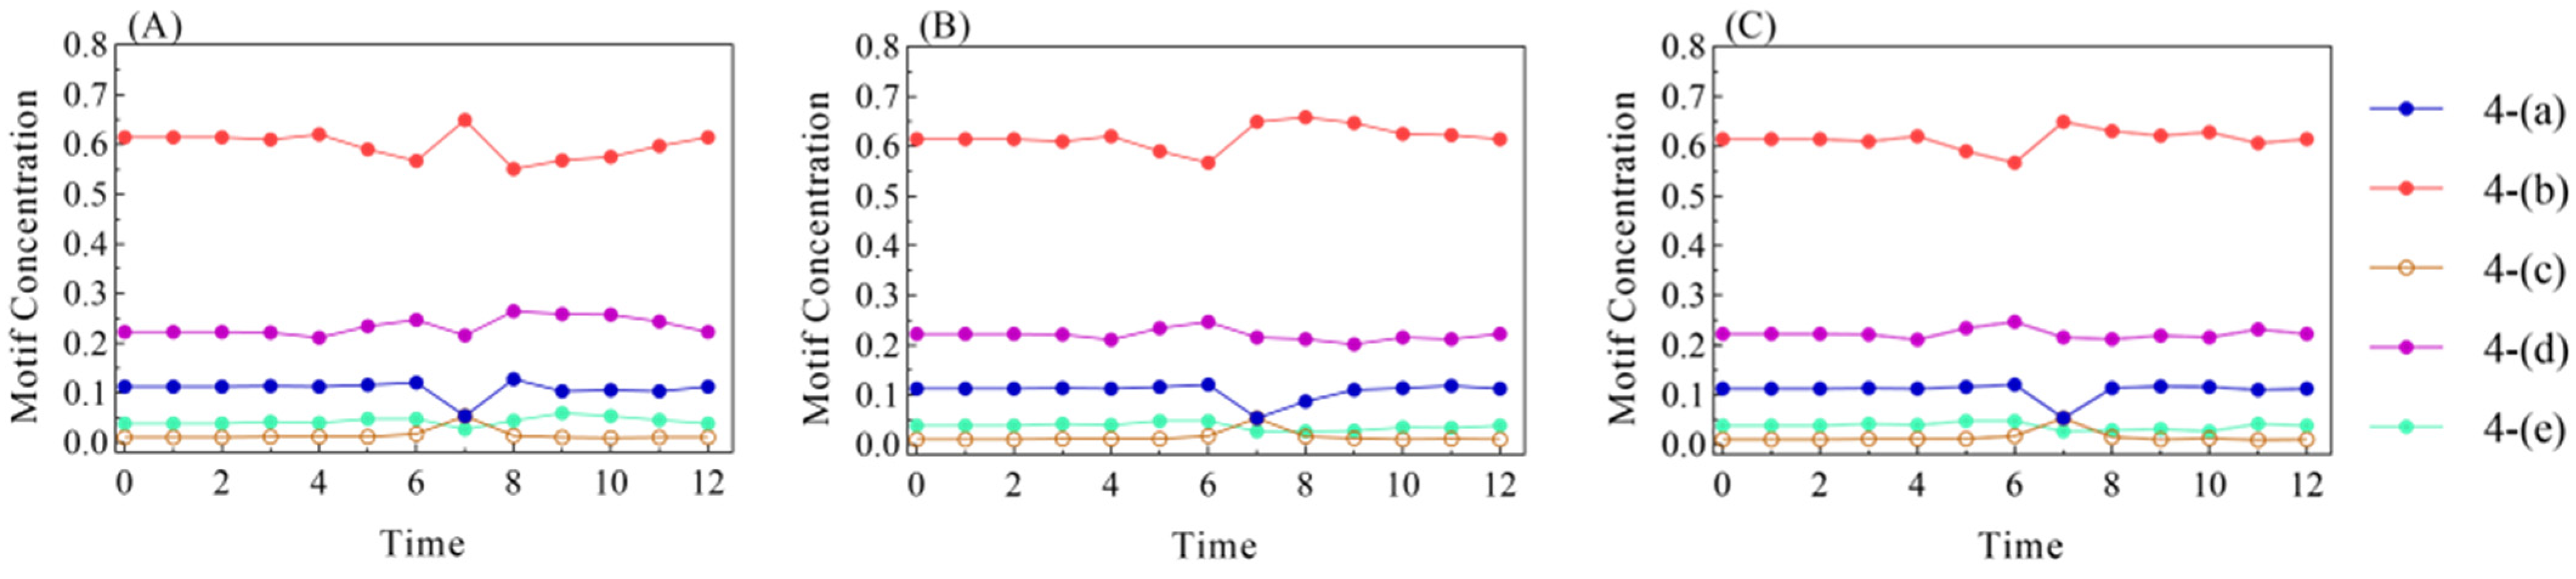
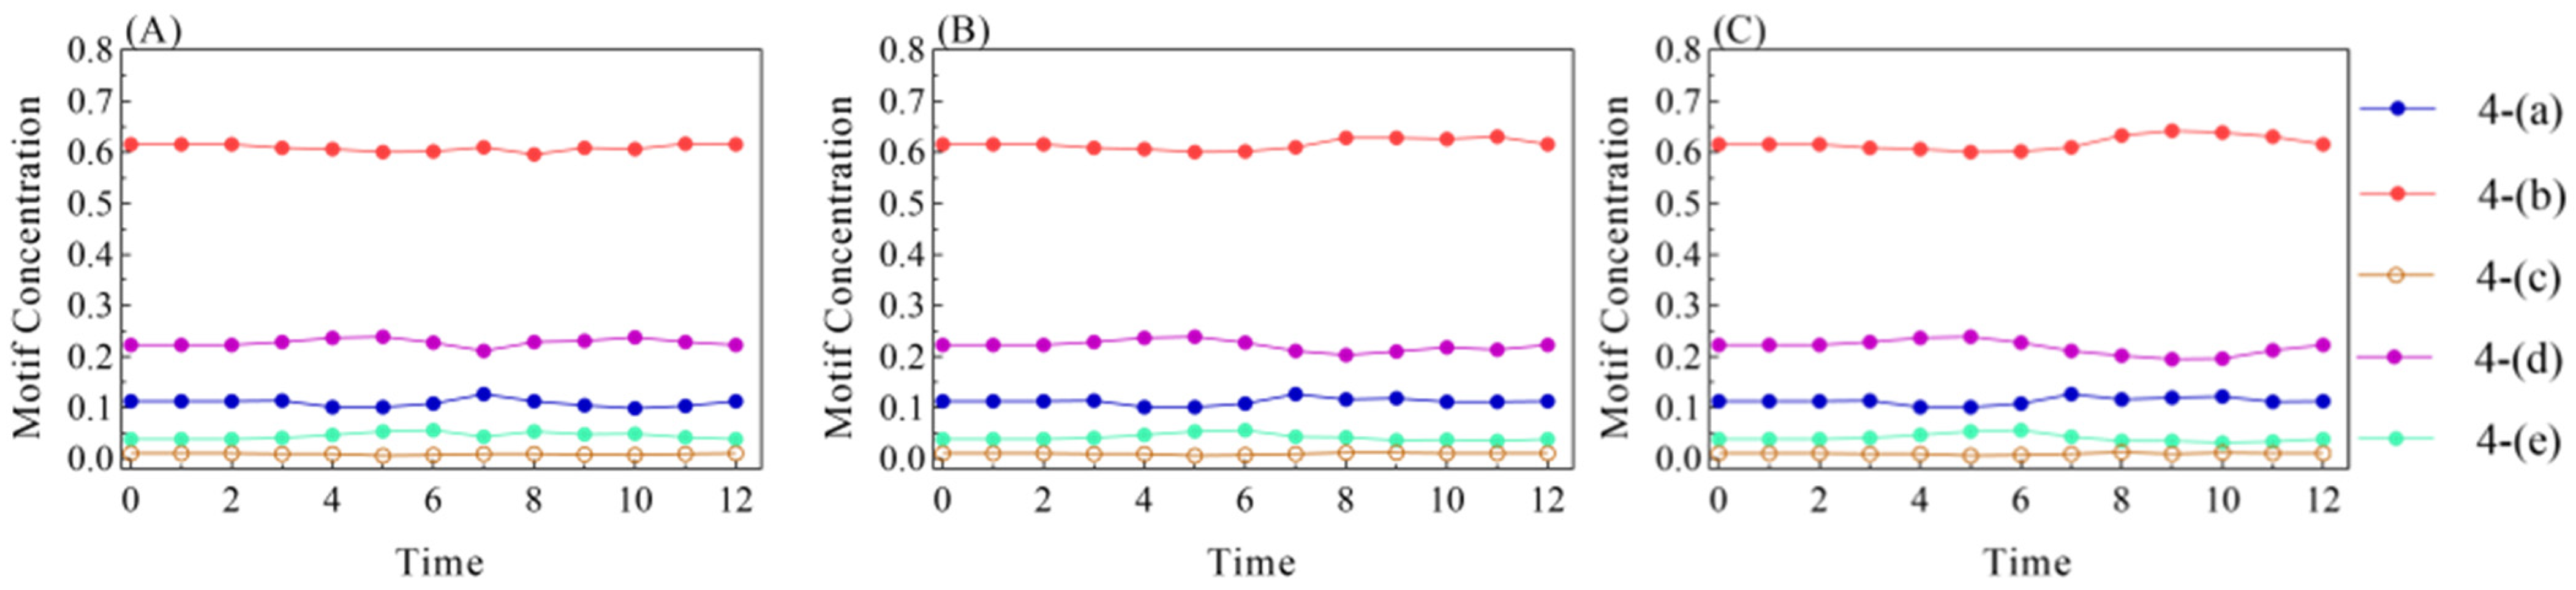
4.2.1. Subgraph Motif Concentration Analysis

Figure 5, Figure 6 and Figure 7 depict the motif concentration value of each heterogeneous subgraph structure in the ATSN under degree attack, betweenness attack, and flow attack with different recovery strategies.
The subgraph structure with lower connectivity occupies a higher subgraph motif concentration throughout the variation in the network and is the main structure constituting the ATSN. The subgraph structure 4-(b) occupies the highest proportion out of any whole network. Subgraphs with medium connectivity (4-(d)) possess a moderate ratio in ATSN. At the same time, structure 4-(f) with high connectivity not presents in the entire network. Therefore, the ATSN structure is composed of many subgraph structures with lower connectivity. The overall network connectivity level is improved by some medium connectivity subgraph structures and several high-connectivity subgraph structures.
As shown in Figure 5 and Figure 6, the concentration value of each heterogeneous subgraph fluctuates with just a slight variation. From time t = 6 to t = 8 , the network gradually shifts from the perturbed phase to the recovery phase, while the concentration value of each heterogeneous subgraph produces apparent fluctuation. Although the proportional distribution of each subgraph structure is relatively fixed during the resilience process of the network, it has a more pronounced response to the changing patterns of ATSNs (network disturbance, network recovery). During the perturbed failure process, the subgraph structures simultaneously show some fluctuations under the betweenness attack and the degree attack strategies. The subgraph concentration value of structures 4-(b) and 4-(c) shows an overall increase under the degree-based attack strategy, while subgraphs 4-(d) and 4-(e) have a more obvious decreasing trend, and subgraph structure 4-(a) remains stable in the process perturbed by degree values. This is primarily because 4-(d) and 4-(e) possess a node with a degree of 3, which is, to some extent, a large degree value. Therefore, when we attack the ATSN based on the degree index order, an enormous number of 4-(d) and 4-(e) structures are destroyed and split into other types of subgraph structures with lower connectivity. The disturbance phase of the network resilience process causes 4-(b)’s concentration value to increase and those of 4-(a) and 4-(d) to decrease. Nodes with larger betweenness have a certain influence on the structure 4-(b), while the nodes with smaller betweenness have a reduced influence on structure 4-(b) and a greater impact on the other subgraph structures. From t = 6 to t = 7 , the relative concentration values of subgraph structures 4-(a), 4-(c), and 4-(d) decrease. In the process of network recovery, the relative concentration of the five subgraph structures gradually stabilizes. The concentration value curves tend to be more parallel to the time axis, showing that the work’s structural recovery process gradually terminates with the evolution of the ATSN.
As shown in Figure 7, the subgraph concentration of each subgraph hardly changes during the resilience process in the case of flow-based attacks. Comparing Figure 5 and Figure 6 with Figure 7, the variation in the subgraph concentration for the traffic attack shows a significant difference compared to the other attack strategies. For faulty networks with flow-based attacks, none of the different recovery strategies produce a significant effect on subgraph concentrations. This indicates that the key topological metrics, such as degree value and meson number, have a greater impact on network microstructure than other factors. When a network is attacked using sector flow order, the microstructures of each heterogeneity measure of the ATSN have approximately the same failure rate, and thus, are represented by an approximately straight line in Figure 7.

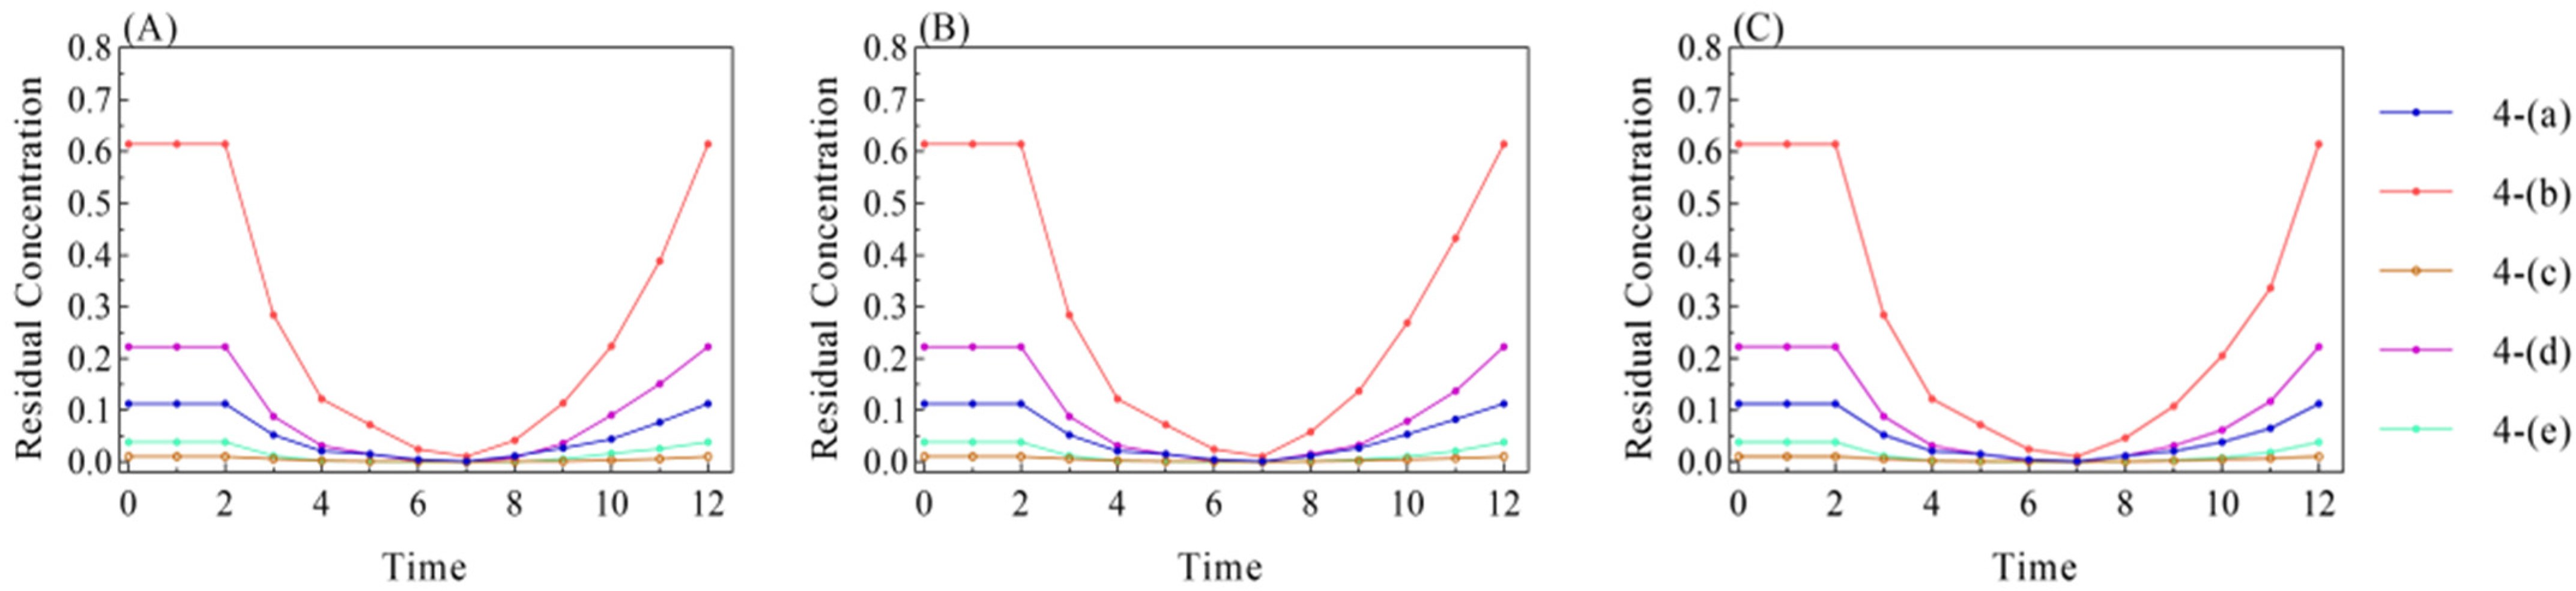
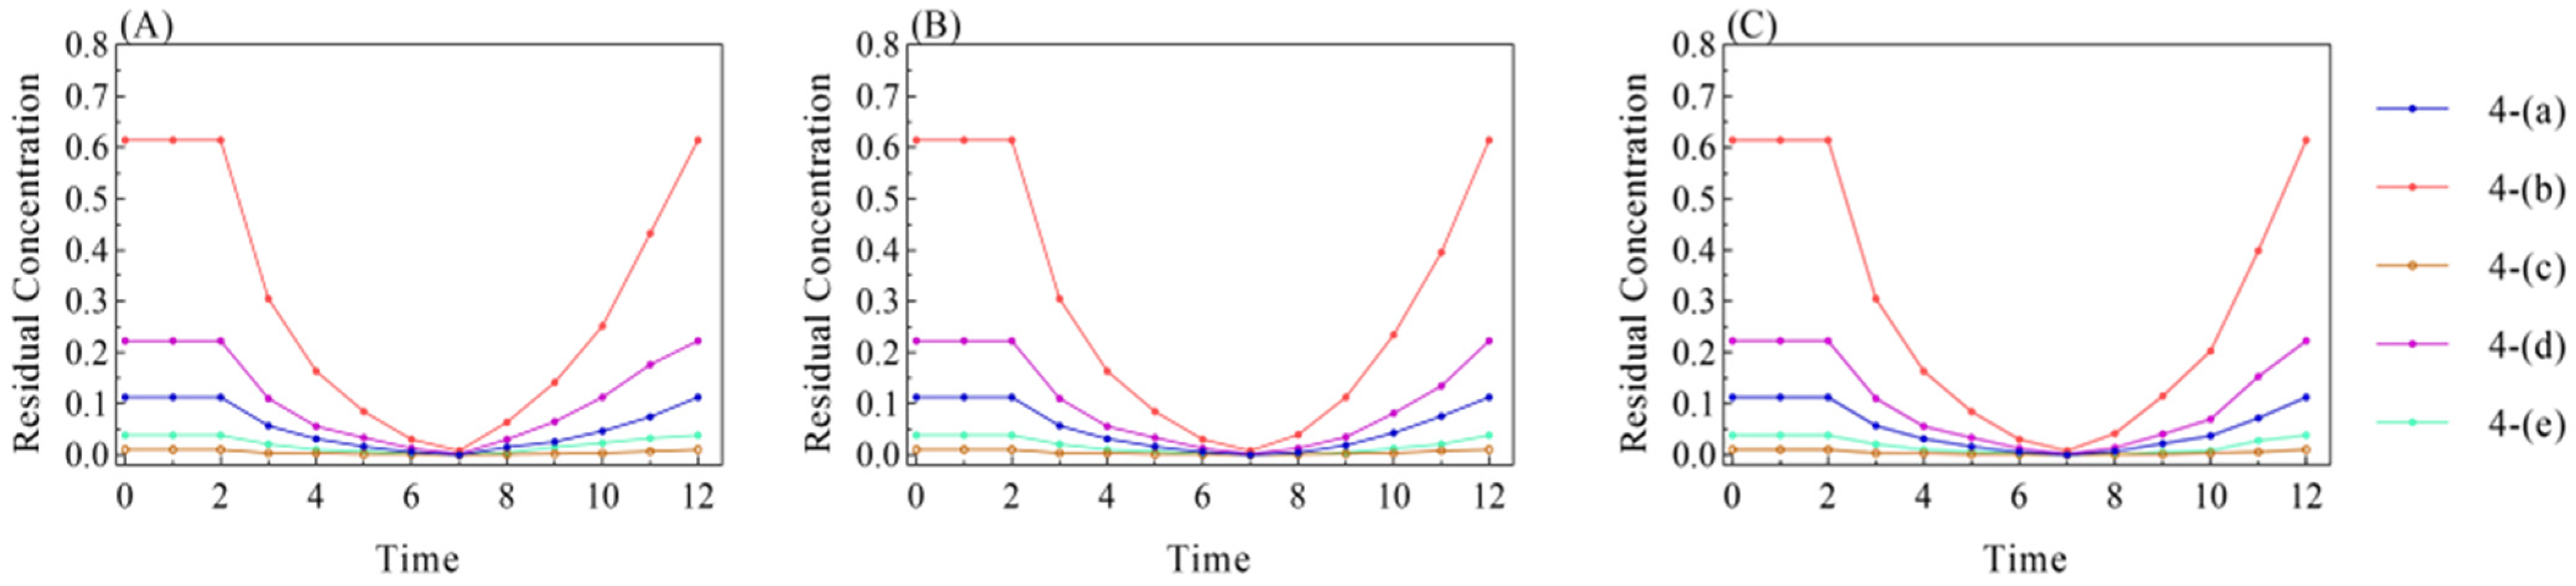
4.2.2. Subgraph Residual Concentration Analysis

Figure 8, Figure 9 and Figure 10 depict the variation in the subgraph residual concentration of each heterogeneous subgraph structure in the ATSN under various attack-recovery strategies.
As Figure 8 shows, the residual concentration of each subgraph structure in the network decreases rapidly from t = 2 to t = 4 when the ATSN is attacked under the degree-based strategy. The subgraph residual concentration in the network is already at a low level when 40% of the nodes are removed. The number of each subgraph structure is almost no longer reduced, indicating that each subgraph structure will be greatly affected when the nodes with large degree values are removed from the network and that the structure is relatively insensitive to the nodes with a small degree.
Similarly, in Figure 9, the residual concentration of each subgraph structure under the betweenness attack tends to descend fast, decreasing relatively quickly from t = 2 to t = 3 , before descending more slowly for subgraph structure 4-(b), which accounts for the largest number of subgraph structures in the ATSN.
As shown in Figure 10, the residual concentration of each heterogeneous subgraph decreases at a smoother rate under the flow attack strategy, suggesting that the air traffic flow metrics of the ATSN have less of an impact on the subgraph microstructure. This is consistent, to some extent, with the conclusions drawn in Figure 6.
Comparing Figure 8A and Figure 8B, two recovery strategies (degree recovery, betweenness recovery) are performed for the network under the degree attack. During the initial recovery, both recovery strategies have a limited effect on the growth rate of the residual concentration of subgraph structures, and as the ATSN evolves, the residual subgraph concentration values of each heterogeneous structure grow faster until the whole network returns to a normal operational state. Figure 8C represents the flow recovery strategy under the degree attack. It is evident that the recovery of each heterogeneous subgraph proceeds at a slower rate during each time step compared to the other two strategies.
For Figure 9, the degree and betweenness recovery strategies have better microstructural restoration effects than the flow recovery method for betweenness-disturbed networks. In contrast to the other two cases in Figure 8 and Figure 9, the three recovery methods shown in Figure 10 have a minimal impact on the growth of the residual concentration within each of the heterogeneous subgraphs of the ATSN.

4.2.3. System Resilience of ATSN

In Figure 11, Figure 12 and Figure 13 the macroscopic resilience of the ATSN is calculated under various attack-recovery modes. As depicted in Figure 11 and Figure 12, the maximum connectivity subgraph (G) of the network shows similar perturbed patterns under attacks with degree and betweenness. The relative value of the maximum connectivity subgraph drops significantly to only 0.058 when 50% of the nodes are removed, rendering the ATSN essentially disconnected. In Figure 13, the relative value of the maximum connectivity subgraph decreases at a slower rate, and the network structure endures less damage when attacked based on the flow strategy. When half of the nodes are removed, the ATSN remains connected to a certain degree. The relative value of the maximum connectivity subgraph (G) is 0.319 at t = 7.
Meanwhile, when comparing Figure 10A,B with Figure 11A,B, it is evident that the degree recovery process follows a similar recovery mode to that of betweenness recovery for different networks (degree-disrupted and betweenness-disrupted networks). The maximum connected subgraph of the network exhibits a more pronounced growth trend in the early stages of network recovery. At the later stage of network recovery (t = 9 to t = 12), the sectors with small topological metrics (degree and betweenness) exhibit limited influence on the restoration of the network structure. In the case of a flow-disrupted ATSN, the betweenness and degree recovery strategies demonstrate a better recovery effect at t = 7. Subsequently, the maximum connectivity subgraph of the network exhibits an almost-equal recovery rate at each time step.
Comparing Figure 11C, Figure 12C and Figure 13C, for different disrupted networks, the flow recovery policy has different recovery effects. For degree-disrupted networks and flow-disrupted networks, the maximum connectivity subgraph under the flow recovery policy shows a stepwise recovery process. For the betweenness-disrupted network, the recovery speed of the maximum connectivity subgraph of the network shows a curve of fast change at first, followed by slow alteration.

4.2.4. Comparison of Subgraph Resilience and System Resilience

Table 3 shows the subgraph resilience and the system resilience of ATSNs under different circumstances.
As shown in Table 3, for subgraph structures 4-(a), 4-(b), 4-(d), and 4-(e), the DA-FR pattern has the most significant effect on subgraph resilience loss. For the subgraph structure 4-(c), the BA-FR process exhibits the greatest reduction in subgraph resilience. This could be attributed to 4-(c) having the lowest motif concentration in the ATSN, resulting in a distinct performance of resilience loss during the network’s attack-recovery process, when compared to the other structures. All heterogenous subgraph structures incur the minimum subgraph resilience loss under the FA-BR simulation case.
From a macroscopic perspective, DA-FR and FA-BR are the attack-recovery modes with the most and least significant effects on the system resilience loss of the ATSN, respectively. This result aligns with the microscopic resilience performance of each heterogeneous subgraph to some extent.
During the process of network disruption, the flow-based attack strategy leads to the lowest impact on the network macroscopic structure connectivity, as well as the microscopic subgraph function. When comparing the different recovery modes under the same attack mode, the effect of the flow-based recovery strategy is consistently weaker than that of the topology-based (degree, betweenness) recovery strategy, both at the macro level and at the micro level, indicating a greater loss value of resilience. Therefore, emphasis should be placed on protecting those sectors with high degrees and betweenness in air traffic management. In the event of a major network failure in the sector, it is recommended that a recovery strategy based on topology metrics be implemented in order to rapidly restore the functionality and connectivity of the network at both the macro and micro levels. It is worth noting that there is extensive research in the literature discussing the differential impact of degree and betweenness on network structure [4,17]. However, for the ATSN, the disparities in the impacts of the two on resilience from both the macro and micro perspectives are restricted.
Comparing Figure 8, Figure 9 and Figure 10 with Figure 11, Figure 12 and Figure 13, it is evident that the maximum connectivity subgraph’s relative value diminishes significantly at a certain point in time. However, the decay rate of the residual concentration of each heterogeneous subgraph of the network decreases as time advances (continuous removal of target nodes), and a similar phenomenon also exists in the recovery process of the ATSN. This indicates a fundamental distinction in the evolutionary mechanism between the macroscopic and microscopic manifestations throughout the resilience process.

5. Conclusions

To improve the comprehension of the sustainable operations and structural characteristics of air traffic sectors, this study utilizes complex network theory to develop a sector network in mainland China. By applying microscopic motif detection, this study investigates the micro-structural characteristics of these sectors. Then, the concepts of subgraph concentration and residual concentration are proposed to evaluate the resilience of the air traffic sector network from a micro perspective. The resilience performance of ATSNs under different scenarios is compared from both micro and macro perspectives. The principal conclusions of this research are as follows:
(1)
Subgraphs with high connectivity are those with a motif structure in the ATSN (3-(b), 4-(d), and 4-(e)), while the subgraph structures 3-(a), 4-(a), and 4-(b), with lower connectivity, perform as anti-motifs.
(2)
The ATSN network comprises a considerable number of subgraph structures with low connectivity. The use of subgraph structures with moderate connectivity, as well as several with higher connectivity, has improved overall network accessibility.
(3)
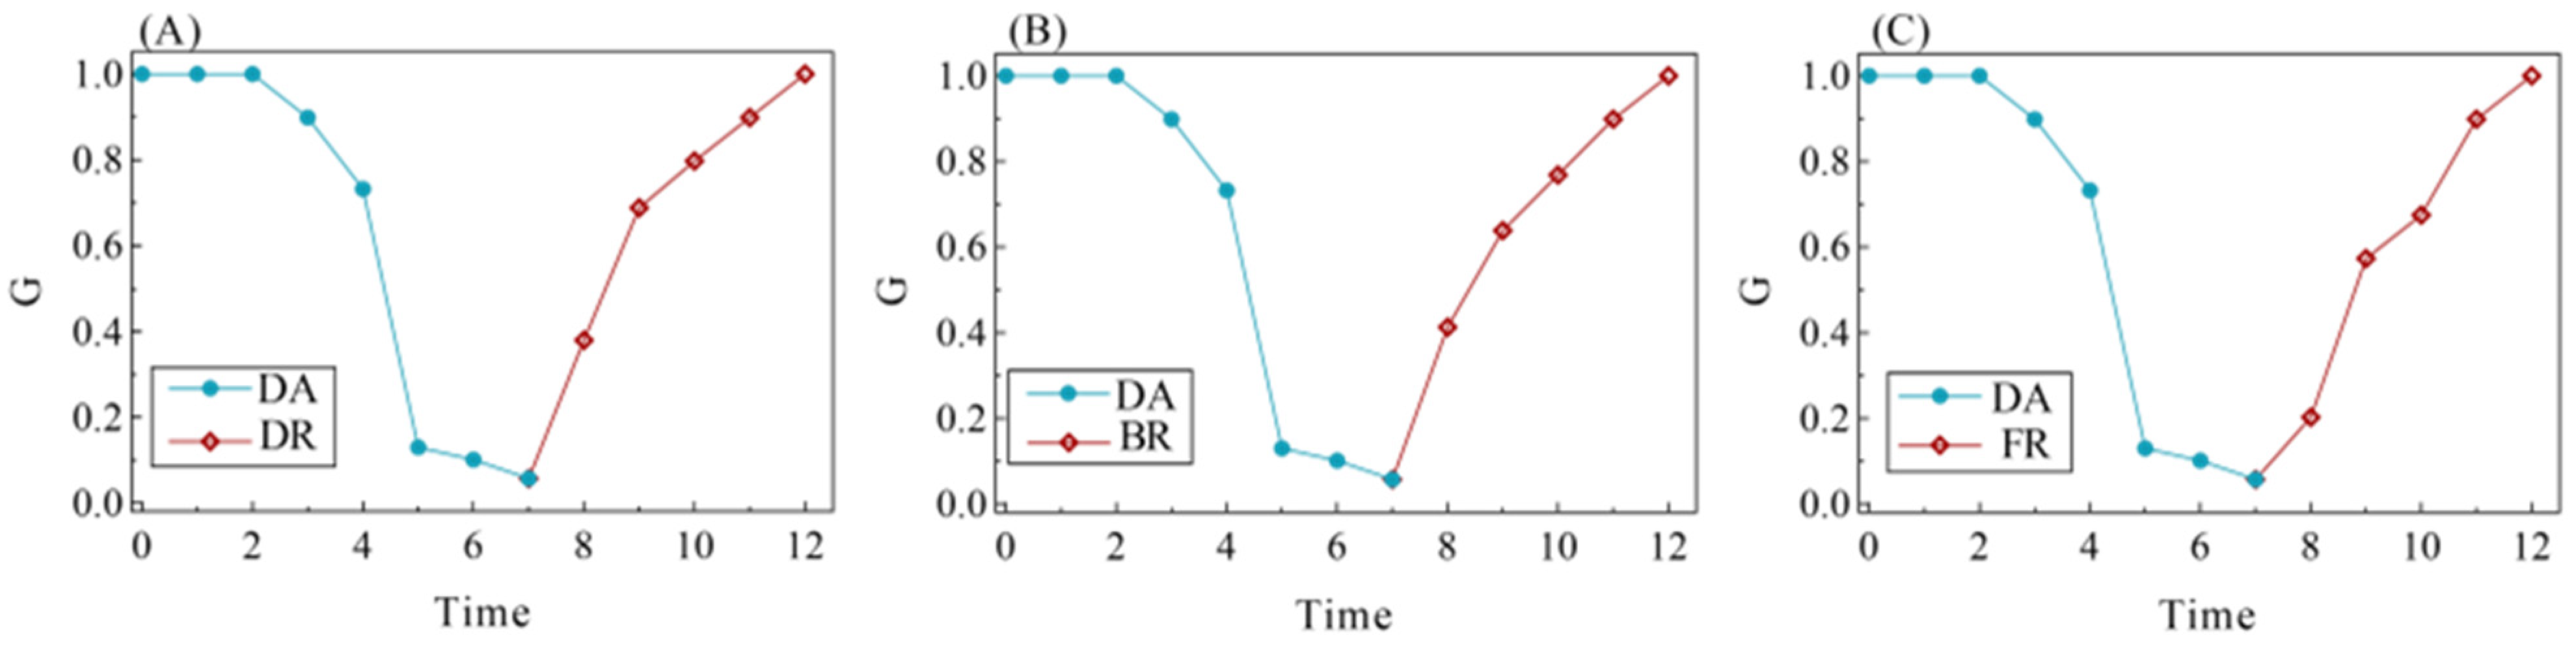
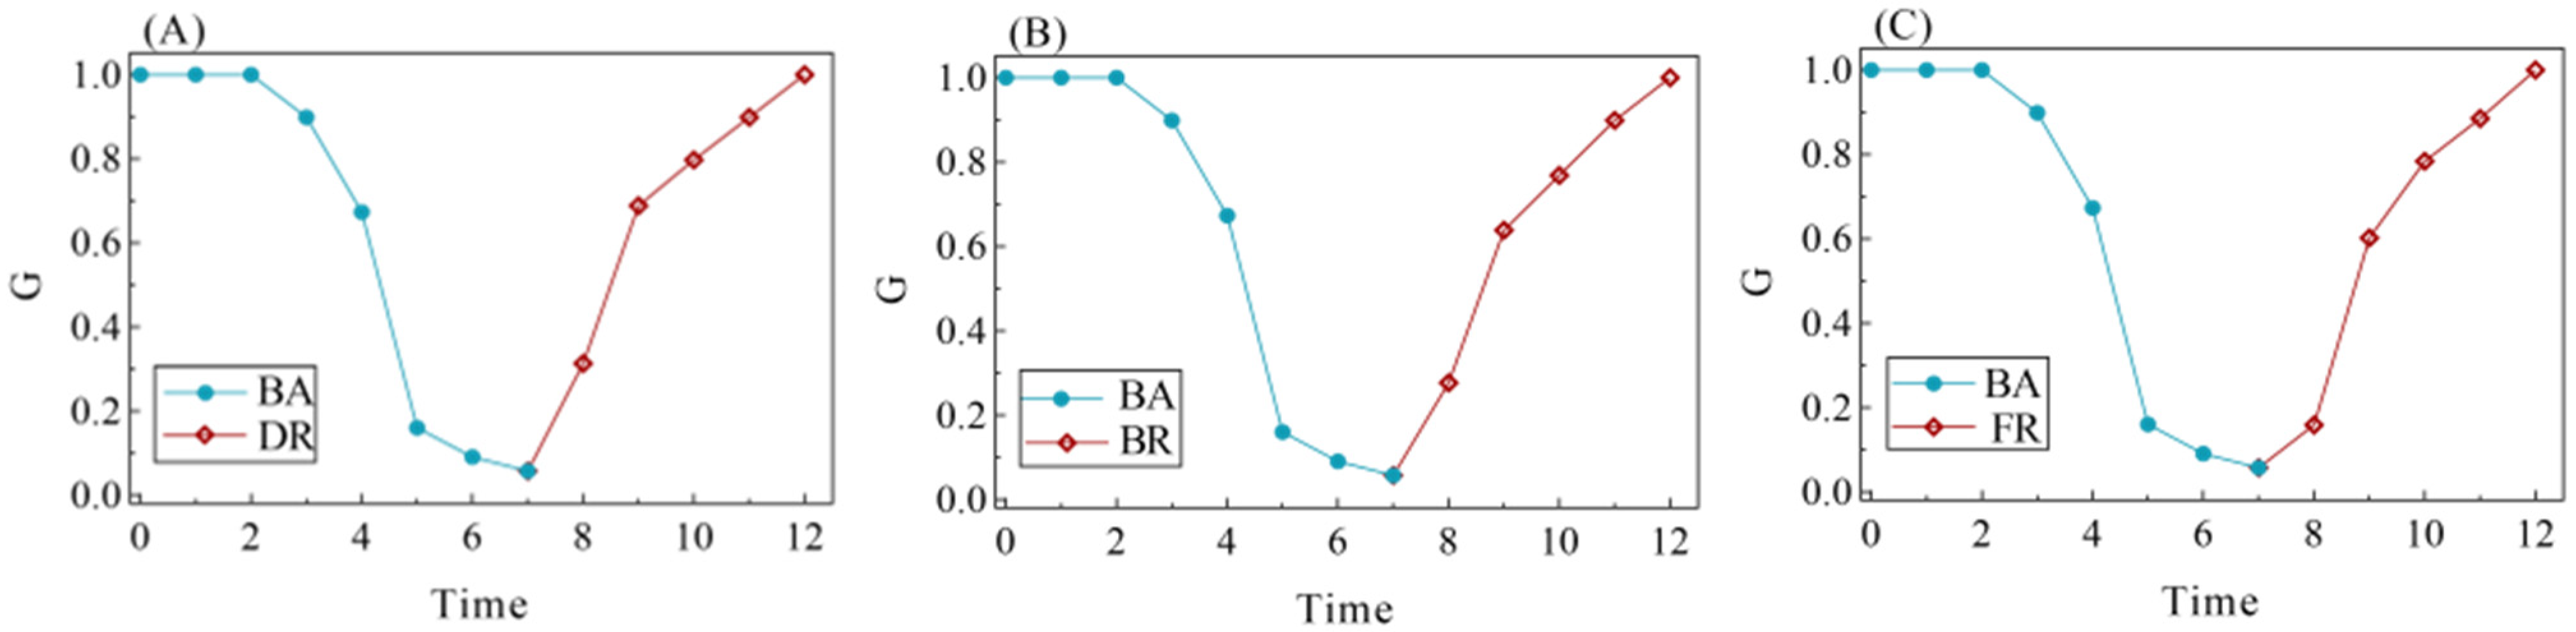
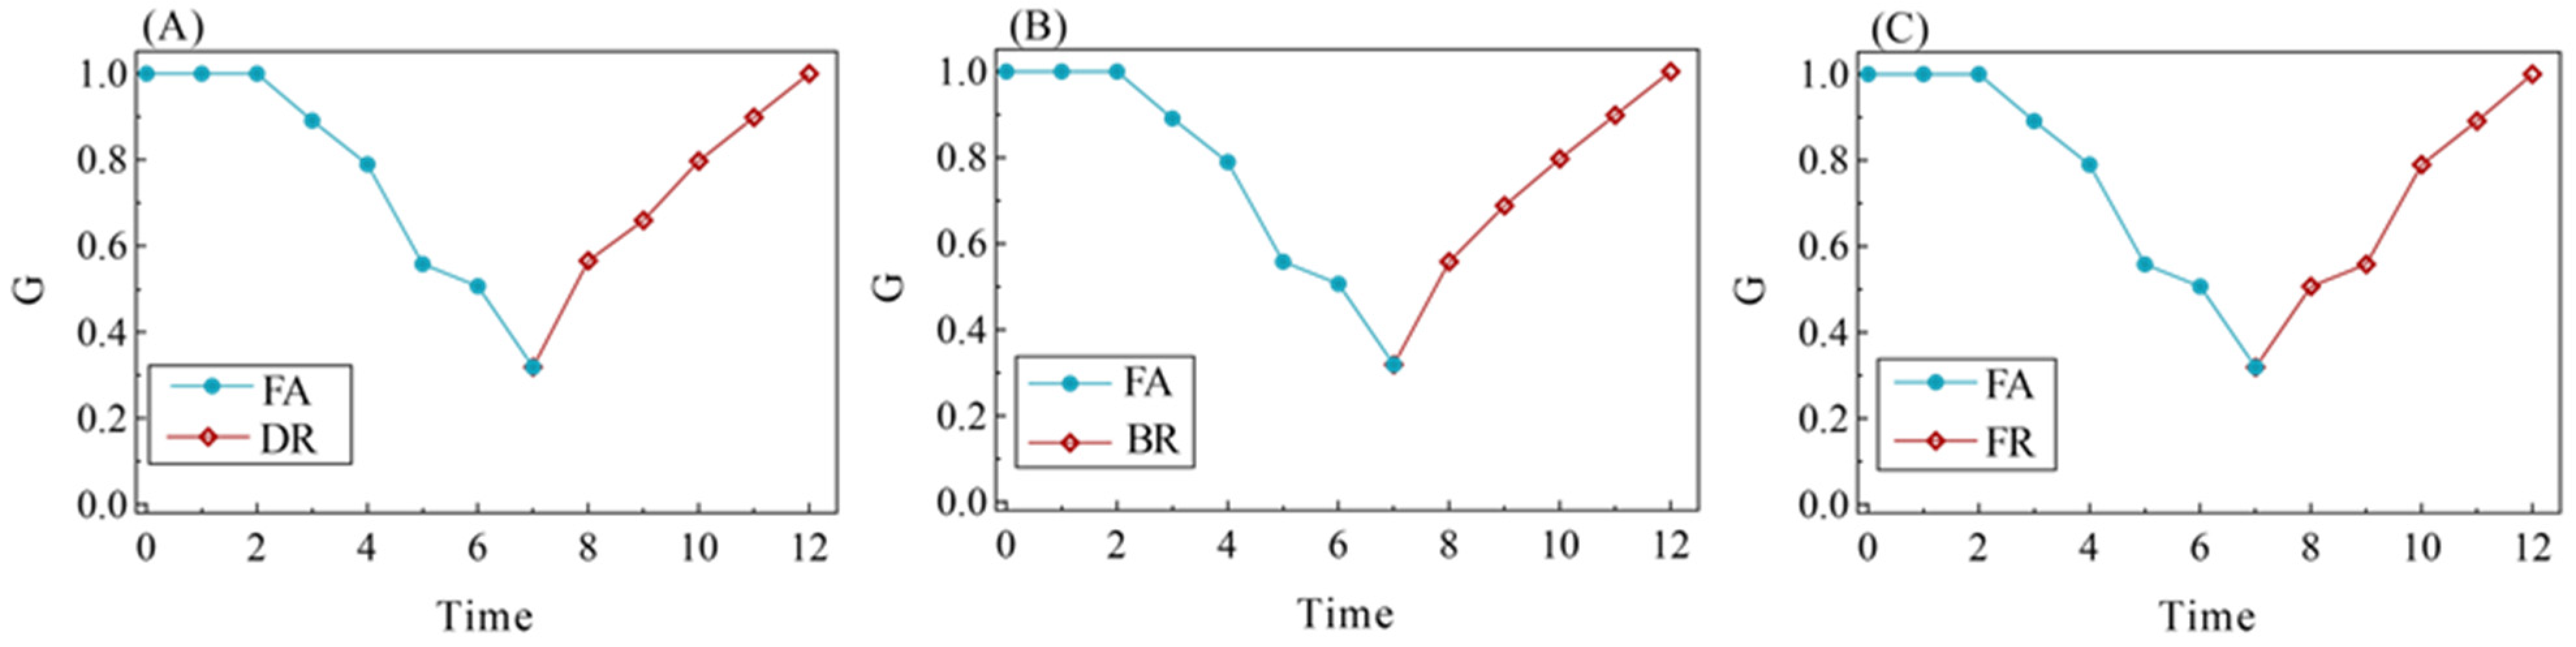
There is a level of coherence between the macro- and micro-expressions of the resilience process in air traffic sector networks. The DA-FR process has the most substantial impact on resilience performance.
(4)
Structure-based perturbations are found to have a higher impact on network subgraph resilience as well as system resilience performance, whereas traffic flow has limited impact at both the macro and micro levels. In air traffic management, controllers should prioritize ensuring the normal functioning of sectors with a high degree and betweenness.
In conclusion, this research is significant insofar as it reveals the preference for connections between sectors and the underlying operation mechanism of the network during the disturbance and recovery process. The coherent relationship between overall system resilience and local network subgraph structure is discussed in this study. The methodology proposed in this paper provides a reference for the sustainable operation of civil aviation systems and can be widely applied to the performance of system resilience assessments in other fields. In future research, we will additionally consider the interaction relationship between sector capacity and traffic flow, alongside the impact of human factors such as controller behavior on sector resilience, in order to provide theoretical guidance for the sustainable operation of air traffic systems.

Author Contributions

Conceptualization, H.Z.; methodology, Z.S. and H.Z.; software, Z.S. and H.Z.; validation, Y.L., H.Z. and Z.S.; formal analysis, J.Z. and H.Z.; investigation, J.Z. and H.Z.; resources, Z.S., H.Z. and Y.L.; writing—original draft preparation, Y.L. and J.Z.; writing—review and editing, Z.S., Y.L. and J.Z.; visualization, J.Z. and Y.L. All authors have read and agreed to the published version of the manuscript.

Funding

This research was funded by the National Natural Science Foundation of China (U2133207).

Institutional Review Board Statement

Not applicable.

Informed Consent Statement

Not applicable.

Data Availability Statement

The data will be made available on request.

Conflicts of Interest

The authors declare no conflict of interest.

References

  1. Guimera, R.; Mossa, S.; Turtschi, A.; Amaral, L.N. The worldwide air transportation network: Anomalous centrality. Communit structure, and cities’ global roles. Proc. Natl Acad. Sci. USA 2005, 102, 7794–7799. [Google Scholar] [CrossRef]
  2. Ren, G.; Lu, C.; Zhu, J.; Liu, X. Analyzing the topological characteristic and key nodes of Chinese air sector network. Int. J. Mod. Phys. B 2019, 33, 112–121. [Google Scholar] [CrossRef]
  3. Clark, K.L.; Bhatia, U.; Kodra, E.A.; Ganguly, A.R. Resilience of the US national airspace system airport network. IEEE Trans. Intell. Transp. Syst. 2018, 19, 3785–3794. [Google Scholar] [CrossRef]
  4. Chi, L.P.; Cai, X. Structural changes caused by error and attack tolerance in US airport network. Int. J. Mod. Phys. B 2004, 18, 2394–2400. [Google Scholar] [CrossRef]
  5. Bharali, A.; Baruah, D. On structure and robustness of airport network of India. Res. Rev. Discret. Math. Struct. 2018, 5, 26–33. [Google Scholar]
  6. Pien, K.-C.; Han, K.; Shang, W.; Majumdar, A.; Ochieng, W. Robustness analysis of the European air traffic network. Transp. A 2015, 11, 772–792. [Google Scholar] [CrossRef]
  7. Zhou, J.; Coit, D.W.; Felder, F.A.; Wang, D. Resiliency-based restoration optimization for dependent network systems against cascading failures. Reliab. Eng. Syst. Saf. 2020, 207, 107383. [Google Scholar] [CrossRef]
  8. Wang, J.; Mo, H.; Wang, F.; Jin, F. Exploring the network structure and nodal centrality of China’s air transport network: A complex network approach. J. Transp. Geogr. 2011, 19, 712–721. [Google Scholar] [CrossRef]
  9. Wuellner, D.R.; Roy, S.; D’Souza, R.M. Resilience and rewiring of the passenger airline networks in the United States. Phys. Rev. E 2010, 82, 056101. [Google Scholar] [CrossRef]
  10. Requião da Cunha, B.; González-Avella, J.C.; Gonçalves, S. Fast Fragmentation of Networks Using Module-Based Attacks. PLoS ONE 2015, 10, e0142824. [Google Scholar] [CrossRef] [PubMed]
  11. Cong, W.; Hu, M.; Dong, B.; Wang, Y.; Feng, C. Empirical analysis of airport network and critical airports. Chin. J. Aeronaut. 2016, 29, 512–519. [Google Scholar] [CrossRef]
  12. Clusella, P.; Grassberger, P.; Pérez-Reche, F.J.; Politi, A. Immunization and Targeted Destruction of Networks using Explosive Percolation. Phys. Rev. Lett. 2016, 117, 208301. [Google Scholar] [CrossRef] [PubMed]
  13. Kim, H.; Anderson, R. An Experimental Evaluation of Robustness of Networks. IEEE Syst. J. 2013, 7, 179–188. [Google Scholar] [CrossRef]
  14. Chen, Y.; Wang, J.; Jin, F. Robustness of China’s air transport network from 1975 to 2017. Phys. A Stat. Mech. Appl. 2020, 539, 122876. [Google Scholar] [CrossRef]
  15. Wilkinson, S.M.; Dunn, S.; Ma, S. The vulnerability of the European air traffic network to spatial hazards. Nat. Hazards 2012, 60, 1027–1036. [Google Scholar] [CrossRef]
  16. Qi, Y.N.; Gao, J.D. Cascading failure invulnerability and optimization strategy of air space sector network. Acta Aeronaut. Astronaut. Sin. 2018, 39, 322579. [Google Scholar]
  17. Wang, X.L.; He, M.; Liu, M.X. Air traffic CPS cascading failure and mitigation strategy. J. Beijing Univ. Aeronaut. Astronaut. 2021, 47, 2426–2433. [Google Scholar]
  18. Mirzasoleiman, B.; Babaei, M.; Jalili, M.; Safari, M. Cascaded failures in weighted networks. Phys. Rev. E 2011, 84, 046114. [Google Scholar] [CrossRef] [PubMed]
  19. Sun, X.; Wandelt, S.; Fricke, H.; Rosenow, J. The Impact of COVID-19 on Air Transportation Network in the United States, Europe, and China. Sustainability 2021, 13, 9656. [Google Scholar] [CrossRef]
  20. Shen-Orr, S.S.; Milo, R.; Mangan, S.; Alon, U. Network motifs in the transcriptional regulation network of Escherichia coli. Nature Genet. 2002, 31, 64–68. [Google Scholar] [CrossRef]
  21. Schultz, P.; Heitzig, J.; Kurths, J. Detours around basin stability in power networks. New J. Phys. 2014, 16, 125001. [Google Scholar] [CrossRef]
  22. Gorochowski, T.E.; Grierson, C.S.; di Bernardo, M. Organization of feed-forward loop motifs reveals architectural 550 principles in natural and engineered networks. Sci. Adv. 2018, 4, eaap9751. [Google Scholar] [CrossRef]
  23. Hosseini, S.; Barker, K.; Ramirez-Marquez, J.E. A review of definitions and measures of system resilience. Reliab. Eng. Syst. Saf. 2016, 145, 47–61. [Google Scholar] [CrossRef]
  24. Holling, S.C. Resilience and Stability of Ecological Systems. Annu. Rev. Ecol. Syst. 1973, 4, 1–23. [Google Scholar] [CrossRef]
  25. Tamvakis, P.; Xenidis, Y. Comparative evaluation of resilience quantification methods for infrastructure systems. Procd. Soc. Behv. 2013, 74, 339–348. [Google Scholar] [CrossRef]
  26. Bocchini, P.; Frangopol, D.M.; Ummenhofer, T.; Zinke, T. Resilience and Sustainability of Civil Infrastructure: Toward a Unified Approach. J. Infrastruct. Syst. 2014, 20, 04014004. [Google Scholar] [CrossRef]
  27. Zeng, X.; Yu, Y.; Yang, S.; Lv, Y.; Sarker, M.N.I. Urban Resilience for Urban Sustainability: Concepts, Dimensions, and Perspectives. Sustainability 2022, 14, 2481. [Google Scholar] [CrossRef]
  28. Sapountzaki, K. Risk Mitigation, Vulnerability Management, and Resilience under Disasters. Sustainability 2022, 14, 3589. [Google Scholar] [CrossRef]
  29. Ling, T.-Y. Dynamic Flood Resilience Typology: A Systemic Transitional Adaptation from Peitou Plateau, Taiwan. Sustainability 2022, 14, 875. [Google Scholar] [CrossRef]
  30. Gama Dessavre, D.; Ramirez-Marquez, J.E.; Barker, K. Multidimensional approach to complex system resilience analysis. Reliab. Eng. Syst. Saf. 2016, 149, 34–43. [Google Scholar] [CrossRef]
  31. Panteli, M.; Trakas, D.N.; Mancarella, P.; Hatziargyriou, N.D. Power Systems Resilience Assessment: Hardening and Smart Operational Enhancement Strategies. Proc. IEEE 2017, 105, 1202–1213. [Google Scholar] [CrossRef]
  32. Beyza, J.; Yusta, J.M. Integrated Risk Assessment for Robustness Evaluation and Resilience Optimisation of Power Systems after Cascading Failures. Energies 2021, 14, 2028. [Google Scholar] [CrossRef]
  33. Bai, X.; Liang, L.; Zhu, X. Improved Markov-chain-based ultra-short-term PV forecasting method for enhancing power system resilience. J. Eng. 2021, 2021, 114–124. [Google Scholar] [CrossRef]
  34. Tang, J.; Heinimann, H.; Han, K.; Luo, H.; Zhong, B. Evaluating resilience in urban transportation systems for sustainability: A systems-based Bayesian network model. Transp. Res. Part C Emerg. Technol. 2020, 121, 102840. [Google Scholar] [CrossRef]
  35. Tang, J.; Heinimann, H.R. A resilience-oriented approach for quantitatively assessing recurrent spatial-temporal congestion on urban roads. PLoS ONE 2018, 13, e0190616. [Google Scholar] [CrossRef] [PubMed]
  36. Francis, R.; Bekera, B. A metric and frameworks for resilience analysis of engineered and infrastructure systems. Reliab. Eng. Syst. Saf. 2014, 121, 90–103. [Google Scholar] [CrossRef]
  37. Cardoni, A.; Cimellaro, G.P.; Domaneschi, M.; Sordo, S.; Mazza, A. Modeling the interdependency between buildings and the electrical distribution system for seismic resilience assessment. Int. J. Disaster Risk Reduct. 2020, 42, 101315. [Google Scholar] [CrossRef]
  38. Stubna, M.D.; Fowler, J. An application of the highly optimized tolerance model to electrical blackouts. Int. J. Bifurc. Chaos 2003, 13, 237–242. [Google Scholar] [CrossRef]
  39. Wang, Y.; Zhan, J.; Xu, X.; Li, L.; Chen, P.; Hansen, M. Measuring the resilience of an airport network. Chin. J. Aeronaut. 2019, 32, 2694–2705. [Google Scholar] [CrossRef]
  40. Wong, A.; Tan, S.; Chandramouleeswaran, K.R.; Tran, H.T. Data-driven analysis of resilience in airline networks. Transp. Res. Part E Logist. Transp. Rev. 2020, 143, 102068. [Google Scholar] [CrossRef]
  41. Yang, H.; Le, M.; Wang, D. Airline Network Structure: Motifs and Airports’ Role in Cliques. Sustainability 2021, 13, 9573. [Google Scholar] [CrossRef]
  42. Jin, Y.; Wei, Y.; Xiu, C.; Song, W.; Yang, K. Study on Structural Characteristics of China’s Passenger Airline Network Based on Network Motifs Analysis. Sustainability 2019, 11, 2484. [Google Scholar] [CrossRef]
  43. Du, W.B.; Zhang, M.Y.; Zhang, Y.; Cao, X.B.; Zhang, J. Delay causality network in air transport systems. Transp. Res. Part E Logist. Transp. 2018, 118, 466–476. [Google Scholar] [CrossRef]
  44. Kurant, M.; Thiran, P. Extraction and analysis of traffic and topologies of transportation networks. Phys. Rev. E 2006, 74, 036114. [Google Scholar] [CrossRef] [PubMed]
  45. Wernicke, S.; Rasche, F. FANMOD: A tool for fast network motif detection. Bioinformatics 2006, 22, 1152–1153. [Google Scholar] [CrossRef]
  46. Wernicke, S. Efficient Detection of Network Motifs. IEEE-ACM Trans. Comput. Biol. Bioinform. 2006, 3, 347–359. [Google Scholar] [CrossRef] [PubMed]
  47. Wernicke, S. A faster algorithm for detecting network motifs. In Proceedings of the 5th Workshop on Algorithms in Bioinformatics (WABI ‘05). Lecture Notes in Bioinformatics, Mallorca, Spain, 3–6 October 2005. [Google Scholar]
  48. Chen, P.Y.; Hero, A.O. Assessing and safeguarding network resilience to nodal attacks. IEEE Commun. Mag 2014, 52, 138–143. [Google Scholar] [CrossRef]
  49. Gutfraind, A. Optimizing topological cascade resilience based on the structure of terrorist networks. PLoS ONE 2010, 5, e13448. [Google Scholar] [CrossRef]
  50. Albert, R.; Barabási, A.L. Statistical mechanics of complex networks. Rev. Mod. Phys. 2002, 74, 47–97. [Google Scholar] [CrossRef]
  51. Zanin, M.; Lillo, F. Modelling the air transport with complex networks: A short review. Eur. Phys. J. Spec. Top. 2013, 215, 5–21. [Google Scholar] [CrossRef]
Figure 1. Schematic diagram of overall air traffic sector system operation.
Sustainability 15 13423 g001
Figure 2. Sector network of mainland China.
Sustainability 15 13423 g002
Figure 3. Three-node and four-node subgraph structures.
Sustainability 15 13423 g003
Figure 4. System resilience performance.
Sustainability 15 13423 g004
Figure 5. Subgraph motif concentration assessment with degree attack and different recovery strategies: (A) degree recovery; (B) betweenness recovery; (C) flow recovery.
Sustainability 15 13423 g005
Figure 6. Subgraph motif concentration assessment with betweenness attack and different recovery strategies: (A) degree recovery; (B) betweenness recovery; (C) flow recovery.
Sustainability 15 13423 g006
Figure 7. Subgraph motif concentration assessment with flow attack and different recovery strategies: (A) degree recovery; (B) betweenness recovery; (C) flow recovery.
Sustainability 15 13423 g007
Figure 8. Subgraph residual concentration assessment with degree attack and different recovery strategies: (A) degree recovery; (B) betweenness recovery; (C) flow recovery.
Sustainability 15 13423 g008
Figure 9. Subgraph residual concentration assessment with betweenness attack and different recovery strategies: (A) degree recovery; (B) betweenness recovery; (C) flow recovery.
Sustainability 15 13423 g009
Figure 10. Subgraph residual concentration assessment with flow attack and different recovery strategies: (A) degree recovery; (B) betweenness recovery; (C) flow recovery.
Sustainability 15 13423 g010
Figure 11. ATSN resilience assessment with degree attack and different recovery strategies: (A) degree recovery; (B) betweenness recovery; (C) flow recovery.
Sustainability 15 13423 g011
Figure 12. ATSN resilience assessment with betweenness attack and different recovery strategies: (A) degree recovery; (B) betweenness recovery; (C) flow recovery.
Sustainability 15 13423 g012
Figure 13. ATSN resilience assessment with betweenness attack and different recovery strategies: (A) degree recovery; (B) Betweenness recovery; (C) Flow recovery.
Sustainability 15 13423 g013
Table 1. Previous research and modeling techniques.
Modeling NetworkAuthorFocus Perspective
Airport networkGuimera et al. [1]
Wang et al. [8]
Cong et al. [11]
Normal operation
Clark et al. [3]
Wang et al. [39]
Resilience of network
Chi et al. [4]
Bharali et al. [5]
Pien et al. [6]
Zhou et al. [7]
Requião et al. [10]
Clusella et al. [12]
Kim et al. [13]
Chen et al. [14]
Winkinson et al. [15]
Destruction of network
Mirzasoleiman et al. [18]Cascading of network
Sun et al. [19]Operation under public emergencies
Air traffic sector
network
Ren et al. [2] Normal operation
QI et al. [16]Cascading of network
Airline network Wuellner et al. [9]
Allen et al. [40]
Resilience of network
Multilayer networkWang et al. [17]Cascading of network
Table 2. Motif detection of ATSN.
IDSampleFrequency
(Original)
Mean-Freq
(Random)
pValue ZMotif Type
3-(a)Sustainability 15 13423 i00186.54399.9841.000−30.379Anti-motif
3-(b)Sustainability 15 13423 i00213.4570.002≤0.00130.379Motif
4-(a)Sustainability 15 13423 i00311.29622.9431.000−77.855Anti-motif
4-(b)Sustainability 15 13423 i00461.45876.0571.000−63.236Anti-motif
4-(c)Sustainability 15 13423 i0051.0740.9700.2080.810Anti-motif
4-(d)Sustainability 15 13423 i00622.2980.030≤0.001211.010Motif
4-(e)Sustainability 15 13423 i0073.8737≤0.001≤0.0012127.300Motif
Table 3. Value comparison of subgraph resilience and system resilience.
Disturbance Recovery TypeSubgraph Resilience Loss (Tk)System Resilience (Rloss)
4-(a)4-(b)4-(c)4-(d)4-(e)
DA-DR0.7624.2510.0711.5820.2844.316
DA-BR0.7484.1230.0671.6040.2944.363
DA-FR0.7864.3240.0681.6460.3014.732
BA-DR0.7434.0500.0711.4060.2314.383
BA-BR0.7624.1580.0721.5270.2664.498
BA-FR0.7664.1820.0741.5140.2634.652
FA-DR0.6363.3420.0671.1740.1813.014
FA-BR0.6173.3050.0651.2110.2012.993
FA-FR0.6753.6490.0671.3430.2253.696
Disclaimer/Publisher’s Note: The statements, opinions and data contained in all publications are solely those of the individual author(s) and contributor(s) and not of MDPI and/or the editor(s). MDPI and/or the editor(s) disclaim responsibility for any injury to people or property resulting from any ideas, methods, instructions or products referred to in the content.

