Article

Leaf Biochemical and Kernel Metabolite Profiles as Potential Biomarkers of Water Deficit in Walnut (Juglans regia L.) cv. Chandler

by
Franco E. Calvo
1,2,
Sonia T. Silvente
3 and
Eduardo R. Trentacoste
4,*
1
Consejo Nacional de Investigaciones Científicas y Técnicas (CONICET), Buenos Aires 1425, Argentina
2
Instituto de Agricultura Sostenible en el Oasis (IASO), Universidad Nacional de Chilecito (UNdeC), Chilecito 5360, Argentina
3
Instituto de Ambiente de Montaña y Regiones Áridas (IAMRA), Universidad Nacional de Chilecito (UNdeC), Chilecito 5360, Argentina
4
Instituto Nacional de Tecnología Agropecuaria, Estación Experimental Agropecuaria La Consulta, Mendoza 5567, Argentina
*
Author to whom correspondence should be addressed.
Sustainability 2023, 15(18), 13472; https://doi.org/10.3390/su151813472
Submission received: 4 August 2023 / Revised: 4 September 2023 / Accepted: 6 September 2023 / Published: 8 September 2023

Abstract

:
Walnut cultivation is expanding into regions where water availability for irrigation is lower than crop evapotranspiration. However, information regarding the responses and adaptations of walnut trees to water deficit remains scarce. In this study, we applied three irrigation levels, 100%, 75%, and 50% of crop evapotranspiration (referred to as T100, T75, and T50, respectively), to Chandler walnut trees over two consecutive seasons. During the second season, we evaluated leaf water-deficit biomarkers, including proline, malondialdehyde, soluble sugars, phenols, and flavonoids, using targeted spectrophotometry. Despite not finding significant differences in biomarker concentrations among the irrigation regimes, we observed variations between different collection times (sprouting, endocarp hardening, and maturity). Furthermore, we assessed the kernel metabolome using untargeted gas chromatography–mass spectrometry, profiling seventy-one metabolites across all samples. Notably, forty-one of these metabolites were identified as members of distinct groups, comprising carbohydrates (n = 11), fatty acids (n = 11), organic acids (n = 9), and amino acids (n = 5). Linear mixed models showed no significant differences between the irrigation regimes. However, in the T50 treatment, multivariate analysis (PCA) revealed a higher concentration of osmotic adjustment metabolites, which are potentially associated with protecting oil biosynthesis under high-temperature and water deficit conditions.

1. Introduction

Worldwide, the cultivated area and production of walnuts have increased by 80% and 82% in the last 20 years (2001–2021), respectively, reaching 1.13 M ha and 3.5 M t in 2023 [1]. To meet the growing demand, walnut cultivation has expanded to new areas, including semi-arid regions such as the center-west of Argentina. The annual rainfall in this region ranges between 300 and 600 mm yr−1 [2], while the water requirement for walnut trees has been estimated at around 1000 mm yr−1 [3]. In Argentina, walnut growers use water from meltwater or underground aquifers. However, the uncontrolled use of water resources could lead to the overexploitation of aquifers [4], which is exacerbated in the context of climate change, resulting in a decrease in aquifer recharge [5]. In this context, deficit irrigation strategies become relevant. A deficit irrigation strategy involves applying an irrigation dose lower than what the crop requires, either throughout the entire crop cycle (sustained deficit irrigation) or during a less sensitive phenological stage (regulated deficit irrigation), with no yield penalty. Despite deficit irrigation strategies having been extensively evaluated in a wide variety of fruit crops [6], they have been scarcely evaluated in walnuts [7].
Indicators of plant water status, such as stem and leaf water potential, stomatal conductance, stem dendrometry, and canopy infrared thermography, are widely used for irrigation scheduling. However, the biomarkers of water deficit have been neglected, even though it is well known that the concentration of compatible osmolytes such as amino acids (proline and betaine-alanine) or soluble sugars in leaves is closely related to robust measures of plant water status, such as water potential [8,9]. Moreover, malondialdehyde concentrations increase significantly with increasing water stress levels [10]. Additionally, the increase in secondary metabolite concentrations (phenols and flavonoids) in leaves has also been associated with biotic and abiotic stress events. Together, these leaf biochemical measurements could form a new group of plant water status indicators to complement traditional measurements, offering the associated advantages of high repeatability and fast execution.
The fatty acid, sterol, and phenol profiles of walnut oil have been described for most varieties [11,12], but the influence of water deficit on walnut kernel biochemistry has been slightly explored. It is in this context that metabolomics emerges as a promising branch of analytical chemistry to compare metabolite profiles under contrasting environmental conditions in a non-targeted way [13]. Rao et al. [14] described the polar metabolome of the embryo and endotheta of four walnut varieties with significant diffusion in China along five maturation stages, providing valuable information on the metabolic pathways active at each phenological stage. Kalogiouri et al. [15] also evaluated the aromatic profiles of walnut oils produced under traditional and modern cultivation systems using a non-targeted approach. They found significant differences between these profiles, enabling the validation of the oils’ origin.
Furthermore, Kang and Suh [16] reviewed studies in which metabolomics was used as a tool to assess the quality and food safety of walnuts, dividing variations in metabolite profiles during the pre-harvest and post-harvest stages. The greatest variations in the metabolite profiles in pre-harvest were related to the metabolism of carbohydrates, amino acids, lipids, and phenolic compounds, while in post-harvest, the identified metabolites were mainly volatile compounds and fatty acids. Lastly, it is interesting to highlight that no articles were found that use metabolomics as a tool to compare the effects at the level of polar metabolite profiles of the application of different irrigation doses in walnuts.
The objectives of this work are twofold: (i) To assess leaf contents of malondialdehyde, proline, total soluble sugars, total phenols, and total flavonoids as indicators of walnut water status. (ii) To compare the polar metabolite profile of walnut kernels obtained under different irrigation regimes applied throughout the growing season.

2. Materials and Methods

2.1. Experimental Design

The experiment was conducted in a six-year-old walnut cv. Chandler orchard located in Guanchín (29°10′ S; 67°40′ W; 1750 masl), La Rioja province, Argentina. The walnut trees were spaced at 7 m × 5 m and irrigated with one microjet per tree. Twelve experimental plots were selected, each consisting of 12 trees (arranged in 3 rows × 4 trees per row) with similar height, canopy volume, and trunk cross-sectional area. Three irrigation regimes, repeated four times, were applied continuously over two seasons (from 1 October 2018, to 31 March 2020) under a randomized block design. The irrigation regimes were set at 100%, 75%, and 50% of crop evapotranspiration, and named T100, T75, and T50, respectively.

2.2. Leaf Material Sampling

Leaf samples were collected from ten terminal leaflets from the canopy periphery at a height of 1.8 m. The samples were taken at three different phenological stages: sprouting (1), endocarp hardening (2), and physiological kernel ripening (3). The collected leaflets were stored in liquid nitrogen. In the laboratory, the samples were lyophilized using a condenser at −60 °C and 0.001 mbar (FreeZone 4.5, Kansas City, MO, USA). After lyophilization, the samples were ground in a pre-cooled ceramic mortar and stored at −80 °C.

2.3. Leaf Malondialdehyde Concentrations

The malondialdehyde (MDA) concentration was determined following the protocol proposed by Holdes et al. [17]. The extract was prepared by combining 50 mg of lyophilized leaf tissue with 1 mL of 70% ethanol. The mixture was then centrifuged at 14,000× g for 20 min, and 500 µL of the supernatant was collected. This supernatant was combined with 500 µL of a reagent solution composed of 50% 0.5% thiobarbituric acid and 50% 20% trichloroacetic acid. The extract and reagent mix were incubated in a thermal bath at 92 °C for 20 min. Subsequently, the absorbance of each extract was measured at 540 nm and 600 nm using a spectrophotometer.

2.4. Leaf Proline Concentrations

The determination of leaf proline (PRO) concentration was carried out following the protocol proposed by Carillo et al. [18]. This protocol involved a 1:20 solid–liquid extraction ratio of 50 mg of lyophilized plant material in a 70% ethanolic solution at 90 °C for 20 min. Afterwards, the obtained extract was centrifuged at 12,000× g for 5 min. In an Eppendorf tube, 200 µL of the supernatant extract was mixed with 400 µL of the reagent solution composed of 1% Ninhydrin (w/v) + 60% glacial acetic acid (v/v) + 20% ethanol (v/v) + 20% distilled water. This mixture was then incubated at 90 °C for 20 min. Finally, the absorbance was measured at 520 nm using a microplate reader.

2.5. Leaf Total Soluble Sugar Concentration

The protocol proposed by Irigoyen et al. [19] was followed, using 50 µg of lyophilized leaf tissue that was homogenized with 70% (v/v) ethanol in a 1:20 (w/v) ratio. The homogenate was then centrifuged at 10,000× g for 10 min at 4 °C. From this crude extract, an aliquot of 50 µL was taken and added to 3 mL of anthrone in a sulfo-ethanolic solution (150 mg of anthrone in a solution of 60 mL ethanol and 100 mL concentrated H2SO4). The mixture was incubated at 50 °C for 30 min. Finally, the absorbance was measured at 620 nm.

2.6. Leaf Total Phenol and Flavonoid Concentration

In both determinations, we started with the same extract, obtained through a 1:20 (w/v) homogenization of 50 mg of leaf tissue with 70% ethanol. This extract was then further diluted with distilled water in a 1:20 ratio. The determination of total phenol (FEN) concentration followed the protocol proposed by Singleton and Rossi [20], which involved the reaction of 50 µL of the diluted extract with 1000 µL of distilled water and 50 µL of Folin–Ciocalteu 1 N reagent. After homogenizing the mixture in a vortex for 5 min, 100 µL of 20% Na2CO3 was added, and the mixture was homogenized again with a vortex. The reagent mixture was left to stand for 1 h in the dark at room temperature. Finally, the absorbance was measured at 760 nm, and the concentration of total leaf phenols was expressed as gallic acid equivalents (GAE).
The estimation of total flavonoid concentration was performed using the protocol of Karadeniz [21]. In summary, this protocol involved the reaction of 150 µL of diluted extract with 750 µL of distilled water and 75 µL of 5% NaNO2. After homogenizing the mixture and allowing it to stand for 5 min in the dark, 150 µL of 10% AlCl3 (w/v in water) was added. The mixture was then incubated for 15 min in the dark, and 500 µL of 1M NaOH was added. Finally, the absorbance was measured at 510 nm, and the results were expressed as catechin equivalent (CE) per weight unit.

2.7. Walnut Kernel Metabolite Extraction, Derivatization, and Profiling

Once physiological kernel maturity was reached, all nuts were harvested from the central plant of each treatment. Subsequently, a sample of 100 nuts was taken and oven-dried at 30 °C with a forced air current until a kernel water content of 4% was achieved. Once the samples of 100 nuts were dried, they were manually cracked and stored at −80 °C. Polar metabolites were extracted from the kernel tissue following the protocol of Roessner and Beckles [22], with slight modifications. In a 2 mL Eppendorf-type tube previously cooled with liquid nitrogen, 50 mg of lyophilized kernel tissue, 700 µL of HPLC grade methanol, 300 µL of milli-Q water, and 30 µL of ribitol (internal standard at 0.2 mg mL−1) were added. The mixture was then incubated in a thermomixer at 950 rpm and 70 °C for 15 min. After reaching the extraction time, the solution was centrifuged at 13,000× g at 4 °C for 15 min. Subsequently, 150 µL of the polar supernatant was transferred to a new 1.5 mL Eppendorf tube, where it was concentrated under N2 current.
For derivatization, 40 µL of methoxyamine hydrochloride (20 mg mL−1 in pyridine) was added to each concentrated extract and incubated for 2 h in a thermomixer at 37 °C and 950 rpm. At the end of the incubation time, the mixture was centrifuged for 5 min at 13,000× g. Subsequently, 70 µL of MSTFA (N-methyl-N-trimethylsilyl trifluoroacetamide) was added and incubated in the thermomixer at 37 °C and 950 rpm for 30 min. The resulting solution was then transferred to chromatography vials. Injections of 1 µL of derivatized samples were performed randomly using an autoinjector (Shimadzu AOC-5000) into a gas chromatograph coupled to a quadrupole mass spectrometer (Shimadzu GCMS-QP2010, Tokyo, Japan) equipped with a Phenomenex ZB-5 column (30 m × 0.25 mm × 0.1 μm). The carrier gas was helium at a flow rate of 1 mL min−1. The injector was set to 280 °C with a 1:10 split ratio, and the temperature ramp initially held the column at 45 °C for 5 min, then increased at a rate of 10 °C min−1 until reaching 295 °C, and finally held for 10 min. The ion source temperature was programmed at 220 °C and the interface temperature at 300 °C. The scan range was set from 40 to 700 m/z.

2.8. Statistical Analysis

Data analysis was conducted in the R v.4.1.2 environment for computational statistics, utilizing the nlme and emmeans libraries for univariate analysis. For the leaf data analysis, a linear mixed model was assumed with the irrigation regime as a fixed effect and the block as a random effect. Concerning the untargeted metabolite profile analyses, the data were processed and analyzed using the XCMS library (Bioconductor), employing the parameters proposed by Rao et al. [14]. Metabolite identification was carried out using GCMS-Solution (Shimadzu, Kyoto, Japan) and AMDIS (NIST) software, comparing the spectral mass libraries from NIST and Wiley with a similarity cut-off line of 70%. Principal component analysis (PCA) and hierarchical clustering of principal components (HCPC) were carried out using the FactoMineR and Factoextra libraries.

3. Results and Discussion

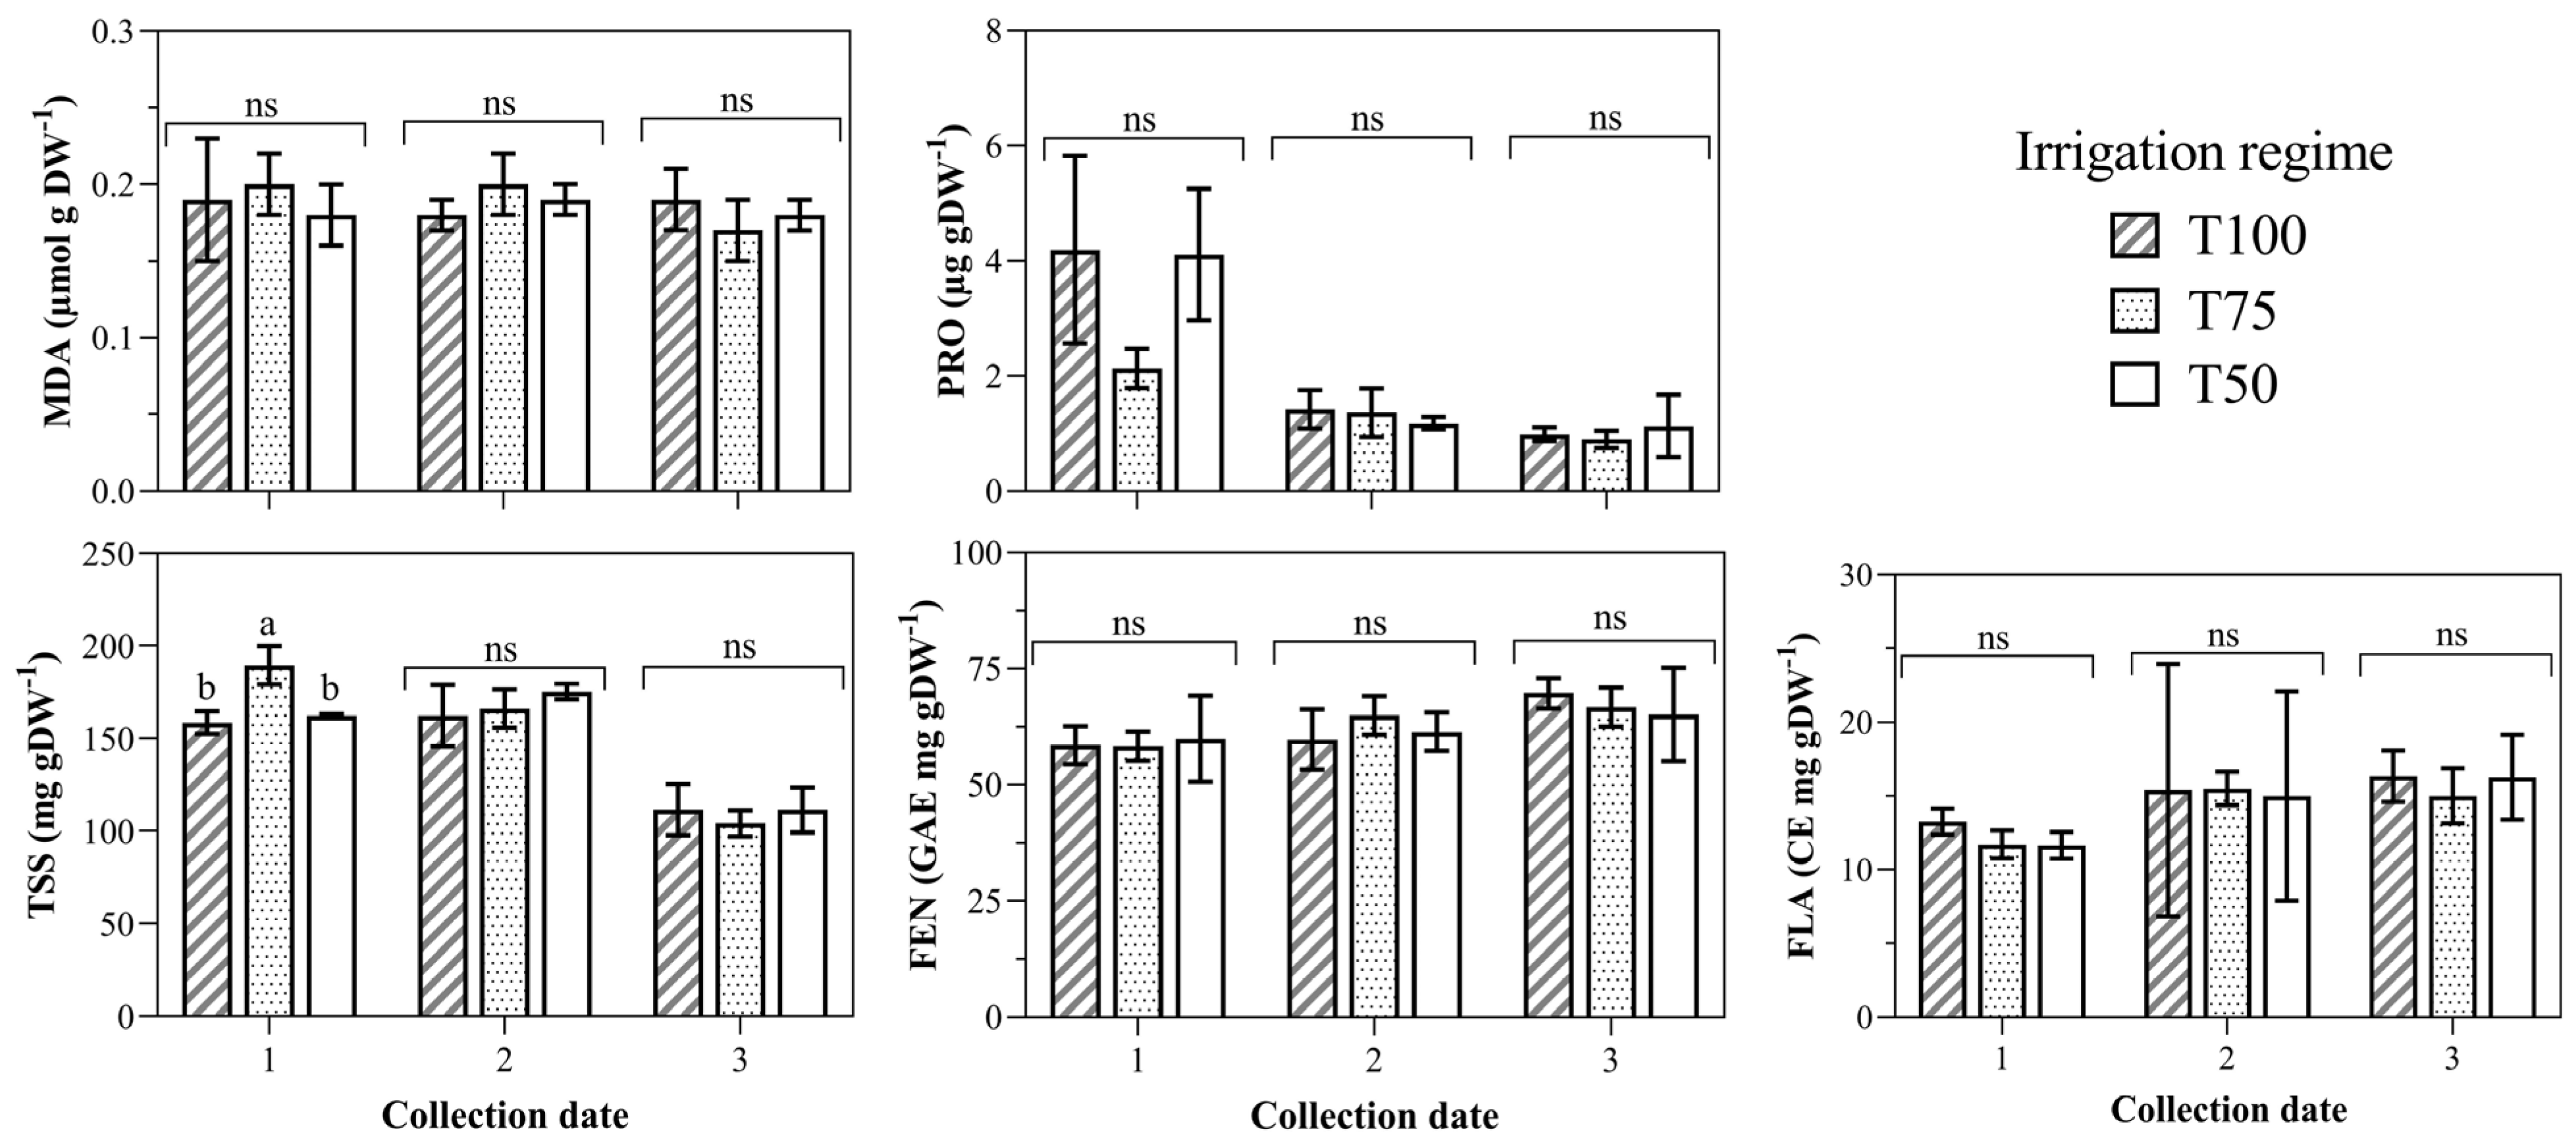
3.1. Biomarkers of Water Deficit in Leaf Tissue

The concentrations of malondialdehyde (MDA), proline (PRO), total soluble sugars (TSS), total phenol (FEN), and total flavonoid (FLA) did not show significant differences between irrigation regimes (Figure 1). Previously, we observed a low effect of the deficit irrigation regimes (T75 and T50) in terms of vegetative growth, productivity, and yield quality compared to the control (T100) [23]. These results could be related to the age of the walnut orchard at the start of the experiment. However, when the data were analyzed only by collection date (1: sprouting; 2: endocarp hardening; and 3: kernel maturity), except for MDA, the concentration of all the studied compounds showed significant differences (Figure 2). These results reveal a lower impact of the irrigation regime studied on leaf biochemistry compared to the phenology stage. Given that malondialdehyde results from the peroxidation of cell membrane unsaturated fatty acids by reactive oxygen species [24], its concentration stability indicates the absence of oxidative stress caused by high leaf temperatures.
PRO concentration was highest at sprouting and then decreased by 70% in later phenological stages (Figure 2; endocarp hardening and maturity). Meanwhile, the concentration of TSS (Figure 2) remained at maximum values during sprouting and endocarp hardening dates, then decreased significantly by 35% towards maturity. This decrease in TSS concentration may be related to the fruit sink activity, which reaches its maximum during oil synthesis [25]. Overall, the concentration of PRO and TSS was highest during the first collection date (sprouting), indicating a possible relationship with the osmotic adjustment processes necessary during sprouting to reconstitute the xylem hydraulic conductivity and allow a resumption of transpiratory march [26]. Although there are no reports specifically relating osmotic adjustment to sprouting in walnuts, previous studies have documented a high correlation between the concentration of soluble sugars, proline, and the level of water deficit to which walnut trees were subjected during germination [6].
FEN and FLA showed similar patterns, increasing significantly as the season developed, and reaching their maximum concentrations on the kernel maturity date (Figure 2). The FEN concentration reached 87% and 92% of the maturity concentrations in the sprouting and endocarp hardening stages, respectively, while that of FLA reached 77% and 95% in the sprouting and endocarp hardening stages, respectively, of the concentrations reached at maturity. Wichtl and Anton [27] identified naphthoquinones (juglone) and flavonoids (quercetin) as the major phenolic compounds in walnut leaves. In the central-western region of Argentina, where this experiment took place, the rise in leaf phenols and flavonoids towards the end of the season is significant. This increase is particularly relevant due to the seasonal rainfall concentration, which contributes to the proliferation of Xanthomonas arboricola pv. juglandis, the causal organism of walnut bacterial blight. Bacterial blight on walnut can cause serious damage to the entire aerial part of the plant, primarily affecting the leaves with a marked decrease in photosynthetic activity. It can also lead to fruit necrosis and subsequently reduce production quality. Furthermore, it affects fruit and flower buds, potentially impacting the productivity of the following season [28].
Principal component analysis (PCA) of leaf metabolite concentrations (Figure 3) revealed that 70% of the total variance was accumulated in the first and second dimensions (Dim1: 42% and Dim2: 28%, respectively). The variables best represented in Dim1 were proline (PRO), total soluble sugars (TSS), total phenol (FEN), and total flavonoid (FLA), contributing 26%, 25%, 28%, and 19% to the variance, respectively. The only variable represented in Dim2 was MDA. The application of the hierarchical classification algorithm led to the formation of two groups: Group I (quadrants I and IV), which included all treatments at the first collection date (sprouting), represented by PRO and TSS, confirming the predominance of osmotic adjustment processes during sprouting. Group II (in quadrants II and III) included all treatments at the endocarp hardening (2) and maturity (3) collection dates and was mainly characterized by FEN and FLA. MDA did not show an appreciable pattern in any of the groups. From a methodological point of view, in this study, the concentration of FEN, TSS, and FLA in leaves was determined via spectrophotometry. This technique, widely used in plant physiology studies, has the following advantages: speed of execution, simple sample preparation, high repeatability, and low demand for analytical equipment compared to another of the widely used techniques, GC-MS, which requires expensive laboratory equipment.

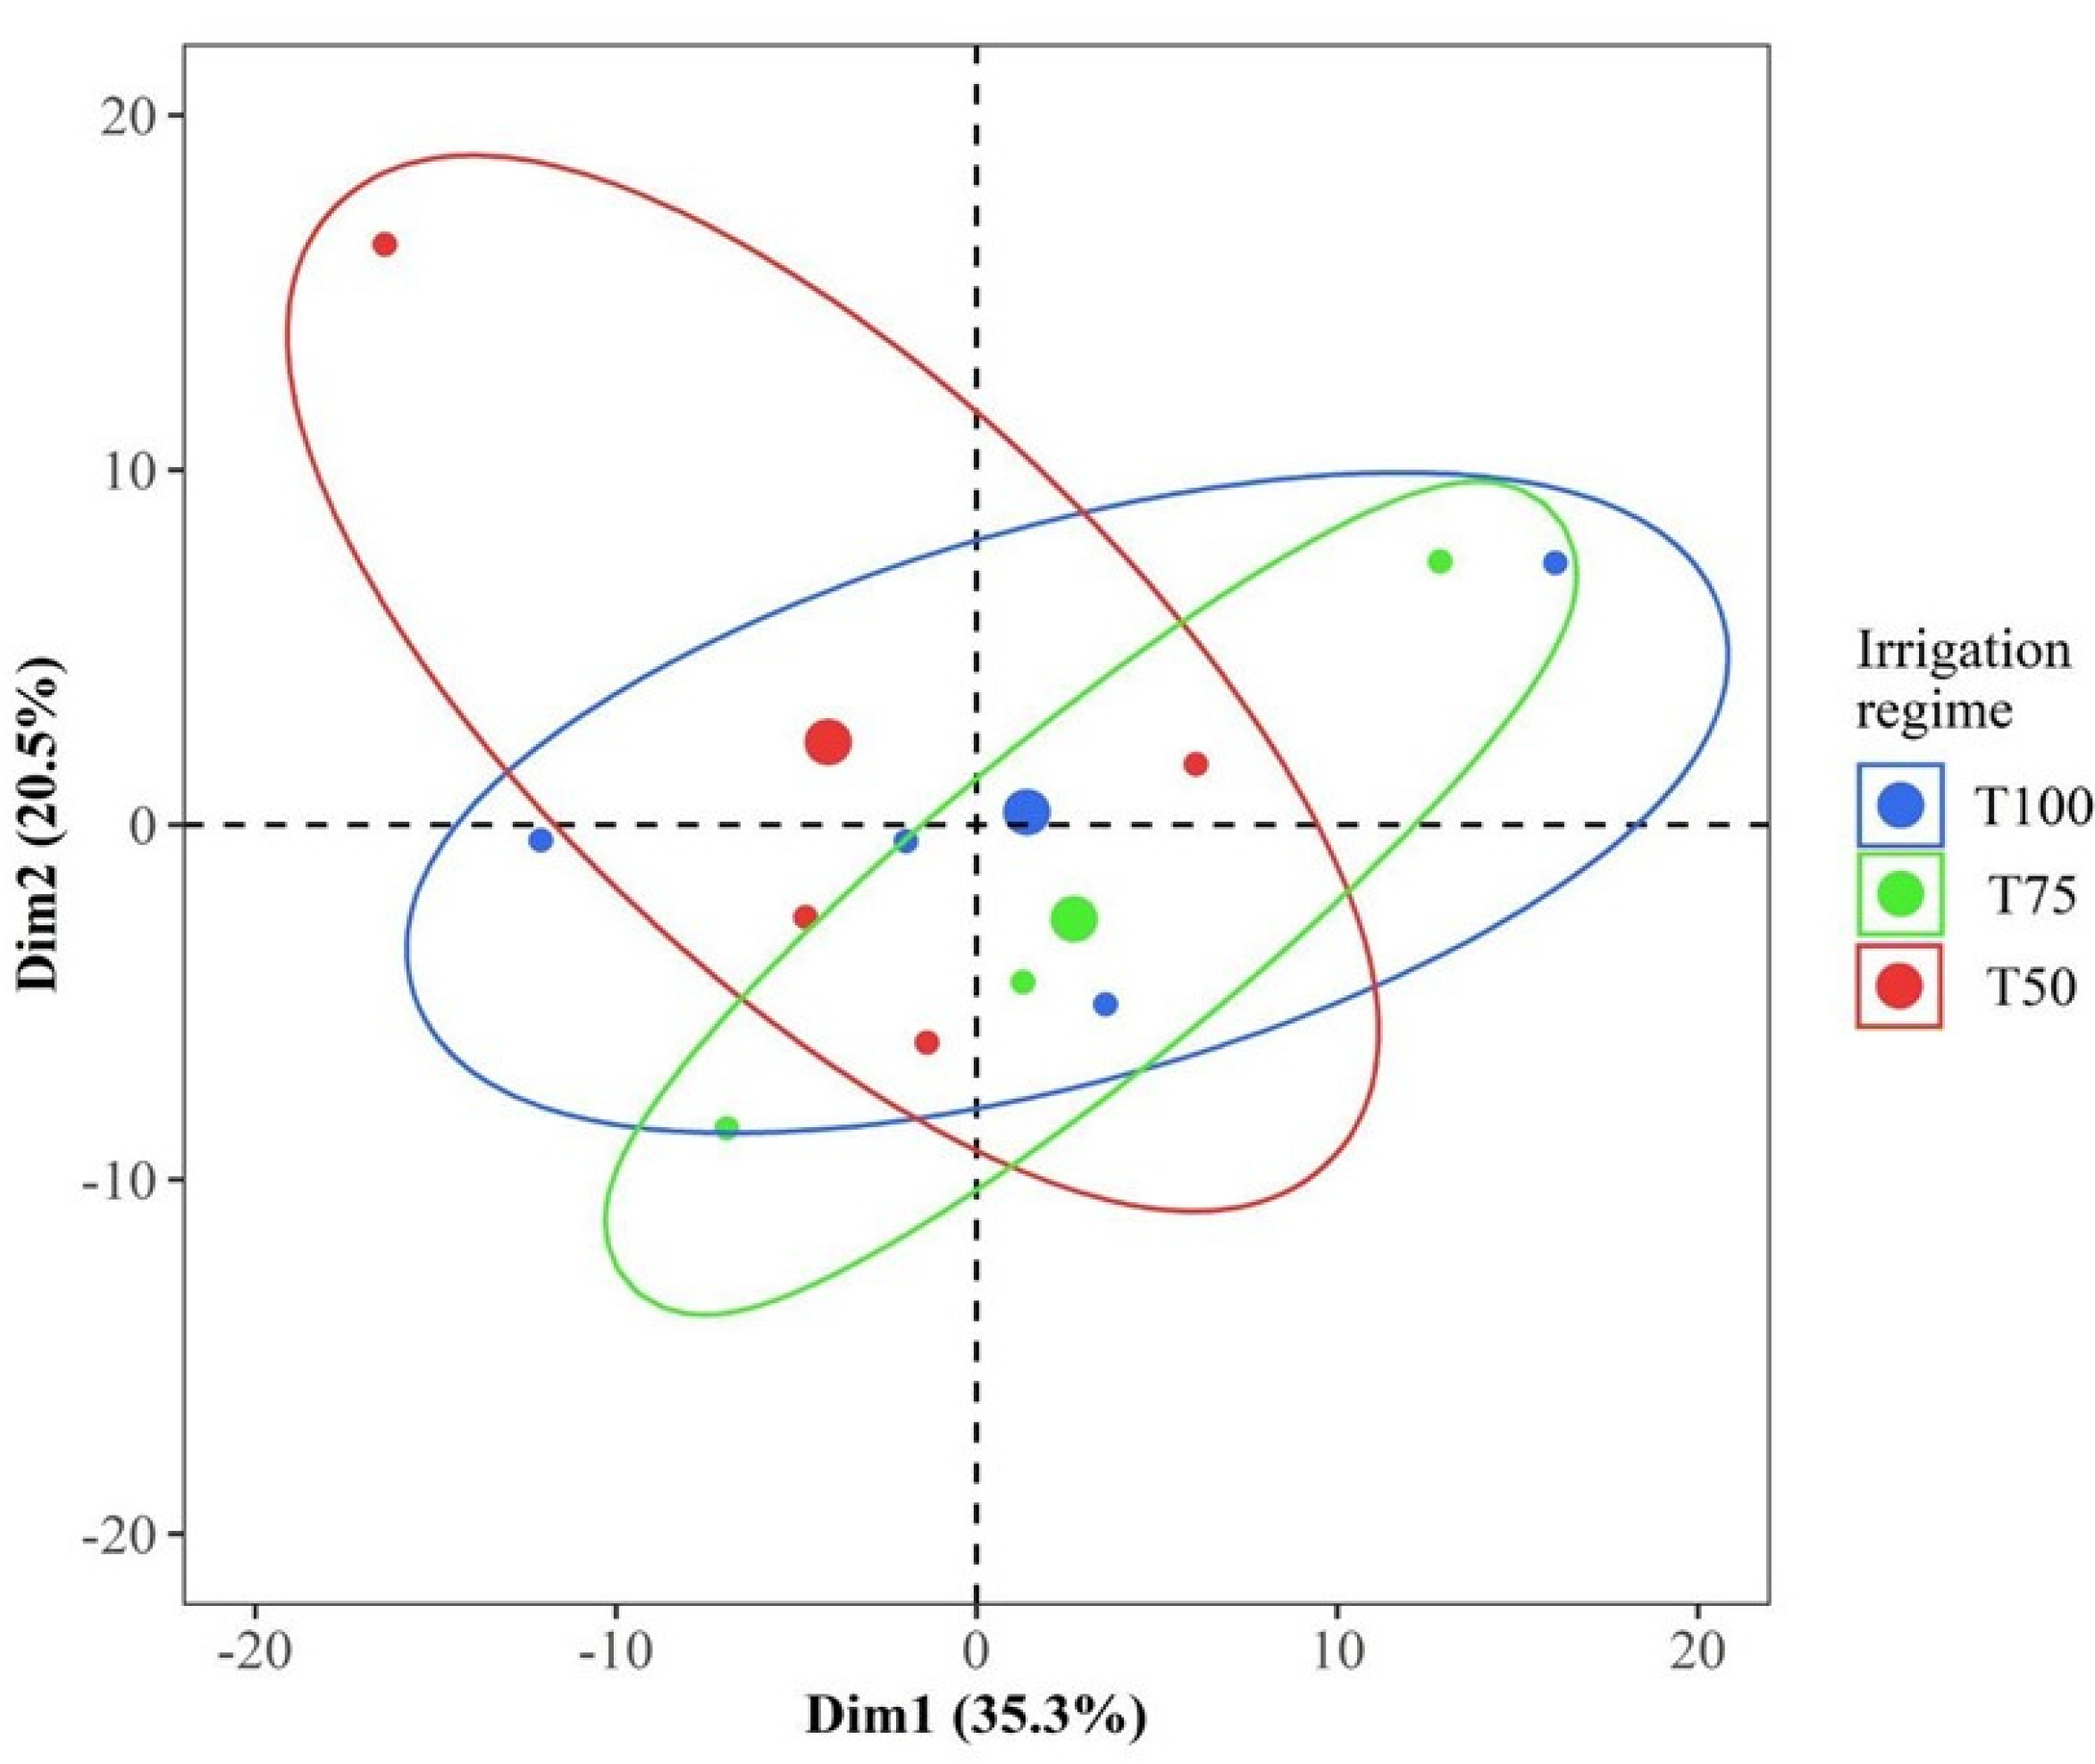
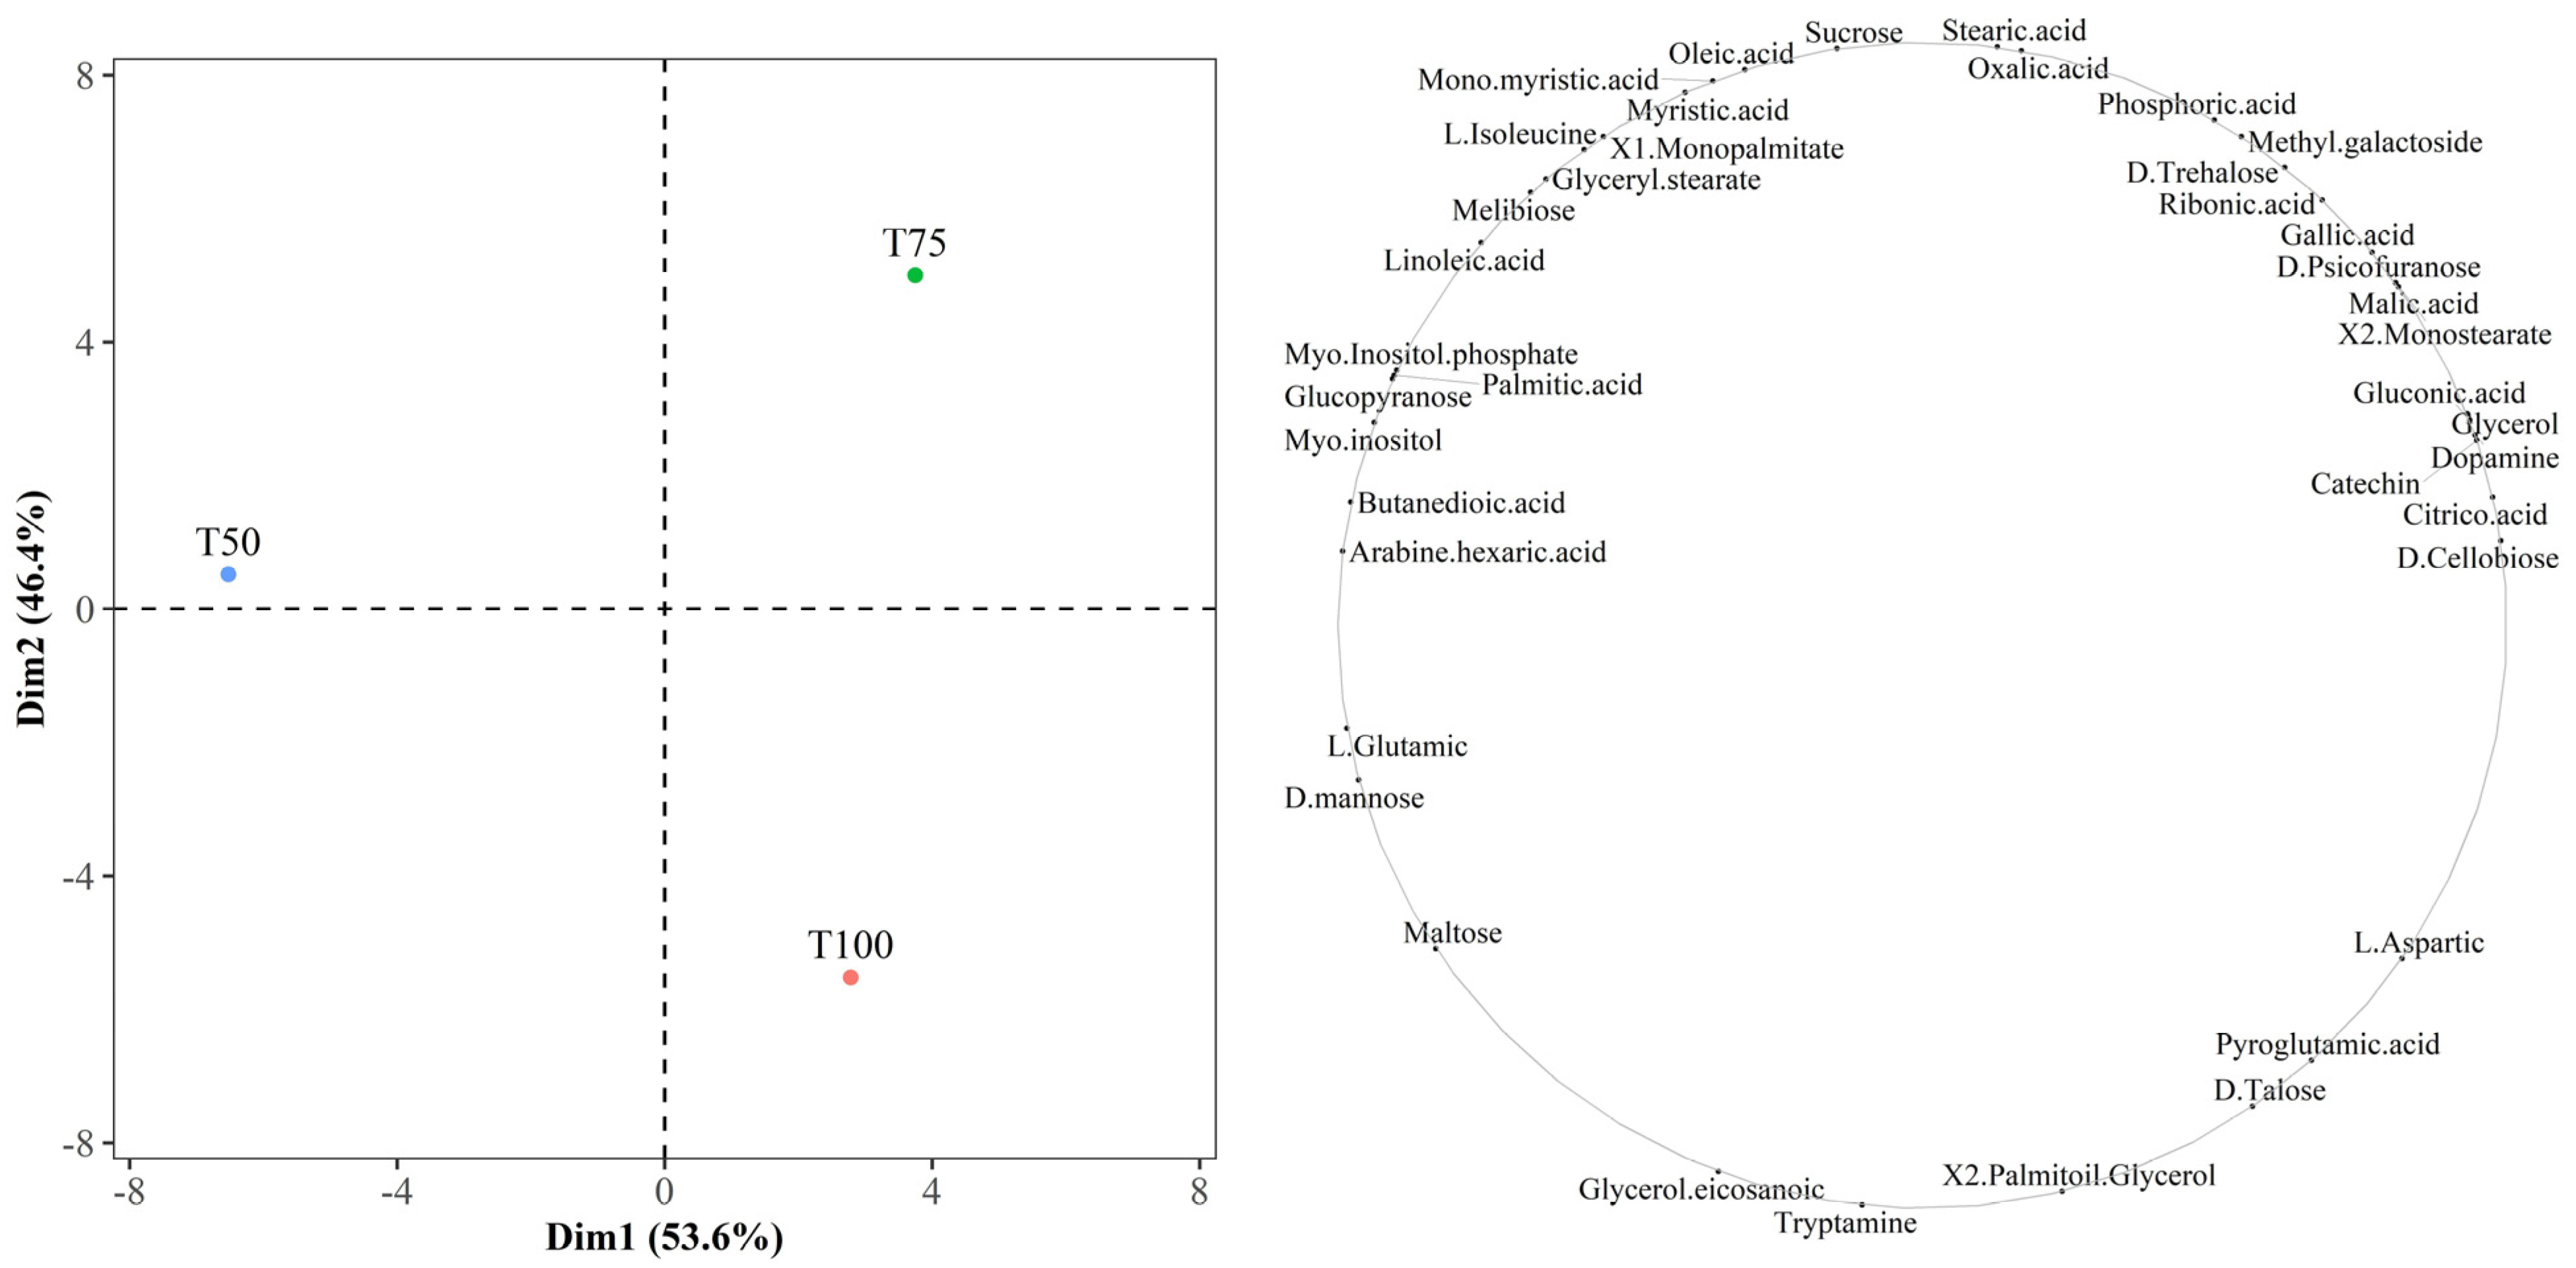
3.2. Kernel Polar Metabolite Profile

Seventy-one metabolites were profiled, out of which 40 were identified and confirmed using the NIST (National Institute of Standards and Technology) and Wiley libraries (Table 1). The identified metabolites belong, according to the Compound KEGG (Kyoto Encyclopedia of Genes and Genomes) library, to the following groups: carbohydrates (n = 11), fatty acids (n = 11), organic acids (n = 9), amino acids (n = 5), saturated alcohol (n = 1), phospholipid (n = 1), vitamin (n = 1), amine (n = 1), and flavonoid (n = 1). According to the KEGG library, the metabolic pathways covered by the identified kernel metabolites include fatty acid biosynthesis, tricarboxylic acid cycle, ascorbate metabolism, beta-alanine metabolism, proline metabolism, fructose and mannose metabolism, galactose metabolism, glycolysis, starch and sucrose metabolism, phenol and flavonoid biosynthesis, and inositol phosphate metabolism.
First, the maximum intensity peaks were explored using PCA. For this purpose, the chromatographic peaks were aligned, the extreme deviations in retention times were ±1.5 s. Dimensions 1 and 2 (Dim 1 and Dim 2) of the PCA (Figure 4) accumulated 35% and 20% of the total variance, respectively. The overlap of the projection areas (ellipses) of the irrigation treatments indicates that there were no significant differences between them. Despite the total overlap of treatments, the centers of inertia of each group (centroids) were also plotted with points of greater dimension. The centroid of treatment T100 was located close to the intersection (0, 0), indicating an overall treatment variance close to 0. In terms of multivariate distance, the centroid of treatment T75 was more similar to T100 than T50.
Subsequently, the concentrations of the identified metabolites were normalized relative to the internal standard (Table 1). No statistically significant differences in metabolite concentrations were found when comparing irrigation treatments. However, a concentration trend was observed in 35% of the total identified metabolites in the T50 treatment. Metabolite–metabolite correlations from the normalized concentrations revealed 160 negative correlations (22%) and 640 positive correlations (77%). Out of the 800 correlations, 149 were significant (all positive) at p < 0.05 (Figure 5). The mean normalized concentrations of the identified metabolites PCA (Figure 6) accounted for 100% of the total variation, with 54% in Dim. 1 and 46% in Dim. 2. The contribution of variables to the total variation in each dimension was practically symmetrical. The contributions of treatments T50 (quadrant II) and T100 (quadrant IV) to the total variability of the dimensions were contrasting. T50 contributed 67% to the variation of Dim. 1 and 48% to Dim. 2, while T100 contributed 12% to Dim. 1 and 54% to Dim. 2. The metabolites associated with the T50 treatment were butanedioic acid, L-glutamic acid, D-mannose, glucopyranose, maltose, myo-inositol, myo-inositol-phosphate, and arabine-hexaric acid. Additionally, palmitic and linoleic fatty acids in their free forms were also associated.
The concentrations of succinic acid (synonymous with butanedioic acid) and D-mannose in the kernels of the T50 treatment were 27% and 36% higher, respectively, than those estimated in the T100 treatment. Previous studies on two water-deficit-sensitive thyme species (Thymus vulgaris and Thymus kotschyanus) subjected to water deficit showed a significant increase in leaf succinic acid concentration as an osmotic adjustment strategy. This increase in succinic acid concentration has been linked to the expression and activity of succinate dehydrogenase and isocitrate lyase enzymes [29]. Similar to succinic acid, the monosaccharide mannose is a compatible solute in plants, and it plays a crucial role in regulating water deficit tolerance in plants. Zhao et al. [30] studied the impact of adding mannose to white clover (Trifolium repens) during water deficit conditions. They observed notable increases in mannose, proline, and total soluble sugars in the leaves. Additionally, they observed maintained antioxidant enzyme activity and a stable photosynthetic rate. Ibrahim and Abdellatif [31] obtained similar findings in wheat plants exposed to water deficit treatments, where applying maltose and trehalose resulted in increased tolerance to water deficit.
In T50, the concentrations of the soluble sugars’ maltose and glucopyranose were 17% and 185% higher, respectively, compared to T100. Additionally, D-mannose showed a 27% increase at T50 in comparison to T100. Lee et al. [32] found that, in white clover leaves (Trifolium repens), osmotic adjustment processes mediated by soluble sugars (non-structural carbohydrates) primarily rely on breaking down starch into its monomeric forms (open form of glucopyranose) rather than synthesizing sugars de novo. Kernels subjected to the T50 treatment showed an estimated mean concentration of arabino-hexaric acid 21% higher than that observed at T100. Although limited research has been conducted on arabino-hexaric acid (also known as 2-oxo-gluconic acid) synthesis during water deficit in plants, it has been identified as a product of carbohydrate oxidative breakdown in strawberries [25]. Moreover, evidence suggests that arabino-hexaric acid can be produced from gamma irradiation of fructose molecules, indicating that the precursor to arabino-hexaric acid might differ among plant species [33].
The amino acid proline is widely recognized as a major osmoprotectant in plants, as well as having reactive oxygen species detoxification functions [34]. During the untargeted profiling of polar metabolites in walnut kernels, proline was not detected. However, L-glutamate, a related amino acid that plays a role in osmotic adjustment processes and acts as the precursor in the proline biosynthesis pathway, was identified. The concentration of L-glutamate was 39% higher in T50 kernels compared to T100 kernels. Unal et al. [35] studied L-glutamate levels in strawberry fruits under deficit irrigation (at 50% of ETc) and found a 50% increase in the amino acid concentration compared to fruits from plants irrigated at 100% of ETc. Rizhsky et al. [36] reported that when Arabidopsis thaliana is subjected to combined water and heat stress, it does not accumulate proline as an osmoprotectant, a situation that would occur in Arabidopsis thaliana only when subjected to a water deficit.
Finally, kernels collected from the T50 treatment showed 23% and 27% higher concentrations of myo-inositol and myo-inositol phosphate, respectively, than those in the T100 treatment. Myo-inositol and myo-inositol phosphate are derived from D-glucose through irreversible enzymatic conversions in one and three steps, respectively. These metabolites serve as osmoprotectants and antioxidants, providing protection against reactive oxygen species during water and/or salt stress conditions [37]. In summary, a greater proportion of metabolites identified in higher concentrations in the kernels of the T50 treatment, compared to T100 and T75, are related to osmotic adjustment processes. To contextualize, in angiosperms, fruit stomata are functional as long as the photosynthetic pathway is active in the epicarp [38]. In walnuts, particularly, the epicarp has a high concentration of chlorophyll until ripening, so photosynthetic assimilation in the fruit should remain stable throughout much of the crop’s growing season, as should transpiration.
The relationship between transpiration rate and fruit temperature has been little studied, whereas a linear relationship between transpiration and leaf temperature is assumed for most plant species [39]. Additionally, it has been reported that walnuts have the capacity to adjust leaf osmotic potential if subjected to high temperatures or a water deficit [40]. In this context, it seems logical to propose a derived hypothesis: under conditions of water deficit, walnut trees adjust the fruit water potential (similarly to the leaves) through osmotic adjustment to maintain a high transpiration rate and thereby regulate the temperature to values that do not limit lipogenesis. We have not found articles dealing with the translocation of compatible osmolytes between the walnut pericarp and kernels, although there is evidence in other crops such as tomatoes. In tomatoes, photoassimilates produced in fruits have been observed to be directed towards fruit respiration itself [39].
The sensitivity of lipogenesis to high temperatures is well documented in olives. Garcia-Inza et al. [41] observed that, in olive kernels (in contrast to what was observed in the pulp or mesocarp), oil lipogenesis occurs mainly from fruit set to endocarp hardening. They found that the kernel oil accumulation rate decreased by 1.1% for every 1 °C increase in mean ambient temperature. In contrast, Jin et al. [42] monitored oil accumulation in walnut kernels throughout the season and found that accumulation increased rapidly between 60 and 90 days after pollination (reaching 50% of the final concentration). However, lipogenesis continued until 140 days after pollination, near kernel maturity. This indicates that the lipogenesis process in walnut kernels is exposed to a wider range of temperatures than in olives, including the absolute maximum temperatures that occur during mid and late summer. As a result, osmotic adjustment becomes relevant as an evolutionary and adaptive strategy to maintain lipogenesis at its maximum rate even in the hottest months of the season.

4. Conclusions

The water deficit biomarkers, including proline, malondialdehyde, total soluble sugar, total phenol, and total flavonoid, measured in walnut leaves, showed no significant differences between the studied irrigation regimes applied to walnuts. However, they exhibited variations in concentration throughout the crop cycle. Leaf metabolites associated with osmotic adjustment processes, such as proline and total soluble sugar, reached their maximum concentration at the sprouting stage, while total phenols and flavonoids reached their peak at maturity. Malondialdehyde did not show significant variation between phenological stages or irrigation treatments. Regarding the metabolite profile, this is the first study to analyze the polar metabolite profile of walnut kernels obtained from the application of different irrigation regimes. In the most deficient irrigation treatment (T50), there was a tendency to increase the concentration of osmotic adjustment-related metabolites, including L-glutamate, D-mannose, glucopyranose, maltose, myo-inositol, and myo-inositol-phosphate. These results suggest that the kernel metabolite profile could be used as an indicator of an early water deficit in walnuts.

Author Contributions

All authors contributed to the study conception and design. Material preparation, data collection, and analysis were performed by F.E.C., S.T.S. and E.R.T. The first draft of the manuscript was written by F.E.C. and all authors commented on previous versions of the manuscript. All authors have read and agreed to the published version of the manuscript.

Funding

This research was supported by grants from the Consejo Nacional de Investigaciones Científicas y Técnicas (CONICET) (pre-doctoral fellowship 4199/17).

Institutional Review Board Statement

Not applicable.

Informed Consent Statement

Not applicable.

Data Availability Statement

The data presented in this study are available on request from the corresponding author.

Acknowledgments

This work is part of a thesis submitted by F.E.C. in partial fulfillment of the requirements for a degree at the Facultad de Ciencias Agrarias, Universidad Nacional de Cuyo, Mendoza, Argentina. We are grateful to Coralino S.A. for providing the experimental site, which made this study possible. Additionally, we wish to express our sincere appreciation to Silvia Barbuzza for her invaluable assistance in proofreading this paper and the guest editor for the invitation to publish in this journal.

Conflicts of Interest

The authors declare no conflict of interest.

References

  1. FAO. FAOSTAT: Crops and Livestock Products. Available online: https://www.fao.org/faostat/en/#data/QCL (accessed on 1 June 2023).
  2. Rubí Bianchi, A.; Cravero, S.A.C. Atlas Climático Digital de la República Argentina, 1st ed.; Rubí Bianchi, A., Ed.; Ediciones Instituto Nacional de Tecnología Agropecuaria: Buenos Aires, Argentina, 2010.
  3. Goldhamer, D.A. Irrigation scheduling for walnut orchards. In Walnut Production Manual, 1st ed.; Ramos, D., Ed.; University of California Division of Agriculture and Natural Resources: Oakland, CA, USA, 1998. [Google Scholar]
  4. Searles, P.S.; Alcarás, M.A.; Rousseaux, M.C. Water use by olive orchards (Olea europaea L.) in the Northwest of Argentina: A comparison with the Mediterranean Basin. Ecol. Austral 2011, 21, 15–28. Available online: http://hdl.handle.net/20.500.12110/ecologiaaustral_v021_n01_p015 (accessed on 4 September 2023).
  5. Rivera, J.A.; Otta, S.; Lauro, C.; Zazulie, N. A Decade of Hydrological Drought in Central-Western Argentina. Front. Water 2021, 3, 640544. [Google Scholar] [CrossRef]
  6. Yang, B.; Fu, P.; Lu, J.; Ma, F.; Sun, X.; Fang, Y. Regulated deficit irrigation: An effective way to solve the shortage of agricultural water for horticulture. Stress Biol. 2022, 2, 2–28. [Google Scholar] [CrossRef] [PubMed]
  7. Calvo, F.E.; Silvente, S.T.; Trentacoste, E.R. A mini review of the impacts of deficit irrigation strategies for walnut (Juglans regia L.) production in semiarid conditions. Irrig. Sci. 2023, 41, 501–509. [Google Scholar] [CrossRef]
  8. Lofti, N.; Vahdati, K.; Kholdebarin, B.; Amiri, R. Soluble sugars and proline accumulation play a role as effective indices for drought tolerance screening in Persian walnut (Juglans regia L.) during germination. Fruits 2009, 65, 97–112. [Google Scholar] [CrossRef]
  9. Wang, B.; Zhang, J.; Pei, D.; Yu, L. Combined effects of water stress and salinity on growth, physiological, and biochemical traits in two walnut genotypes. Physiol. Plant. 2020, 177, 176–187. [Google Scholar] [CrossRef] [PubMed]
  10. Karimi, S.; Karami, H.; Vahdati, K.; Mokhtassi-Bidgoli, A. Antioxidative responses to short-term salinity stress induce drought tolerance in walnut. Sci. Hortic. 2020, 267, 109322. [Google Scholar] [CrossRef]
  11. Martínez, M.L.; Labuckas, D.O.; Lamarque, A.L.; Maestri, D.M. Walnut (Juglans regia L.): Genetic resources, chemistry, by-products. J. Sci. Food Agric. 2010, 90, 1959–1967. [Google Scholar] [CrossRef]
  12. Martínez, M.L.; Maestri, D.M. Oil chemical variation in walnut (Juglans regia L.) genotypes grown in Argentina. Eur. J. Lipid Sci. Tech. 2008, 110, 1183–1189. [Google Scholar] [CrossRef]
  13. Bundy, J.G.; Davey, M.P.; Viant, M.R. Environmental metabolomics: A critical review and future perspectives. Metabolomics 2009, 5, 3–21. [Google Scholar] [CrossRef]
  14. Rao, G.; Sui, J.; Zhang, J. Metabolomics reveals significant variations in metabolites and correlations regarding the maturation of walnuts (Juglans regia L.). Biol. Open 2016, 5, 829–836. [Google Scholar] [CrossRef] [PubMed]
  15. Kalagiouri, N.P.; Manousi, N.; Rosenberg, E.; Zachariadis, G.A.; Paraskevopoulou, A.; Samanidou, V. Exploring the volatile metabolome of conventional and organic walnut oils by solid-phase microextraction and analysis by GC-MS combined with chemometrics. Food Chem. 2021, 363, 130331. [Google Scholar] [CrossRef] [PubMed]
  16. Kang, M.N.; Suh, J.H. Metabolomics as a tool to evaluate nut quality and safety. Trends Food Sci. 2022, 129, 528–543. [Google Scholar] [CrossRef]
  17. Holdes, R.L.; DeLong, J.D.; Forney, C.F.; Pranger, R.K. Improving the thiobarbituric acid-reactive-substances assay for estimating lipid peroxidation in plant tissues containing anthocyanin and other interfering compounds. Planta 1999, 207, 604–611. [Google Scholar]
  18. Carillo, P.; Mastrolonardo, G.; Nacca, F.; Parisi, D.; Verlotta, A.; Fuggi, A. Nitrogen metabolism in durum wheat under salinity: Accumulation of proline and glycine betaine. Func. Plant Biol. 2008, 35, 412–426. [Google Scholar] [CrossRef] [PubMed]
  19. Irigoyen, J.J.; Emerich, D.W.; Sánchez-Díaz, M. Water stress induced changes in concentrations of proline and total soluble sugars in nodulated alfalfa (Medicago sativa) plants. Physiol. Plant. 1992, 84, 55–60. [Google Scholar] [CrossRef]
  20. Singleton, V.L.; Rossi, J.A. Colorimetry of Total Phenolics with Phosphomolybdic-Phosphotungstic Acid Reagents. J. Enol. Vitic. 1965, 16, 144–158. [Google Scholar] [CrossRef]
  21. Karadeniz, F.; Burdurlu, H.S.; Koca, N.; Soyer, Y. Antioxidant activity of selected fruits and vegetables grown in Turkey. Turk. J. Agric. For. 2005, 29, 297–303. [Google Scholar]
  22. Roessner, U.; Beckles, D.M. Metabolomics for Salinity Research. In Plant Salt Tolerance; Shabala, S., Cuin, T., Eds.; Humana Press: Totowa, NJ, USA, 2012. [Google Scholar]
  23. Calvo, F.E.; Trentacoste, E.R.; Silvente, S.T. Vegetative growth, yield, and crop water productivity response to different irrigation regimes in high density walnut orchards (Juglans regia L.) in a semi-arid environment in Argentina. Agric. Water Manag. 2022, 274, 107969. [Google Scholar] [CrossRef]
  24. Morales, M.; Munné-Bosch, S. Malondialdehyde: Facts and Artifacts. Plant Physiol. 2019, 180, 1246–1250. [Google Scholar] [CrossRef]
  25. Zhang, C.F.; Pan, C.D.; Chen, H. The long-term response of photosynthesis in walnut (Juglans regia L.) leaf to a leaf-to-fruit ratio. Photosynthetica 2019, 57, 762–771. [Google Scholar] [CrossRef]
  26. Améglio, T.; Bodet, C.; Lacointe, A.; Cochard, H. Winter embolism, mechanisms of xylem hydraulic conductivity recovery and springtime growth patterns in walnut and peach trees. Tree Physiol. 2002, 22, 1211–1220. [Google Scholar] [CrossRef] [PubMed]
  27. Wichtl, M.; Anton, R. Plantes Thérapeutiques, 2nd ed.; Tec & Doc: Paris, France, 1999; pp. 291–293. [Google Scholar]
  28. Fernandes, C.; Albuquerque, P.; Mariz-Ponte, N.; Cruz, L.; Tovares, F. Comprehensive diversity assessment of walnut-associated xanthomonads reveal the occurrence of distinct Xanthomonas arboricola lineages and of a new species (Xanthomonas euroxanthea) within the same tree. Plant Pathol. 2020, 70, 943–958. [Google Scholar] [CrossRef]
  29. Ashrafi, M.; Azimi-Moqadam, M.R.; Mohseni Fard, E.; Shekari, F.; Jafary, H.; Moradi, P.; Pucci, M.; Abate, G.; Mastinu, A. Physiological and molecular aspects of two Thymus species differently sensitive to drought stress. BioTech 2022, 11, 8. [Google Scholar] [CrossRef] [PubMed]
  30. Zhao, S.Y.; Zeng, W.H.; LI, Z.; Peng, Y. Mannose regulates water balance, leaf senescence, and genes related to stress tolerance in white clover under osmotic stress. Biol. Plant. 2020, 64, 406–416. [Google Scholar] [CrossRef]
  31. Ibrahim, H.A.; Abdellatif, Y.M.R. Effect of maltose and trehalose on growth, yield and some biochemical components of wheat plant under water stress. Ann. Agric. Sci. 2016, 61, 267–274. [Google Scholar] [CrossRef]
  32. Lee, B.-R.; Jin, Y.-L.; Jung, W.-J.; Avice, J.C.; Morvan-Bertrand, A.; Curry, A.; Park, C.-W.; Kim, W.-A. Water-deficit accumulates sugars by starch degradation –not by de novo synthesis– in white clover leaves (Trifolium repens). Physiol. Plant. 2008, 134, 403–411. [Google Scholar] [CrossRef]
  33. Phillips, G.O.; Moody, G.J. Radiation chemistry of carbohydrates. Part V. The effect of ultraviolet light on aqueous solutions of D-glucose in oxygen. J. Chem. Soc. 1960, 3398–3404. [Google Scholar] [CrossRef]
  34. Silvente, S.; Sobolev, A.P.; Lara, M. Metabolite adjustments in drought tolerant and sensitive soybean genotypes in response to water stress. PLoS ONE 2012, 7, e38554. [Google Scholar] [CrossRef]
  35. Ünal, N.; Okatan, V. Effects of drought stress treatment on phytochemical contents of strawberry varieties. Sci. Horti. 2023, 316, 112013. [Google Scholar] [CrossRef]
  36. Rizhsky, L.; Liang, H.; Shuman, J.; Shulaev, V.; Davletova, S.; Mittler, R. When defense pathways collide. The response of Arabidopsis to a combination of drought and heat stress. Plant Physiol. 2004, 134, 1683–1696. [Google Scholar] [CrossRef] [PubMed]
  37. Loewus, F.A.; Murthy, P.P.N. myo-Inositol metabolism in plants. Plant Sci. 2000, 150, 1–19. [Google Scholar] [CrossRef]
  38. Simkin, A.J.; Lopez-Calcagno, P.E.; Raines, C.A. Feeding the world: Improving photosynthetic efficiency for sustainable crop production. J. Exp. Bot. 2019, 70, 1119–1140. [Google Scholar] [CrossRef] [PubMed]
  39. Gates, D.M. Leaf Temperature and Transpiration. Agron. J. 1964, 56, 273. [Google Scholar] [CrossRef]
  40. Gauthier, M.-M.; Jacobs, D.F. Walnut (Juglans spp.) ecophysiology in response to environmental stresses and potential acclimation to climate change. Ann. For. Sci. 2011, 68, 1277–1290. [Google Scholar] [CrossRef]
  41. García-Inza, G.P.; Castro, D.N.; Hall, A.J.; Rousseaux, M.C. Opposite oleic acid responses to temperature in oils from the seed and mesocarp of the olive fruit. Eur. J. Agron. 2016, 76, 138–147. [Google Scholar] [CrossRef]
  42. Jin, F.; Zhou, Y.; Zhang, P.; Hyung, R.; Fan, W.; Li, B.; Li, G.; Song, X.; Pei, D. Identification of Key Lipogenesis Stages and Proteins Involved in Walnut Kernel Development. J. Agric. Food Chem. 2023, 71, 4306–4318. [Google Scholar] [CrossRef] [PubMed]
Figure 1. Concentration of leaf metabolites malondialdehyde (MDA), proline (PRO), total soluble sugars (TSS), total phenols (FEN), and total flavonoids (FLA) measured in terminal leaflets at three collection dates (sprouting: 1, endocarp hardening: 2, maturity: 3) of walnut trees cv. Chandler under different irrigation regimes (100%, 75%, and 50% of crop evapotranspiration), applied in two successive seasons (2018–2020) in Guanchín, La Rioja, Argentina. ‘ns’ indicates no significant differences between means according to the LSD test. Different letters indicate differences between means at p < 0.05. Bars represents standard deviation.
Sustainability 15 13472 g001
Figure 2. Concentration of leaf metabolites malondialdehyde (MDA), total phenols (FEN), total flavonoids (FLA), total soluble sugars (TSS), and proline (PRO) measured in a targeted manner in terminal leaflets extracted at sprouting (1), endocarp hardening (2), and maturity (3) of walnut trees cv. Chandler in Guanchín, La Rioja, Argentina. ‘ns’ indicates no significant differences between means according to the LSD test. Different letters indicate differences between means at p < 0.05. Bars represents standard deviation.
Sustainability 15 13472 g002
Figure 3. Principal component analysis and hierarchical clustering (ellipses) of metabolite concentrations (MDA = malondialdehyde, PRO = proline, FEN = total phenols, FLA = total flavonoids, and TSS = total soluble sugars) in terminal leaflets of walnut cv. Chandler, at budbreak (date 1, n = 12), endocarp hardening (date 2, n = 12), and maturity (date 3, n = 12) under three irrigation regimes at 100% (100), 75% (75), and 50% (50) of crop evapotranspiration applied over two consecutive seasons (2018–2020).
Sustainability 15 13472 g003
Figure 4. Principal component analysis of maximum intensities of metabolites profiled in walnut cv. Chandler walnuts subjected to three irrigation regimes during two seasons at 100% crop evapotranspiration (ETc) (T100, n = 4) 75% ETc (T75, n = 4), and 50% ETc (T50, n = 4).
Sustainability 15 13472 g004
Figure 5. Pearson correlation matrix, significant at p < 0.05, between metabolite–metabolite profiles identified by comparison with spectral mass libraries in walnut cv. Chandler kernels.
Sustainability 15 13472 g005
Figure 6. Biplot of principal component analysis (projection of individuals on the left, and projection of variables on the right) of the means of the normalized concentration of metabolites identified in walnut cv. Chandler walnuts subjected to three irrigation regimes over two consecutive seasons at 100% of ETc (T100, n = 4), 75% of ETc (T75, n = 4), and at 50% of ETc (T50, n = 4).
Sustainability 15 13472 g006
Table 1. Metabolites identified in walnut cv. Chandler kernels (mean ± standard deviation) under three irrigation regimes (100%, 75%, and 50% of ETc) applied in two consecutive seasons (2018–2019 and 2019–2020) in Guanchín, La Rioja, Argentina. p-values < 0.05 indicate significant differences between means according to the LSD test.
Rt (s)MetaboliteGroupT100
(mg gDW−1)
T75
(mg gDW−1)
T50
(mg gDW−1)
p-Value
695.8Oxalic acidOrganic acid1.41 ± 0.741.90 ± 0.641.62 ± 0.28>0.05
825.0GlycerolSaturated alcohol1.24 ± 0.731.51 ± 0.430.90 ± 0.18>0.05
836.6L-IsoleucineAmino acid0.52 ± 0.220.62 ± 0.200.64 ± 0.41>0.05
861.4Butanedioic acidOrganic acid0.61 ± 0.310.63 ± 0.470.78 ± 0.40>0.05
994.9Malic acidOrganic acid8.44 ± 3.1011.49 ± 6.856.85 ± 1.93>0.05
1012.6Pyroglutamic acidOrganic acid0.93 ± 0.320.82 ± 0.250.77 ± 0.35>0.05
1017.7L-AsparticAmino acid0.80 ± 0.540.64 ± 0.560.49 ± 0.36>0.05
1086.1L-GlutamicAmino acid2.69 ± 0.832.31 ± 1.603.71 ± 1.17>0.05
1187.3Phosphoric acidOrganic acid1.32 ± 0.421.53 ± 0.511.34 ± 0.70>0.05
1193.3Ribonic acidOrganic acid0.68 ± 0.380.91 ± 0.540.63 ± 0.17>0.05
1197.4D-PsicofuranoseCarbohydrate0.91 ± 0.461.13 ± 0.220.80 ± 0.27>0.05
1221.9Citric acidOrganic acid2.73 ± 1.003.01 ± 1.982.11 ± 0.59>0.05
1224.0Myristic acidOrganic acid4.77 ± 1.015.37 ± 0.405.35 ± 0.49>0.05
1227.1Methyl galactosideCarbohydrate1.24 ± 0.281.55 ± 0.381.25 ± 0.13>0.05
1276.1D-mannoseCarbohydrate1.88 ± 0.631.50 ± 0.552.57 ± 1.78>0.05
1286.1D-TaloseCarbohydrate0.98 ± 1.060.67 ± 0.460.61 ± 0.27>0.05
1300.7Gallic acidOrganic acid2.34 ± 1.292.09 ± 1.742.12 ± 0.50>0.05
1323.9GlucopyranoseCarbohydrate0.57 ± 0.220.94 ± 0.281.63 ± 2.04>0.05
1338.6Palmitic acidFatty acid1.66 ± 0.701.75 ± 0.431.92 ± 0.56>0.05
1344.9Gluconic acidOrganic acid6.31 ± 3.706.9 ± 2.865.52 ± 0.95>0.05
1383.0Myo-inositolVitamin3.70 ± 1.223.89 ± 0.574.39 ± 1.04>0.05
1398.1Arabine-hexaric acidOrganic acid0.84 ± 0.460.85 ± 0.211.02 ± 0.44>0.05
1427.7Linoleic acidFatty acid1.48 ± 0.461.76 ± 0.351.95 ± 0.99>0.05
1430.7Oleic acidFatty acid1.09 ± 0.451.54 ± 0.451.48 ± 0.57>0.05
1439.1TryptamineAmino acid0.45 ± 0.410.36 ± 0.260.31 ± 0.53>0.05
1444.1Stearic acidFatty acid0.93 ± 0.181.17 ± 0.431.04 ± 0.43>0.05
1526.3Mono myristic acidOrganic acid2.66 ± 0.743.07 ± 0.163.04 ± 0.56>0.05
1533.7Myo-Inositol-phosphatePhospholipid0.81 ± 0.290.89 ± 0.251.03 ± 0.35>0.05
1561.2DopamineAmine1.45 ± 0.971.55 ± 0.351.29 ± 1.28>0.05
1600.92-Palmitoil GlicerolCarbohydrate1.57 ± 0.631.43 ± 0.171.46 ± 0.42>0.05
1617.41-MonopalmitateFatty acid36.67 ± 8.9541.78 ± 2.0542.67 ± 5.89>0.05
1665.8D-TrehaloseCarbohydrate54.67 ± 12.7166.42 ± 9.2353.83 ± 5.02>0.05
1684.92-MonostearateFatty acid0.94 ± 0.271.07 ± 0.160.88 ± 0.29>0.05
1700.6Glyceryl-stearateFatty acid26.52 ± 6.4030.29 ± 1.8131.66 ± 5.21>0.05
1707.8MaltoseCarbohydrate0.74 ± 0.130.52 ± 0.170.87 ± 1.01>0.05
1751.8CatechinFlavonoid1.27 ± 0.771.46 ± 0.310.99 ± 0.38>0.05
1762.1D-CellobioseCarbohydrate1.17 ± 0.381.23 ± 1.080.95 ± 0.72>0.05
1780.2Glycerol-eicosanoicCarbohydrate0.69 ± 0.630.43 ± 0.100.63 ± 0.21>0.05
1811.5MelibioseCarbohydrate3.68 ± 2.603.26 ± 1.242.28 ± 0.40>0.05
2036.4SucroseCarbohydrate18.5 ± 5.0223.91 ± 4.4922.31 ± 5.20>0.05
Disclaimer/Publisher’s Note: The statements, opinions and data contained in all publications are solely those of the individual author(s) and contributor(s) and not of MDPI and/or the editor(s). MDPI and/or the editor(s) disclaim responsibility for any injury to people or property resulting from any ideas, methods, instructions or products referred to in the content.

