Abstract
This paper presents an analysis of two methodologies that can be used to predict refueling behavior. Both models aim to provide insights into hydrogen-fuel vehicle users’ refueling patterns and behaviors. The first model leverages probabilistic transitions between refueling states to simulate and predict the refueling behavior of hydrogen vehicle users. In contrast, the GP-1 model employs Gaussian processes to capture the underlying patterns and uncertainties in hydrogen-fuel vehicle refueling behavior, taking into consideration additional factors such as weather conditions and the time of the year. The model demonstrates statistical significance and accuracy in predicting trips while identifying the insignificance of precipitation and high ambient temperatures. The methodologies, findings, strengths, and limitations of the two models were tested and compared to identify their relevant contributions. By contrasting their methodologies and evaluating their predictive performance, using performance metrics such as accuracy, precision, and recall values, this study provides valuable insights into the strengths and limitations of each approach. Limitations include assuming a stationary refueling process and excluding external factors and limitations related to data availability, as well as the absence of a specific focus on hydrogen-fuel vehicles. By understanding the differences and similarities between these two models, this paper aims to provide a unique perspective on gaps and further requirements for accurate prediction and modeling of refueling behavior to guide policymakers, infrastructure planners, and stakeholders in making informed decisions regarding the design and optimization of hydrogen refueling infrastructure.
1. Introduction
As greenhouse gas (GHG) emissions within the transport sector continue to increase, the importance of vehicles using “greener” forms of fuel, such as hydrogen-fuel vehicles (HFVs), has gained significant notice. The transport sector is responsible for about 23% of emissions globally [1,2]. HFVs are widely recognized as pivotal to the decarbonization of the transportation sector. Numerous studies have explored not only the significance of commercializing these alternative-fuel vehicles but also the interconnected dynamics of carsharing, driver behavior, vehicle usage patterns, and the provisioning of robust refueling infrastructure. These multifaceted investigations collectively contribute to the informed promotion and successful integration of alternative-fuel vehicles, including HFVs, into the transport landscape [3,4]. Especially from a developing country standpoint, the construction of refueling infrastructure is vital to promote new market players onto the roads. Furthermore, the use of HFVs stands as a promising solution to mitigate the ecological impacts of traditional fossil-fuel-powered vehicles [5,6,7]. Also, the availability and positioning of refueling infrastructure in the adoption of these vehicles [8,9] cannot be understated. This is especially relevant because of the “chicken-and-egg” conundrum, which states that the optimal penetration or adoption of HFVs will only occur if there is adequate refueling infrastructure present. At the same time, inadequate demand for these vehicles results in limited refueling infrastructure [10]. Several studies note the importance of well-built, accessible, and organized refueling infrastructure to encourage public adoption [11,12,13].
The emergence of HFVs has introduced new challenges in understanding and modeling their refueling behavior. Studies [7,14,15,16] have justified the need for the accurate modeling of refueling patterns to optimize infrastructure planning, energy management, and policy development to allow faster diffusion of HFVs into the market. Additionally, dependence on driver behavior and refueling patterns are seen to heavily influence refueling infrastructure construction and build [14,15,17,18]. The focus of numerous research studies has been on designing models or algorithms that can be used to predict the adoption of AFVs. However, most of these studies are predominantly focused on electric vehicles and the refueling behavior of electric vehicle users [19,20,21]. This is in addition to several papers comparing electric vehicle charging infrastructure and HFV infrastructure [22,23]. As such, several studies have delved into understanding the transition to HFVs and the challenges in predicting refueling behavior with limited data [24]. Since the accurate modeling of refueling patterns is essential for optimizing the placement and capacity of refueling stations/infrastructure, studies such as those in [18,24,25,26] have contributed by studying and designing models that predict the refueling patterns of HFV users. This proves especially valuable since the location of hydrogen refueling stations and their layout could contribute to improving the adoption of HFVs [27,28]. This is also said to influence “driver concern” regarding refueling and hence could also impact HFV users’ refueling behavior [28].
One way to mitigate this concern is to understand the refueling behavior of HFV users. Several studies have now designed predictive models to address the challenges that come with HFV adoption and to contribute to hydrogen infrastructure planning [24,25,29]. Effective predictive models enable informed decisions regarding the location, capacity, and timing of hydrogen refueling stations. By predicting refueling behavior, the models can facilitate optimal infrastructure placement and efficient utilization of resources, leading to cost-effective and sustainable hydrogen refueling networks. Additionally, accurate predictions will aid in energy and resource management. Understanding patterns such as refueling frequency, duration, and timing can help energy providers optimize hydrogen production, storage, and distribution, as well as minimize waste and ensure adequate availability of hydrogen resources where and when needed. Predictive models also allow for improved user experience, increasing HFV adoption rates. By anticipating refueling demands, models can guide users towards conveniently located refueling stations, reducing range anxiety, and enhancing the overall driving experience.
Since the adoption of HFVs as a sustainable transportation solution necessitates accurate prediction of user refueling behavior, this paper analyzes two models, designed and developed for predicting the refueling behavior of HFV users. The first focuses on utilizing a stochastic model based on the Markov Chain Process (MCP), while the second employs Generalized Poisson modeling for predicting the refueling trips of HFV users. A comparison of these models offers insights into the different approaches employed, the findings obtained, and an understanding of the strengths and limitations of each. Furthermore, by analyzing the approaches, it is possible to identify contributions to the field and explore potential avenues for future research. This study also quantifies the performance of each model to validate its accuracy and precision. The primary novelty and contributions of this study include the following:
- Methodological insight: This study provides a comprehensive comparison between two distinct methodologies by offering insights into the strengths, weaknesses, and applicability of each approach to recommend a more accurate model/approach for forecasting refueling behavior.
- Model performance evaluation: Comparing the predicted values of the two models with actual data will assess the accuracy, precision, and recall of each model. This evaluation is crucial for comprehending the performance of each model in real-world scenarios and varying conditions. Additionally, it enables the introduction of a combined model that leverages the strengths of both approaches, resulting in a more accurate and precise predictive model.
- Applying performance metric testing on the models to verify the accuracy and precision of the models in predicting refueling behavior.
- Development of a novel predictive model: A key contribution is the prospect of amalgamating the advantageous attributes of both models to develop a novel predictive framework that is capable of achieving enhanced precision and accuracy in modeling refueling behavior.
This paper is organized into sections, each addressing specific aspects of the comparative analysis. Section 2 presents a brief overview of the models and the methodologies employed to develop these models, while Section 3 provides a comparative analysis of their similarities and differences. Section 4 presents the findings as well as highlights the strengths and limitations of both models. Concluding remarks are presented in Section 5.
2. Methodology
Through a comprehensive analysis of the stochastic Markov model and the general Poisson model, it is possible to unveil the advancements and challenges associated with probabilistic modeling and machine learning techniques in predicting refueling behavior. This section provides a brief description of the models considered and also details the approach followed to conduct a thorough analysis of two models designed to predict the refueling behavior of HFV users.
2.1. Model Selection
In selecting the models, the following criteria were considered [18,30,31]:
- Relevance: The selected models directly address the objective under investigation and provide insights into similar aspects being studied—predictive models for refueling behavior.
- Methodology/approach: The chosen models should employ distinct methodologies or approaches that will allow for a comparative analysis of the different theoretical foundations, assumptions, and modeling techniques.
- Representativeness: The models chosen should represent the state-of-the-art models in the field. These models have been developed and recognized as notable contributions to the relevant literature. This will ensure that the comparison reflects current best practices and provides meaningful insights into the existing body of knowledge.
- Performance and success metrics: Models with documented performance metrics or evaluation measures should be considered to allow for a quantitative or qualitative assessment of the model’s performance and predictive capabilities; analysis with performance metrics provides empirical evidence and allows the determination of which model performs better in specific contexts.
- Applicability and generalizability: Models that have been validated or applied in real-world scenarios prove more valuable for comparative analysis. The generalizability of the models enhances their practical relevance and potential for wider adoption.
- Data requirements and availability: Models that require similar data inputs or have compatible data sources can facilitate a fair and consistent comparison. Ideally, the same datasets identified and used in the models would be used.
- Novelty and research gap: Models selected should address existing research gaps and introduce innovative methodologies or provide new perspectives.
The models identified were also studied with the following in mind [18]:
To initiate an effective comparison of the models, criteria such as model complexity, algorithm, and parameterization, presented in Figure 1, were used. Pertinent information and key details of each model and the designed algorithms were extracted, including the objectives, methodology descriptions, data sources, modeling techniques, findings, and limitations. The models were assessed, individually and in comparison with each other, to understand their similarities, differences, strengths, and limitations. The analysis focused specifically on the modeling techniques, data sources, validation methods, accuracy of predictions, and the practical implications of the findings to understand the strengths and demerits of each model.
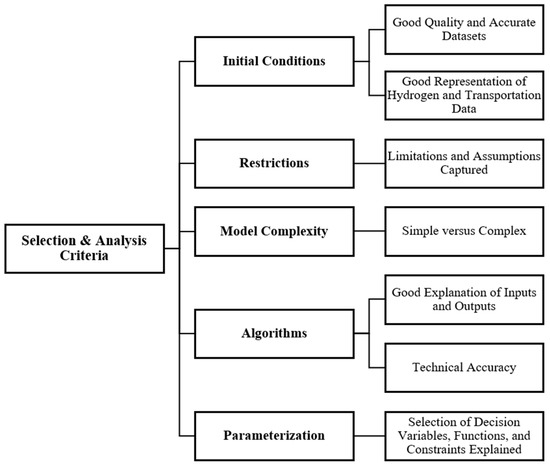
Figure 1.
Model selection and analysis criteria.
2.2. Performance Evaluation
An algorithm’s performance depends on its robustness, accuracy, and precision [32]. Accuracy is a commonly used performance metric in classification tasks, and it measures the overall correctness of the predictions made by a model. It is a useful metric when classes in the dataset are well-balanced; that is, the number of instances in each class is roughly equal [26,33]. Equation (1) is used to calculate model accuracy:
Model accuracy is obtained by comparing the predicted values with actual values to determine the correct number of predictions (true positives (TP) and true negatives (TN)) out of the total number of predictions. In this instance, TP refers to the number of predicted values that fall within 80% to 120% of the actual values. The TN values are the number of predicted values that fall outside the 80% to 120% range of the actual values. False positives (FP) refer to the number of predicted values that fall within the 80% to 120% range of the actual values but are incorrect, while false negatives (FN) are the number of predicted values that fall outside the 80% to 120% range of the actual values but should have been within the range.
Additional performance metrics such as precision and recall were also considered. These metrics provide insights into the accuracy and completeness of the predictions obtained by a model [32]. Elevated precision values indicate the model’s proficiency in minimizing the incidence of erroneously categorizing negative instances as positive, thereby demonstrating a diminished false positive rate. The computation of precision entails a comparative analysis between predicted and actual values, culminating in the identification of TPs and FPs. In the context of this study, a true positive arises when the predicted value falls within a predefined range (specifically, between 80% and 120%) of the corresponding actual value. Conversely, a false positive materializes when the predicted value surpasses this range. The ensuing Equation (2) delineates the precise methodology to calculate precision:
Recall measures the proportion of correctly predicted positive instances (TP) out of all actual positive instances. A high recall value indicates that the model effectively captures a large proportion of the actual positive instances. Precision and recall are complementary metrics—a high-precision model is cautious in making positive predictions and is more reliable when it predicts a positive outcome, while a high-recall model is more inclusive and captures a larger portion of positive instances but may also generate more FPs. To calculate recall value, TPs and FNs based on the actual values and predicted values are identified. Recall is the ratio of true positives to the total actual positives. The predicted value is considered a TP if it lies within a certain threshold of the corresponding actual value. In this instance, a threshold of +/− 1000 refueling instances/trip counts is considered. Equation (3) shows how the recall is calculated:
The F1 score is a performance metric that combines precision and recall into a single measure. It provides an overall evaluation of the model’s performance in binary classification tasks. Equation (4) shows how the F1 score is calculated:
All findings from the comparative analysis were synthesized and interpreted to derive meaningful insights. The synthesis involved identifying common themes, trends, and areas of convergence or divergence between the models. The comparative analysis findings are discussed considering the broader research context and research contributions highlighted. Finally, conclusions on the comparative analysis and potential future research directions are identified and detailed.
2.3. Data Quality
Ideally, the dataset identified within the respective models will be used to run and evaluate the performance of the models [33]. However, it is important to consider the potential data biases and limitations associated with the datasets:
- Sample bias: If the locations from which the refueling data were collected do not represent a diverse range, then this could introduce sample bias.
- Incomplete coverage: The refueling data may not capture all refueling events due to factors like data collection limitations, privacy concerns, or technical issues. Incomplete coverage could lead to an incomplete understanding of refueling behavior.
- Generalizability: Data from a specific region or period may not be directly applicable to other regions or periods due to differences in factors like infrastructure, policies, and consumer behavior.
- Fueling station variability: Different refueling stations might have varying capacities, availability, and utilization rates, potentially affecting the representation of refueling patterns in the data.
- Limited spatial coverage: Vehicle count data may not cover all areas equally. It was evident that urban or high-traffic regions were more prevalent, leading to potential biases that a study area is not well-represented.
To ensure the quality of data used, the following was performed:
- Validation and cleaning: The data were checked during collection to identify potential errors or outliers in real time. The data were transposed onto an Excel workbook to clean and correct them and thereby prevent the propagation of inaccuracies.
- Cross-validation and verification: The data were cross-verified with other independent sources or methods to ensure consistency and accuracy.
2.4. Assumptions and Limitations
The following assumptions and limitations were also considered in this study:
- It is assumed that the models studied contain highly accurate representations of the refueling behavior of HFV users.
- Both prediction models are based on the same empirical, limited dataset presented in the studies.
- Models are based on data derived from an urban context.
3. Comparative Analysis
In this section, the similarities, differences, strengths, and limitations of each model are identified and documented. The first model presents a stochastic model to analyze and predict the refueling behavior of hydrogen-fuel vehicles. Using the MCP, the trends and refueling patterns of hydrogen-fuel vehicles and driver behavior are modeled. Existing hydrogen data based on current driving and refueling trends were used to verify the model’s accuracy. The Markov model uses transitions to describe how HFVs move between different states and conditions over discrete time steps [24]. In the context of refueling behavior, states represent the different states of refueling, namely, State 1: Not fueling; State 2: Fueling, and State 3: Engaged but not fueling. Probabilities are used to determine the likelihood of moving from one state to another. The transition probabilities were estimated from historical data on HFV refueling patterns. The model assumes that the future state of the system only depends on its current state and not on the sequence of events that led to that state. For the stochastic process to be meaningful, the Markov process is run N number of times, and an average value is calculated from the iteration of the data [16]. HFV refueling data from the National Renewable Energy Laboratory (NREL) was used in this study [34]. The model proves helpful, from a practical stance, to understand how operators of existing refueling stations can adjust their operations based on predicted usage patterns ensuring sufficient hydrogen availability during peak demand periods.
The second model focuses on refueling behavior and considers the number of refueling trips taken by vehicles but also considers the influence of weather conditions and time of year. These factors are considered important because a number of studies indicate that fuel consumption patterns are influenced by weather [30]. These studies show that there are observable trends in refueling frequency over different seasons, and the statistical significance of these patterns varies [30,35]. This model utilizes Generalized Poisson modeling and count-based data. The algorithm was designed using the programming language Python and the Statsmodel module to predict refueling trips. The model’s viability was tested on data, and sensitivity tests were conducted to assess its correlation with actual trips. In the Generalized Poisson (GP-1) model, linear regression analysis is used to model and predict count-based data [36]. Gaussian or normal distribution is a common choice when the data exhibit continuous and symmetrical characteristics. In the context of refueling behavior, Gaussian probabilities are used to capture the variability and uncertainty associated with the timing of refueling events, assuming that the events follow a Gaussian distribution. In this model, the observed vehicle count data are fit to the Gaussian distribution. This involves estimating the parameters of the Gaussian distribution, namely the mean and standard deviation [25]. The distribution fitted to the data is then used to calculate the probabilities associated with different time intervals between refueling events, making it possible to calculate the probability that a refueling event will occur within that interval. Vehicle count data were used to develop the prediction model and train the algorithm [37]. In terms of practical relevance, the GP-1 model has been applied in a number of studies to optimize the placement and capacity of refueling stations, as it is possible to predict the number of refueling trips based on historical data.
3.1. Similarities
Analysis of the models evidenced that the research focus for both is to understand and predict vehicle refueling trips or patterns, with a specific focus placed on HFVs [24,25]. Both rely on empirical data to develop, design, and train their algorithms. The findings are validated using statistical modeling techniques to capture and represent refueling behaviors or patterns. This is in line with numerous studies, such as those in [14,38,39,40], which have used empirical datasets as the foundation for the design of their simulation models. Both mention the use of the Python programming language for model development and implementation. The algorithms designed first import the needed libraries, namely Statsmodel and the Pandas library, to read the data and derive the necessary regression variables. In terms of model validation, the accuracy and validity of the models are verified by comparing the predicted refueling trips with actual data or through sensitivity analysis. Although the first model specifically focuses on HFVs, both models mention the potential applicability to alternative-fuel vehicles such as HFVs when sufficient hydrogen refueling data become available. Also, the potential future applications of the models in predicting behavior and trends while contributing to infrastructure planning and energy management within the transport sector are discussed. Since the algorithms are modeled on real-world data, daily and weekly refueling patterns can be forecasted.
3.2. Differences
Both models delve into the domain of refueling patterns, but they differ in terms of their scope, modeling approaches, factors considered, data analysis, and future applications.
- Scope and context: In the first model, the trends and refueling patterns of HFVs within a developing country context are analyzed [24]. In contrast, the GP-1 model predicts vehicle refueling trips without a specific focus on hydrogen-fuel vehicles, but it considers an external factor that is shown to influence driver behavior—weather [25,41].
- Modeling approach: In terms of the modeling approach, the first algorithm is founded on the MCP to capture the random nature of refueling of HFV users. This approach has been used in several studies; however, applications specifically to HFVs are limited [38,42]. On the other hand, the second model also considers weather conditions and the time of the year as factors influencing driving patterns and refueling behavior.
- Factors considered: While both models investigate refueling behavior, they consider different factors. The stochastic model incorporates factors such as fueling times, fueling capacity, and time spent at refueling stations to analyze the refueling behavior of HFV users. In contrast, the GP-1 model considers the influence of temperature, precipitation, and period of year as factors influencing vehicle refueling trips. Many studies have shown that fuel consumption patterns are influenced by factors such as weather conditions as indicated in [30].
- Data analysis and validation: Different approaches were employed to analyze and validate the models. In the stochastic model, the accuracy of the refueling patterns generated was validated by comparing them against real-life HFV data. A sensitivity analysis was conducted to confirm the accuracy of the findings obtained. Data on HFVs obtained from the NREL were used to model and train the algorithm [34]. The second model demonstrates the statistical significance of the GP-1 model and tests its viability on the remaining data to evaluate its predictive capabilities. New York County (NYC) trip counts for the year 2019 were considered and used to develop the algorithm [43]. It should be noted that the NREL data were based entirely on hydrogen vehicle data, while the NYC data considered conventional vehicle trips/counts.
- Significance and future applications: Both models contribute to the understanding of refueling behavior; however, they have different implications and future applications. The first provides valuable insights into the refueling behavior of HFVs within the South African context, aiding in infrastructure planning and hydrogen-fuel consumption analysis [24]. On the other hand, the potential of the GP-1 models to predict refueling behavior and future trends is not limited to HFVs but is also applicable to other alternative-fuel vehicles when relevant data become available [25].
- Unique contributions to the body of knowledge: The Markov model can provide valuable insights into the design and optimization of hydrogen refueling stations to determine the optimal number, location, and capacities of these stations. The model also proves useful in countries with emerging hydrogen mobility, as it contributes to understanding consumer adoption and acceptance of HFVs. The GP-1 model accounts for heterogeneity and variations in refueling behavior and hence can be applied to different vehicle types, regions, or time periods, leading to more nuanced and accurate predictions.
4. Key Findings and Discussion
The key findings that emerged in the comparative analysis of the predictive models are presented below. These findings shed light on the performance, strengths, and limitations of each model.
The stochastic Markov model makes use of MCP to quantify the dynamic nature of the refueling of HFV users, specifically within a developing country context. The model provides forecasts and data on refueling times (both weekday and weekend profiles), capacity, and time spent at refueling stations [41,42]. Using this model, it was established that fueling capacity for stations remains steady at 50% capacity between 5:00 a.m. to 8:00 p.m. on weekdays. Average refueling times during peak periods on weekdays were determined to be about 2.7 min, while on the weekends this dropped to 2.5 min. It was also determined that customers spent, on average, 3.8 min at fueling stations during peak periods. The model’s accuracy was verified using real-life hydrogen-fuel vehicle data [24]. The second model focused on predicting refueling behavior, employing a GP-1 model. This model incorporates weather conditions and the time of year to forecast the number of refueling trips [43]. Statistical analysis confirmed the GP-1 model’s significance at a 95% confidence level, accurately converging to predict refueling trips. Through sensitivity tests, it was observed that training the model with 70% of the data resulted in a strong correlation between actual and predicted refueling trips. Factors such as precipitation were considered but were proven to be statistically insignificant. Since the data used in this study did not show an observed pattern when precipitation was considered, precipitation was seen as negligible, as no real variations were noticed in the precipitation data. However, it was noted that in regions where precipitation is significant, this factor would also be prominent, as suggested in [25]. The algorithm was trained using the training data, and its performance was evaluated by comparing it with the actual counts using the test data; the level of accuracy of the predictions is deemed to be high [25]. However, it was noted that this model made use of conventional vehicle data. The Pearson correlation coefficient was calculated to further ascertain the strength and direction of the relationship between the predicted and actual values. This is in line with [44], which indicated that the Pearson correlation is a good way to assess the degree of association between two variables. Hence, the Pearson correlation was calculated, and the Markov model rendered a correlation of 0.974, while the GP-1 model obtained a correlation of 0.846. Furthermore, to gauge the robustness of the algorithms studied and verify the performance of the models, the models were compared with various performance metrics: accuracy, precision, recall, and F1 values [32]. The results obtained are presented in Figure 2 below.
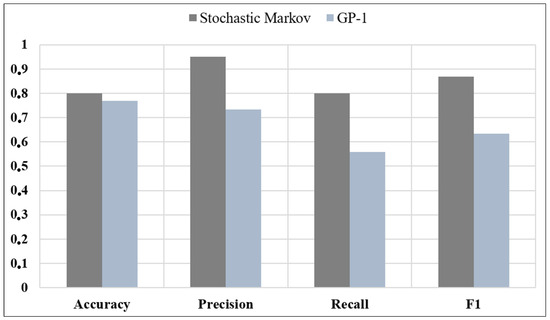
Figure 2.
Model performance metrics.
In terms of overall performance, it is evident that the stochastic Markov model performs better in terms of accuracy, precision, recall, and F1 score. The model also has a higher correlation factor. This could be attributed to the fact that the Markov model considers the stochastic nature of refueling behavior. The stochastic model excels in furnishing crucial insights into refueling behavior unique to hydrogen-fuel vehicles, particularly in data-scarce scenarios. Furthermore, this model considers “states” of refueling and, hence, is deemed to forecast data more accurately, especially when a well-balanced dataset is used [24,32]. It could also be argued that the stochastic Markov model is “superior” in its accuracy and precision, while providing more technical soundness in its approach, because actual, existing hydrogen vehicle data are used. However, it should be noted this model assumes stationary transition probabilities, which may not always hold in dynamic environments or as user behavior evolves. The GP-1 model’s performance heavily relies on the quality and representativeness of the training data. The availability of diverse and well-labeled datasets is essential for maximizing their predictive capabilities. The GP-1 modeling technique demonstrates statistical significance and accuracy in predicting refueling trips and highlights the viability of Generalized Poisson modeling and its potential application to alternative-fuel vehicles, including hydrogen-fuel vehicles. The model’s performance, however, is dependent on the availability and quality of historical refueling data. Also, this study does not specifically focus on hydrogen-fuel vehicles, but the model’s applicability to such vehicles is mentioned for future research. The F1 score for the GP-1 model is considerably lower than the stochastic Markov model. This could be attributed to the fact that the GP-1 model also considers external factors such as weather, temperature, and precipitation that have a clear impact on refueling patterns, as suggested in [41,45]. In this instance, there are higher chances of generating more FPs as the dataset used is not as well-balanced because of the external factors considered. Additionally, the Poisson model cannot explain variability on observed counts; this is because the study assumes that the variance is equal to the mean, and in most datasets, there is overdispersion. Although this model is based on conventional vehicle data, it could prove beneficial once HFV data becomes more readily available—numerous studies have indicated that HFVs are quite like conventional vehicles in terms of their driving range and capabilities [46,47]. This is an indication that the refueling patterns exhibited by HFV drivers will more than likely follow those of current conventional vehicle drivers [24].
An additional test was also conducted to ascertain whether the difference between the models is statistically significant [48]. The means of the two models, based on their confidence intervals and standard errors, were compared, i.e., a test statistic was calculated and compared with a critical value. For this test, a critical value, Z, of 1.96 for a 95% confidence interval was considered. When the test statistic was compared with the critical value, it was noted that the test statistic falls within the range defined by the critical value, and a p-value of 0.2614 was obtained. It should be noted that the p-value represents the probability of observing a test statistic as extreme as the one calculated, assuming that the null hypothesis is true. Hence, the difference between the two models was not considered statistically significant [48]. The confidence intervals of the two different predictive models were also assessed and plotted. The results are presented in Figure 3.
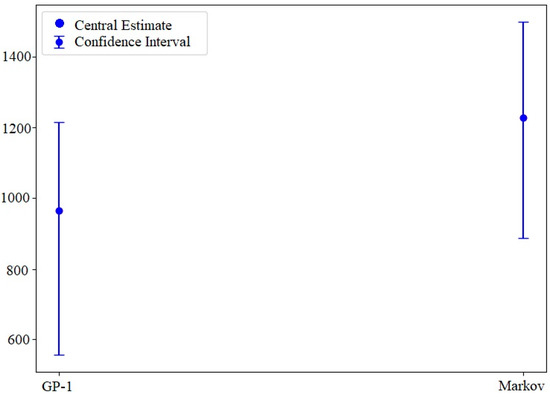
Figure 3.
Confidence intervals and central estimates of the models studied.
From Figure 3, it is evident that there is no significant difference between the two models at the chosen level of confidence. This is in line with earlier findings in that both models forecast HFV behavior to an impressive level of accuracy and precision; however, it cannot be confidently asserted that the Markov model is better than the GP-1 model at the chosen level of confidence.
A comparative summary of the two models is provided in Table 1.

Table 1.
Comparative summary of models reviewed.
Overall, it can be concluded that both models perform relatively well in terms of their predictive capabilities; however, Markov is slightly better based on the Pearson correlation, accuracy, precision, recall, and F1 values obtained. Comparing predictions with actual outcomes allows policymakers to validate the effectiveness of existing policies or interventions. This iterative process can lead to data-driven policy refinements in terms of the allocation of resources and building of hydrogen fueling infrastructure. This study also proves useful for data quality improvement, as discrepancies between predictions and actual values may indicate issues with data quality or collection. Policymakers can then work on improving data collection methods and addressing data gaps, as these differences highlight areas of uncertainty or higher risk. Hence, policymakers can focus on these areas for further investigation or risk mitigation strategies. Furthermore, since this study involves setting a threshold for evaluating predictions, which demonstrates the impact of different levels of precision and recall, this study can help policymakers and stakeholders make informed decisions based on the trade-offs between accurately identifying true positives and capturing all actual positives.
However, it should be noted that the choice between the stochastic Markov model and the GP-1 model depends on the specific research objectives, available data, and context of the application. The stochastic model is well-suited for scenarios where the probabilistic nature of refueling behavior is of primary interest. It provides a systematic framework for understanding transitions and capturing long-term trends [24]. On the other hand, the GP-1 model is more suitable when dealing with complex, nonlinear patterns, making it advantageous in scenarios where predictive accuracy is crucial.
By combining the strengths of both models, it is possible to create a new model that will predict refueling behavior with more precision and accuracy. Hence, considering the key findings, a general framework for creating a hybrid ensemble model is presented and detailed in Figure 4:
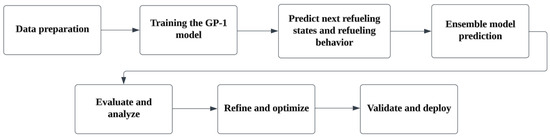
Figure 4.
Proposed framework for hybrid ensemble model to predict refueling behavior.
- Data preparation: Split the datasets into training and testing sets and compute the transition probabilities for the stochastic Markov model using the training set. Perform any necessary preprocessing steps (e.g., feature scaling, normalizing) on the training set.
- Train the GP-1 model: To train the GP-1 model, apply preprocessing steps to the training sets for the GP-1 model.
- Predict the next refueling state with the stochastic Markov model: For each instance in the testing set, use the trained stochastic Markov model and the transition probabilities to predict the probabilities of the next refueling state.
- Predict refueling behavior with GP-1 model: For each instance in the testing set, apply the necessary preprocessing steps (e.g., feature scaling, normalization) to the instance and use the trained GP-1 model to predict the refueling behavior.
- Ensemble model prediction: For each instance in the testing set, obtain the predicted probabilities of the next refueling state from the stochastic Markov model and obtain the predicted refueling behavior from the GP-1 model. Next, assign weights to the predictions based on their performance and characteristics and combine the predictions using a weighted averaging or stacking technique to obtain the ensemble prediction.
- Evaluate and analyze: Compare the predictions from the individual models (stochastic Markov model and GP-1 model) with the ensemble predictions, then calculate performance metrics (e.g., accuracy, precision, recall, and F1 score) for each model and the ensemble model. Next, assess the improvement in accuracy and precision achieved by the ensemble model compared with the individual models.
- Refinement and optimization: Analyze the results and iterate on the ensemble model. This includes fine-tuning the weights assigned to each model’s predictions based on their performance and conducting a sensitivity analysis of the weights to evaluate their impact on the overall performance. Also, it is important to consider implementing techniques like model stacking to improve the ensemble model’s performance.
- Validation and deployment: Validate the hybrid ensemble model on an independent validation set or through cross-validation to ensure its robustness and generalization capability.
5. Conclusions
Collectively, this comparison paper sheds light on two models and their unique contributions to understanding and predicting vehicle refueling behavior. By rigorously examining these models, this paper facilitates a comprehensive comprehension of their implications for the advancement of sustainable transportation and the optimization of fueling strategies. Both models offer valuable insights into modeling and analyzing refueling behavior in the context of vehicle transportation. The first focuses on the specific context of hydrogen-fuel vehicles within the South African transport sector, utilizing a stochastic model based on the MCP, while the second presents a more general approach using Generalized Poisson modeling, considering weather conditions and the time of the year. Although the models differ vastly in their approach and technical complexity, it was evident from comparative analysis that both models will do well in predicting future refueling patterns or behaviors of HFV users, once sufficient HFV refueling data become available because of well-tested models whose accuracy has been validated using sensitivity analyses and “goodness-of-fit” tests. Hence, both models contribute to understanding refueling patterns and provide insights into optimizing infrastructure planning and energy management—a need when there is limited data available in the field. However, it was noted that the datasets used in both studies were datasets established pre-COVID-19, a potential factor that could impact refueling behavior. From the analysis, it is evident that the two models can potentially be combined to increase accuracy and precision. Potential avenues for improvement, in addition to the hybrid ensemble model framework presented in Section 4, include the following:
- Integration of data sources: Integrating additional data sources can enrich the predictive models. For instance, by integrating real-time data on weather conditions, traffic patterns, or availability of refueling stations, the models’ accuracy and adaptability to dynamic environments can be improved.
- Model calibration and parameter estimation: Conducting a thorough calibration of the stochastic Markov model can ensure that the transition probabilities accurately reflect the underlying dynamics of HFV refueling behavior. Techniques such as maximum likelihood estimation or Bayesian inference to optimize the model parameters can be considered [32,49]. For the GP-1 model, it is recommended to fine-tune the hyperparameters and regularization techniques to improve its ability to capture complex patterns.
- Incorporate time series analysis: Implement time series analysis techniques to capture temporal dependencies and trends in HFV refueling behavior. This can include autoregressive models, moving averages, or more advanced methods such as recurrent neural networks (RNNs) or Long Short-Term Memory (LSTM) networks. Consider incorporating seasonality and periodic patterns to account for variations in refueling behavior over different timescales (e.g., daily, weekly, or monthly).
- Evaluation and validation: Conduct thorough evaluation and validation of the improved models using robust techniques such as cross-validation, out-of-sample testing, or comparison against benchmark datasets. This ensures that the suggested enhancements indeed lead to improved accuracy and precision.
By implementing these improvements and additions, it is possible to enhance the accuracy and precision of the models and potentially combine their strengths. However, it is important to thoroughly evaluate the effectiveness of these enhancements through rigorous testing and validation before applying them in practical scenarios. Continuous monitoring, feedback loops, and user engagement can further refine and optimize the models over time, ensuring that they provide more accurate and precise forecasts of HFV refueling behavior. By juxtaposing the two distinct modeling approaches, this study opens the door to potential integration. Researchers can draw insights from this study, while adapting and optimizing the hybrid ensemble framework presented in this study to yield a more accurate and comprehensive understanding of refueling behavior.
Overall, this study contributes to the growing body of knowledge on refueling behavior modeling, providing valuable insights for optimizing infrastructure planning, energy management, and policy development in the transportation sector.
Author Contributions
Conceptualization, N.I. and A.K.S.; methodology, N.I.; software, N.I.; validation, N.I. and A.K.S.; formal analysis, N.I. and A.K.S.; investigation, N.I.; resources, N.I.; data curation, N.I.; writing—original draft preparation, N.I.; writing—review and editing, N.I.; visualization, N.I.; supervision, A.K.S.; project administration, A.K.S.; funding acquisition, A.K.S. All authors have read and agreed to the published version of the manuscript.
Funding
This research received no external funding.
Institutional Review Board Statement
Not applicable.
Informed Consent Statement
Not applicable.
Data Availability Statement
All data used in this study derived from NREL and https://www.wunderground.com/history (accessed on 11 June 2022).
Conflicts of Interest
The authors declare no conflict of interest.
Nomenclature
| AFV | Alternative-Fuel Vehicle |
| FN | False Negative |
| FP | False Positive |
| GHG | Greenhouse Gas |
| GP | Generalized Poisson |
| HFV | Hydrogen-Fuel Vehicle |
| LSTM | Long Short-Term Memory |
| MCP | Markov Chain Process |
| NYC | New York County |
| RNN | Recurrent Neural Networks |
| TN | True Negative |
| TP | True Positive |
References
- Ajanovic, A.; Haas, R. Prospects and impediments for hydrogen and fuel cell vehicles in the transport sector. Int. J. Hydrogen Energy 2021, 46, 10049–10058. [Google Scholar] [CrossRef]
- IEA. CO2 Emissions from Fuel Combustion: Overview; IEA: Paris, France, 2020. [Google Scholar]
- Struben, J. Identifying Challenges for Sustained Adoption of Alternative Fuel Vehicles and Infrastructure; MIT Sloan School of Management: Cambridge MA, USA, 2006. [Google Scholar]
- Tran, M.; Banister, D.; Bishop, J.D.K.; Mcculloch, M.D. Technological Forecasting & Social Change Simulating early adoption of alternative fuel vehicles for sustainability. Technol. Forecast. Soc. Chang. 2013, 80, 865–875. [Google Scholar] [CrossRef]
- Keith, D. Essays on the Dynamics of Alternative Fuel Vehicle Adoption: Insights from the Market for Hybrid-Electric Vehicles in the United States. Ph.D. Thesis, Massachusetts Institute of Technology, Cambridge, MA, USA, 2012; pp. 1–212. Available online: http://dspace.mit.edu/handle/1721.1/79546 (accessed on 5 June 2023).
- Jabeen, F. The Adoption of Electric Vehicles: Behavioural and Technological Factors. Ph.D. Thesis, The University of Western Australia, Crawley, Australia, 2016. [Google Scholar]
- Hoekstra, A.; Hogeveen, P. Agent-based Model for the Adoption and Impact of Electric Vehicles in Real Neighbourhoods. In Proceedings of the EVS30, Stuttgart, Germany, 9–11 October 2017; pp. 1–16. [Google Scholar]
- Gnann, T.; Plötz, P. A review of combined models for market diffusion of alternative fuel vehicles and their refueling infrastructure. Renew. Sustain. Energy Rev. 2015, 47, 783–793. [Google Scholar] [CrossRef]
- Miralinaghi, M.; Lou, Y.; Keskin, B.B.; Zarrinmehr, A.; Shabanpour, R. Refueling station location problem with traffic deviation considering route choice and demand uncertainty. Int. J. Hydrogen Energy 2017, 42, 3335–3351. [Google Scholar] [CrossRef]
- Murugan, A.; de Huu, M.; Bacquart, T.; van Wijk, J.; Arrhenius, K.; Ronde, I.T.; Hemfrey, D. Measurement challenges for hydrogen vehicles. Int. J. Hydrogen Energy 2019, 44, 19326–19333. [Google Scholar] [CrossRef]
- Apostolou, D.; Xydis, G. A literature review on hydrogen refueling stations and infrastructure. Current status and prospects. Renew. Sustain. Energy Rev. 2019, 113, 109292. [Google Scholar] [CrossRef]
- International Council on Clean Transportation, Developing Hydrogen Fueling Infrastructure for Fuel Cell Vehicles: A Status Update. 2017, pp. 1–22. Available online: https://www.theicct.org/publications/developing-hydrogen-fueling-infrastructure-fuel-cell-vehicles-status-update (accessed on 5 June 2023).
- Meyer, P.E.; Winebrake, J.J. Modeling technology diffusion of complementary goods: The case of hydrogen vehicles and refueling infrastructure Modeling technology diffusion of complementary goods: The case of hydrogen vehicles and refueling infrastructure. Technovation 2009, 29, 77–91. [Google Scholar] [CrossRef]
- Zhang, T.; Gensler, S.; Garcia, R. A study of the diffusion of alternative fuel vehicles: An agent-based modeling approach. J. Prod. Innov. Manag. 2011, 28, 152–168. [Google Scholar] [CrossRef]
- Antipov, A.; Pokryshevskaya, B. Optimizing layouts of initial AFV refueling stations targeting different drivers and experiments with agent-based simulations. Eur. J. Oper. Res. 2016, 249, 22–26. [Google Scholar]
- Sokorai, P.; Fleischhacker, A.; Lettner, G.; Auer, H. Stochastic modeling of the charging behavior of electromobility. World Electr. Veh. J. 2018, 9, 44. [Google Scholar] [CrossRef]
- Kangur, A.; Jager, W.; Verbrugge, R.; Bockarjova, M. An agent-based model for diffusion of electric vehicles. J. Environ. Psychol. 2017, 52, 166–182. [Google Scholar] [CrossRef]
- Isaac, N.; Saha, A.K. A Review of the Optimization Strategies and Methods Used to Locate Hydrogen Fuel Refueling Stations. Energies 2023, 16, 2171. [Google Scholar] [CrossRef]
- Grahn, P.I.A. Electric Vehicle Charging Modeling. Ph.D. Thesis, KTH Royal Institute of Technology, Stockholm, Sweden, 2014. [Google Scholar]
- Elmehdi, M. Genetic Algorithm for Optimal Charge Scheduling of Electric Vehicle Fleet. In Proceedings of the NISS19: Proceedings of the 2nd International Conference on Networking, Information Systems & Security, Rabat, Morocco, 27–29 March 2019. [Google Scholar] [CrossRef]
- Eroglu, H.; Kaplan, E.; Memristor, M.B.; Switching, R. Increasing the Electrical Vehicle Efficiency with Genetic Algorithm. In Proceedings of the 8th International Advanced Technologies Symposium (IATS’17), Elazığ, Turkey, 19–22 October 2017. [Google Scholar]
- Thompson, S.T.; James, B.D.; Huya-Kouadio, J.M.; Houchins, C.; DeSantis, D.A.; Ahluwalia, R.; Wilson, A.R.; Kleen, G.; Papageorgopoulos, D. Direct hydrogen fuel cell electric vehicle cost analysis: System and high-volume manufacturing description, validation, and outlook. J. Power Sources 2018, 399, 304–313. [Google Scholar] [CrossRef]
- Greene, D.L.; Ogden, J.M.; Lin, Z. Challenges in the designing, planning, and deployment of hydrogen refueling infrastructure for fuel cell electric vehicles. In eTransportation, 6th ed.; Elsevier B.V.: Amsterdam, The Netherlands, 2020. [Google Scholar] [CrossRef]
- Isaac, N.; Saha, A.K. Predicting Vehicle Refuelling Trips through Generalised Poisson Modelling. Energies 2022, 15, 6616. [Google Scholar] [CrossRef]
- Isaac, N.; Saha, A.K. Analysis of refueling behavior of hydrogen fuel vehicles through a stochastic model using Markov Chain Process. Renew. Sustain. Energy Rev. 2021, 141, 110761. [Google Scholar] [CrossRef]
- Guerra, C.F.; García-Ródenas, R.; Sánchez-Herrera, E.A.; Rayo, D.V.; Clemente-Jul, C. Modeling of the behavior of alternative fuel vehicle buyers. A model for the location of alternative refueling stations. Int. J. Hydrogen Energy 2016, 41, 19312–19319. [Google Scholar] [CrossRef][Green Version]
- Li, Y.; Cui, F.; Li, L. An integrated optimization model for the location of hydrogen refueling stations. Int. J. Hydrogen Energy 2018, 43, 19636–19649. [Google Scholar] [CrossRef]
- Wang, D.; Wang, Z.; Han, F.; Zhao, F.; Ji, Y. Location optimization of hydrogen refueling stations in hydrogen expressway based on hydrogen supply chain cost. Front. Artif. Intell. Appl. 2021, 341, 368–374. [Google Scholar] [CrossRef]
- Wang, Y.; Decès-Petit, C. Predicting fueling process on hydrogen refueling stations using multi-task machine learning. Int. J. Hydrogen Energy 2020, 45, 32743–32752. [Google Scholar] [CrossRef]
- Alsaadi, N. Comparative analysis and statistical optimization of fuel economy for sustainable vehicle routings. Sustainability 2022, 14, 64. [Google Scholar] [CrossRef]
- Li, M.; Zhang, X.; Li, G. A comparative assessment of battery and fuel cell electric vehicles using a well-to-wheel analysis. Energy 2016, 94, 693–704. [Google Scholar] [CrossRef]
- Saxena, A.; Roychoudhury, I.; Celaya, J.; Saha, B.; Saha, S.; Goebel, K. Requirements Flowdown for Prognostics and Health Management. In Proceedings of the AIAA Infotech at Aerospace Conference and Exhibit 2012, Garden Grove, CA, USA, 19–21 June 2012. [Google Scholar] [CrossRef]
- Kwon, O.; Lee, N.; Shin, B. International Journal of Information Management Data quality management, data usage experience and acquisition intention of big data analytics. Int. J. Inf. Manag. 2014, 34, 387–394. [Google Scholar] [CrossRef]
- National Renewable Energy Laboratory, NREL. 2019. Available online: https://www.nrel.gov/hydrogen/infrastructure-cdps-retail.html (accessed on 10 June 2023).
- Melanie, M.; Bremson, J. Refueling availability for alternative fuel vehicle markets: Sufficient urban station coverage. Energy Policy 2008, 36, 3233–3241. [Google Scholar] [CrossRef]
- George, S.; Jose, A. Generalized Poisson hidden Markov model for overdispersed or under dispersed count data. Rev. Colomb. Estad. 2020, 43, 71–82. [Google Scholar] [CrossRef]
- Transportation Bureau of Statistics (US), Trips by Distance. 2022. Available online: https://data.bts.gov/Research-and-Statistics/Trips-by-Distance/w96p-f2qv (accessed on 10 June 2023).
- Sokele, M.; Moutinho, L.; Hudek, V. Advanced Market Share Modelling Based on Markov Chains; IEEE: Glasgow, Scotland, 2009. [Google Scholar]
- Famoye, F. Count data modeling: Choice between generalized Poisson model and negative binomial model. J. Appl. Statist. Sci. 2014, 14, 99–106. [Google Scholar]
- Cui, Y.; Kim, D.Y.; Zhu, J. On the generalized Poisson regression mixture model for mapping quantitative trait loci with count data. Genetics 2006, 174, 2159–2172. [Google Scholar] [CrossRef]
- Donkers, A.; Yang, D.; Viktorović, M. Influence of driving style, infrastructure, weather and traffic on electric vehicle performance. Transp. Res. D Transp. Environ. 2020, 88, 102569. [Google Scholar] [CrossRef]
- Dabrowski, C.; Hunt, F. Markov Chain Analysis for Large-Scale Grid Systems. Natl. Inst. Stand. Technol. 2009, 52. [Google Scholar]
- Wunderground, New York City, NY Weather History. Available online: https://www.wunderground.com/history/monthly/us/ny/new-york-city/KLGA/date/2019-3 (accessed on 11 June 2022).
- Lin, F.; Liao, X.; Liu, C.-P.; Zhang, Z.-S.; Liu, S.; Yu, D.; Liao, Z.-M. Graphene/ZnO Nanowire/p-GaN Vertical Junction for a High-Performance Nanoscale Light Source. ACS Omega 2020, 5, 4133–4138. [Google Scholar] [CrossRef]
- Kraaij, T.; Baard, J.A.; Arndt, J.; Vhengani, L.; van Wilgen, B.W. An assessment of climate, weather, and fuel factors influencing a large, destructive wildfire in the Knysna region, South Africa. Fire Ecol. 2018, 14, 4. [Google Scholar] [CrossRef]
- Hao, H.; Mu, Z.; Liu, Z.; Zhao, F. Abating transport GHG emissions by hydrogen fuel cell vehicles: Chances for the developing world. Front. Energy 2018, 12, 466–480. [Google Scholar] [CrossRef]
- Shin, J.; Hwang, W.; Choi, H. Can hydrogen fuel vehicles be a sustainable alternative on vehicle market? Comparison of electric and hydrogen fuel cell vehicles. Technol. Forecast Soc. Chang. 2019, 143, 239–248. [Google Scholar] [CrossRef]
- Mahbobi, M.; Tiemann, T.K. Introductory Business Statistics with Interactive Spreadsheets: Using Interactive Microsoft Excel Templates, 1st ed.; BC Campus Open Publishers: Vancouver, BC, Canada, 2015; Available online: https://pressbooks.com (accessed on 7 July 2023).
- Lang, L.; Chen, W.S.; Bakshi, B.R.; Goel, P.K.; Ungarala, S. Bayesian estimation via sequential Monte Carlo sampling-Constrained dynamic systems. Automatica 2007, 43, 1615–1622. [Google Scholar] [CrossRef]


Disclaimer/Publisher’s Note: The statements, opinions and data contained in all publications are solely those of the individual author(s) and contributor(s) and not of MDPI and/or the editor(s). MDPI and/or the editor(s) disclaim responsibility for any injury to people or property resulting from any ideas, methods, instructions or products referred to in the content. |
© 2023 by the authors. Licensee MDPI, Basel, Switzerland. This article is an open access article distributed under the terms and conditions of the Creative Commons Attribution (CC BY) license (https://creativecommons.org/licenses/by/4.0/).