Article

Exploring the Potential of Biomass Pyrolysis for Renewable and Sustainable Energy Production: A Comparative Study of Corn Cob, Vine Rod, and Sunflower

1
Faculty of Mechanical Engineering Skopje, University Ss. Cyril and Methodius, 1000 Skopje, North Macedonia
2
School of Natural Sciences, Faculty of Science and Engineering, Macquarie University, Sydney, NSW 2109, Australia
3
CSIRO, Research Way, Clayton, VIC 3168, Australia
*
Author to whom correspondence should be addressed.
Sustainability 2023, 15(18), 13552; https://doi.org/10.3390/su151813552
Submission received: 31 July 2023 / Revised: 5 September 2023 / Accepted: 5 September 2023 / Published: 11 September 2023
(This article belongs to the Special Issue Sustainable Energy Management and Transformation)

Abstract

:
The paper investigates the potential of biomass pyrolysis as a sustainable and renewable energy solution. The study focuses on three biomass types: corn cob, vine rod, and sunflower, which are abundant agricultural residues with potential for biofuel production. The pyrolytic gas, oil, and char produced during pyrolysis at a heating rate of 10 °C/min were analyzed. At the pyrolysis temperature of 500 °C, the corn cob showed the smallest final residual mass of 24%, while the vine rod exhibited the largest mass loss of 40%. Gas analysis revealed the concentrations of CO2, CO, H2, and CH4 in the pyrolytic gas, indicating its energy potential. Sunflower presented the largest calorific value of the produced biogas, while corn cob was the lowest. The chemical composition of the bio-oils was determined, with aliphatic acids identified as the dominant compounds, suggesting their potential for biodiesel production. Fourier Transform–Infrared Spectroscopy (FT-IR) analysis of raw biomass and char products demonstrated varying extents of decomposition among the biomass samples. A multicriteria assessment approach was employed to evaluate the differences between the selected three biomass feedstock and determined that sunflower biomass ranked the highest among the three, although the overall difference was small, confirming the suitability of all three biomass samples for pyrolysis conversion to higher-value-added fuels.

1. Introduction

With accelerated energy demands and environmental concerns, there is a growing need for the adoption of a wider range of renewable energy sources. Climate change, identified as the greatest threat to humanity, stems from a systemic issue intertwined with global population growth and the escalating consumption of fossil fuel-based energy. The scientific community directly links fossil fuel use with intensified greenhouse gas (GHG) emissions, which have caused irreversible alterations in the Earth’s climate, leading to global warming.
Hoechek et al. [1] overviewed the renewable energy capacities and proposed that a complete substitution of fossil fuels with renewable energy by 2050 may be conceivable; however, achieving this goal will necessitate vigorous implementation of all renewable energy sources, with substantial and close international collaboration. The worldwide energy demands in both developed and developing countries require the adoption of more sustainable energy alternatives to conventional electricity generation technologies [2]. Conventional energy sources have engendered significant environmental challenges related to global warming and climate change, as well as the exponential rise in GHG emissions resulting from power generation [3,4].
Consequently, renewable energy sources, including solar, wind, hydropower, biomass, and geothermal, as well as the energy carriers produced from these sources, such as renewable hydrogen, have emerged as viable alternatives to mitigate the current environmental crisis as they demonstrate sustainable electricity production solutions [5]. Extensive research has explored and compared various hybrid renewable energy technologies to enhance overall electricity generation performance, while providing recommendations to address the economic, technical, and energy conversion efficiency challenges [6]. The environmentally friendly attributes of renewable energy technologies, coupled with their capacity to generate power while minimizing air pollutant emissions, have spurred increasing efforts and advocacy for clean environments [7]. As a result, renewable energy sources have gained escalating attention and recognition as a promising solution to meet energy demands while addressing the imperative need for environmental sustainability. There is a substantial increase in renewable energy penetration in the energy market, although its share remains smaller compared to fossil fuel resources [8]. According to the International Energy Agency (IEA) [9], there has been a notable decrease in the demand for fossil fuel use in electricity generation since 2019, coinciding with the increasing utilization of renewable energy to meet global energy needs.
Bioenergy, as a form of energy derived from biomass through conventional or modern approaches, is an appealing renewable energy source to supply energy for heating, transport, and electricity sectors while promoting environmental sustainability [10,11]. Another benefit of biomass is when CO2 is released from its use, it is of biogenic origin, which is not accounted for in GHG emission estimates because it releases the same amount of CO2 that has been originally fixed from the atmosphere during the life cycle of the biomass. Currently, bioenergy supplies approximately 24 EJ of energy, making it the largest renewable energy source today corresponding to approximately 10% of the world’s energy [12]. Bioenergy is expected to have a substantial role in transitioning the world to a carbon net-zero economy by 2050, with projections for the bioenergy supply of up to 313 EJ by 2050, or 37% of the world’s energy demand [13]. Thermochemical and biochemical conversion technologies enable the transformation of biomass into high-value-added fuels and chemicals [14]. Biomass encompasses a diverse array of renewable biological resources, including crop residues, wood and forestry residues, municipal solid wastes, spent coffee grounds, and other energy crops, which can be utilized for the generation of biohydrogen and biofuels [15]. Traditional bioenergy use is associated with the application of fuelwood, charcoal, crop or animal wastes in cooking or heat supply. Modern bioenergy applications, however, involve process heat, electricity supply, or the production of biofuels through thermal conversion technologies, such as gasification, combustion, or pyrolysis [16,17].
Pyrolysis is a technology in which organic biomass is thermally treated in the absence of oxygen and converted to a mixture of gases, liquids, and solid biofuels, generally taking place at atmospheric pressure and temperatures ranging from 300 to 700 °C and above [18]. Vuppaladadiyam et al. [19] highlighted that pyrolysis offers a sustainable pathway for converting waste biomass into valuable products, emphasizing the need for a better understanding of pyrolysis to optimize processes, scale up operations, and reduce costs, ultimately advocating for the widespread adoption of biomass pyrolysis as an economically viable technology applicable to diverse feedstocks. Various studies on the characterization of biomass were carried out in the past. Pyrolysis was presented as an efficient method for converting heavy metal-contaminated biomass obtained through phytoremediation into valuable products, therefore enhancing the sustainability of phytoremediation practices [20]. The properties of the pyrolytic products, their analysis methods, and the effects of the pyrolysis parameters were considered by Kan et al. [21]. Ioannidou et al. [22] explored the potential applications of corn residues for energy, fuel, materials, and chemical production according to thermochemical treatments by non-catalytic and catalytic pyrolysis in two reactor configurations. The sunflower waste was previously used for the production of bioenergy and liquid biofuels under pyrolysis conditions [23]. A thermogravimetric study on sunflower oil was further applied, confirming that the raw material has the properties for biodiesel production [24]. Thermogravimetry and differential scanning calorimetry were used to explore samples of thermal behavior under slow pyrolysis conditions [25]. Slow pyrolysis produces high biochar yields at the expense of lower liquid yields, while fast pyrolysis is used to maximize the production of bio-oils. Commonly used biomass types for pyrolysis technology include wood and wood residues [26], agricultural crops, such as corn straw and rice husks [27], sunflower as an oilseed crop [28], as well as animal and agricultural residues [29]. Grapes are one of the world’s largest fruit crops with vine rods generated as wastes, which have potential for use in bioenergy production [30]. The application of corn residues for energy, fuel, materials, and chemical production was investigated based on their thermochemical treatment product yields and quality, and it was found that corn cob can be used to produce solid and gaseous biofuels. It can also be a viable material for activated carbon production after activation or gasification with steam [31].
The design of efficient pyrolysis systems requires an understanding of the pyrolysis process and processing parameters, such as biomass feedstock and the effect of temperature, on product distribution. There is a need to evaluate the quality of the feedstock to be able to determine the best value in use for bioenergy production. There have been multiple analytical techniques applied for the evaluation of biofuel production distribution, including hyphenated thermo-analytical techniques, such as TG-MS, TG-FT-IR, and other methods [32]. However, the use of analytical techniques to determine the feedstock quality and evaluate biomass’ most effective use has not been sufficiently evaluated in the past.
The objectives of this research are to study the thermal behavior and characterize the pyrolysis products of three commonly available biomass materials, namely corn cob, vine rod, and sunflower, under slow pyrolysis conditions and to determine the relative quality of each biomass for the type of biofuel production. These agricultural residues hold significance due to their widespread availability, based on the global production of crops, namely corn cob as waste from cereal crops with one third of the total crop production, sunflower from oil crops with 12% production, and vine rod from the fruit with 10% production [33]. These residues are by-products of agricultural food production and, hence, can complement the food production industry to improve the overall sustainability of the agricultural sector. The investigation entails analyzing the pyrolysis behavior, organic fraction loss, and identification of different compounds, and then applying a multicriteria assessment for evaluation of their quality. The obtained findings will serve as valuable reference information for harnessing energy and producing fuel through the pyrolysis of agricultural biomass.

2. Materials and Methods

Three biomass feedstock materials were selected for this study, which comprised of corn cob, vine rod, and waste from sunflower. The selection of these agricultural residues was conducted because of their availability and abundance [34].
Before starting with the experimental analysis, the samples underwent a 2-h vacuum drying process at 80 °C. The proximate analysis of each sample was conducted following the ASTM D7582 [35] test methods with results shown in Table 1. Consequently, the proximate analysis revealed the composition of moisture, volatile matter, ash, and fixed carbon for each biomass sample. The measurement procedure was organized into a sequence of three stages. Initially, the sample underwent heating from 25 °C to 110 °C, facilitated by a heating rate of 10 °C/min. Subsequently, the sample was maintained at 110 °C for a span of 5 min. Throughout the test, nitrogen was employed as the carrier gas, flowing at a rate of 50 mL/min. The temperature was then progressively raised from 110 °C to 900 °C, with a heating rate of 50 °C/min. The sample was held at this temperature for 15 min. Finally, the nitrogen atmosphere was exchanged with air, with a flow rate of 50 mL/min. During this phase, the sample was held at a temperature of 900 °C for a duration of 10 min.
The results in Table 1 show that all samples had high volatile matter and fixed carbon contents in the range of 69% to 80% and 15% to 23%, respectively. Sunflower showed the largest ash content of 8.3%, compared to 1.7% for corn cob, while vine rod had the largest fixed carbon content of 22.7%. Examining the work of Adilaih et al. [36], a comparison was drawn among multiple studies regarding proximate analysis. The results of the corn cob in this investigation displayed similarities, albeit with a slightly higher moisture content of around 7%. In a similar vein, the research conducted by Putun et al. [37] explored the yields and compositions of products from sunflower pyrolysis. These findings closely resembled the results obtained from the proximate analysis carried out on the sunflower samples in the current study.

2.1. Thermogravimetric Analysis (TGA)

TGA was performed to evaluate the weight loss of the samples during heating under inert conditions. TGA/DSC 1 STARe System from Mettler Toledo was used for the TGA analysis. Approximately 10 to 40 mg of biomass sample was used for the TGA tests and heated under nitrogen carrier gas with a nitrogen flow of 20 mL/min at a heating rate of 10 °C/min from room temperature to 800 °C. The mass loss data were differentiated versus temperature to determine the differential thermogravimetric curves to better understand the different temperature ranges of reaction activity of the biomass samples.

2.2. Gas Chromatographic (GC) Analysis

GC analysis was performed to measure the gaseous products that evolved during pyrolysis. A fixed-bed reactor consisting of an infrared furnace [38] under an ultra-high-purity helium atmosphere was used to pyrolyze each of the samples. The samples with 100 mg mass were loaded in a quartz tube and heated from room temperature to 800 °C. The gases that evolved during pyrolysis were analyzed using a micro gas chromatograph (model M200 from MTI Analytical Instruments, Poway, CA, USA) equipped with two thermal conductivity detectors. The molecular sieve 5A column at 60 °C was used to determine hydrogen and carbon monoxide evolution, while a Paraplot U column maintained at 40 °C was employed for detecting carbon dioxide, methane, ethane, and ethylene. The total gas yield and individual gas components were calculated by integrating the measured gas evolution rates over time.

2.3. Gas Chromatography-Mass Spectrometry (GS-MS) Analysis

The bio-oil samples evolved during pyrolysis of each biomass sample were heated to 500 °C at 10 °C/min under helium gas in the infrared furnace and were condensed on a quartz wool positioned at the end of the reactor tube. The bio-oils were dissolved with dichloromethane (DCM) to extract the pyrolysis oil components and then subjected to derivatization. The pyrolysis oils were analyzed using a GC-MS system consisting of a gas chromatograph (Agilent 7890B, Santa Clara, CA, USA) coupled with a mass spectrometer (Agilent 5977A MS). The GC system was equipped with an HP-5MS column (60 m × 0.25 µm) for compound separation. The oven temperature was initially set to 40 °C for 2 min, then heated up to 310 °C at a rate of 2 °C/min and held at the same temperature for 30 min. The quantification of the bio-oil compounds was conducted based on the calculated peak areas from the total ion current. As recommended by Staš et al. [39], this type of quantification is acceptable when the bio-oils are produced under the same pyrolysis process and analyzed under the same analytical conditions. The amount of bio-oils was calculated as a difference between the total weight of the sample and the sum of the weights of the gas products and the char from the TGA analysis.

2.4. Fourier Transform–Infrared Spectroscopy

The produced biochar samples from pyrolysis at 500 °C were subjected to FT-IR analysis. The initial raw samples of corn cob, vine rod, and sunflower were heated to 500 °C in nitrogen to generate the biochar. FT-IR spectra were obtained using a Nicolet 6700 FT-IR spectrometer (Waltham, MA, USA) equipped with an attenuated total reflectance accessory. The analysis involved 32 scans with a spectral resolution of 4 cm−1. The acquired data were graphically analyzed to identify the functional groups present in the raw samples and the resulting chars after pyrolysis.

2.5. Multicriteria Analysis of the Biomass Quality

A multicriteria assessment was conducted to assess the relative quality of the biomass samples to establish a method for the selection of the most suitable biomass candidates for the pyrolysis process. The selected biomass samples were assessed based on three parameters: (1) the amount of biochar produced at 500 °C, considering that biochar is a desirable product of pyrolysis; (2) the calorific value of the produced biogas at temperatures of up to 500 °C and (3) the value of the compounds present in the bio-oils produced at 500 °C at relative concentrations above 1%. Considering the bio-oils are composed of a wide range of compounds, they are not suitable for direct use, but are suitable for the production of biofuels, phenols, carboxylic acids, furfural, and aromatic hydrocarbons, depending on their composition and processing methods [40]. The market value of each compound present in the bio-oils was assessed using Jaggaer Chemical Inventory Management software 23.1.0. The cost of each compound was assessed based on the cheapest value of the lowest purity available in the software for all compounds, except for 2-hydroxycyclohexane-1-carboxylic acid and hexanoic acid, 3-hydroxyl-, which were not available in this system, and the values for these two compounds were found in [41].
The biomass sample with the highest value in each of the selected criteria was assigned a value of 1, while the other samples were related to this value based on the relative difference in the criteria. The sum of each of the three criteria gave a multicriteria score of the maximum of 3 with the biomass sample exhibiting the highest score demonstrating the most desirable pyrolysis properties.

3. Results and Discussions

3.1. Mass Change during Pyrolysis Using TGA

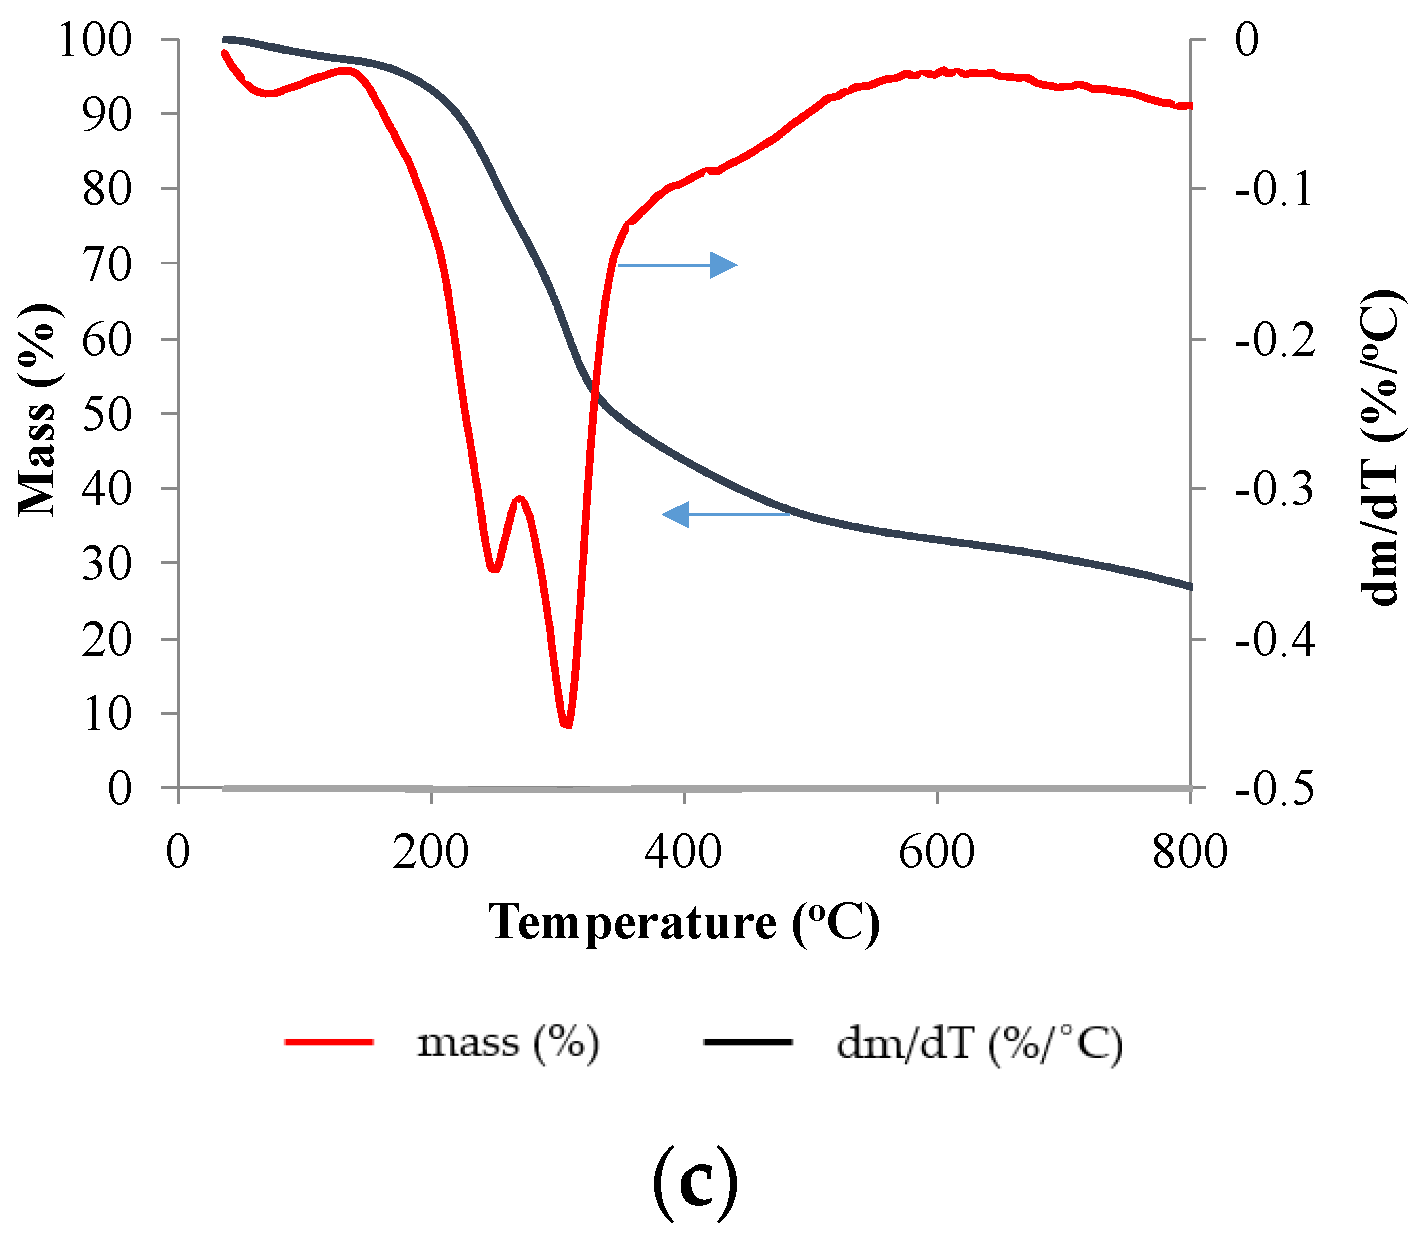
The changes in sample mass during pyrolysis, as determined by the TGA, are presented in Figure 1. The primary mass degradation occurred between 200 °C and 450 °C, indicating the decomposition of organic matter. At 500 °C, corn cob showed the highest degradation with a residual mass content of 24%, followed by sunflower with 36% and vine rod with 40% residual mass content. The corn cob char yield at 500 °C determined in this study was in the similar range to 22.1–22.5% reported by Ceranic et al. [42], who revealed that the char yield of corn cob depends on the biomass particle size, with the larger particle sizes producing a larger fraction of biochar. The sunflower in the current work produced higher biochar yield and lower pyrolysis conversion rates compared to sunflower bagasse [43] and sunflower stalks [44], which were reported at 28% char yield at 520 °C, and 25% char yield at 540 °C, respectively. Vine rod in the current work showed higher char production rates at 500 °C compared to the work by Suárez et al. [45] who produced 35% biochar rates at the same temperature, which significantly reduced to 20% when the biomass was leached with distilled water before pyrolysis.
The differential thermogravimetric curves in the current work revealed three distinct regions of pyrolysis. The first region involved the evaporation of absorbed water in the samples. The second region, spanning between 200 °C and 400 °C, exhibited the highest mass loss and the release of most volatiles, with two peaks representing the degradation of hemicellulose and cellulose. The third region, starting at 400 °C, displayed continuous degradation with a low mass loss rate, associated with lignin decomposition.
The mass loss curves of the three biomass samples exhibited similarities, with approximately 10% to 15% weight reduction observed between 400 °C and 800 °C. The corn cob showed the smallest final residual mass of 20.4%, while the vine rod exhibited the largest mass loss of 33.5%. The mass loss curves can be correlated with the findings from the proximate analysis, as depicted in Table 1. When examining the results of the proximate analysis for the three biomass samples, it becomes evident that the vine rod exhibits the highest concentration of fixed carbon at 22.71% and the lowest amount of volatile matter at 69.33%. Similarly, the sunflower displays fixed carbon and ash percentages of 16.71% and 8.3%, respectively, resulting in a final residual mass of 24.3%. Finally, the corn cob shows the lowest fixed carbon content along with the highest amount of volatile matter, culminating in the smallest final residual mass of 20.4%.
The differential thermogravimetric curves of vine rod and sunflower displayed similar behavior, characterized by two troughs in the rate of weight loss. In contrast, the corn cob exhibited three troughs within the temperature range between 200 °C and 400 °C, indicating a different decomposition behavior associated with hemicellulose, as it is one of the major components of the plant cell walls of corn cobs, composed of various sugars. The presence of three distinct troughs within the specified temperature range suggests that the decomposition behavior of the corn cob is not uniform throughout the whole process, showing the complex interaction of several components. The first trough occurs at a lower temperature, corresponding to the removal of moisture and other volatile compounds, causing a reduction in mass. The second trough shows degradation of hemicellulose, where it undergoes depolymerization and breaks down into smaller sugar units. This results in the release of volatile organic compounds and a further reduction in mass. The third trough occurring at a higher temperature range shows the degradation of other complex compounds, lignin, and cellulose, contributing to the final mass loss observed in the TGA curve.

3.2. Gas Analysis Results from Pyrolysis of Corn Cob, Vine Rod and Sunflower

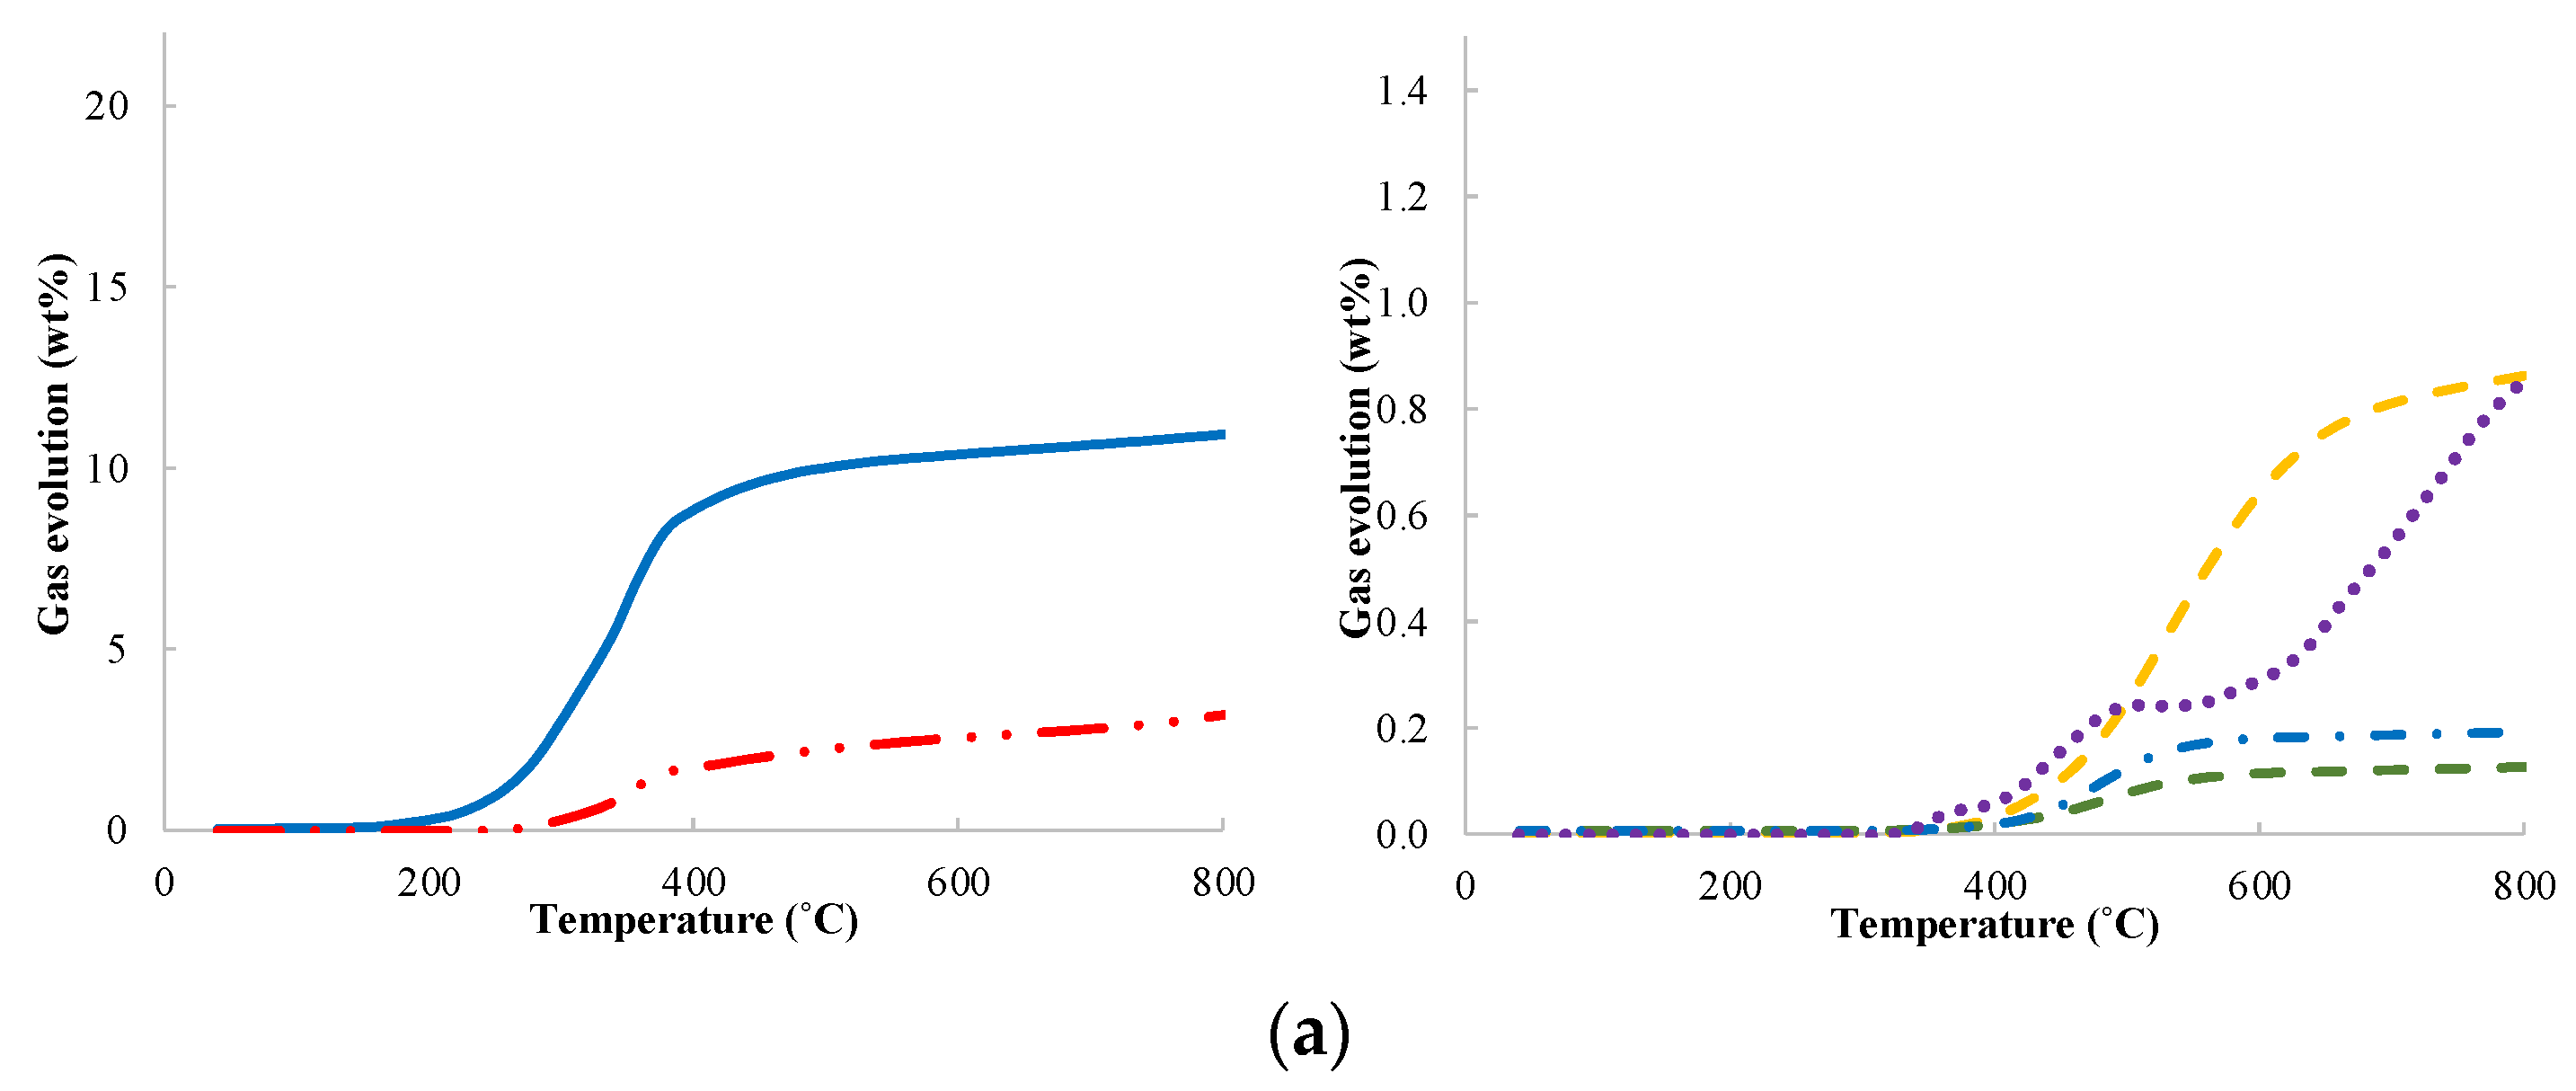
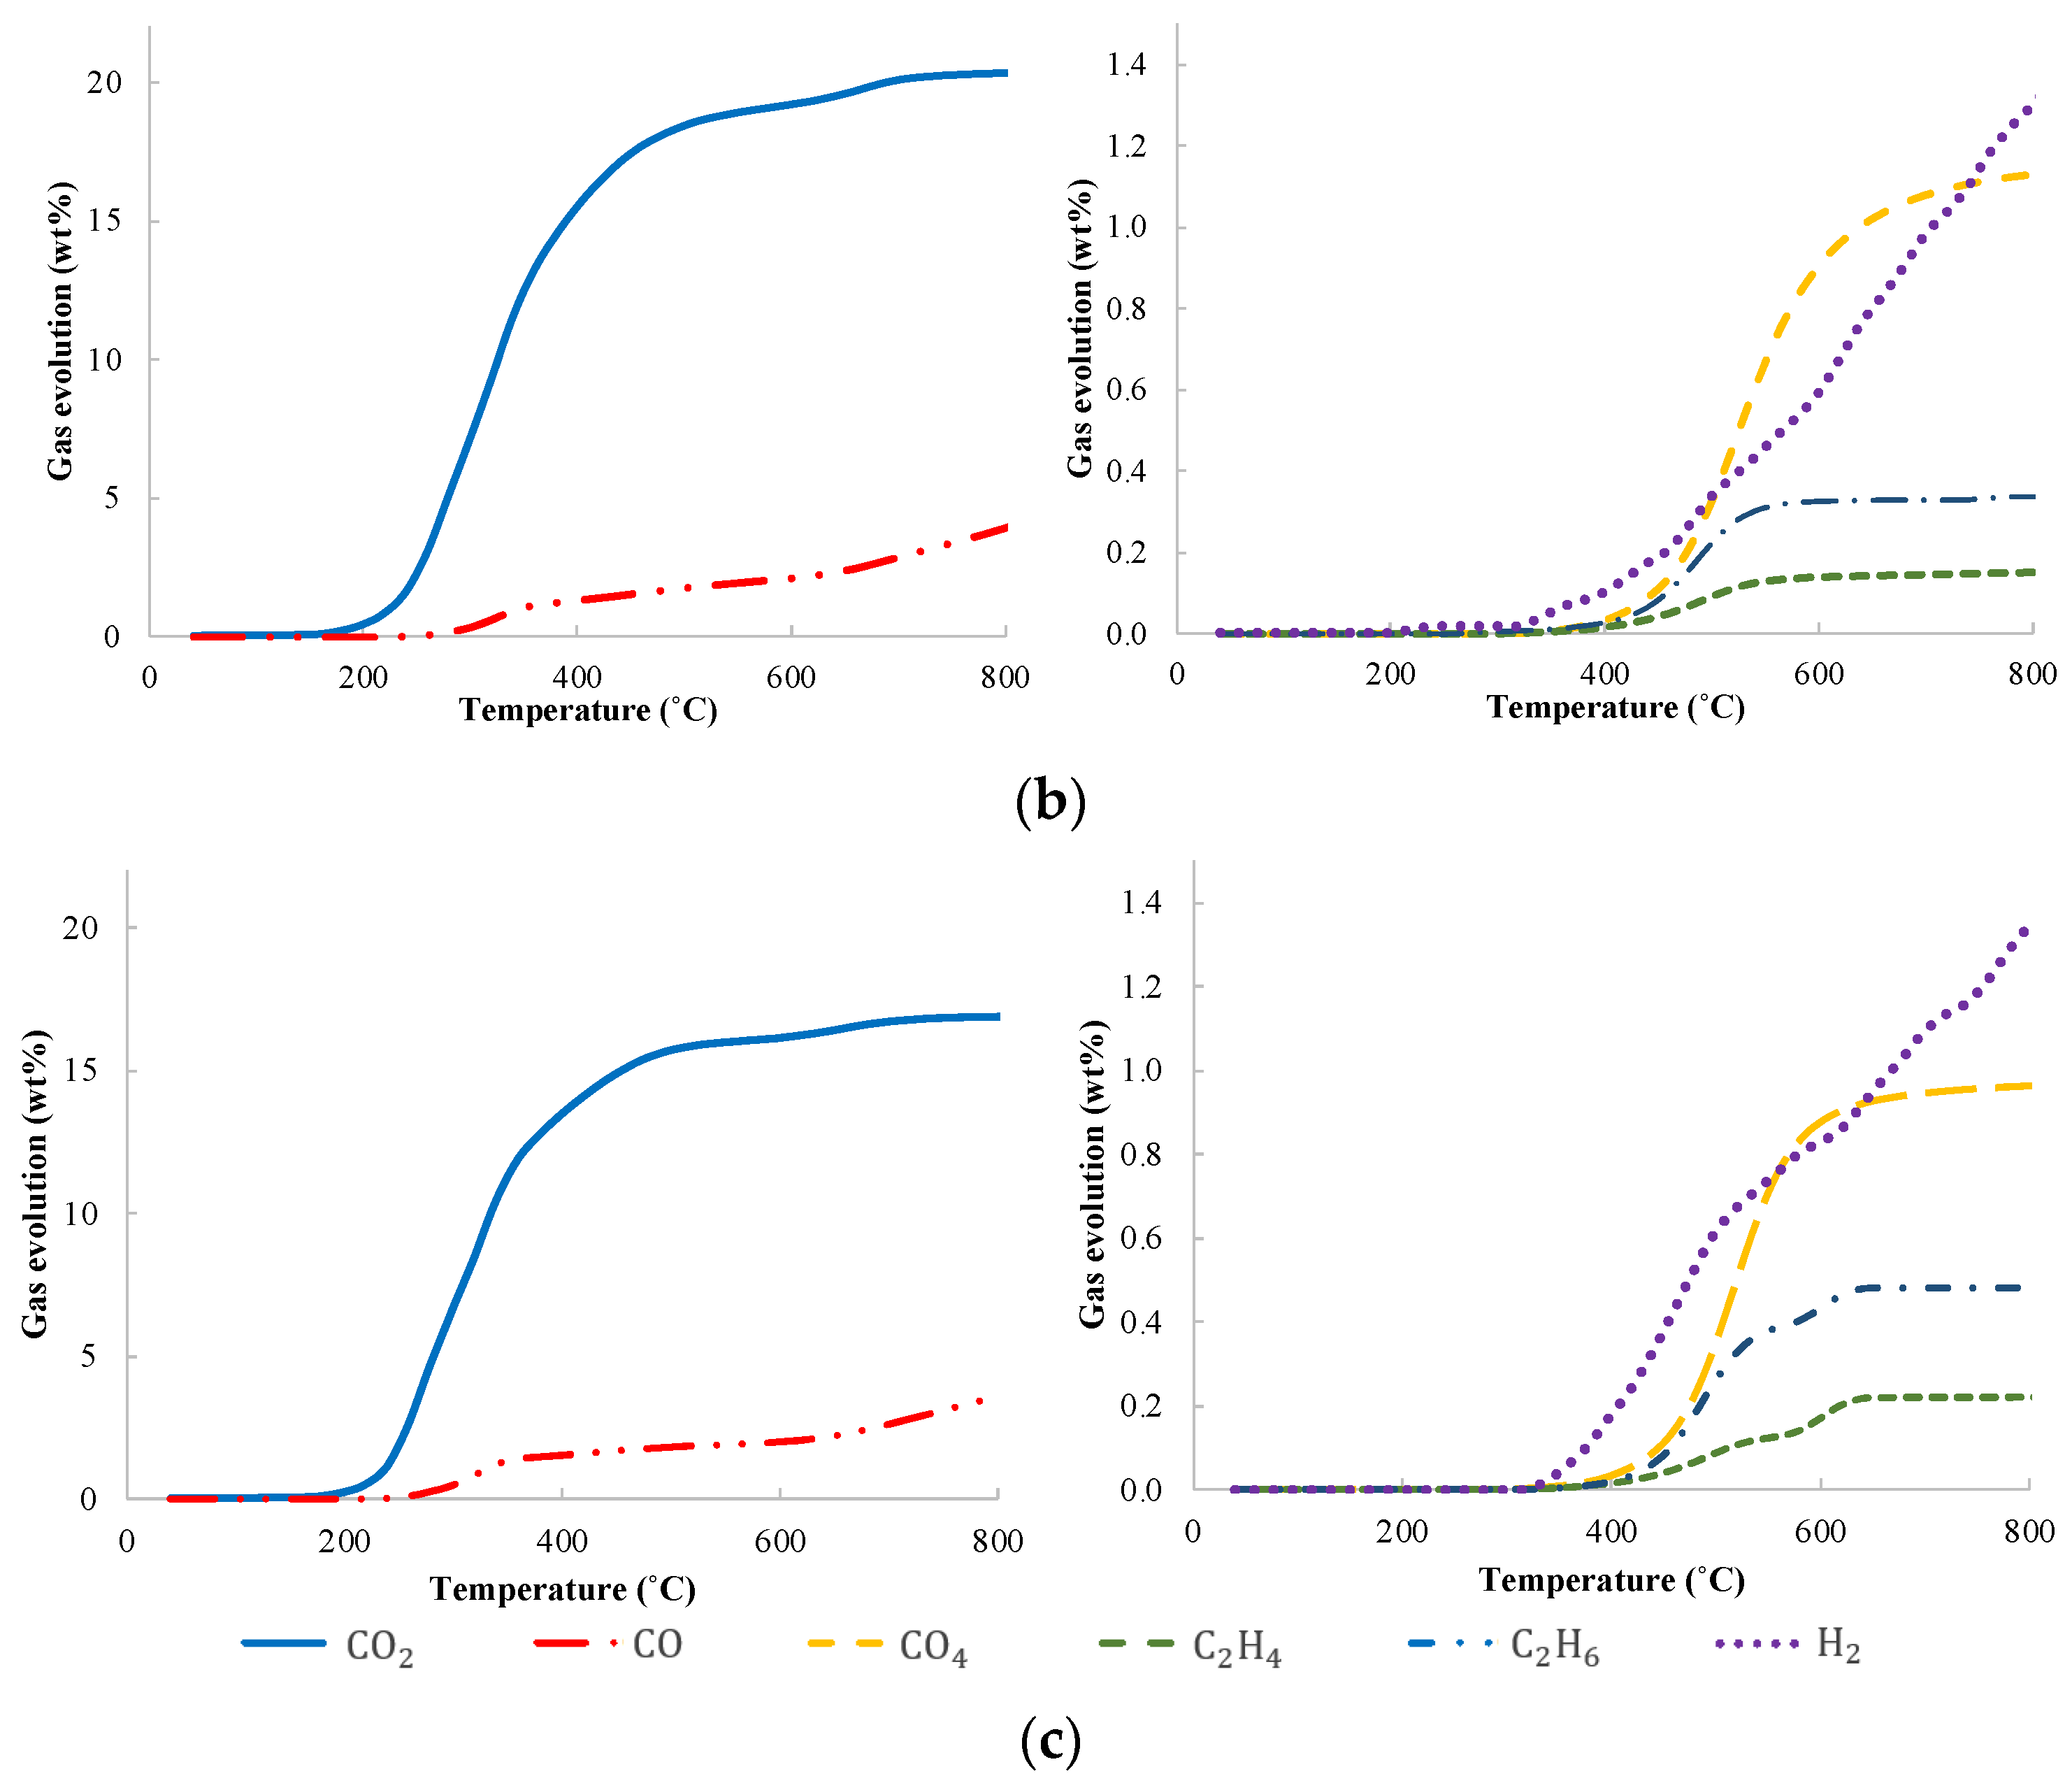
The gas analysis for the three analyzed biomass samples is shown in Figure 2. The main components of the pyrolysis gas across all samples were carbon oxides (CO and CO2), with concentrations ranging between 10% and 18% for CO2 at 500 °C, and 1.76% and 2.23% for CO. Carbon dioxide and carbon monoxide predominantly arise from the degradation and transformation of carbonyl (C=O) and carboxyl (COOH) functional groups. Methane primarily originates from cracking of the methyl (-CH3), methoxyl (-O-CH3), and methylene (-CH2-) functional groups [46], with methane concentrations ranging from 0.25% to 0.34% at 500 °C in the examined samples. The presence of hydrogen is attributed to the breaking of the different C-H functional groups. Among the samples, vine rod exhibited the highest quantity of biogas at 21.2%, followed by sunflower with 18.8%, while corn cob yielded the lowest amount of biogas at 12.3%. The observed higher mass loss in the vine rod samples correlates positively with a greater amount of biogas production. This implies that the pyrolysis process for vine rod generates a higher quantity of gas products, likely due to the breakdown of organic compounds. This result underscores the potential of vine rod as a feedstock for bioenergy production.

3.3. Analysis of Organic Compounds in Pyrolysis Oils of Corn Cob, Vine Rod, and Sunflower

The investigation of organic compounds present in the pyrolysis oils at 500 °C was carried out using GC-MS. The results for the compounds present in relative amounts above 1% are shown in Table 2, Table 3 and Table 4 for corn cob, vine rod, and sunflower, respectively, revealing that most compounds contain oxygen.
In the case of corn cob, the most abundant compounds were found to be catechol (4.80%), 9-octadecenoic acid, (E)-(4.60%), palmitic acid (4.51%) and 2-hydroxycyclohexane-1-carboxylic acid (3.75%). For vine rod, the existing compounds with significant percentages were catechol (9.15%), 4-methylcatechol (5.74%), and 3-pyridinol (4.13%). Similarly, for sunflower, the compounds with the highest percentages were identified as isoprimaric acid (9.23%), albietic acid (4.93%), and palmitic acid (4.86%). The results confirm a similar chemical composition of the bio-oils from the selected biomass types compared to other studies [47,48], indicating high concentrations of acids. The higher catechol content in the vine rod samples could be indicative of its chemical composition, as certain compounds tend to yield specific by-products during pyrolysis. The presence of catechol might contribute to the observed trends in biogas production and mass loss, linking chemical properties to pyrolysis outcomes.
The overall observation suggests that the bio-oils derived from corn cob, vine rod, and sunflower possess potential for further utilization. However, due to the elevated presence of acids, it is recommended to implement additional processing techniques to reduce the oxygen content.

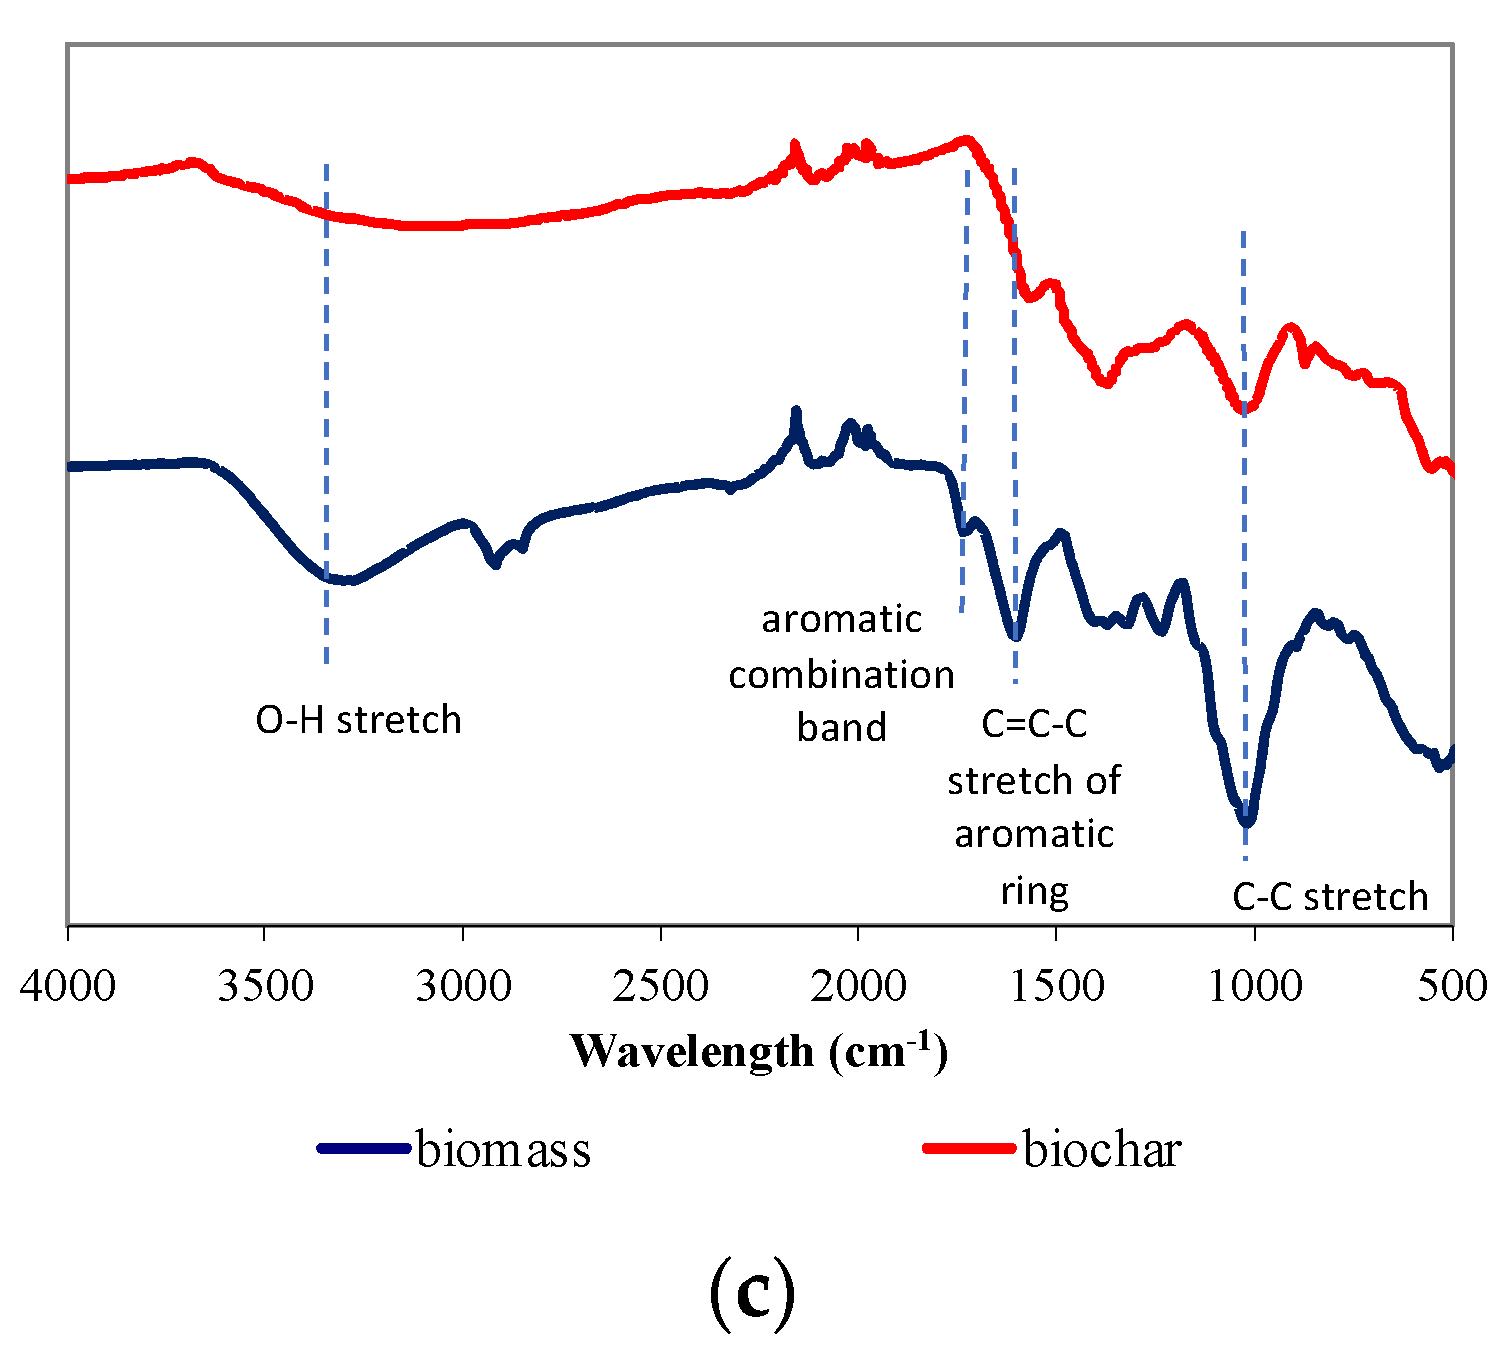
3.4. FT-IR Spectroscopic Analysis of Raw Biomass and Char Products at 500 °C

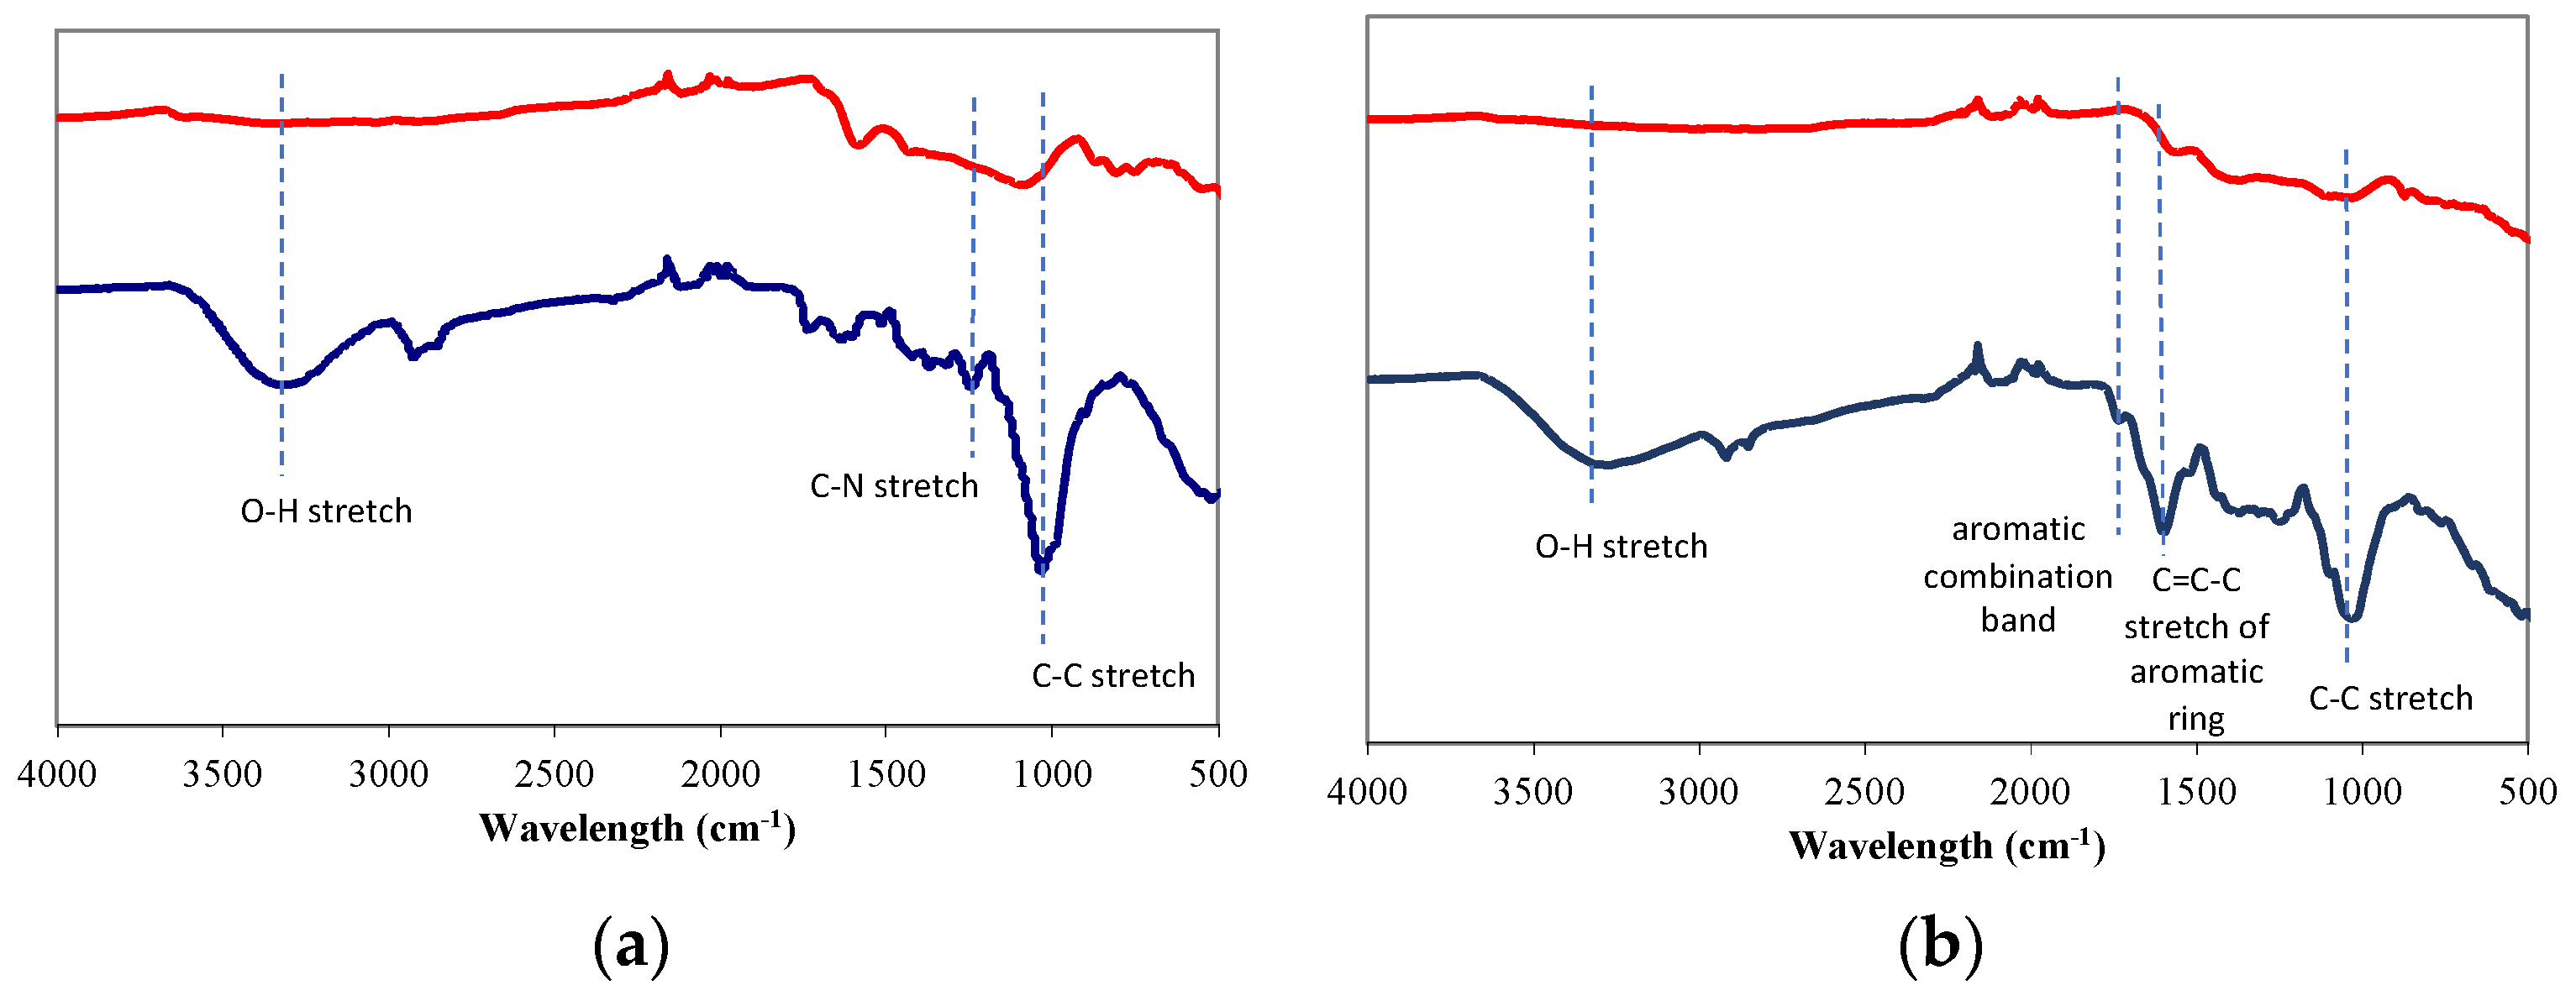
Figure 3 illustrates the FT-IR Spectroscopic data comparing the raw biomass and their corresponding char products generated at 500 °C. In Figure 3a, the FT-IR spectra of corn cob demonstrate notably lower transmittance intensity of functional groups in the biochar compared to the raw corn cob, particularly in the range of 500 cm−1 to 1750 cm−1. Similar trends are also noticed for the other two samples, as shown in Figure 3b,c. For all three samples, the IR peak at approximately 1000 cm−1 signifies the C-C stretch related to skeletal vibrations [49], while the broad peak at around 3300 cm−1 corresponds to the O-H normal ‘polymeric’ stretch. In the case of the raw corn cob, the small peak at 1250 cm−1 arises from the C-N functional group, indicating the presence of an aromatic secondary amine and representing CN stretch. For the raw vine rod and sunflower, the IR peak at 1700 cm−1 signifies the aromatic combination bands. The peak at around 1600 cm−1 observed in both sunflower and vine rod corresponds to the C=C-C functional group, indicating the stretch of an aromatic ring. The disappearance and reduction of these functional groups at temperatures above 500 °C indicate the decomposition of these chemical structures.

3.5. Multicriteria Assessment of the Biomass Samples

The quality of the biomass samples was evaluated using the multicriteria assessment approach with values presented in Table 5 for the three selected criteria.
Table 6 presents the multicriteria scores for each of the biomass samples in which the biomass with the highest value was assigned a score of 1, while the other samples had a score relative to their values compared to the highest achieved in this study. The vine rod achieved the highest char yield at 500 °C of 41.29% and was assigned a score of 1 for this criterion. The sunflower sample had the second highest char yield at 36.35% with the corn cob showing the lowest char yield. The sunflower presented the highest quality of the gas with the largest calorific value at 1.38 MJ/kg of biomass. The corn cob presented the highest values of the bio-oil compounds, followed by the sunflower. The results showed that each biomass source achieved the highest score in one of the selected criteria and, as a result, showed a similar range of the multicriteria scores between 1.9 for vine rod to 2.4 for sunflower biomass. Although the sunflower showed the highest multicriteria score across the three biomass sources, the difference between the three samples is small demonstrating that all three samples are suitable candidates for pyrolysis, although each of them presents different values across the three products of pyrolysis.
When comparing other biomass sources to the selected three using the proposed multicriteria approach, mallee tree, and wheat straw produced comparable biochar yields of 35.6% and 32.2% at 500 °C, respectively [50], to the sunflower biomass in the current work. However, the calorific value of the biogas produced from the pyrolysis of the mallee tree and what straw at 500 °C under similar pyrolysis conditions were estimated at 5.5 MJ/kg and 5.1 MJ/kg, respectively, which are significantly larger than the selected three biomass samples. The selected biomass samples are comparable to paper sludge biomass which produced 36% of solid char and biogas with a calorific value of 1.2 MJ/kg [51].

4. Conclusions

The three biomass materials, corn cob, vine rod, and sunflower, were subjected to pyrolysis experiments using several methods to study the thermal behavior and characterize the energy potential of their pyrolysis products. Overall, the results from the experiments confirmed the suitability of the biomass samples for biofuel generation. The observed trends of mass loss, biogas production, residual mass, and chemical content indicate a complex relationship between the three biomass compositions and their behavior during pyrolysis. This knowledge is important for designing efficient pyrolysis processes and selecting suitable biomass feedstocks for sustainable energy generation.
The gaseous products of pyrolysis were evaluated using GC. The oxides of carbon, CO2 and CO, as well as H2 and CH4 were the primary gas species in the gas product, indicating the energy potential of the pyrolytic gas. Efficient collection of the biogas is essential to ensure high energy production at minimized release and pollution to the environment. The chemical compounds present in the bio-oil products of pyrolysis with their relevant contents were identified. Catechol and isoprimaric acids were identified as the dominant compounds in the bio-oils.
The multicriteria assessment approach was applied to assess the differences between the biomass samples based on three parameters: the amount of biochar produced at 500 °C, the calorific value of the produced gas at temperatures of up to 500 °C and the value of the compounds present in the bio-oils produced at 500 °C at relative concentrations above 1%. While sunflower biomass exhibited the highest ranking among the three, it is noted that all three biomass samples demonstrated the potential for sustainable energy production. The obtained data provide important reference information on the opportunities for energy and fuel generation from the pyrolysis of the analyzed biomass. Although biofuel production through pyrolysis is still hindered by high production costs and lower competitiveness when compared to fossil-based fuels [52], improving the techno-economic viability of the technology can be achieved through the production of higher-value petrochemical products, including hydrogen, and integrating pyrolysis with solar power systems [53]. The market growth for energy consumption of biofuels is projected to grow from 4 EJ in 2021 to 11 EJ by 2050, while for solid bioenergy from 11 to 16 EJ [12]. Changes in government policies, such as targeted feed-in tariff policies, carbon accounting [54], and mandatory renewable energy targets [55] can accelerate the energy transformation, especially considering the 8% projected decline in world energy demand by 2050 due to increased energy efficiency and behavioral change [56].

Author Contributions

Conceptualization, S.D., V.S. and R.V.F.; methodology, S.D. and V.S.; software, T.K.; validation, V.S. and T.K.; formal analysis, S.D., V.S. and T.K.; investigation, S.D. and T.K.; resources, V.S.; data curation, S.D. and T.K.; writing—original draft preparation, S.D.; writing—review and editing, V.S., R.V.F. and T.K.; visualization, S.D. and V.S.; supervision, V.S. and R.V.F.; funding acquisition, V.S. All authors have read and agreed to the published version of the manuscript.

Funding

The research received no external funding.

Institutional Review Board Statement

Not applicable.

Informed Consent Statement

Not applicable.

Data Availability Statement

Not applicable.

Conflicts of Interest

The authors declare no conflict of interest.

References

  1. Holechek, J.L.; Geli, H.M.E.; Sawalhah, M.N.; Valdez, R. A global assessment: Can renewable energy replace fossil fuels by 2050? Sustainability 2022, 14, 4792. [Google Scholar] [CrossRef]
  2. Rizzi, F.; van Eck, N.J.; Frey, M. The production of scientific knowledge on renewable energies: Worldwide trends, dynamics and challenges and implications for management. Renew. Energy 2014, 62, 657–671. [Google Scholar] [CrossRef]
  3. Kumar, M. Social, economic, and environmental impacts of renewable energy resources. In Wind Solar Hybrid Renewable Energy System; IntechOpen: London, UK, 2020; Volume 1. [Google Scholar]
  4. Khan, A.A.; Khan, S.U.; Ali, M.A.S.; Safi, A.; Gao, Y.; Luo, J. Identifying impact of international trade and renewable energy consumption on environmental quality improvement and their role in global warming. Environ. Sci. Pollut. Res. 2022, 29, 33935–33944. [Google Scholar] [CrossRef] [PubMed]
  5. Levenda, A.M.; Behrsin, I.; Disano, F. Renewable energy for whom? A global systematic review of the environmental justice implications of renewable energy technologies. Energy Res. Soc. Sci. 2021, 71, 101837. [Google Scholar] [CrossRef]
  6. Ang, T.Z.; Salem, M.; Kamarol, M.; Das, H.S.; Nazari, M.A.; Prabaharan, N. A comprehensive study of renewable energy sources: Classifications, challenges and suggestions. Energy Strategy Rev. 2022, 43, 100939. [Google Scholar] [CrossRef]
  7. Anser, M.K.; Shabbir, M.S.; Tabash, M.I.; Shah, S.H.A.; Ahmad, M.; Peng, M.Y.P.; Lopez, L.B. Do renewable energy sources improve clean environmental-economic growth? Empirical investigation from South Asian economies. Energy Explor. Exploit. 2021, 39, 1491–1514. [Google Scholar] [CrossRef]
  8. Jaiswal, K.K.; Chowdhury, C.R.; Yadav, D.; Verma, R.; Dutta, S.; Jaiswal, K.S.; Karuppasamy, K.S.K. Renewable and sustainable clean energy development and impact on social, economic, and environmental health. Energy Nexus 2022, 7, 100118. [Google Scholar] [CrossRef]
  9. International Energy Agency. Renewable Energy Market Update, Outlook for 2022 and 2023; Official Report; International Energy Agency: Paris, France, 2022. [Google Scholar]
  10. Belyakov, N. Sustainable Power Generation. In Current Status, Future Challenges, and Perspectives; Academic Press: Cambridge, MA, USA, 2019; pp. 417–438. [Google Scholar]
  11. Pishvaee, M.S.; Mohseni, S.; Bairamzadeh, S. Biomass to Biofuel Supply Chain Design and Planning Under Uncertainty: Concepts and Quantitative Methods; Academic Press: Cambridge, MA, USA, 2020. [Google Scholar]
  12. International Energy Agency. IEA World Energy Outlook 2022; International Energy Agency: Paris, France, 2022. [Google Scholar]
  13. Errera, M.R.; Dias, T.A.d.C.; Maya, D.M.Y.; Lora, E.E.S. Global bioenergy potentials projections for 2050. Biomass Bioenergy 2023, 170, 106721. [Google Scholar] [CrossRef]
  14. Kusumo, F.; Mahlia, T.M.I.; Shamsuddin, A.H.; Ahmad, A.R.; Silitonga, A.S.; Dharma, S.; Mofijur, M.; Ideris, F.; Ong, H.C.; Sebayang, R.; et al. Optimisation of biodiesel production from mixed Sterculia foetida and rice bran oil. Int. J. Ambient. Energy 2022, 43, 4380–4390. [Google Scholar] [CrossRef]
  15. Atabani, A.E.; Shobana, S.; Mohammed, M.N.; Uğuz, G.; Kumar, G.; Arvindnarayan, S.; Aslam, M.; Ala’a, H. Integrated valorization of waste cooking oil and spent coffee grounds for biodiesel production: Blending with higher alcohols, FT–IR, TGA, DSC and NMR characterizations. Fuel 2019, 244, 419–430. [Google Scholar] [CrossRef]
  16. Sharmina, M.; McGlade, C.; Gilbert, P.; Larkin, A. Global energy scenarios and their implications for future shipped trade. Mar. Policy 2017, 84, 12–21. [Google Scholar] [CrossRef]
  17. Aravind, S.; Kumar, P.S.; Kumar, N.S.; Siddarth, N. Conversion of green algal biomass into bioenergy by pyrolysis: A review. Environ. Chem. Lett. 2020, 18, 829–849. [Google Scholar] [CrossRef]
  18. Chiaramonti, D.; Prussi, M.; Buffi, M.; Rizzo, A.M.; Pari, L. Review and experimental study on pyrolysis and hydrothermal liquefaction of microalgae for biofuel production. Appl. Energy 2017, 185, 963–972. [Google Scholar] [CrossRef]
  19. Vuppaladadiyam, A.K.; Vuppaladadiyam, S.S.V.; Awasthi, A.; Sahoo, A.; Rehman, S.; Pant, K.K.; Murugavelh, S.; Huang, Q.; Anthony, E.; Fennel, P.; et al. Biomass pyrolysis: A review on recent advancements and green hydrogen production. Bioresour. Technol. 2022, 364, 128087. [Google Scholar] [CrossRef]
  20. He, J.; Strezov, V.; Kumar, R.; Weldekidan, H.; Jahan, S.; Dastjerdi, B.H.; Zhou, X.; Kan, T. Pyrolysis of heavy metal contaminated Avicennia marina biomass from phytoremediation: Characterisation of biomass and pyrolysis products. J. Clean. Prod. 2019, 234, 1235–1245. [Google Scholar] [CrossRef]
  21. Kan, T.; Strezov, V.; Evans, T.J. Lignocellulosic biomass pyrolysis: A review of product properties and effects of pyrolysis parameters. Renew. Sustain. Energy Rev. 2016, 57, 1126–1140. [Google Scholar] [CrossRef]
  22. Ioannidou, O.; Zabaniotou, A.; Antonakou, E.V.; Papazisi, K.M.; Lappas, A.A.; Athanassiou, C. Investigating the potential for energy, fuel, materials and chemicals production from corn residues (cobs and stalks) by non-catalytic and catalytic pyrolysis in two reactor configurations. Renew. Sustain. Energy Rev. 2009, 13, 750–762. [Google Scholar] [CrossRef]
  23. Zabaniotou, A.A.; Kantarelis, E.K.; Theodoropoulos, D.C. Sunflower shells utilization for energetic purposes in an integrated approach of energy crops: Laboratory study pyrolysis and kinetics. Bioresour. Technol. 2008, 99, 3174–3181. [Google Scholar] [CrossRef]
  24. Coriolano, A.C.; Alves, A.A.; Araujo, R.A.; Delgado, R.C.; Carvalho, F.R.; Fernandes, V.J.; Araujo, A.S. Thermogravimetry study of the ester interchange of sunflower oil using Mg/Al layered double hydroxides (LDH) impregnated with potassium. J. Therm. Anal. Calorim. 2017, 127, 1863–1867. [Google Scholar] [CrossRef]
  25. Deng, J.; Zhao, J.Y.; Xiao, Y.; Zhang, Y.N.; Huang, A.C.; Shu, C.M. Thermal analysis of the pyrolysis and oxidation behaviour of 1/3 coking coal. J. Therm. Anal. Calorim. 2017, 129, 1779–1786. [Google Scholar] [CrossRef]
  26. Liden, A.G.; Berruti, F.; Scott, D.S. A Kinetic Model for the Production of Liquids from the Flash Pyrolysis of Biomass. Chem. Eng. Commun. 2010, 65, 207–221. [Google Scholar] [CrossRef]
  27. Lo, S.-L.; Huang, Y.-F.; Chiueh, P.-T.; Kuan, W.-H. Microwave Pyrolysis of Lignocellulosic Biomass. Energy Procedia 2017, 105, 41–46. [Google Scholar] [CrossRef]
  28. Yong, K.J.; Wu, T.Y. Second-generation bioenergy from oilseed crop residues: Recent technologies, techno-economic assessments and policies. Energy Convers. Manag. 2022, 267, 115869. [Google Scholar] [CrossRef]
  29. Bijarchiyan, M.; Sahebi, H.; Mirzamohammadi, S. A sustainable biomass network design model for bioenergy production by anaerobic digestion technology: Using agricultural residues and livestock manure. Energy Sustain. Soc. 2020, 10, 19. [Google Scholar] [CrossRef]
  30. Spigno, G.; Pizzorno, T.; De Faveri, D.M. Cellulose and hemicelluloses recovery from grape stalks. Bioresour. Technol. 2008, 99, 4329–4337. [Google Scholar] [CrossRef]
  31. Zabaniotou, A.; Ioannidou, O.; Antonakou, E.; Lappas, A. Experimental study of pyrolysis for potential energy, hydrogen and carbon material production from lignocellulosic biomass. Int. J. Hydrogen Energy 2008, 33, 2433–2444. [Google Scholar] [CrossRef]
  32. Amenaghawon, A.N.; Anyalewechi, C.L.; Okieimen, C.O.; Kusuma, H.S. Biomass pyrolysis technologies for value-added products: A state-of-the-art review. Environ. Dev. Sustain. 2021, 23, 14324–14378. [Google Scholar] [CrossRef]
  33. Food and Agriculture Organization. Production: Crops and Livestock Products; FAO: Rome, Italy, 2021. [Google Scholar]
  34. Eurostat. 2023. Available online: https://ec.europa.eu/eurostat (accessed on 23 August 2023).
  35. ASTM D7582; Standard Test Methods for Proximate Analysis of Coal and Coke by Macro Thermogravimetric Analysis. ASTM International: West Conshohocken, PA, USA, 2015.
  36. Shariff, A.; Aziz, N.M.; Ismail, N.I.; Abdullah, N. Corn cob as a potential feedstock for slow pyrolysis of biomass. J. Phys. Sci. 2016, 27, 123–137. [Google Scholar] [CrossRef]
  37. Pütün, A.E.; Koçkar, Ö.M.; Yorgun, S.; Gerçel, H.F.; Andresen, J.; Snape, C.E.; Pütün, E. Fixed-bed pyrolysis and hydropyrolysis of sunflower bagasse: Product yields and compositions. Fuel Process. Technol. 1996, 46, 49–62. [Google Scholar] [CrossRef]
  38. Weldekidan, H.; Strezov, V.; Li, R.; Kan, T.; Town, G.; Kumar, R.; He, J.; Flamant, G. Distribution of solar pyrolysis products and product gas composition produced from agricultural residues and animal wastes at different operating parameters. Renew. Energy 2020, 151, 1102–1109. [Google Scholar] [CrossRef]
  39. Staš, M.; Auersvald, M.; Kejla, L.; Vrtiška, D.; Kroufek, J.; Kubička, D. Quantitative analysis of pyrolysis bio-oils: A review. Trends Anal. Chem. 2020, 126, 115857. [Google Scholar] [CrossRef]
  40. Garcia-Perez, M.; Chaala, A.; Pakdel, H.; Kretschmer, D.; Roy, C. Characterization of bio-oils in chemical families. Biomass Bioenergy 2007, 31, 222–242. [Google Scholar] [CrossRef]
  41. National Library of Medicine. Available online: https://pubchem.ncbi.nlm.nih.gov/ (accessed on 23 August 2023).
  42. Ceranic, M.; Kosanic, T.; Djuranovic, D.; Kaludjerovic, Z.; Djuric, S.; Gojkovic, P.; Bozickovic, R. Experimental investigation of corn cob pyrolysis. J. Renew. Sustain. Energy 2016, 8, 063102. [Google Scholar] [CrossRef]
  43. Yorgun, S.; Gülbaran, H.S. Pyrolysis of Sunflower Press Bagasse: Heating Values and Energy Distribution of the Pyrolysis Products. Energy Sources 2003, 25, 809–817. [Google Scholar] [CrossRef]
  44. He, X.; Yang, L.; Wu, H.; Liu, N.; Zhang, Y.; Zhou, A. Characterization and pyrolysis behaviors of sunflower stalk and its hydrolysis residue, Asia-Pac. J. Chem. Eng. 2016, 11, 803–811. [Google Scholar]
  45. Suárez, S.; Rosas, J.G.; Sánchez, M.E.; López, R.; Gómez, N.; Cara-Jiménez, J. Parametrization of a Modified Friedman Kinetic Method to Assess Vine Wood Pyrolysis Using Thermogravimetric Analysis. Energies 2019, 12, 2599. [Google Scholar] [CrossRef]
  46. Rathore, N.S.; Panwar, N.L. Biomass Production and Efficient Utilization for Energy Generation; CRC Press: Boca Raton, FL, USA, 2022. [Google Scholar]
  47. Casoni, A.I.; Bidegain, M.; Cubitto, M.A.; Curvetto, N.; Volpe, M.A. Pyrolysis of sunflower seed hulls for obtaining bio-oils. Bioresour. Technol. 2015, 177, 406–409. [Google Scholar] [CrossRef] [PubMed]
  48. Abatyough, M.T.; Ajibola, V.O.; Agbaji, E.B.; Yashim, Z.I. Properties of upgraded bio-oil from pyrolysis of waste corn cobs. J. Sustain. Environ. Manag. 2022, 1, 120–128. [Google Scholar] [CrossRef]
  49. Coates, J. Interpretation of infrared spectra, a practical approach. In Encyclopedia of Analytical Chemistry; Meyers, R.A., Ed.; Wiley: Hoboken, NJ, USA, 2000; pp. 10815–10837. [Google Scholar]
  50. Mulligan, C.J.; Strezov, L.; Strezov, V. Thermal Decomposition of Wheat Straw and Mallee Residue under Pyrolysis Conditions. Energy Fuels 2010, 24, 46–52. [Google Scholar] [CrossRef]
  51. Strezov, V.; Evans, T.J. Thermal Processing of Paper Sludge and Characterisation of its Pyrolysis Products. Waste Manag. 2009, 29, 1644–1648. [Google Scholar] [CrossRef]
  52. Hoang, A.T.; Ong, H.C.; Fattah, I.M.R.; Tung, C.; Chong, C.T.; Cheng, C.K.; Sakthivel, R.; Ok, Y.S. Progress on the lignocellulosic biomass pyrolysis for biofuel production toward environmental sustainability. Fuel Process. Technol. 2021, 223, 106997. [Google Scholar] [CrossRef]
  53. Fahmy, T.; Fahmy, Y.; Mobarak, F.; El-Sakhaway, M.; Abou-Zeid, R.E. Biomass pyrolysis: Past, present, and future. Environ. Dev. Sustain. 2020, 22, 17–32. [Google Scholar] [CrossRef]
  54. Xin-gang, Z.; Wei, W.; Shuran, H.; Xuan, L. Impacts of Government Policies on the Adoption of Biomass Power: A System Dynamic Perspective. Sustainability 2023, 15, 1723. [Google Scholar] [CrossRef]
  55. Anca-Couce, A.; Hochenauer, C.; Scharler, R. Bioenergy technologies, uses, market and future trends with Austria as a case study. Renew. Sustain. Energy Rev. 2021, 135, 110237. [Google Scholar] [CrossRef]
  56. IEA. Net Zero by 2050: A Roadmap for the Global Energy Sector; International Energy Agency: Paris, France, 2021. [Google Scholar]
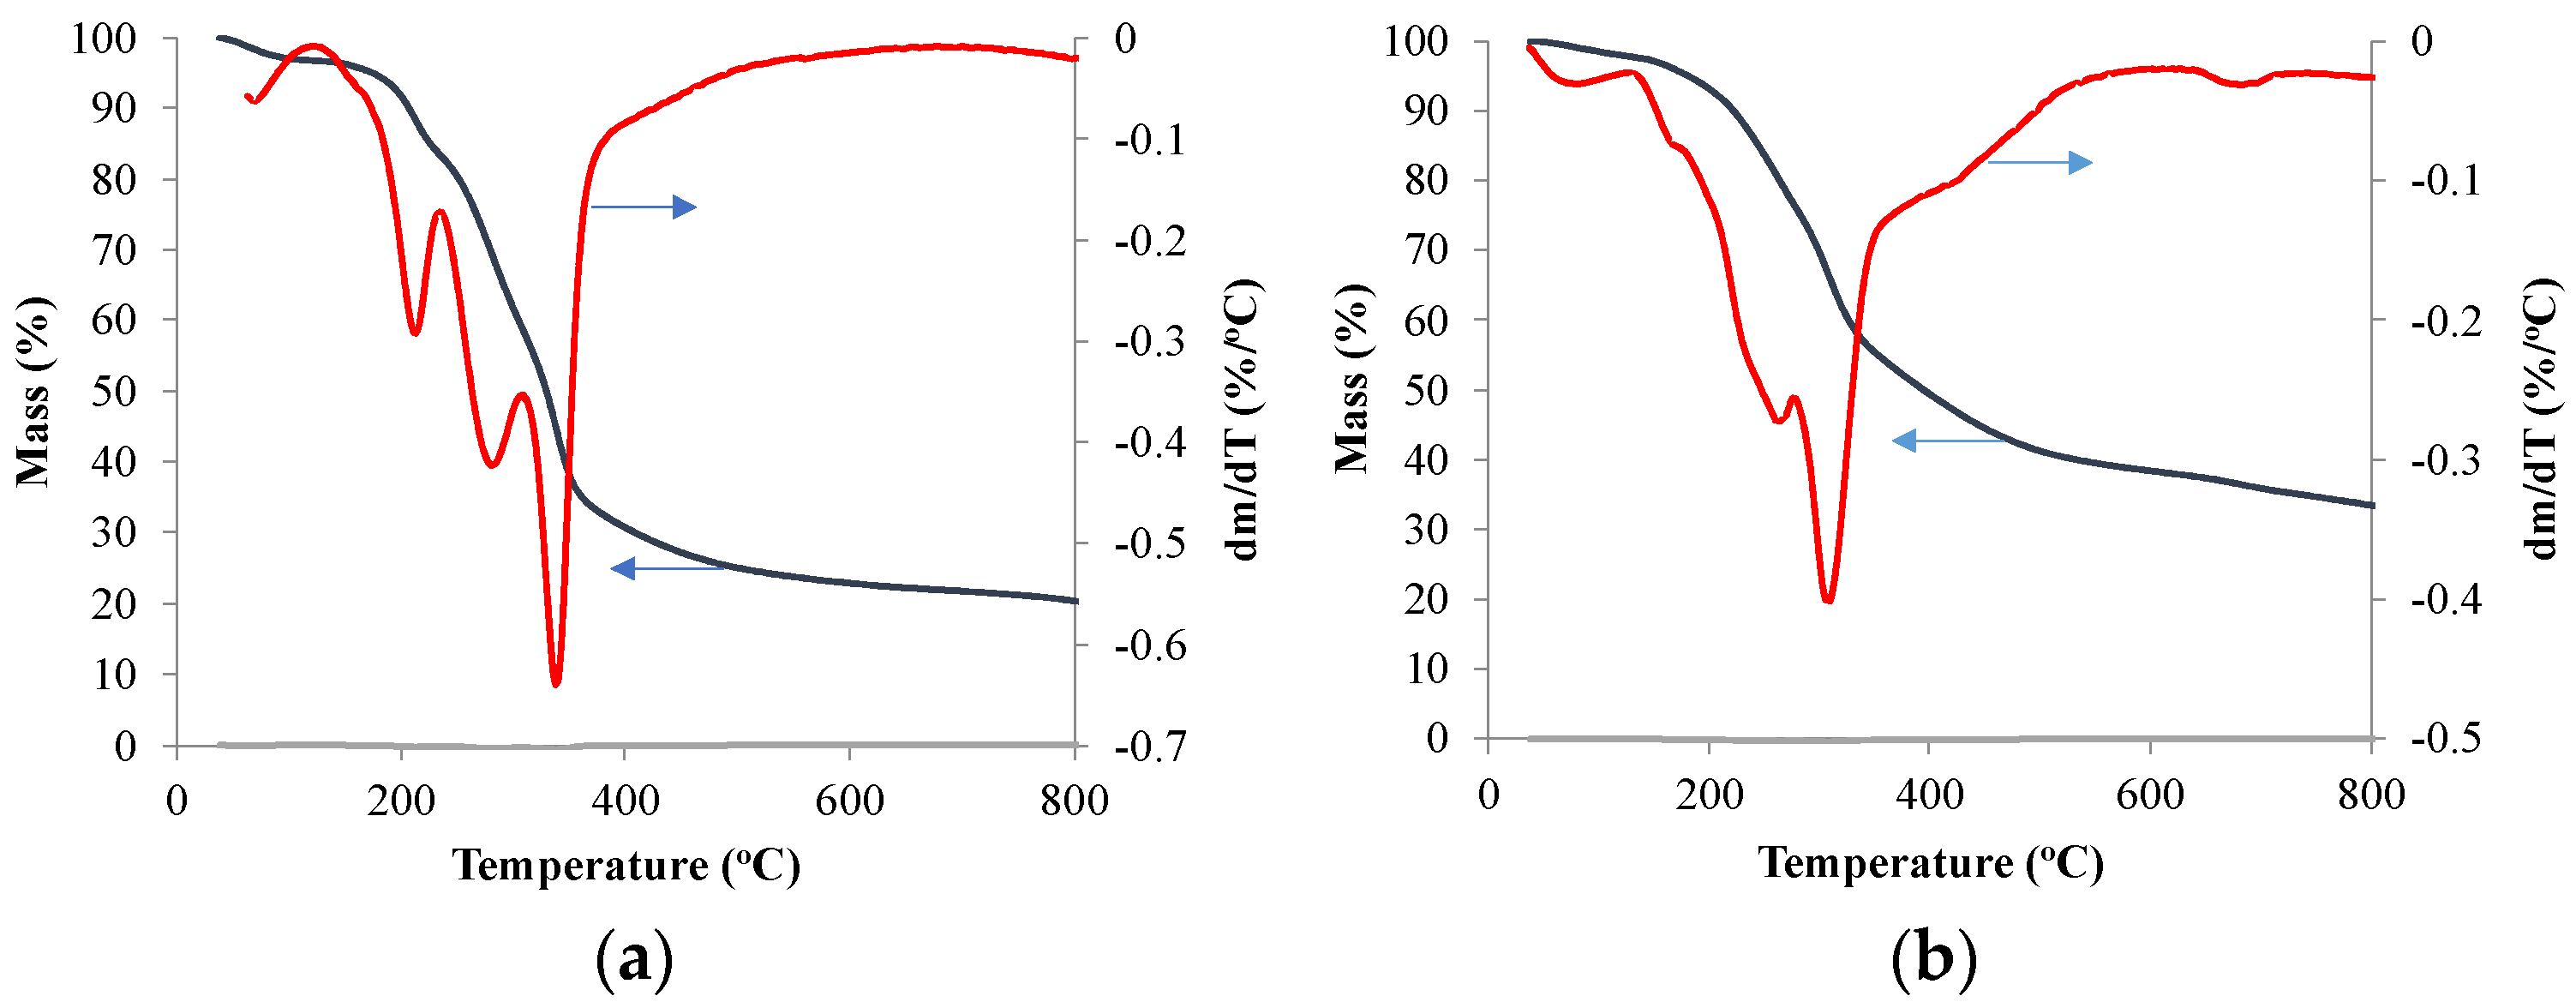
Figure 1. TGA on the biomass pyrolysis products: (a) corn cob; (b) vine rod; (c) sunflower. Arrows show the directions of the corresponding axis for the presented data.
Sustainability 15 13552 g001aSustainability 15 13552 g001b
Figure 2. GC analysis of the biomass pyrolysis gas products: (a) corn cob; (b) vine rod; (c) sunflower.
Sustainability 15 13552 g002aSustainability 15 13552 g002b
Figure 3. FT-IR of the raw data and the biochar products of the selected biomass products: (a) corn cob; (b) vine rod; (c) sunflower.
Sustainability 15 13552 g003aSustainability 15 13552 g003b
Table 1. Proximate analysis of the three biomass samples.
Moisture (%)Volatile Matter (%)Ash (%)Fixed Carbon (%)
Corn cob2.7780.181.7315.33
Vine rod3.9069.334.0622.71
Sunflower2.9472.058.3016.71
Table 2. Composition of bio-oil collected from corn cob at 500 °C for compounds detected above 1%.
NumberCompoundArea (%)
1Catechol (C6H6O2)4.8
29-Octadecenoic acid, (E)- (C18H34O2)4.6
3Palmitic acid (C16H32O2)4.51
42-Hydroxycyclohexane-1-carboxylic acid (C7H12O3)3.75
59,12-Octadecadienoic acid (Z,Z)- (C18H32O2)3.54
6cis-4-Hydroxycyclohexanecarboxylic acid (C7H12O3)3.36
71,2,3,4-Tetrahydroisoquinolin-6-ol-1-carboxylic acid, 7-Methoxy-1-methyl- (C12H15NO4)3.08
8M-cresol (C7H8O)2.89
9Pimelic acid (C7H12O4)2.72
102-hexenoic acid, (E)- (C6H10O2)2.65
11Isobutanol (C4H10O)2.63
12Furfuryl alcohol (C5H6O2)2.59
13Levoglucosan (C6H10O5)2.59
14D-(+)-ribono-1,4-lactone (C5H8O5)2.55
15Triethylene glycol (C6H14O4)2.03
16Phenol (C6H6O)1.75
172,2-Dimethyl-5-[2-(ethoxymethoxy)-propyl]-[1,3]dioxolane-4-carboxaldehyde (C12H22O5)1.71
18Glycerol (C3H8O3)1.66
19Syringol (C8H10O3)1.5
20Stearic acid (C18H36O2)1.39
212-Oxooctanoic acid (C8H14O3)1.29
22Hydroquinone (C6H6O2)1.22
23Oleic acid, (Z)- (C18H34O2)1.22
24Sorbic acid (C6H8O2)1.21
25Neopentyl alcohol (C5H12O)1.05
26Cyclopentene-3-carboxylic acid, 1-hydroxyl- (C7H10O3)1.02
Table 3. Composition of bio-oil collected from vine rod at 500 °C for compounds detected above 1%.
NumberCompoundArea (%)
1Catechol (C6H6O2)9.15
24-Methylcatechol (C7H8O2)5.74
33-Pyridinol (C5H8NO8)4.13
4Palmitic acid (C16H32O2)3.93
5Phenol (C6H6O)3.63
6M-cresol (C7H8O8)3.16
72-Pyrrolidinone (C4H7NO)3.04
8Hydroquinone (C6H6O2)2.71
9Syringol (C8H10O3)2.4
10Triethylene glycol (C6H14O4)2.39
119,12-Octadecadienoic acid (Z,Z)- (C18H32O2)2.33
12Acetamide (C2H5NO)2.15
132-(3,4-Hydroxyl)ethanamine (C8H11NO2)1.88
14Stearic acid (C18H36O2)1.87
15.Alpha.-linolenic acid (C18H30O2)1.81
16Hexanoic acid (C6H12O2)1.68
173,5-Dimethylphenol (C8H10O)1.55
18P-cresol (C7H8O)1.33
19O-cresol (C7H8O8)1.13
20Stigmast-5-ene, 3.beta.-(hydroxyl)-, (24S)- (C29H50O)1.06
21Hymexazole (C4H5NO2)1.01
Table 4. Composition of bio-oil collected from sunflower at 500 °C for compounds detected above 1%.
NumberCompoundArea (%)
1Isoprimaric acid (C20H20O2)9.23
2Abietic acid (C20H30O2)4.93
3Palmitic acid (C13H32O2)4.86
4Hydroquinone (C6H6O2)4.83
5Hexanoic acid, 3-hydroxyl- (C6H12O3)4.21
69,12-Octadecadienoic acid (Z,Z)- (C18H32O2)3.89
7Phenol (C6H6O)3.7
8Catechol (C6H6O2)3.65
9Alpha-linolenic acid (C18H30O2)2.1
10Triethylene glycol (C6H14O4)2.02
11Isopimaric acid (C20H30O2)2.02
123-pyridinol (C5H5NO)1.64
13Hexanoic acid (C6H12O2)1.53
14Ethylene glycol (C2H6O2)1.51
15Glycerol (C3H8O3)1.31
16Acetamide (C2H5NO)1.18
17M-cresol (C7H8O)1.15
18Stearic acid (C18H36O2)1.1
19Furfuryl alcohol (C5H6O2)1.03
Table 5. Values of the criteria selected for assessment of the quality of the biomass sources.
Char Yield at 500 °C
(%)
Pyrolytic Gas CV
(MJ/kg Biomass)
Bio-Oil Value (AUD/g Biomass)
Corn cob25.060.78633.23
Vine rod41.290.9627
Sunflower36.351.38118
Table 6. Multicriteria assessment of the quality of the biomass resources.
Criteria 1
(Char)
Criteria 2
(Biogas)
Criteria 3
(Bio-Oil)
Total
Corn cob0.610.5712.18
Vine rod10.700.211.91
Sunflower0.8810.542.42
Disclaimer/Publisher’s Note: The statements, opinions and data contained in all publications are solely those of the individual author(s) and contributor(s) and not of MDPI and/or the editor(s). MDPI and/or the editor(s) disclaim responsibility for any injury to people or property resulting from any ideas, methods, instructions or products referred to in the content.