Article

Evaluating Pilot-Scale Floating Wetland for Municipal Wastewater Treatment Using Canna indica and Phragmites australis as Plant Species

1
Research Management and Outreach Division, National Institute of Hydrology, Roorkee 247667, Uttarakhand, India
2
Department of Environmental Studies, Dyal Singh Evening College, University of Delhi, New Delhi 110003, India
3
Environmental Hydrology Division, National Institute of Hydrology, Roorkee 247667, Uttarakhand, India
*
Author to whom correspondence should be addressed.
These authors contributed equally to this work.
Sustainability 2023, 15(18), 13601; https://doi.org/10.3390/su151813601
Submission received: 2 August 2023 / Revised: 5 September 2023 / Accepted: 7 September 2023 / Published: 12 September 2023

Abstract

:
Floating treatment wetlands (FTWs), also called constructed floating wetlands or floating islands, are a recent innovation in constructed wetlands (CWs) inspired by natural wetlands. In FTWs, emergent plants grown hydroponically on buoyant mats are used for wastewater treatment, which makes them far more economical than other CWs. The objective of this study was to evaluate the performance of FTWs for the treatment of municipal wastewater from an urban drain using native plant species Canna indica and Phragmites australis. A pilot-scale experiment was carried out using four FTW treatment cells with different plant coverages for pollutant removal: C1 (Canna indica, 100% coverage), C2 (Phragmites australis, 100% coverage), C3 (Phragmites australis, 50% coverage), and C4 (control). Overall, treatment cells with Canna indica and Phragmites australis showed reductions in BOD5, COD, EC, TDS, NO3, and PO43− compared with the control. Maximum BOD5 and COD removal was 53% and 50%, respectively, at 50% coverage of Phragmites australis (C3). The maximum reduction in NO3 (61%) was achieved using Canna indica at 100% coverage (C1). Conversely, moderate removal of PO43− (27%) was obtained in the control (C4) with a visibly high amount of algal growth, indicating the influence of algae on pollutant removal. This study highlights the significance of Phragmites australis for organic matter removal and Canna indica for nutrient removal, mainly NO3 from municipal wastewater. Furthermore, this study suggests that FTWs perform well for BOD5 and COD removal at 50% plant coverage (Phragmites australis) and NO3 removal at 100% coverage (Canna indica).

Graphical Abstract

1. Introduction

A constructed wetland (CW) system is an engineered system that utilizes the natural aquatic ecosystem (i.e., soil, water, and microorganisms) and the atmosphere to treat a variety of wastewater by removing pollutants such as nutrients [1], organic matter, and heavy metals [2,3,4]. In general, CWs are frequently used as an alternative treatment technology because of their moderately low capital cost, marginal energy requirements, and relatively low maintenance compared with conventional treatment plants [5,6]. Although CWs are widely used in wastewater treatment, floating treatment wetlands (FTWs) have gained considerable attention for wastewater treatment worldwide, as they are more economical than other conventional treatment systems [7,8,9].
FTWs are also called constructed floating wetlands or floating islands, which are a recent innovation in CWs inspired by the natural islands of FWs, with interwoven root systems acting as a buoyant mat [10]. In FTWs, plants grow hydroponically on a floating mat (buoyant raft); the hanging root network remains in contact with the water column receiving nutrients under the floating mat, whereas the leaves and shoots of the plant grow above the mat [11,12]. Unlike CWs, these FTWs are suitable for the fluctuating water levels in the water column as these buoyant mats are designed to move up and down, like in a hydroponic system) [13]. In FTWs, the development of a larger root surface area supports the development of the biofilm responsible for biochemical processes (i.e., microbial process) and physical processes (i.e., filtration). The dense root network also enhances the phyto-uptake of nutrients [14,15]. The hanging root system of an FTW has a higher uptake of nutrients from the water column in comparison with the rooted vegetation of other intensified CWs [16]. Unlike CWs, the use of solid filter media (gravel, sand, etc.) is not required in FTWs; consequently, they are less susceptible to clogging and can be easily desludged, if required [14,16].
In addition to the surface area for biofilm growth, plants also provide oxygen through their roots, which directly influence the redox potential of the water column, affecting nitrogen transformation and aerobic degradation of organic matter, while the release of root exudates from plants affects biological processes such as denitrification [14,17,18]. Most commonly used plant species in FTWs are persistent emergent plants such as cattails (Typha), bulrushes (Scirpus), other sedges (Cyperus), rushes (Juncus), spike-rush (Eleocharis), common reed (Phragmites), and Indian shot (Canna indica) [1,14,17,19,20].
In this study, we evaluated the treatment performance of FTWs embedded with the plant species Canna indica and Phragmites australis used for the treatment of municipal wastewater through a pilot-scale experiment. Furthermore, the influence of plant coverage on pollutant removal from wastewater was also assessed. Canna indica and Phragmites australis are commonly available plant species native to the Indian subcontinent. A pilot-scale experiment was carried out using four FTW treatment cells with different plant coverages for pollutant removal (mainly nutrient and organic matter removal) from municipal wastewater collected from an urban drain. This study can shed light on the treatment performance of FTWs with different plant species and coverages on municipal wastewater treatment and can aid in selecting the appropriate plant species for targeted pollutants.

2. Materials and Methods

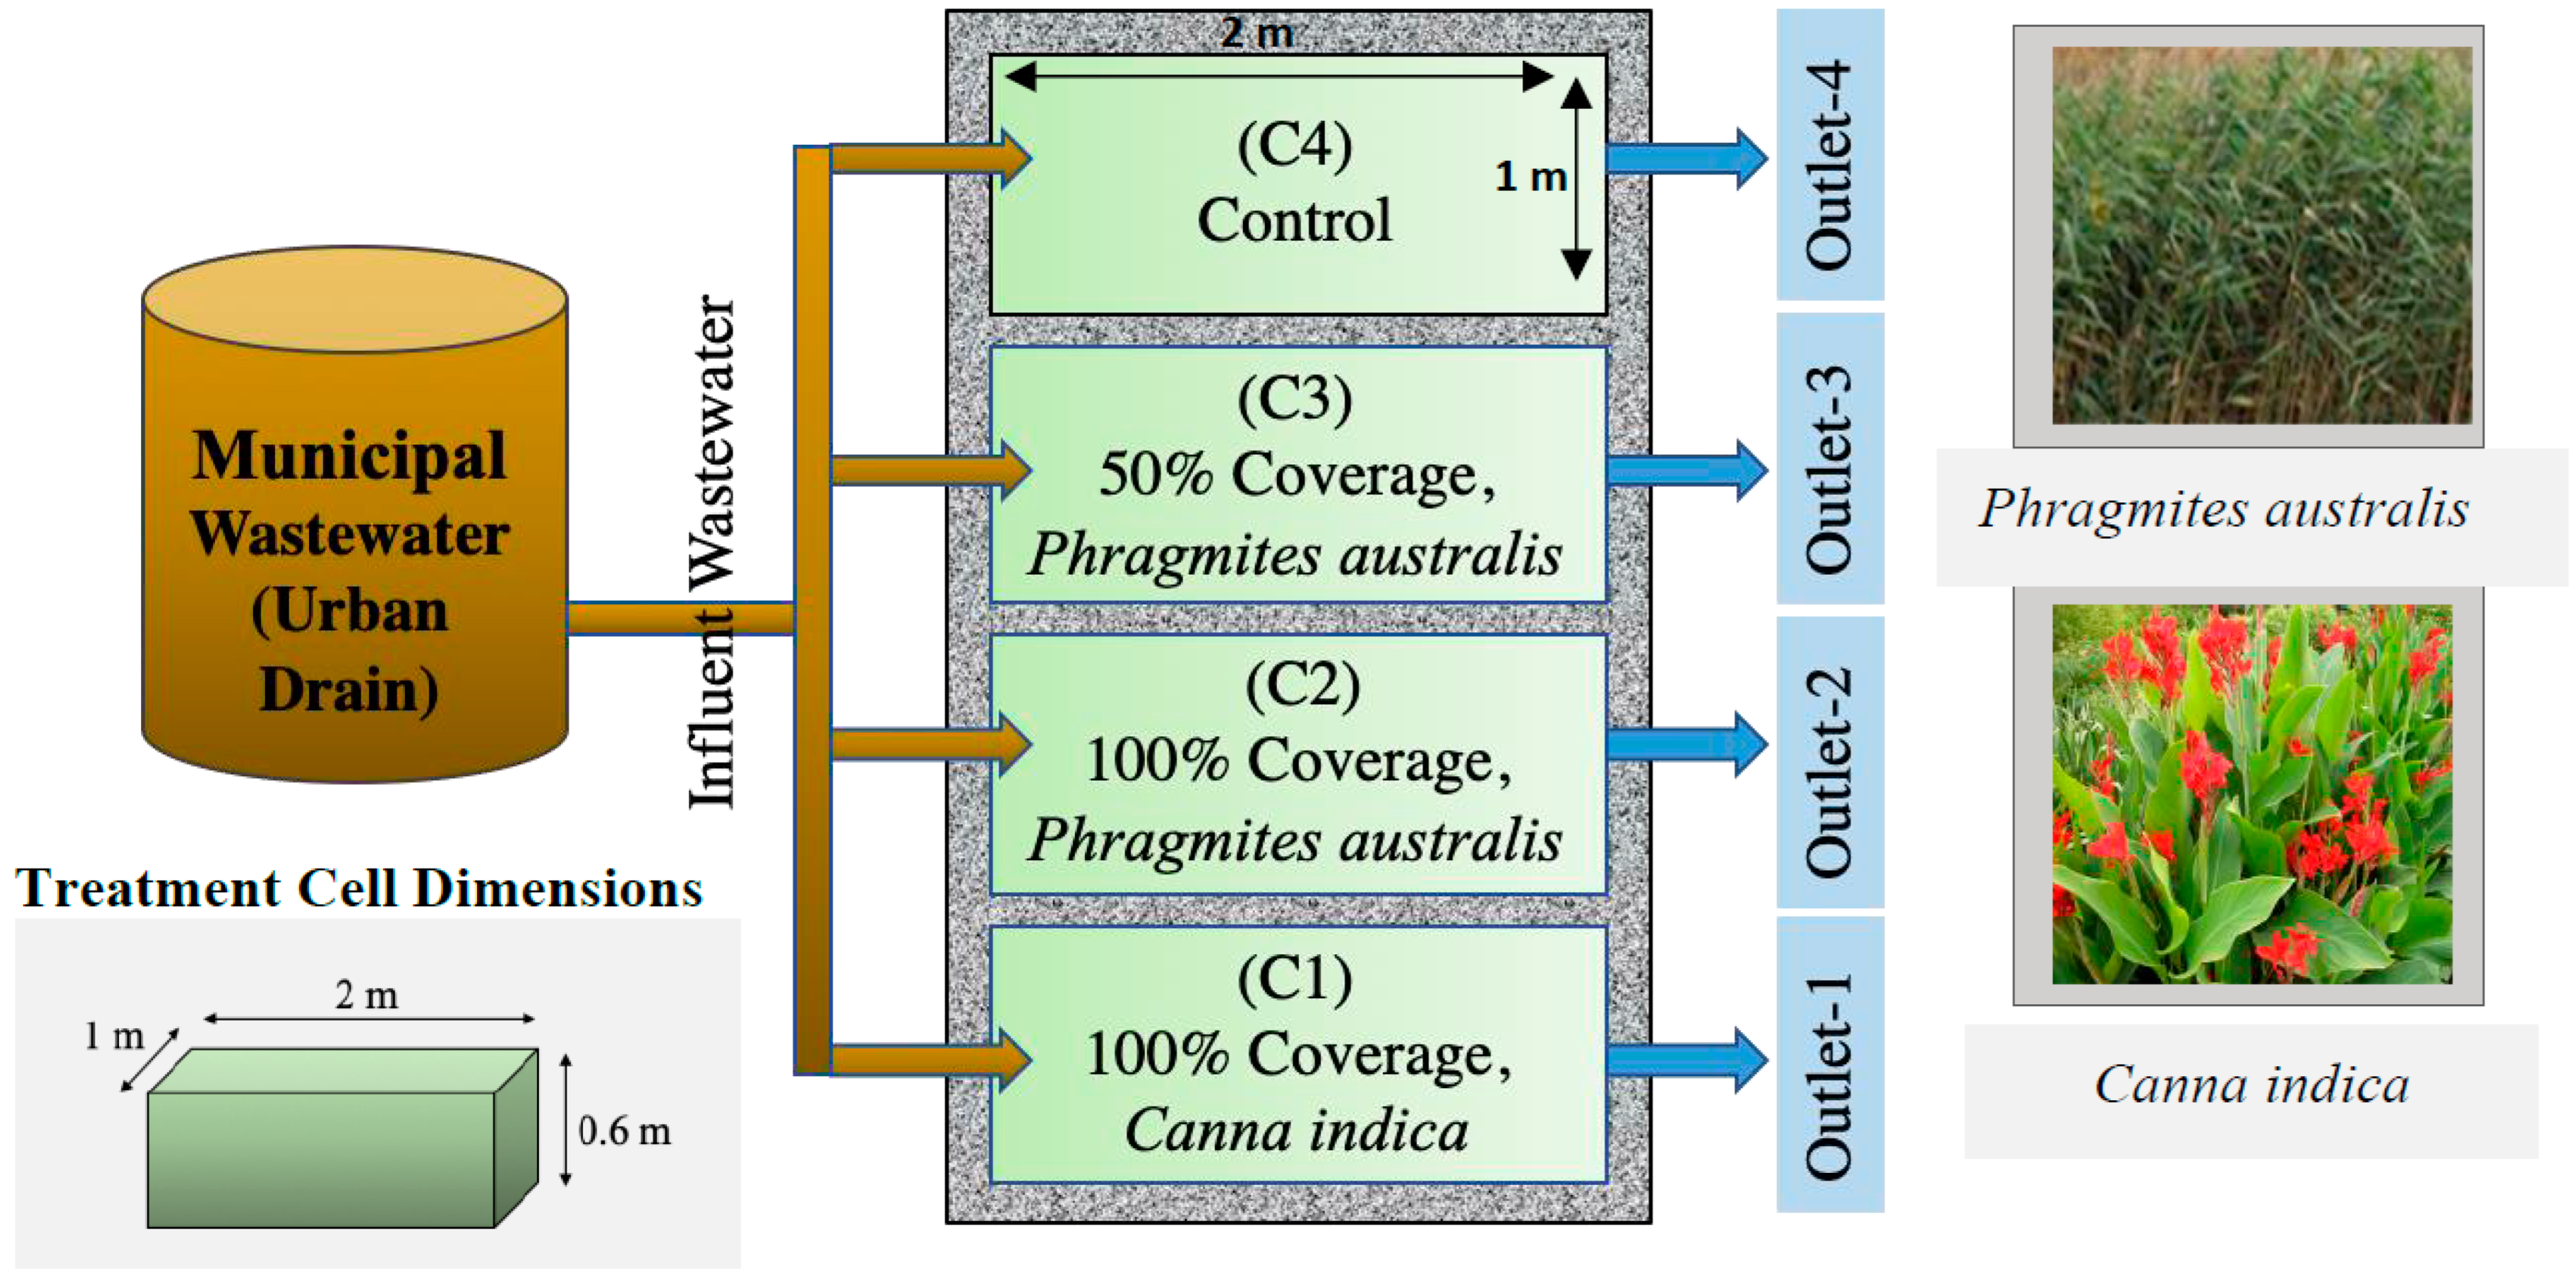
2.1. Experimental Setup: Pilot-Scale Floating Treatment Wetland

A pilot-scale experiment was conducted within the campus of the National Institute of Hydrology, Roorkee, India (29°52′6.67″ N, 77°53′39.18″ E). The setup consisted of four concrete rectangular FTW cells (C1, C2, C3, C4) of dimensions 2 m × 1 m × 0.6 m (length (L) × width (W) × depth (D)) and a total volume of 1200 L with a free-board of 10 cm (Figure 1). Two FTW mats of surface area 1.7 × 0.8 m2 (L × W) and height 0.12 m and one FTW mat of surface area 0.85 × 0.8 m2 (L × W) and height 0.12 m were prepared using coconut coir and bamboo sticks for 100% and 50% coverage in the treatments cells. Canna indica and Phragmites australis were the selected macrophyte species for the FTW mats. These are perennial and locally available emergent plant species. For 100% coverage, 12 plugs of Canna indica and 12 plugs of Phragmites australis were planted in two separate FTW mats. For 50% coverage, 6 plugs of Phragmites australis were planted in the FTW mat. Initially, the FTW mats were nurtured in the greenhouse for approximately 15 days to allow the macrophytes to establish.
Subsequently, the FTWs were transferred to the three treatment cells; C1 (Canna indica 100% coverage), C2 (Phragmites australis 100% coverage), and C3 (Phragmites australis 50% coverage). Treatment cell C4 with no FTW mat served as the control (Table 1).

2.2. System Operation and Analytical Methods

The experiment setup was operated at a flow rate of 403 L/day (280 mL/min) in continuous mode for each treatment cell, and the inlet was kept above the water column of the treatment cell. The flow rate to each cell was manually measured every four hours and regulated to maintain the desired flow rate. The hydraulic retention time (HRT) of the treatment system was 3 days. The HRT was estimated by dividing the total volume of the system by the outflow. The pilot-scale FTW was fed with domestic wastewater withdrawn from a nearby urban drain located in the residential colony of Roorkee, Uttarakhand, and stored in a 2000 L polyethylene tank connected to the FTW. The wastewater was screened and filtered using a mesh before its storage in the tank to prevent coarser materials and other large solids from entering the system. The network of pipes connected between the storage tank and the FTW provided wastewater inflow to each treatment cell by gravity flow. The tank was refilled every alternate day for continuous operation of the FTW. The inflow to the FTW was controlled using valves.
The water quality of the FTW was monitored every 3 days at the inlet and outlet of each cell (C1, C2, C3, and C4) for a period of two months (March 2021 to April 2021). Samples collected in 1 L plastic bottles were returned immediately to the laboratory (NIH Water Quality Laboratory, Roorkee) and analyzed for nine physicochemical parameters. Parameters such as temperature, pH, electrical conductivity (EC), and total dissolved solids (TDS) were measured using a Thermo Scientific Orion Star A329 portable Multiparameter (Waltham, MA, USA); five-day biochemical oxygen demand (BOD5) was measured using a WTW OxiTop-IS-6 Respirometric BOD measuring system; and chemical oxygen demand (COD), dissolved oxygen (DO), nitrate (NO3), and phosphate (PO43−) were measured using APHA 5220-B, APHA 4500-O C, APHA 4500-NO3 B, and APHA 4500-P C methods, respectively [21]. The characteristics of the municipal wastewater are given in Table 2. We estimated the changes in concentration and removal efficiency for each treatment cell of the pilot-scale FTW using Equations (1) and (2).
Δ C = C i C O
R E = C i C o C i × 100
where C i and C O represent inlet and outlet concentration (mg/L) for each cell; Δ C represents the change in concentration (mg/L); RE represents the removal efficiency as a percent (%). The percent reduction in the concentration of the inlet to that of the outlet is indicated by removal efficiency. The removal rate constant (KT) of BOD, COD, TDS, NO3, and PO43− was calculated using the first-order plug-flow equation given in Equations (3) and (4) [22,23].
l n C i C o = K T t
K T = K 20 θ ( T 20 )
where K T is the first-order rate constant (day−1) at temperature T (°C), and t represents HRT (day). The temperature dependence of the rate constant is given by Equation (4). The data in this study are presented in box and whisker plots. In the plots, the boxes indicate 25th, 50th, and 75th percentiles, whereas the minimum and maximum ranges are shown by the whiskers in the plots. The median is represented by the 50th percentile, and the cross in the plots indicates the mean value of the data. In addition, the interquartile distance (IQR) was calculated to find the range beyond which the data points were considered outliers. The IQR was calculated by taking the difference between the 25th and 75th quartiles [24]. In this study, the null hypothesis was that the floating mats with different plant species and coverages do not contribute to pollutant removal from the treatment cells. Pollutant reduction from each treatment cell was compared with the influent, and a t-test was performed. The null hypothesis was rejected for p values less than 0.05.

3. Results and Discussion

3.1. Characteristics of Influent Wastewater

The average concentration of the physicochemical parameters indicates the characteristics of the municipal wastewater from an urban drain (Table 2). The pH of the municipal water ranges between 5.0 and 8.1 with an average of 7.2 ± 1.2, indicating that the wastewater remains neutral and fluctuates inconsistently due to episodes of slightly acidic and alkaline inflow into the drain. The Central Pollution Control Board of India ([25], https://cpcb.nic.in, accessed on 14 January 2023) recommends a pH of 6.5 to 8.5 for the controlled disposal of liquid waste [25]. The urban drain receives the wastewater largely from a number of households (>1000 persons) and nearby small commercial establishments; therefore, variation in the physicochemical parameters was observed. The drain also receives runoff from the surrounding area, which may affect the organic load in the drain. The average concentration of BOD5, COD, TDS, NO3, and PO43− was 145 ± 32 mg/L, 186 ± 23.7 mg/L, 526 ± 56.7 mg/L, 2.5 ± 1.9 mg/L, and 13 ± 3.5 mg/L, respectively. Parameter concentrations were well beyond the recommended guidelines for the discharge of treated sewage by apartments and other commercial buildings (CPCB-2021; https://cpcb.nic.in, accessed on 14 January 2023) [25]. The minimum and maximum parameter concentrations in this study indicated a relatively low to medium strength of wastewater when compared with other countries [16,26].

3.2. Effluent Quality and Contaminant Removal Efficiency

The box and whisker plot reveals the variations in the physicochemical parameters in the effluent of each FTW cell. The contaminant removal efficiency of each FTW cell based on 18 samples analyzed over 2 months is summarized in Table 3.

3.2.1. Variations in pH and Dissolved Oxygen

The average and median pH values remain slightly lower than neutral (C1, C2, C3: pH = 6.8, p < 0.05) in FTW treatment cells with Canna indica and Phragmites australis, except in the control (C4: pH < 7.1, p > 0.05). The change in pH values for C1, C2, and C3 was observed to be statistically significant, but insignificant for C4. Reduced pH in the treatment cells when compared with the control can be attributed to the presence of FTW mats with 100% (C1, Canna indica; C2, Phragmites australis) and 50% coverage (C3, Phragmites australis). The FTW mats prohibit the penetration of sunlight into the water column and, in turn, the algal growth which consumes the CO2 in the water and results in an increase in pH [27]. Furthermore, the pH reduction in the cells with FTWs could be due to wetland plants, which excrete organic acids in their rhizosphere through their roots, which later break into a proton and organic bases [28]. In C4 (control, no FTW mats), the relatively high average pH and high variability in pH suggest enhanced photosynthesis (Figure 2a,b).
The presence of organic matter, type of wastewater, and FTW mats largely influence the DO concentration in the FTW system. The results indicate slightly improved DO concentration in the treatment cells. However, when compared with the influent, the treatment cells with 100% coverage of Canna indica and Phragmites australis show an insignificant difference in DO levels (C1: 1.2 ± 0.7 mg/L, p > 0.1), (C2: 1.6 ± 1.3 mg/L, p > 0.05); whereas a significant difference was observed for C3 (2.2 ± 1.9 mg/L, p < 0.05) and C4 (2.3 ± 2.3 mg/L, p < 0.05). The low DO in the treatment cells when compared with the control could have been due to the presence of the FTW mats. In the treatment cells, the FTW bed limits the diffusion of atmospheric oxygen (O2) to the water column and thus acts as a physical barrier [7,29]. Moreover, the presence of algae in C4 (control) might contribute to photosynthetic O2 generation in the control than in the treatment cells C1 and C2 with 100% coverage of Canna indica and Phragmites australis. Consequently, in C1, C2, C3, and C4, DO levels enhanced by 44%, 90%, 163%, and 300%, respectively, compared with those in the influent wastewater. Apart from FTW mat coverage, plant density substantially affects the O2 transfer in the water column. Studies show that in an FTW treatment system, 100% coverage often has lower DO than a treatment cell with 50% coverage [30].

3.2.2. Variations in EC, TDS, and Temperature

The average and median values showed a slightly reduced temperature in treatment cells C1, C2, and C3 (<25 °C) compared with the control (26 °C), although insignificant at p > 0.05, suggesting slight variation due to the shading effect of the FTW mats with 100% and 50% coverage in the treatment cells (Figure 3c). Overall, the minimum and maximum temperature variation observed between the FTW cells (C1 to C4) was 19 °C and 33 °C, respectively. The lowest average value of EC (p > 0.05) was observed in C4 (control: 923 ± 179 µS/cm), followed by C3 (984 ± 107 µS/cm), C2 (984 ± 107 µS/cm), and C1 (984 ± 107 µS/cm) compared with the influent. A similar trend was observed for TDS with the lowest value in C4 (control: 923 ± 179 µS/cm), followed by C3 (984 ± 107 µS/cm, p > 0.05), C2 (984 ± 107 µS/cm, p < 0.05, p > 0.05), and C1 (984 ± 107 µS/cm, p > 0.05). Both EC and TDS showed considerably low variability in the treatment cells compared with that in the influent wastewater (Figure 3a,b). EC variation could be explained by the variation in the temperature, whereas TDS is proportional to EC. However, the effect of temperature seemed negligible on both EC and TDS in C4, where EC and TDS decreased with an increase in temperature, which could have been due to the presence of algae in C4. TDS often refers to inorganic salts (e.g., calcium, potassium, and sulfates) and dissolved organic matter in wastewater. The slight reduction in TDS could have been due to physical adsorption, precipitation, and microbial degradation in the treatment cells [31]. Consequently, the TDS reduction was relatively higher in C4 than in its counterpart, as shown in Figure 3b. The results suggest the need for further investigation to assess the impact of algal growth on EC and TDS.

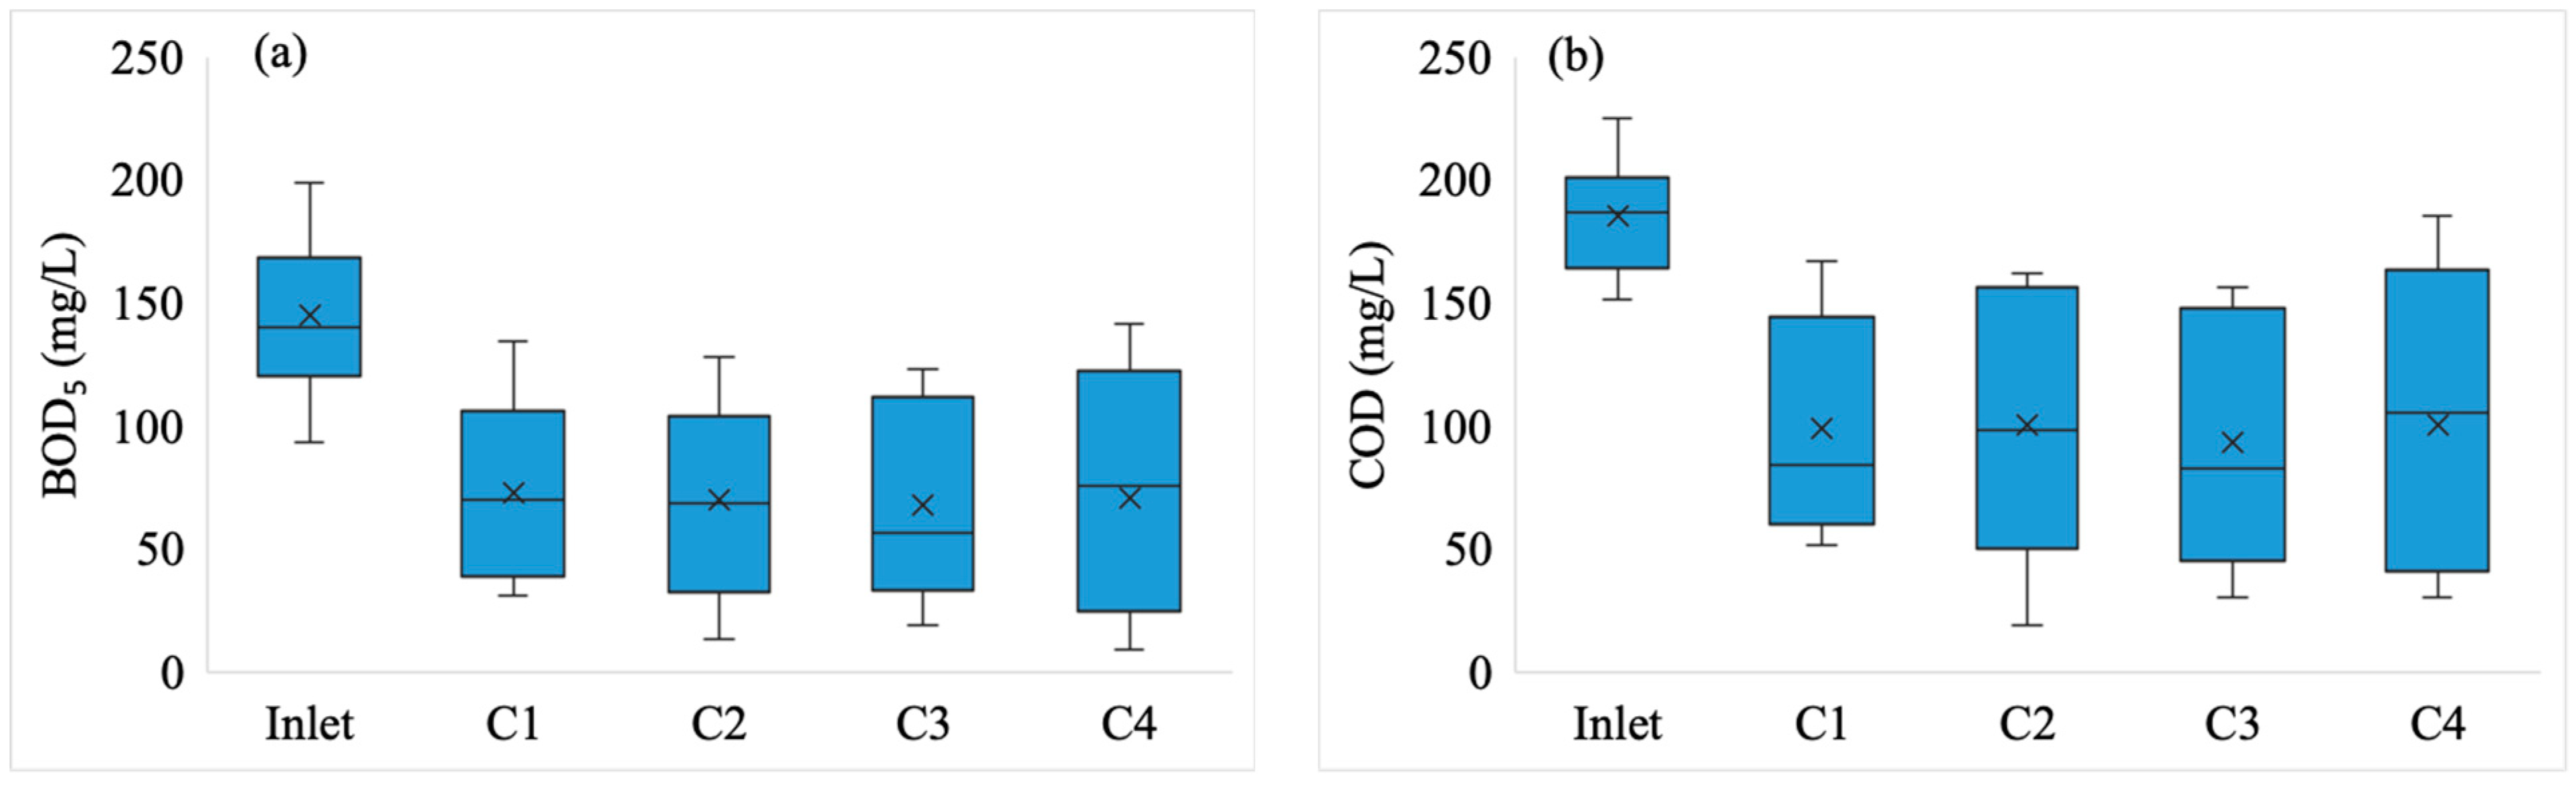
3.2.3. Organic Matter Attenuation: BOD5 and COD Variation

The BOD and COD values of water samples indicate the presence of organic matter and the biodegradability of the wastewater. In general, the ratio of BOD5/COD for domestic wastewater ranges between 0.4 to 0.8, indicating the biodegradability of the wastewater [18,32]. The higher the ratio of BOD5/COD, the higher the biodegradability of the wastewater. In this study, the estimated BOD5/COD ratio was 0.74, indicating the high biodegradability of the wastewater. The lowest BOD5 was observed in the treatment cells with 100% and 50% coverage of Phragmites australis, C3 (68 ± 40 mg/L, p < 0.05) and C2 (70 ± 40 mg/L, p > 0.05), respectively, followed by C4 control (71 ± 50 mg/L, p > 0.05) and C1 (73 ± 38 mg/L, p > 0.05) (Figure 4a). The removal was rather higher in C3 with 50% coverage of Phragmites australis (53%) and C2 with 100% coverage of Phragmites australis (52%) than in C1 (50%) with 100% coverage of Canna indica, whereas 51% BOD5 removal was achieved in the control (C4). The root system of Phragmites australis is very dense with interconnected rhizome branches forming a basal network up to 0.5 m in depth which are colonized by microorganisms. The oxygen is released from the apical parts of the roots and rhizomes creating an aerobic microhabitat in the rhizosphere [33]. However, Canna indica has a tuber with a fibrous root structure, though the root network is less developed in comparison to Phragmites australis, which may be the reason for lower organics reduction in the case of Canna indica. Although the obtained BOD5 from treatment cells was above the effluent discharge standard of 30 mg/L recommended by the Ministry of Environment Forest and Climate Change ([34]; http://moef.gov.in, accessed on 14 January 2023), the FTW system was capable of removing >50% of BOD5 (Treated water BOD: 68 ± 40 mg/L) from the municipal sewage, especially at 50% coverage of Phragmites australis. The results indicate the need for further treatment by extending the FTW beds to increase the HRT or including a pretreatment for removing the settling matter from the domestic wastewater, to achieve the recommended effluent discharge standard by MoEF&CC. Moreover, other treatment technologies may be hyphenated with the FTW to achieve the desired discharge limits. The average decay rate for BOD ( K B O D 5 ) estimated for each treatment was 0.16 day−1 (C1), 0.185 day−1 (C2), 0.196 day−1 (C3), and 0.182 day−1 (C4) (Table 4). Organic matter decomposition is primarily the function of microorganisms in the biofilm attached to the FTW bed and the surface of the plant roots. The plants in the FTW provide O2 to their rhizosphere (for aerobic degradation) and also provide the medium for microbial degradation. Results indicate that plants and their coverage in the FTW play a major role in organic matter removal from wastewater. The lowest COD was observed in C3 (93 ± 51 mg/L, p < 0.05) followed by C1 (99 ± 44. mg/L, p > 0.05), C2 (100 ± 53 mg/L, p > 0.05), and C4 (100 ± 61 mg/L, p > 0.05). Consequently, the maximum COD removal was 50% in C3, 47% in C1, and 46% in both C2 and C4 (Figure 4b). Overall, the FTW cells (C1-C4) demonstrated a significant reduction of organic matter through both BOD5 and COD removal. The significant removal of BOD and COD in the control cell, C4, may be due to the presence of algae providing a niche Phycosphere for heterotrophic bacterial growth [35], and the symbiotic effect of both may have resulted in the oxidation of organics. The average decay rate for COD ( K C O D ) estimated for each treatment was 0.142 day−1 (C1), 0.159 day−1 (C2), 0.171 day−1 (C3), and 0.16 day−1 (C4) (Table 4). Results highlight the importance of 50% coverage of plant species Phragmites australis in organic matter removal compared with its counterpart in the FTW. In C3, patches of algal growth were observed (but were not quantified) which could have resulted in photosynthetic O2 generation. In the same cell (C3), the 50% coverage by plants (Phragmites australis) provided sufficient space for atmospheric O2 diffusion and photosynthesis for algal growth, whereas the plant root network provided a conducive environment for microbial biofilm development. The combination of these factors (in C3) contributed to the better reduction of BOD5 and COD from municipal wastewater. The higher depth (~80 cm) in the FTW cells could have limited the removal of organic matter (BOD5 and COD) to <55% due to the dead zones created at the bottom as a result of the still-developing root system of the emergent macrophytes. In some studies, higher BOD5 (~90%) removal was observed at shallow depths of <25 cm [17,36]. This study indicates that long durations of FTW experiments with fully developed root systems should be conducted to evaluate the efficacy of these systems.

3.2.4. Variation in Nutrients: Nitrate and Phosphate Removal

The removal and transformation of nutrients (NO3, and PO43−) in an FTW is largely governed by two important processes: nitrification (aerobic process, DO > 2 mg/L) and denitrification (anaerobic process; DO < 1 mg/L) [7,19,37]. In FTW treatment cells, significant low variability in NO3 concentration (1.0 to 1.7 mg/L) was observed, except in the control. The average and the median values indicate a high reduction of NO3 in the treatment cell with 100% coverage of Canna indica (C1: 1.0 ± 0.4 mg/L) significant at p < 0.05, with an overall removal efficiency of 61% (Figure 5a). Furthermore, NO3 reduction was also observed in C3 (1.7 ± 0.6 mg/L, p > 0.05) at 50% coverage of Phragmites australis with an overall removal efficiency of 33%, followed by C2 (2.3 ± 2.5 mg/L, p > 0.05), which exhibited 9% NO3 removal efficiency. However, in the control (C4: 2.8 ± 3.0 mg/L), the NO3 concentration increased by 12% more than the influent wastewater (2.5 ± 1.9 mg/L), which indicates the accumulation of NO3 due to algal decay and enhanced nitrification activity due to photosynthetic oxygen in the control [15]. The average decay rate for NO3  ( K N O 3 ) estimated for each treatment was 0.162 day−1 (C1), 0.039 day−1 (C2), 0.049 day−1 (C3), and >0.001 day−1 (C4) (Table 4).
Conversely, the average concentration of phosphate (PO43−) indicates a significantly low concentration in the control (C4, 9.3 ± 2.9 mg/L, p < 0.05) and C3 (11 ± 2.7 mg/L, p < 0.05), whereas an insignificant difference was observed in C1 (11.9 ± 3.7 mg/L, p > 0.05) and C2 (11.3 ± 4 mg/L, p > 0.05) when compared with the influent (Figure 5b). The overall removal efficiency of PO43− was 27% in the control (C4), 14% in C3, 12% in C2, and <10% in C1, indicating the maximum removal was in the control rather than in the treatment cells with plants. The PO43− reduction could be due to the growth of algae in the control. The highest decay rate ( K P O 4 ) was estimated for the control (0.372 day−1). The average decay rate for PO43−  ( K P O 4 ) estimated for each treatment was 0.018 day−1 (C1), 0.031 day−1 (C2), 0.032 day−1 (C3), and 0.372 day−1 (C4) (Table 4). The obtained results indicate that the NO3 concentration at the outlet FTW treatment cells was well below the effluent discharge standard of 10 mg/L [34]. However, the PO43− concentration was twice the effluent discharge standard of 5 mg/L [34]. In this study, no measurement or quantification of algal biomass or chlorophyll-a was conducted for the FTW cells. However, based on the observations, the growth of algae was noticeably high in the C4 cell compared with the other counterparts, which could have resulted in the reduction of PO43−. Algal biomass consumes phosphorus (60% dry weight) and nitrogen (45% dry weight) to develop intracellular building blocks, as reported by [20]. Furthermore, patches of algae were also seen in C3 with 50% coverage of Phragmites australis, which showed a 14% reduction of PO43−, indicating that plant uptake may not be the major removal source as was seen in C1 and C2 with 100% coverage of plants. However, Phragmites australis in C3 and C2 showed better reduction than Canna indica.

4. Conclusions

In this study, the performance of the Floating Treatment Wetland (FTW) using Canna indica and Phragmites australis at different coverage was evaluated for municipal wastewater (urban drain) treatment. The study highlights the importance of plant species and their coverage in pollutant removal from municipal wastewater using FTWs. Although BOD5 reduction using FTWs was not able to meet the Indian standards (<30 mg/L) for discharge of domestic wastewater into water bodies, substantial removal of BOD was observed in the treatment cell with 50% coverage of plant species Phragmites australis, indicating macrophyte coverage played a significant role. Similarly, maximum COD removal was observed for C3 (50%) with 50% coverage of Phragmites australis. The change in pH in treatment cells with an FTW (100% and 50% coverage of Canna indica and Phragmites australis) was significant, and for the cell without an FTW, it was insignificant. A slight reduction of TDS was observed which may be due to physical adsorption, precipitation, and microbial degradation in the treatment cells. Although nutrient removal was low in this study, the plant species Canna indica contributed largely to nitrate removal (61%) whereas Phragmites australis contributed to phosphate removal (14%). The growth of algae in the treatment cell further influenced PO43− reduction. Further studies should consider the role of algae within the system and lengthen the study until the decline in plant growth (senescence and dormancy) is confirmed. The appropriate selection of plant species and their coverage could further enhance pollutant removal using FTW mats.

Author Contributions

S.Y.: formal analysis (equal); investigation (equal); methodology (equal); writing—original draft (equal). J.K.: formal analysis (equal); investigation (equal); methodology (equal). S.K.M.: conceptualization (equal); formal analysis (equal); investigation (equal); methodology (equal). R.S.: conceptualization (equal); formal analysis (equal); investigation (equal); methodology (equal); resources (supporting); supervision (supporting). O.S.: funding acquisition (lead); resources (supporting); project administration (lead); supervision (supporting). V.C.G.: funding acquisition (lead); project administration (lead); supervision (lead). J.S.: writing—reviewing and editing. R.N.: writing—reviewing and editing. All authors have read and agreed to the published version of the manuscript.

Funding

This study was supported by the project “Innovation Centre for Eco-Prudent Wastewater Solutions” (IC-EcoWS; grant number-DST/TM/WTI/WIC/2k17/83), funded by the Department of Science and Technology (Government of India).

Institutional Review Board Statement

Not applicable.

Informed Consent Statement

Not applicable.

Data Availability Statement

The data used in this paper are available from the corresponding author upon reasonable request.

Acknowledgments

We are thankful to the National Institute of Hydrology (NIH), Roorkee, India, for providing the necessary resources needed for this study.

Conflicts of Interest

The authors declare that they have no financial or non-financial interest to disclose.

References

  1. Wang, C.-Y.; Sample, D.J. Assessing floating treatment wetlands nutrient removal performance through a first order kinetics model and statistical inference. Ecol. Eng. 2013, 61, 292–302. [Google Scholar] [CrossRef]
  2. Hathaway, J.M.; Cook, M.J.; Evans, R.O. Nutrient Removal Capability of a Constructed Wetland Receiving Groundwater Contaminated by Swine Lagoon Seepage. Trans. ASABE 2010, 53, 741–749. [Google Scholar] [CrossRef]
  3. Healy, M.; Rodgers, M.; Mulqueen, J. Treatment of dairy wastewater using constructed wetlands and intermittent sand filters. Bioresour. Technol. 2007, 98, 2268–2281. [Google Scholar] [CrossRef]
  4. Rangel-Peraza, J.G.; Mendivil-García, K.; Cedillo-Herrera, C.I.G.; Rochín-Medina, J.J.; Rodríguez-Mata, A.E.; Bustos-Terrones, Y.A. Optimization of organic matter degradation kinetics and nutrient removal on artificial wetlands using Eichhornia crassipes and Typha domingensis. Environ. Technol. 2019, 40, 633–641. [Google Scholar] [CrossRef]
  5. Gikas, G.D.; Pérez-Villanueva, M.; Tsioras, M.; Alexoudis, C.; Pérez-Rojas, G.; Masís-Mora, M.; Lizano-Fallas, V.; Rodríguez-Rodríguez, C.E.; Vryzas, Z.; Tsihrintzis, V.A. Low-cost approaches for the removal of terbuthylazine from agricultural wastewater: Constructed wetlands and biopurification system. Chem. Eng. J. 2018, 335, 647–656. [Google Scholar] [CrossRef]
  6. Vymazal, J. Removal of nutrients in various types of constructed wetlands. Sci. Total Environ. 2007, 380, 48–65. [Google Scholar] [CrossRef]
  7. Colares, G.S.; Dell’Osbel, N.; Wiesel, P.G.; Oliveira, G.A.; Lemos, P.H.Z.; da Silva, F.P.; Lutterbeck, C.A.; Kist, L.T.; Machado, L. Floating treatment wetlands: A review and bibliometric analysis. Sci. Total Environ. 2020, 714, 136776. [Google Scholar] [CrossRef]
  8. Abed, S.N.; Almuktar, S.A.; Scholz, M. Remediation of synthetic greywater in mesocosm—Scale floating treatment wetlands. Ecol. Eng. 2017, 102, 303–319. [Google Scholar] [CrossRef]
  9. Miguel, G.S.; Martín-Girela, I.; Ruiz, D.; Rocha, G.; Curt, M.D.; Aguado, P.L.; Fernández, J. Environmental and economic assessment of a floating constructed wetland to rehabilitate eutrophicated waterways. Sci. Total Environ. 2023, 884, 163817. [Google Scholar] [CrossRef]
  10. Borne, K.E.; Fassman, E.A.; Tanner, C.C. Floating treatment wetland retrofit to improve stormwater pond performance for suspended solids, copper and zinc. Ecol. Eng. 2013, 54, 173–182. [Google Scholar] [CrossRef]
  11. Colares, G.S.; Dell’osbel, N.; Barbosa, C.V.; Lutterbeck, C.; Oliveira, G.A.; Rodrigues, L.R.; Bergmann, C.P.; Lopez, D.R.; Rodriguez, A.L.; Vymazal, J.; et al. Floating treatment wetlands integrated with microbial fuel cell for the treatment of urban wastewaters and bioenergy generation. Sci. Total Environ. 2021, 766, 142474. [Google Scholar] [CrossRef] [PubMed]
  12. Saravanan, A.; Kumar, P.S.; Jeevanantham, S.; Karishma, S.; Tajsabreen, B.; Yaashikaa, P.; Reshma, B. Effective water/wastewater treatment methodologies for toxic pollutants removal: Processes and applications towards sustainable development. Chemosphere 2021, 280, 130595. [Google Scholar] [CrossRef] [PubMed]
  13. Sharma, R.; Vymazal, J.; Malaviya, P. Application of floating treatment wetlands for stormwater runoff: A critical review of the recent developments with emphasis on heavy metals and nutrient removal. Sci. Total Environ. 2021, 777, 146044. [Google Scholar] [CrossRef]
  14. Oliveira, G.A.; Colares, G.S.; Lutterbeck, C.A.; Dell’Osbel, N.; Machado, L.; Rodrigues, L.R. Floating treatment wetlands in domestic wastewater treatment as a decentralized sanitation alternative. Sci. Total Environ. 2021, 773, 145609. [Google Scholar] [CrossRef]
  15. Pishgar, R.; Banmann, C.L.; Chu, A. Pilot-Scale Investigation of Floating Treatment Wetlands as Retrofits to Waste-Stabilization Ponds for Efficient Domestic Wastewater Treatment. J. Environ. Eng. 2021, 147, 04021014. [Google Scholar] [CrossRef]
  16. Park, J.B.; Sukias, J.P.; Tanner, C.C. Floating treatment wetlands supplemented with aeration and biofilm attachment surfaces for efficient domestic wastewater treatment. Ecol. Eng. 2019, 139, 105582. [Google Scholar] [CrossRef]
  17. Gaballah, M.S.; Ismail, K.; Aboagye, D.; Ismail, M.M.; Sobhi, M.; Stefanakis, A.I. Correction to: Effect of design and operational parameters on nutrients and heavy metal removal in pilot floating treatment wetlands with Eichhornia crassipes treating polluted lake water. Environ. Sci. Pollut. Res. 2021, 28, 25679. [Google Scholar] [CrossRef]
  18. Kumar, S.; Dutta, V. Efficiency of Constructed Wetland Microcosms (CWMs) for the Treatment of Domestic Wastewater Using Aquatic Macrophytes. In Environmental Biotechnology: For Sustainable Future; Springer: Singapore, 2019; pp. 287–307. [Google Scholar] [CrossRef]
  19. Faulwetter, J.L.; Burr, M.D.; Cunningham, A.B.; Stewart, F.M.; Camper, A.K.; Stein, O.R. Floating treatment wetlands for domestic wastewater treatment. Water Sci. Technol. 2011, 64, 2089–2095. [Google Scholar] [CrossRef]
  20. Muñoz, R.; Guieysse, B. Algal–bacterial processes for the treatment of hazardous contaminants: A review. Water Res. 2006, 40, 2799–2815. [Google Scholar] [CrossRef]
  21. Baird, G.; Rice, E.; Posavec, S. Preparation of Common Types of Desk Reagents Specified in Standard Methods; American Public Health Association: Washington, DC, USA, 2017. [Google Scholar]
  22. Jamwal, P.; Raj, A.V.; Raveendran, L.; Shirin, S.; Connelly, S.; Yeluripati, J.; Richards, S.; Rao, L.; Helliwell, R.; Tamburini, M. Evaluating the performance of horizontal sub-surface flow constructed wetlands: A case study from southern India. Ecol. Eng. 2021, 162, 106170. [Google Scholar] [CrossRef]
  23. Sooknah, R.D.; Wilkie, A.C. Nutrient removal by floating aquatic macrophytes cultured in anaerobically digested flushed dairy manure wastewater. Ecol. Eng. 2004, 22, 27–42. [Google Scholar] [CrossRef]
  24. Tripathi, M.; Singal, S.K. Use of Principal Component Analysis for parameter selection for development of a novel Water Quality Index: A case study of river Ganga India. Ecol. Indic. 2019, 96, 430–436. [Google Scholar] [CrossRef]
  25. CPCB Central Pollution Control Board of India. 2021. Available online: https://cpcb.nic.in (accessed on 14 January 2023).
  26. Saeed, T.; Afrin, R.; Al-Muyeed, A.; Miah, J.; Jahan, H. Bioreactor septic tank for on-site wastewater treatment: Floating constructed wetland integration. J. Environ. Chem. Eng. 2021, 9, 105606. [Google Scholar] [CrossRef]
  27. Liu, N.; Yang, Y.; Li, F.; Ge, F.; Kuang, Y. Importance of controlling pH-depended dissolved inorganic carbon to prevent algal bloom outbreaks. Bioresour. Technol. 2016, 220, 246–252. [Google Scholar] [CrossRef] [PubMed]
  28. Neumann, G.; Römheld, V. Root excretion of carboxylic acids and protons in phosphorus-deficient plants. Plant Soil 1999, 211, 121–130. [Google Scholar] [CrossRef]
  29. Samal, K.; Kar, S.; Trivedi, S.; Upadhyay, S. Assessing the impact of vegetation coverage ratio in a floating water treatment bed of Pistia stratiotes. SN Appl. Sci. 2021, 3, 120. [Google Scholar] [CrossRef]
  30. Chance, L.M.G.; White, S.A. Aeration and plant coverage influence floating treatment wetland remediation efficacy. Ecol. Eng. 2018, 122, 62–68. [Google Scholar] [CrossRef]
  31. Chen, S.; Xie, J.; Wen, Z. Chapter Four—Microalgae-based wastewater treatment and utilization of microalgae biomass. In Advances in Bioenergy; Li, Y., Zhou, W., Eds.; Elsevier: Amsterdam, The Netherlands, 2021; pp. 165–198. [Google Scholar]
  32. Jamwal, P.; Phillips, D.; Gowda, R. Assessing performance of local materials for the treatment of dry weather flows in open drains: Results of semi-controlled field experiment research in Bangalore, India. Ecol. Eng. 2022, 175, 106506. [Google Scholar] [CrossRef]
  33. Moulisová, L.; Čížková, H.; Dušek, J.; Kazda, M. Root and rhizome traits of the common reed (Phragmites australis) in a constructed wetland for wastewater treatment. Ecol. Eng. 2023, 186, 106832. [Google Scholar] [CrossRef]
  34. Ministry of Environment, Forest and Climate Change (MoEF&CC), India. 2017. Available online: http://moef.gov.in (accessed on 14 January 2023).
  35. Ramanan, R.; Kim, B.-H.; Cho, D.-H.; Oh, H.-M.; Kim, H.-S. Algae–bacteria interactions: Evolution, ecology and emerging applications. Biotechnol. Adv. 2016, 34, 14–29. [Google Scholar] [CrossRef]
  36. Kadlec, R.H.; Wallace, S. Treatment Wetlands, 2nd ed.; CRC Press: Boca Raton, FL, USA, 2009. [Google Scholar]
  37. Malyan, S.K.; Yadav, S.; Sonkar, V.; Goyal, V.C.; Singh, O.; Singh, R. Mechanistic understanding of the pollutant removal and transformation processes in the constructed wetland system. Water Environ. Res. 2021, 93, 1882–1909. [Google Scholar] [CrossRef]
Figure 1. Setup of pilot-scale FTW for municipal wastewater treatment using Canna indica and Phragmites australis.
Sustainability 15 13601 g001
Figure 2. Variation in pH (a) and DO (b) concentration in the influent and the effluent of each FTW cell (C1, C2, C3, and C4 control).
Sustainability 15 13601 g002
Figure 3. Variation of EC (a), TDS (b), and Temperature (c) concentration in the influent and the effluent of each FTW cell (C1, C2, C3 and C4 control).
Sustainability 15 13601 g003
Figure 4. Variation of BOD5 (a), and COD (b) concentration in the influent and the effluent of each FTW cell (C1, C2, C3, and C4 control).
Sustainability 15 13601 g004
Figure 5. Variation of NO3, (a), and PO43− (b) concentration in the influent and the effluent of each FTW cell (C1, C2, C3, and C4 (control)).
Sustainability 15 13601 g005
Table 1. Summary of the pilot-scale floating treatment wetlands (Canna indica and Phragmites australis) for the treatment of municipal wastewater.
Operating Conditions—AttributesPilot-Scale FTW Treatment Cells
Type of wastewaterMunicipal wastewater
(Urban drain)
Number of treatment cells4
Surface area of each cell (m2)2 m2
Volume of each cell (m3)1.2 m3
Mean inflow to the cells (m3/day)0.403
Hydraulic retention time (HRT, day)3
Hydraulic loading rate (HLR, mm/day)201.6
Wetland plant species and coverageCell-1 (Canna indica, 100% coverage)
Cell-2 (Phragmites australis, 100% coverage)
Cell-3 (Phragmites australis, 50% coverage)
Cell-4 (without FTW mat: control)
Table 2. Characteristics of the municipal wastewater collected from an urban drain in Roorkee, Uttarakhand, India.
S. No.ParametersUnitsAverage ConcentrationRange
(Min–Max)
1pH-7.2 ± 1.25.0–8.1
2Electrical Conductivity (EC) µS/cm1072 ± 116823–1103
3Total Dissolved Solids (TDS) mg/L526 ± 56.7404–599
4Dissolved Oxygen (DO) mg/L0.8 ± 0.70.1–2.3
5Biochemical Oxygen Demand (BOD5) mg/L145 ± 3293.6–199
6Chemical Oxygen Demand (COD) mg/L186 ± 23.7151–225
7Nitrate (NO3) mg/L2.5 ± 1.90.7–7.2
8Phosphate (PO43−) mg/L13 ± 3.58.2–17.2
Table 3. Pollutant removal efficiency at the effluent of each FTW cell (C1, C2, C3, and C4).
ParametersInfluent (mg/L)Cell-1Cell-2Cell-3Cell-4
Eff. (mg/L)Removal (%)Eff. (mg/L)Removal (%)Eff. (mg/L)Removal (%)Eff. (mg/L)Removal (%)
pH7.2 ± 1.26.9 ± 0.8-6.8 ± 0.9-6.8 ± 0.8-7.3 ± 1.2-
EC
(µs/cm)
1072 ± 1161033 ± 113-1086 ± 253-1047 ± 213-923 ± 178-
TDS (mg/L)526 ± 57505 ± 57-482 ± 36-478 ± 52-454 ± 86-
DO (mg/L)0.8 ± 0.71.2 ± 0.7−441.6 ± 1.3−902.2 ± 1.9−1752.3 ± 2.3−188
BOD5 (mg/L)145 ± 3273 ± 385070 ± 405268 ± 405371 ± 5051
COD (mg/L)186 ± 2499 ± 4447100 ± 534693 ± 5150100 ± 6146
NO3 (mg/L)2.5 ± 1.91.0 ± 0.4612.3 ± 2.591.7 ± 0.6332.8 ± 3.0−12
PO43− (mg/L)13 ± 3.511.9 ± 3.7711.3 ± 41211 ± 2.7149.3 ± 2.927
Table 4. Volumetric decay rate constants of four treatment cells (Average).
Decay Rate Constant at 20 °C
(Day−1)
C1C2C3C4
KBOD5 0.160 ± 0.0830.185 ± 0.1280.196 ± 0.1120.182 ± 0.160
KCOD0.142 ± 0.0780.159 ± 0.1380.171 ± 0.1250.160 ± 0.134
KNO30.162 ± 0.1100.039 ± 0.2160.049 ± 0.184>0.001 ± 0.098
KPO40.018 ± 0.0540.031 ± 0.0600.032 ± 0.0350.372 ± 0.068
Disclaimer/Publisher’s Note: The statements, opinions and data contained in all publications are solely those of the individual author(s) and contributor(s) and not of MDPI and/or the editor(s). MDPI and/or the editor(s) disclaim responsibility for any injury to people or property resulting from any ideas, methods, instructions or products referred to in the content.

