Abstract
China is currently experiencing severe water scarcity issues in its agricultural production sector. To address this challenge, the Chinese government has taken steps towards implementing a nationwide reform in agricultural water pricing to accelerate the more sustainable management of the agricultural water resources sector. The present study adopted a multiple regression model to test four alternative irrigation water charging methodologies (charges based on ladder pricing, time, land area, and electricity) accompanied by supportive agricultural pricing policies to address the inherent conflicts between water conservation and agricultural development goals. This study focused on the Wei River Basin, which is recognized as a highly water-stressed region in China. This basin was chosen as a pilot area for comprehensive reform initiatives related to agricultural water pricing and served as the geographical scope for our research. Between June and July of 2022, we conducted comprehensive field surveys within the Wei River Basin, accumulating a dataset of 415 data points pertaining to the crop year of 2022. Our results showed that the ladder water price-based method exhibited remarkable potential in achieving substantial savings, with a minimum of 60.5239 m3/mu of irrigation water conserved for food crops and an impressive 67.8090 m3/mu for cash crops. However, regarding water-saving irrigation technologies, the estimation results indicated that electricity-based charging outperformed the other methods, resulting in an impressive 55.22% increase when ladder pricing served as the benchmark. In addition, regarding agricultural green production, the results for food crops and cash crops are different, with food crops being more sensitive to the ladder water price policies. Moreover, the results suggested that different water charging methods have significant heterogeneity effects from the perspective of the farmers’ scale, land fragmentation, and water price awareness capacity. This study forges an innovative path for water-stressed nations to execute agricultural water pricing reform and enhance agricultural production’s sustainable growth.
1. Introduction
Climate change, increased demand, urbanization, and changing dietary patterns are all increasing the strains placed on accessible water supplies worldwide, with more than 40% of the world’s population experiencing a water crisis [1]. Additionally, water consumption has increased dramatically, leading to a decline in urban ground subsidence and the rise of snowfall lines, ultimately intensifying the contradiction of water competitors among various water sectors [2]. As the world’s largest food producer, China’s agricultural water scarcity has a particularly severe impact on agricultural production and food security [3] and will be subjected to supply and demand pressures. On the supply side, conflict with other users stimulates stress on agricultural systems, which are major water users, to free up water for other purposes and boost their performance [4]. On the demand side, irrigation is critical to agricultural output, with approximately 65% of food crops and 90% of vegetable crops being produced on irrigated farmland, which is a situation that will face great demand pressure [5]. In this setting, agricultural authorities have used demand management measures, as expanding the water delivery capacity is only sometimes practicable or effectual [6]. As a policy tool for demand management, market-based water pricing instruments have been given priority, and it is agreed that agricultural pricing signals can assist in regulating broad water usage and promoting water conservation [7]. Agricultural water pricing is a complex process that needs to consider various factors, including water price composition, water rights allocation, and water users’ ability to pay. Water pricing can show the economic value of this water valuable resource and encourages water uses to more wisely utilize water resources [8]. Additionally, pricing can guide farmers to adopt irrigation technology with high irrigation efficiency or to change to a more productive cropping pattern [9]. Furthermore, numerous studies have supported the application of charging policies (including volumetric, nonvolumetric, water market pricing, and incremental water charging) to demonstrate multifaceted impacts in agriculture in both developed and developing countries, such as reducing water use [10,11], generating significant income losses [12], and increasing irrigation modernization [13].
Due to this background, the No. 1 document of the Chinese central government released in 2016 advocated the complete execution of an agricultural water pricing reform program [14]. One of the essential aspects of the document was to raise water prices to cover water suppliers’ operating and maintenance costs within 10 years [15]. Since the reform was proposed, many studies have been conducted on the impact of China’s water price reform, although opinions on the effectiveness of pricing tools in practice differ [16]. Research shows that suitable water prices motivate farmers to employ sophisticated irrigation technologies and modify their planting structure to improve their efficiency in water use [17]. In contrast, others believe that the invisibility of this water-saving effect results in a loss of producer income and a lack of initiative in agricultural production [18]. These conflicting perspectives highlight the complexities of the elements influencing the validity of water pricing strategies and their consequent economic effects [19]. Although the literature has been particularly attentive to water prices and has examined the issue from several angles [20], an inadequate level of attention has been given to the different agricultural irrigation water charging methods for sustainable agricultural production, such as water conservation, water-saving technology, planting structure, and green agricultural production.
According to the literature, three primary water charging techniques depend on the economic and natural characteristics of the irrigation methods: volumetric, nonvolumetric, and water market pricing [8]. According to Tsur and Dinar [21], volumetric charges are based on directly assessing water consumption. However, sophisticated pricing systems based on volumetric measurements are costly to implement and maintain [22]. Nonvolumetric pricing is determined by area, production, or land value. While it is a commonly used policy instrument in many regions worldwide, its impact on water conservation is minor, because the marginal cost of applying additional water per acre is zero [23,24]. Marked-based charges per unit of water utilized are thus intended to incentivize farmers to decrease their water-related agricultural expenses by utilizing water more effectively [25]. However, the water demand is relatively nonprice elastic; thus, significant decreases in water consumption occur only in relatively high price ranges [26]. Among the available studies, very few analyze the multidimensional effects and regional heterogeneity of the different charge methods, while the vast bulk concentrate on evaluating the impact of the strategies on one or two factors [24,27]. Therefore, the current study aims to fill a critical void in the literature.
The Wei River Basin is one of China’s most developed agricultural regions; nonetheless, the agricultural industry in this area suffers from severe water shortages, with just 17.7% of the national water resource average per hectare of arable land [28]. From the perspective of policy implementation conditions, this region is the pilot zone for comprehensive agricultural water price reform in China; some sites have installed water meters, which are conducive to agricultural water volumetric management. In addition, some of the Wei River Basin’s irrigation water sources are groundwater, and all irrigation wells have electrical meters. Therefore, it is appropriate and necessary to use the Wei River Basin as the research target area; the research results can also be used as points of reference for agricultural water management in other water shortage areas around the world. Utilizing the dry Chinese Wei River Basin as an example, the current study’s precise aims are as follows: (i) ascertain the effects of various irrigation water charging methods on farmers’ planting practices, water conservation, and green agricultural production; (ii) determine which multiple charge methods are most suitable for mitigating the adverse effects of water policy on rural revival; and (iii) analyze the heterogeneity of the different multiple water charging methods for water conservation and rural regeneration to achieve acceptability by regional stakeholders of agricultural water price reform.
2. Materials and Methods
2.1. Econometric Model
The present study focuses on applying the multiple regression (MR) model to explore the impacts of different water charging methods on farmers’ production behavior. This is the most classically used model for examining the relationship between multiple predictor variables (or independent variables) and a single criterion variable (or the dependent variable) [29]. It allows for investigating the impact of multiple factors simultaneously, which is important when assessing the effectiveness of different water charging methodologies on water conservation. Based on the purpose of our study, the model developed in this research is as follows:
where denotes the variables of agricultural production we are concerned with, including irrigated water requirements, irrigation modes, planting structures, and agricultural green production; represents different water charging methods, including the four different water charging methods we investigated in the study area; is the sociostatistical variables of farmers and their households, the planting production variables, and the subjective perception variables of farmers’ water policies; and refers to a random disturbance term: is the intercept item of the model, is the regression coefficient corresponding to the different water charging methods, and is a vector of the coefficient of the control variables, including individual characteristics and household economic factors.
Since probit models are effective in modeling binary outcomes and farmers’ adoption of water-saving irrigation technology is a typical binary variable, this research employs a probit model to examine the effect of different agricultural water charging methods on farmers’ adoption of water-saving irrigation technology, which is conducted as follows:
where = 1 indicates that the farmer has adopted water-saving irrigation technology; otherwise, = 0. The core explanatory variables are different water charging methods. The control variables denote the sociostatistical variables of farmers and their households, planting production variables, and subjective cognitive variables of farmers on water resource policies and water-saving irrigation technology. is a random disturbance term, represents the intercept term, denotes the regression coefficient associated with various water charging methods, and signifies a vector encompassing the coefficients of the control variables, which incorporate individual characteristics and household economic factors.
2.2. Selection of Related Variables
In this paper, farmers’ sustainable agricultural production behavior is recognized as the dependent variable, which is represented by water-saving technology, the planting structure, and green production. The core independent variable represents the four different irrigation water pricing methodologies—namely, the ladder, time, land area, and electricity-based approaches, which are represented by a dummy variable; that is, if farmer i uses one of the charging methods, the value is 1; otherwise, the value is 0. According to relevant research on regression analyses [30,31], farmers’ agricultural production behavior depends on individual or family internal factors and the external environment. Therefore, along with the household head characteristics (age of household head, gender of household head, and education level of household head) and household management characteristics (family planting years, the proportion of planting income, planting area, and number of family agricultural workers), the study chose farmers’ subjective perceptions (attitude towards the current agricultural water prices and the influence of increasing water prices) to be the core control variable.
2.3. Study Area Description
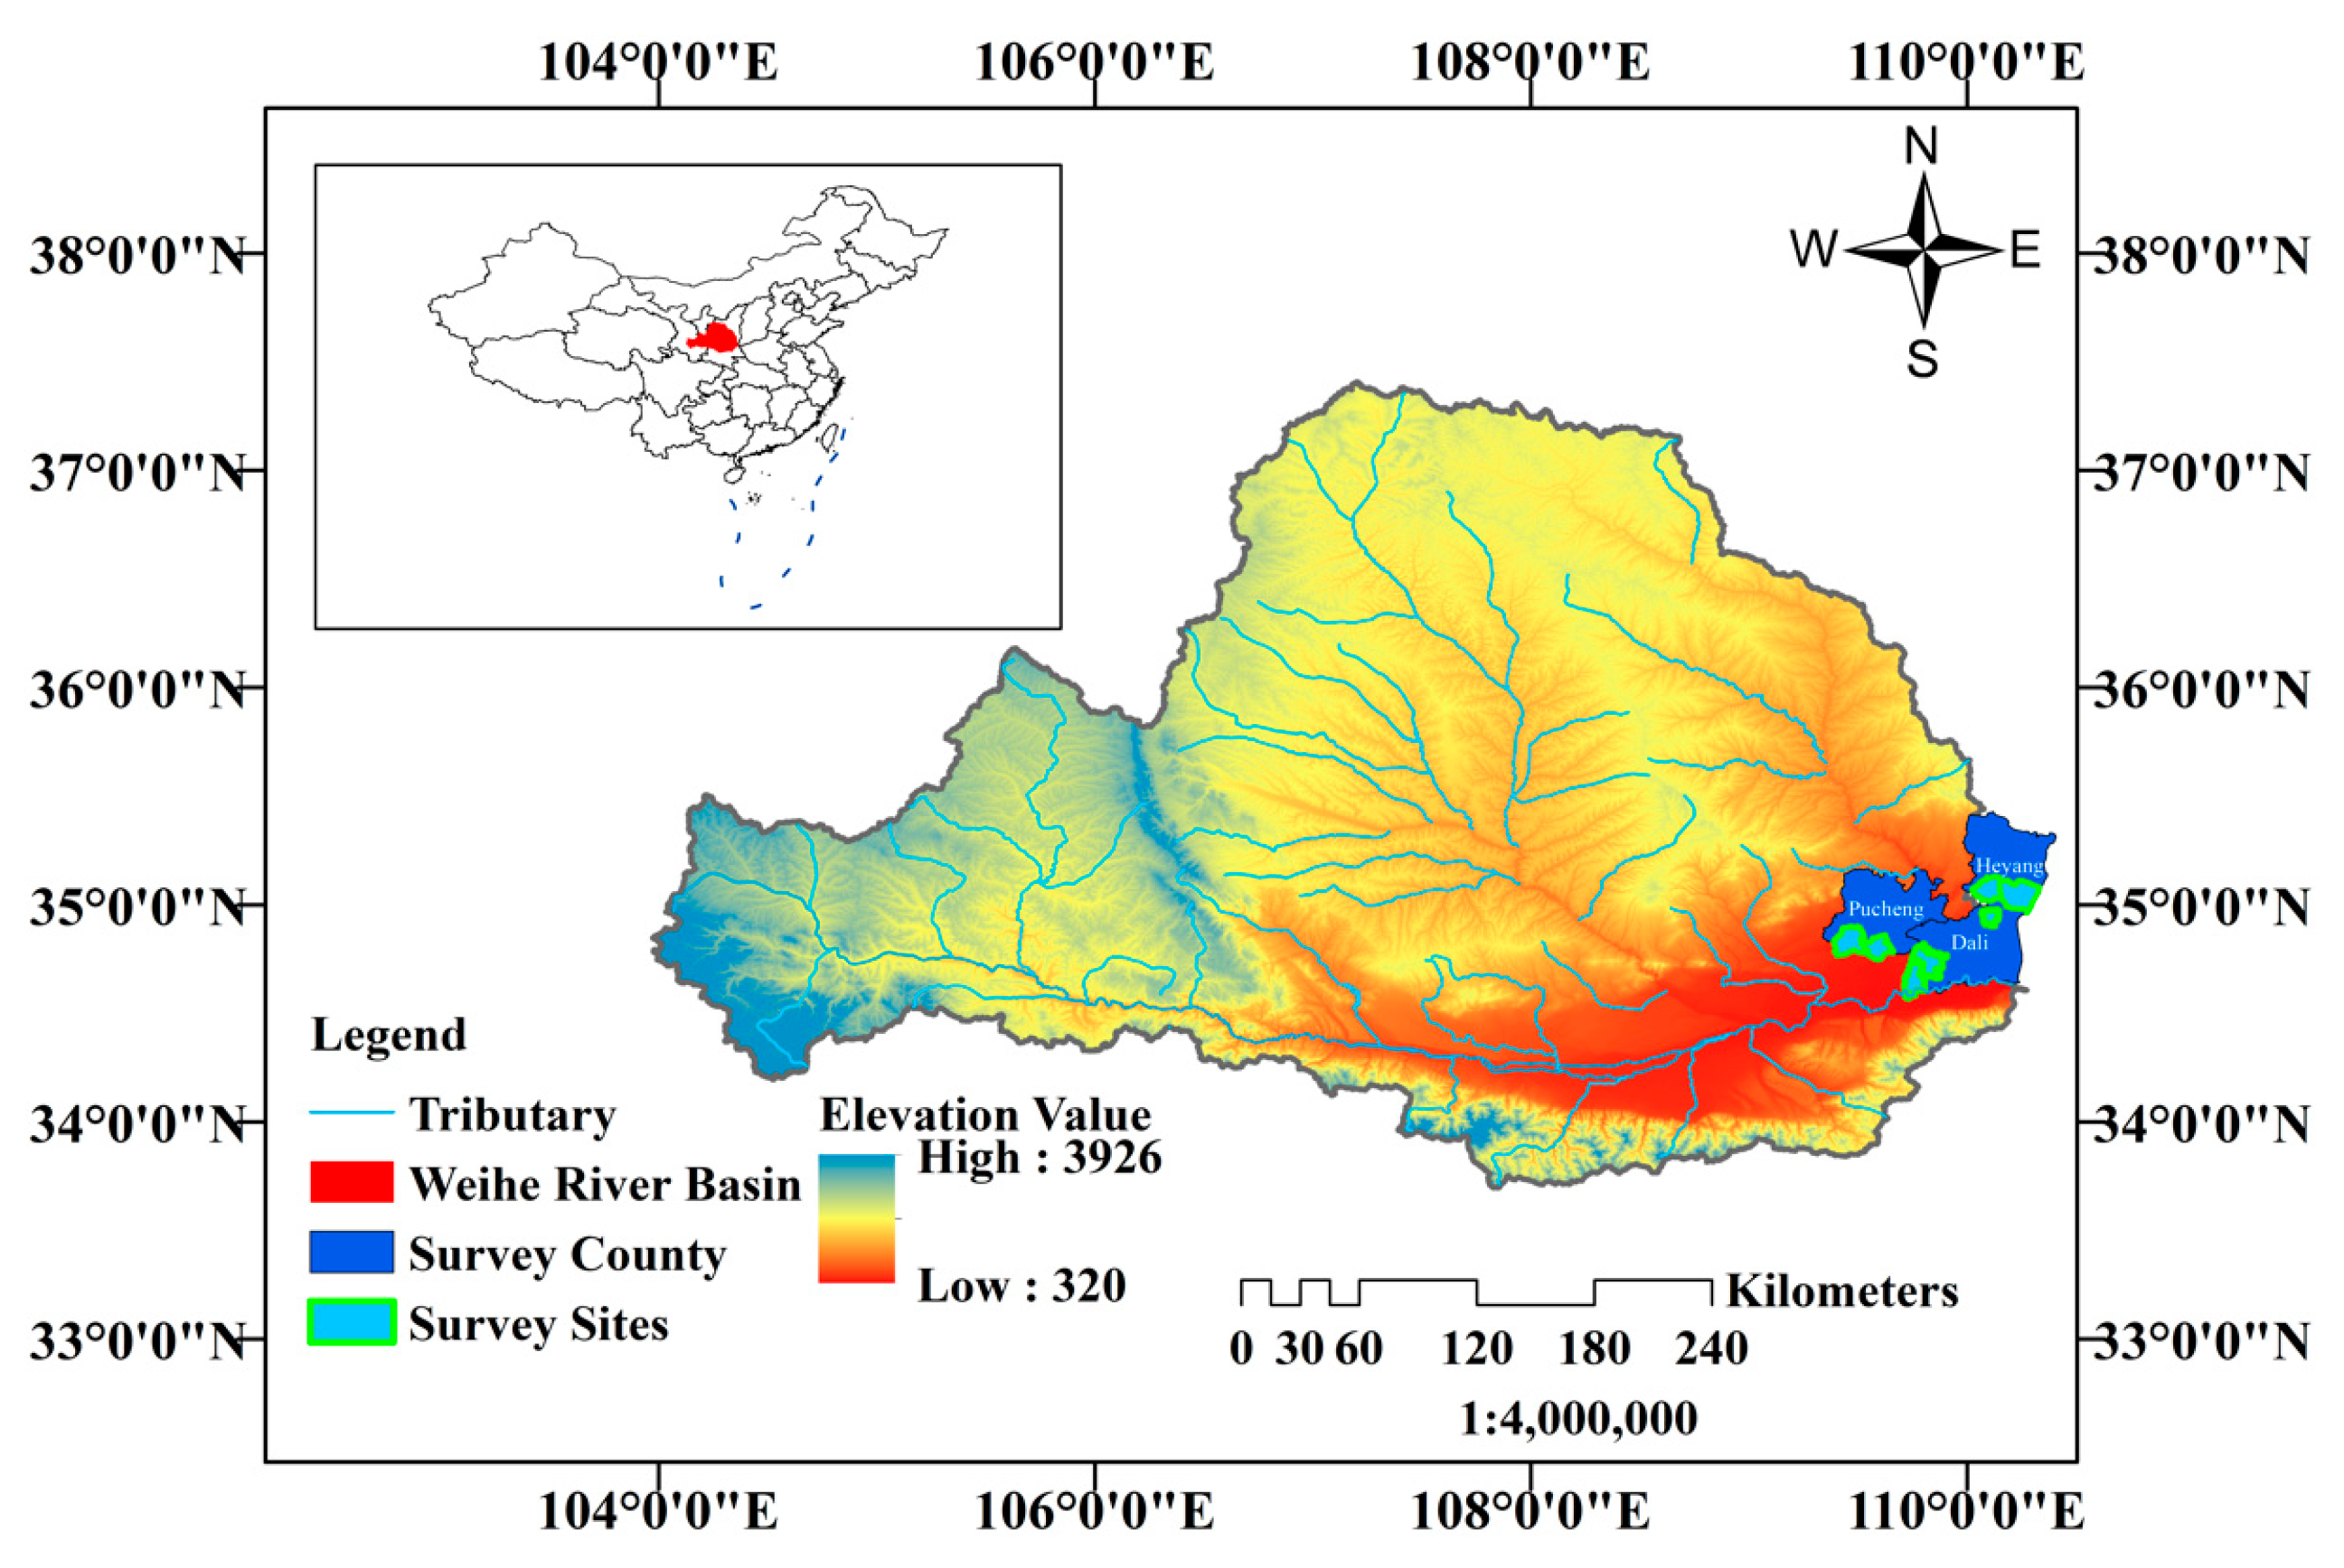
The study was carried out in the Wei River Basin (WRB), the largest tributary of the Yellow River, an important foodstuff base in China. The WRB (Figure 1) runs from the Niushu Mountains in the hilly loess area across three provinces and 26 counties in Gansu, Ningxia, and Shaanxi [32]. The WRB has a continental monsoon climate with an annual precipitation of 600–800 mm, with most falling between May and October, resulting in an unequal regional and temporal distribution of water resources [33]. Natural streamflow as the main source of surface water plays a key role in agricultural irrigation and socioeconomic development in the basin. The tributaries are small and long, and water energy resources are scarce [34]. As the Yellow River’s greatest initial tributary, the WRB not only delivers a vast amount of irrigation water to the Guanzhong Plain downstream but also performs a significant role in guaranteeing the nation’s food security. These regions are conducive to cultivating a diverse range of crops, which collectively contribute to one-third of the total grain production in Shaanxi Province. Additionally, the area extensively cultivates vegetables, fruits, and other commercial crops, exhibiting a high multiple-cropping index. The primary food crops grown within the irrigation areas include wheat, maize, and beans, while the commercial crops encompass fruits and vegetables. Sprinklers and drip irrigation are the most common water-saving irrigation technologies, whereas ditch and flood irrigation approaches are considered classic in the area. However, with the acceleration of urbanization, agricultural water is being squeezed out by industrial and domestic water, which leads to the availability and demand for irrigation water resources increasing in conflict. Therefore, agricultural water pricing reform has been raised in the area to alleviate water scarcity by pricing leverage, which provides guidance and reference for China’s agricultural water management.
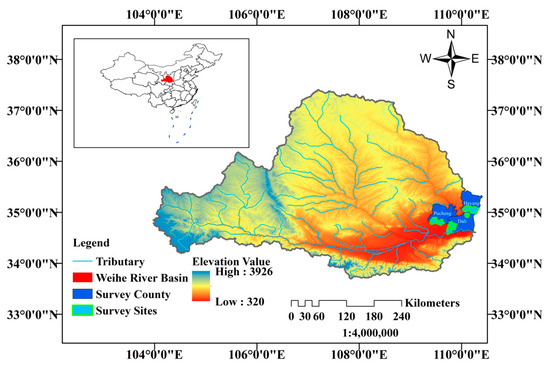
Figure 1.
Location of the study area and the field survey sites.
There are four water pricing charge methods used in the study area—namely, ladder pricing, charges based on land area, charges based on hours, and charges based on electricity. As the pilot area of agricultural water pricing reform, some sites have installed water meters, which means that the water is calculated by volume and charged according to ladder pricing. One recognized method in the study area is the usage of two-tier pricing, where the first tier’s price is set at an affordable level of 0.342 CNY/m3. However, the price paid at the second tier, which occurs when one exceeds their quota in light of the increasing water shortages or the peak of the irrigation season, is 0.366 CNY/m3. The other three charging methods have worked well in areas where metering facilities have not been installed. Therefore, this study took the ladder pricing charging method as the benchmark to explore the impacts of the different water charging methods on agricultural production.
2.4. Data Collection and Analysis
The pilot study was conducted in the WRB in July 2021, and 12 villages were randomly chosen for field inquiry. During the presurvey, we conducted face-to-face interactions with village farmers and managers to gather information about the current water price charging methods and related agricultural production activities. The preliminary survey collected a total of 88 valid questionnaires. The final questionnaire was constructed and modified according to the analysis and compilation of the preliminary research data.
Following the preliminary survey, formal research was conducted in the Wei River Basin from June to July 2022. We combined “county—township—village—farmers” stratification and random sampling to choose villages for face-to-face interviews. Finally, thirteen trained investigators conducted the survey. First, 8 towns were purposefully selected as promotion zones for comprehensive regional agricultural water pricing reform. Then, 4 villages were picked at random from each town. Furthermore, for each town, we randomly chose approximately 20 family farms on which to process a questionnaire interview to uncover the micro-relationship between water demand, water price, and the planting structure. Finally, 461 farmers were questioned, resulting in 415 valid observations and a total planted acreage of 400.19 hectares. The questionnaire was organized into three main portions and was built upon previous questionnaires published in the literature. The first section of the questionnaire inquired about the farmers’ socioeconomic characteristics. The second section of the questionnaire focused on the farmers’ fundamental planting conditions. The third section concentrated on water consumption during the growing season, irrigation modes, and green production behavior. Table 1 presents the total sown area of the major agricultural products in the survey area. As seen from Table 1, maize and winter jujube are representative crops with the largest planting areas among the food and cash crops, respectively; therefore, this study used these two crops as the main research and reference objects. According to Dong et al. [32], in this study, wheat, which average water consumption per mu is 287.86 m3, i.e., the middle value among all crops planted in the study area, was used as the benchmark to classify low-water-consuming crops and high-water-consuming crops. Accordingly, crops with a higher average water consumption per mu than wheat were considered high-water-consuming crops; otherwise, they were considered low-water-consuming crops. Table 2 shows the definitions and descriptive statistics for each variable. All the data were analyzed using Stata 17.0.

Table 1.
Total planting area and water consumption per mu for the survey crop samples.
Table 2.
Variable definitions and the results of the summary statistics survey.
3. Results
The heteroskedasticity and multicollinearity tests were conducted on the models in this paper, and the results showed that they passed all these tests, indicating that the model results were robust. Stata17.0 was used for regression, and the estimated results are shown in Table 3, Table 4, Table 5, Table 6, Table 7 and Table 8. All columns used robust standard errors.
Table 3.
Influence of different water charges methods on irrigation water consumption.
Table 4.
Impacts of charges methods on the planting structure and irrigation modes.
Table 5.
Effects of the water charges methods on agricultural green production.
Table 6.
Heterogeneity of the different water charges methods for irrigation consumption and green production from the perspective of farmers’ scales.
Table 7.
Heterogeneity of the different water charges methods for the planting structure and irrigation mode from the perspective of farmers’ scale.
Table 8.
Heterogeneity of the different water charges methods for irrigation consumption and green production from the perspective of land fragmentation.
3.1. Different Irrigation Water Charging Methods for Sustainable Agricultural Development
3.1.1. Influences of Water Charging Methods on Irrigation Water Consumption
Compared to the irrigation water ladder charges method, Table 3 reports that the coefficients of the other three charges methods are positive at the 1% level, demonstrating that charges based on the time, electricity, and land area methods lead to an increase in the average acreage of water consumption for maize. Specifically, charging by time, electricity, and land area increase maize irrigation water consumption by approximately 60.5239 m3/mu, 128.0562 m3/mu, and 255.8743 m3/mu, respectively. Meanwhile, the results for winter jujubes are similar to those for maize. Charges based on time, electricity, and land area increase the irrigation water consumption for winter jujubes by approximately 155.5871 m3/mu, 67.8090 m3/mu, and 329.3508 m3/mu, respectively, compared to the ladder charging method. Based on the above research results, performing a ladder water price policy for the comprehensive reform of agricultural water prices is essential to irrigation water savings.
3.1.2. Impacts of the Water Charging Methods on the Planting Structure and Irrigation Modes
As demonstrated in Columns 1 and 2 in Table 4, water charges based on land area and electricity statistically increase the ratio of farmers growing high-water-consuming crops by 32.13% and 29.65%, respectively, compared to the ladder pricing method. In contrast, charges based on time are negatively statistically significant at the 1% level compared to those of the ladder pricing method, indicating that this method can decrease the proportion of farmers growing high-water-consuming crops by 11.75%.
As seen from Columns 3 and 4 in Table 4, charges calculated by time and land area are negative and statistically significant at the 1% level, indicating that the two charging methods discourage farmers from adopting water-saving irrigation technologies compared to ladder pricing. In contrast, charges based on electricity are positively significant at the 5% statistical level, which suggests an increase in the likelihood of farmers adopting water-saving irrigation techniques by 55.22% compared to the ladder pricing method. In general, the tiered water pricing policy helps to restrain the planting of water-intensive crops and increases the adoption of water-saving technologies, although other charging methods also perform well in some small ways.
3.1.3. Effects of the Water Charging Methods on Agricultural Green Production
In this study, the usage of farmers’ pesticides and fertilizers during the process of planting is utilized to assess the influence of various water charging methods on green production. For maize, the results in Columns 1 to 4 in Table 5 show that, when compared to ladder pricing, charges based on land area are significantly positive at the 1% level, indicating that this method increases the consumption of fertilizers and pesticides. However, charges based on the time and electricity methods are shown to have no significant effect on farmers’ fertilizer and pesticide consumption. In terms of jujube, the results in Columns 5 to 8 prove that charges based on time, land area, and electricity are all significantly positive at the 1% level, suggesting that these three methods all increase fertilizer usage when compared to ladder water pricing. Additionally, the methods of charging by electricity and land area similarly induce winter jujube farmers to increase the amount of pesticides used, while charging by time has no significant influence compared to ladder water pricing. Moreover, the method of charging by time increases such use the most, while the method of charging by land area increases such use the second most. In summary, whether for food crops or cash crops, the tiered water pricing-based approach is more conducive to the green production behavior of farmers.
3.2. Heterogeneity Analysis of the Different Water Charging Method Effects
3.2.1. Farmers’ Scale Samples
This paper uses the average planting size to classify farming households [35]. Those whose planting size was less than the average of 10.64 mu were considered small-scale farmers, while others were considered large-scale farmers. Considering irrigation water consumption, the results in Table 6 show that, for small-scale farmers, the ladder pricing method significantly decreases irrigation water consumption at the 1% level for maize and winter jujubes when comparing charges based on the other three methods; however, charges based on electricity have no influence on winter jujubes. In contrast, in terms of large-scale farmers, charges based on ladder pricing reduce water consumption for maize but have no significant effect on winter jujube when compared to the other methods. From the perspective of agricultural green production, Table 6 indicates that charges based on land area increase fertilizers and pesticides for maize farmers when compared to the ladder pricing method. However, for winter jujube farmers, none of the other three methods were shown to have a significant effect on agricultural green production compared to the ladder pricing method. For the planting structure, as shown in Table 7, charges based on land area and electricity increase high-water-consumptive crops for both small- and large-scale farmers, while charges based on time increase low-water-consumptive crops for small-scale farmers when compared to the ladder pricing method. Moreover, compared to ladder pricing, charges based on land area restrain farmers from adopting water-saving technology for both small- and large-scale farmers, while charges based on time and electricity have no heterogeneity impact on farmers’ scale. In summary, small-scale farmers are more sensitive to water prices than large-scale farmers with regard to sustainable agricultural production.
3.2.2. Land Fragmentation Samples
This paper defines a degree of land fragmentation above the average value of 1.81 (mu/plot) as high land fragmentation; otherwise, it is low. The results in Table 8 show that the ladder pricing method significantly decreases maize and winter jujube irrigation water consumption for both high and low land fragmentation samples compared to the other three charge methods, indicating that the different charging methods have no obvious heterogeneity based on land fragmentation. For fertilizer usage, ladder pricing significantly reduces the application of fertilizer on winter jujube with high land fractionalization characteristics, while it has no significant influence on low land fractionalization in comparison to the other charging methods; this suggests distinct heterogeneous effects. Interestingly, different charging methods were found to have no significant heterogeneous impact on pesticide usage from the view of land fragmentation for either crop. As can also be seen in Table 9, ladder pricing has a significant increase in the adoption of irrigation water-saving technology for the low land fragmentation samples but no effect for the high land fragmentation samples, thereby demonstrating the existence of a heterogeneous influence.
Table 9.
Heterogeneity of the different water charges methods for the planting structure and irrigation mode from the perspective of land fragmentation.
3.2.3. Agricultural Water Price Reform Cognition Samples
This paper defines farmers who acknowledge comprehensive information on water price reform as having strong information cognition. Otherwise, their agricultural water price reform cognition is defined as weak. As shown in Table 10, the ladder pricing method increases irrigation water consumption for both farmers with strong cognitive and weak cognitive abilities and whether the crop is maize or winter jujube, suggesting that there is no statistical heterogeneity. The result is inconsistent with reality, which will be discussed later. As expected, ladder pricing reduces pesticide application on maize and winter crops among farmers with strong cognitive characteristics while it has no significance for farmers with weak cognitive characteristics compared to the other three charging methods.
Table 10.
Heterogeneity of the different water charges methods for irrigation consumption and green production based on water price reform cognition.
Moreover, ladder pricing decreases the likelihood of farmers with strong cognitive characteristics planting high-water-consuming crops compared to the electricity and land area-based approaches, while charging by time increases the planting of high-water-consuming crops. Overall, the results shown in Table 11 also reveal that ladder pricing has a stronger effect on strong cognition farmers’ adoption of water-saving technology compared to that of weak cognition farmers.
Table 11.
Heterogeneity of the different water charges methods for planting structure and irrigation mode based on water price reform cognition.
4. Discussion
A water charge may be a financial tool designed to conserve water and increase water productivity by improving the cultivation of crops that require less water, investing in water-saving technologies, redistributing water to high-value agriculture and other sectors, and combating water pollution [36]. Regarding pricing mechanisms, developing countries encounter several common hurdles in agricultural water management compared to developed countries, resulting in limited progress in water price management in developing countries [37]. However, China is moving towards more sustainable agricultural water management through the nationwide implementation of agricultural water price reform [38]. This quantitative water price reform has been substantially supported by popularizing precision measuring facilities, building water delivery networks, and constructing and restoring agricultural water conservation projects [39]. Ladder pricing is one of the critical components of comprehensive agricultural water pricing reform to achieve effective water prices and ensure food subsistence needs [40]. However, the existing research results on the impact of the ladder water charge-based approach remain controversial [23,41], and knowledge gaps exist regarding the impact of different irrigation charging methods on agricultural production and their heterogeneity when compared to ladder pricing [42]. Therefore, this research innovatively examines how different irrigation charge methods can influence water consumption, the planting structure, irrigation modes, and green production.
Overall, our study shows that the ladder pricing approach performed best regarding irrigation water savings when compared to charges based on time, land area, and electricity. This conclusion is consistent with the findings of other studies and demonstrates that quota water pricing is more likely to reduce water consumption [24]. This is probably because water costs under the metered water method are directly related to water consumption, resulting in higher water-saving efficiency and a strong awareness of water conservation [42]. To reduce the cultivation of water-intensive crops, charges based on the time approach work best. Farmers’ total irrigation costs are higher under this charging method, which will cause farmers to replace water-intensive crops with low-intensity crops [43]. In terms of water-saving irrigation technologies, the estimation results show that charging based on electricity performs the best when ladder pricing is set as the benchmark. One possible reason is that farmers are more inclined to cultivate high-profit economic crops under the electricity charging method, leading to higher net benefits from adopting water-saving irrigation technologies [44]. This finding is in contrast to the research of Ujjayant (2019) [45], whose study argued that time-based charges would promote farmers’ adoption of water-saving irrigation technologies. The discrepancy in these research results lies in the differences in the natural environment and agricultural production conditions; for example, the responses of farmers and the relative strength of the water demand elasticity largely depend on factors such as the agronomy region and system [46].
Different agricultural water charging policies make farmers face different marginal water costs through different pricing methods, thus affecting farmers’ green production behavior [47]. Regarding agricultural green production, the results for food crops and cash crops are different. For maize, the ladder pricing-based approach is the best method for reducing the consumption of fertilizers and pesticides. The reason for this is that the income gained from food crops is relatively low, so farmers try to reduce their input as much as possible; however, water costs based on a tiered water price are relatively high, which means that farmers choose to reduce their use of fertilizers, pesticides, and other inputs to ensure their maximum income [48]. In contrast, for cash crops, the economic returns are higher than those for food crops. In the face of higher water charges, farmers usually use more fertilizers and more pesticides to ensure high yields and thus obtain higher returns [49]. From this perspective, our results demonstrate that the absolute value of the water price elasticity of cash crops will be lower than that of food crops, which further indicates that the green production demand of cash crops is less sensitive to water prices than that of food crops. However, to date, there have been no relevant studies conducted to compare the different water charging methods from the perspective of agricultural green production.
The results of the heterogeneity analysis show that the implementation of the ladder water pricing policy is more water-efficient for small-scale farmers with high-fragmented characteristics. The reason may be that, under high price conditions, farmers with these characteristics often rely on water-saving irrigation methods, resulting in a higher irrigation efficiency [50]. The condition of the land and the quality of information both influence farmers adopting water-saving irrigation technologies [51]. Similar studies have shown that farmers of medium- and large-sized farm tend to use field-scale irrigation savings to increase their cropped areas, while farmers with a high perception of water scarcity also tend to adopt water-saving technologies [20,52]. The results also indicate that, to promote a shift in crop cultivation patterns and reduce the proportion of high-water-consuming crops, implementing a time-based charging system is more likely to achieve the desired outcome, particularly among small-scale, low-fragmentation, and information-sensitive farmers. The total irrigation costs are higher under such a charging system, while the adjusted crop production is relatively lower. Large-scale operations have been identified as a practical approach to promoting green production [53]. This finding is comparable to that of [54], who also indicated that large-scale farmers are more likely to embrace agricultural green production technology than small-scale farmers. Small-scale maize farmers who lack the resources for large-scale operations can still contribute to green production by adopting an electricity-based water charging method. This method allows farmers to closely monitor their electricity consumption and translate it Into production costs. These f”rmer’ can actively engage in green production practices by reducing their fertilizer usage to achieve cost savings. Unexpectedly, the results indicate that there is no statistical heterogeneity in the effect on water consumption between farmers with strong and weak cognitive abilities. This is because farmers do not know much about the agricultural water price reform at present; therefore, they urgently need the government to do a good job with regard to increasing farmers’ cognition.
5. Conclusions and Policy Implications
Agricultural water pricing reform is critical for developing countries to move towards a sustainable agricultural sector. This study presents a case study in the Wei River Basin Irrigation District in Northwest China for uniting the multiple objective problems in agricultural production with different water charging methods based on a multiple regression model. Throughout the abovementioned research results, we found evidence that, compared to irrigation water charges based on land area, time, and electricity, a ladder-based water pricing policy substantially affects irrigation water savings and the green production behavior with regard to comprehensive agricultural water price reform. Moreover, the ladder water pricing policy helps reduce the planting of water-intensive crops and increases the adoption of water-saving technologies, although there are also individually significant samples. Overall, the heterogeneous results demonstrate that, from the perspectives of irrigation water consumption, the planting structure, and water-saving technology, charges based on ladder pricing have a stronger effect on small-scale farmers than on large-scale farmers. Differently, compared to farmers with low land fragmentation, ladder pricing has a stronger impact on farmers with high land fragmentation, especially with regard to water saving and changes in the planting structure. As expected, compared to charges based on time, land area, and electricity, ladder pricing reduces pesticide application to maize and winter crops and increases the adoption of water-saving technology among farmers with strong cognitive characteristics. However, there is no significant heterogeneity effect on agricultural green production.
Given the preceding conclusions, the corresponding policy suggestions are proposed. First, the extent of agricultural water price reform implementation should be expanded. By enhancing China’s agricultural water pricing mechanism, water-saving incentive mechanism, agricultural subsidy mechanism, irrigation system operation and management mechanism, and water quota mechanism, the proposed reform will promote water conservation in the field of agriculture and guarantee efficient irrigation system operation. Second, water price reform should be implemented accurately and effectively. Given the differences in the economic development levels and geographic conditions in different irrigation areas, to completely exploit the role of the water pricing policy in promoting sustainable agriculture development, governments can develop policies based on local conditions, and each region should select a water pricing model and a path that are appropriate for the local conditions. Third, given that farmers’ awareness influences the water price reform, the government can conduct village pilot studies to obtain partial information related to farmers’ recognition and enhance their perception on participating in agricultural water price reform through community and peer-to-peer dissemination among farmers.
Nevertheless, our study does have a few limitations. First, due to the limited survey data available in 2022, this paper conducted an empirical analysis of the various charging methods on sustainable agricultural production from a single period, without considering the temporal dimension. Future research could benefit from a larger sample size spanning multiple time periods to supplement the results and provide a more comprehensive understanding of the relationship between water pricing policies and farmers’ behaviors. Second, our investigation focused solely on agricultural water price reform in the Wei River Basin, and the impact of such reforms on agricultural production in other pilot areas remains uncertain. Therefore, future research should consider using more representative regions for agricultural water pricing to update and further validate our findings.
Author Contributions
Conceptualization, L.M. and C.L.; methodology, C.L. and Z.T.; software, C.L. and B.Z.; formal analysis, L.M. and C.L.; resources, L.M. and Z.T.; writing—original draft preparation, L.M. and C.L.; visualization, B.Z.; supervision, L.M. and C.L.; and project administration, L.M. and X.Q. All authors have read and agreed to the published version of the manuscript.
Funding
This research was funded by the National Natural Science Foundation of China (42001221); the major projects of the Humanities and Social Sciences Base of the Ministry of Education (22JJD790052); the third Xinjiang Scientific Expedition and Research Program (No. 2022xjkk0305); Shaanxi Social Science Fund (2022D049); the Fundamental Research Funds for the Central University of Shaanxi Normal University (2022ZYYB25).
Institutional Review Board Statement
Not applicable.
Informed Consent Statement
Not applicable.
Data Availability Statement
All data generated or analyzed during this study are included in this published article.
Conflicts of Interest
The authors declare no conflict of interest.
References
- Christoforidou, M.; Borghuis, G.; Seijger, C.; van Halsema, G.E.; Hellegers, P. Food security under water scarcity: A comparative analysis of Egypt and Jordan. Food Secur. 2023, 15, 171–185. [Google Scholar] [CrossRef]
- Saenz, C. Keeping up with the flow: Using multiple water strategies to earn social license to operate in the Peruvian mining industry. Resour. Policy 2022, 77, 102687. [Google Scholar] [CrossRef]
- FAO. The State of Food and Agriculture 2020: Overcoming Water Challenges in Agriculture; FAO: Rome, Italy, 2020. [Google Scholar]
- Auci, S.; Vignani, D. Irrigation water intensity and climate variability: An agricultural crops analysis of Italian regions. Environ. Sci. Pollut. Res. 2021, 28, 63794–63814. [Google Scholar] [CrossRef]
- Yan, Y.; Wang, R.; Chen, S.; Zhang, Y.; Sun, Q. Three-dimensional agricultural water scarcity assessment based on water footprint: A study from a humid agricultural area in China. Sci. Total. Environ. 2023, 857, 159407. [Google Scholar] [CrossRef]
- Carvalho, T.M.N.; de Souza Filho, F.d.A. A data-driven model to evaluate the medium-term effect of contingent pricing policies on residential water demand. Environ. Chall. 2021, 3, 100033. [Google Scholar] [CrossRef]
- Chebil, A.; Soula, R.; Souissi, A.; Bennouna, B. Efficiency, valuation, and pricing of irrigation water in northeastern Tunisia. Agric. Water Manag. 2022, 266, 107577. [Google Scholar] [CrossRef]
- Al-Rubaye, S. Agricultural irrigation pricing: Review of theories and practices. Irrig. Drain. 2019, 68, 129–139. [Google Scholar] [CrossRef]
- Pérez-Blanco, C.; Standardi, G.; Mysiak, J.; Parrado, R.; Gutiérrez-Martín, C. Incremental water charging in agriculture. A case study of the regione emilia romagna in Italy. Environ. Model. Softw. 2016, 78, 202–215. [Google Scholar] [CrossRef]
- Brito, P.L.C.; Azevedo, J.P.S. Charging for Water Use in Brazil: State of the Art and Challenges. Water Resour. Manag. 2020, 34, 1213–1229. [Google Scholar] [CrossRef]
- Rivers, N.; Groves, S. The Welfare Impact of Self-supplied Water Pricing in Canada: A Computable General Equilibrium Assessment. Environ. Resour. Econ. 2013, 55, 419–445. [Google Scholar] [CrossRef]
- Molden, D.; Oweis, T.; Steduto, P.; Bindraban, P.; Hanjra, M.A.; Kijne, J. Improving agricultural water productivity: Between optimism and caution. Agric. Water Manag. 2010, 97, 528–535. [Google Scholar] [CrossRef]
- Medellín-Azuara, J.; Howitt, R.; Harou, J. Predicting farmer responses to water pricing, rationing and subsidies assuming profit maximizing investment in irrigation technology. Agric. Water Manag. 2012, 108, 73–82. [Google Scholar] [CrossRef]
- Chou, L.; Dai, J.; Qian, X.; Karimipour, A.; Zheng, X. Achieving sustainable soil and water protection: The perspective of agricultural water price regulation on environmental protection. Agric. Water Manag. 2021, 245, 106583. [Google Scholar] [CrossRef] [PubMed]
- Mu, L.; Wang, C.; Xue, B.; Wang, H.; Li, S. Assessing the impact of water price reform on farmers’ willingness to pay for agricultural water in northwest China. J. Clean. Prod. 2019, 234, 1072–1081. [Google Scholar] [CrossRef]
- Zhou, Q.; Zhang, Y.; Wu, F. Can Water Price Improve Water Productivity? A Water-Economic-Model-Based Study in Heihe River Basin, China. Sustainability 2022, 14, 6224. [Google Scholar] [CrossRef]
- Schoengold, K.; Sunding, D.L. The impact of water price uncertainty on the adoption of precision irrigation systems. Agric. Econ. 2015, 45, 729–743. [Google Scholar] [CrossRef]
- Garrone, P.; Grilli, L.; Marzano, R. Incentives to water conservation under scarcity: Comparing price and reward effects through stated preferences. J. Clean. Prod. 2020, 244, 118632. [Google Scholar] [CrossRef]
- Sapino, F.; Pérez-Blanco, C.D.; Gutiérrez-Martín, C.; García-Prats, A.; Pulido-Velazquez, M. Influence of crop-water production functions on the expected performance of water pricing policies in irrigated agriculture. Agric. Water Manag. 2022, 259, 107248. [Google Scholar] [CrossRef]
- Pronti, A.; Auci, S.; Mazzanti, M. Adopting sustainable irrigation technologies in Italy: A study on the determinants of inter- and intra-farm diffusion. Econ. Innov. New Technol. 2023, 1–24. [Google Scholar] [CrossRef]
- Dinar, A.; Tsur, Y. Efficiency and Equity Considerations in Pricing and Allocating Irrigation Water; Social Science Electronic Publishing: New York, NY, USA, 1995. [Google Scholar]
- FAO. Water Factsheet Country of Iraq; FAO: Rome, Italy, 2004. [Google Scholar]
- Mamitimin, Y.; Feike, T.; Doluschitz, R. Bayesian network modeling to improve water pricing practices in northwest china. Water 2015, 7, 5617–5637. [Google Scholar] [CrossRef]
- Feike, T.; Henseler, M. Multiple policy instruments for sustainable water management in crop production—a modeling study for the chinese aksu-tarim region. Ecol. Econ. 2017, 135, 42–54. [Google Scholar] [CrossRef]
- Dinar, A.; Mody, J. Irrigation water management policies: Allocation and pricing principles and implementation experience. Nat. Resour. Forum 2004, 28, 112–122. [Google Scholar] [CrossRef]
- Davidson, B.; Hellegers, P. Estimating the own-price elasticity of demand for irrigation water in the Musi catchment of India. J. Hydrol. 2011, 408, 226–234. [Google Scholar] [CrossRef]
- Liu, Y.; Huang, J.; Wang, J. The impact of water pricing policy on water use in irrigation and crop income. China Econ. Q 2015, 14, 1375–1392. [Google Scholar]
- Yue, S.; Li, H.; Zhao, L. Impact of Climate and Land Use Changes on Water Scarcity in the Wei River Basin. Res. Soil Water Conserv. 2021, 28, 95–101. [Google Scholar]
- Mizumoto, A. Calculating the relative importance of multiple regression predictor variables using dominance analysis and random forests. Lang. Learn. 2023, 73, 161–196. [Google Scholar] [CrossRef]
- Li, G.; Ma, D.; Zhao, C.; Li, H. The Effect of the Comprehensive Reform of Agricultural Water Prices on Farmers’ Planting Structure in the Oasis–Desert Transition Zone—A Case Study of the Heihe River Basin. Int. J. Environ. Res. Public Health 2023, 20, 4915. [Google Scholar] [CrossRef]
- Aldaya, M.M.; Gutiérrez-Martín, C.; Espinosa-Tasón, J.; Ederra, I.; Sánchez, M. The impact of the territorial gradient and the irrigation water price on agricultural production along the first phase of the Navarra Canal in Spain. Agric. Water Manag. 2023, 281, 108245. [Google Scholar] [CrossRef]
- Deng, W.; Song, J.; Sun, H.; Cheng, D.; Zhang, X.; Liu, J.; Kong, F.; Wang, H.; Khan, A.J. Isolating of climate and land surface contribution to basin runoff variability: A case study from the Weihe River Basin, China. Ecol. Eng. 2020, 153, 105904. [Google Scholar] [CrossRef]
- Mu, L.; Mou, M.; Tang, H.; Gao, S. Exploring preference and willingness for rural water pollution control: A choice experiment approach incorporating extended theory of planned behaviour. J. Environ. Manag. 2023, 332, 117408. [Google Scholar] [CrossRef] [PubMed]
- Li, Y.; Yao, S.; Deng, Y.; Jia, L.; Hou, M.; Gong, Z. Spatio-Temporal Study on Supply and Demand Matching of Ecosystem Water Yield Service—A Case Study of Wei River Basin. Pol. J. Environ. Stud. 2020, 30, 1677–1693. [Google Scholar] [CrossRef]
- Zhigang, X.; Junyi, Z.; Kaiyu, L. The Scale of Operation, Term of Land Ownership and the Adoption of Inter-temporal Agricultural Technology: An Example of “Straw Return to Soil Directly”. Chin. Rural. Econ. 2018, 3, 61–74. [Google Scholar]
- Molle, F.; Berkoff, J. Irrigation Water Pricing: The Gap between Theory and Practice; Cabi: Wallingford, UK, 2007; p. 360. [Google Scholar]
- Rouillard, J.; Rinaudo, J.-D. From State to user-based water allocations: An empirical analysis of institutions developed by agricultural user associations in France. Agric. Water Manag. 2020, 239, 106269. [Google Scholar] [CrossRef]
- Zhang, C.-Y.; Oki, T. Water pricing reform for sustainable water resources management in China’s agricultural sector. Agric. Water Manag. 2023, 275, 108045. [Google Scholar] [CrossRef]
- Momeni, M.; Zakeri, Z.; Esfandiari, M.; Behzadian, K.; Zahedi, S.; Razavi, V. Comparative analysis of agricultural water pricing between Azarbaijan Provinces in Iran and the state of California in the US: A hydro-economic approach. Agric. Water Manag. 2019, 223, 105724. [Google Scholar] [CrossRef]
- Nikouei, A.; Ward, F.A. Pricing irrigation water for drought adaptation in Iran. J. Hydrol. 2013, 503, 29–46. [Google Scholar] [CrossRef]
- Wang, J.; Zhang, L.; Huang, J. How could we realize a win–win strategy on irrigation price policy? Evaluation of a pilot reform project in Hebei Province, China. J. Hydrol. 2016, 539, 379–391. [Google Scholar] [CrossRef]
- Fujin, Y.; Rong, X.; Jinxia, W. Water Price, Quota or Irrigated Area Tax? An Examination of Agricultural Water Policies in Haihe River Basin. China Rural. Surv. 2019, 1, 33–50. [Google Scholar]
- Minjun, S.; Xiaojun, W.; Hong, Y.; Tao, W. Pricing or Quota? A Solution to Water Scarcity in Oasis Regions in China: A Case Study in the Heihe River Basin. Sustainability 2014, 6, 7601–7620. [Google Scholar]
- Li, J.; Wang, Z.B. Farmers’ Behavior of Adopting Water-saving Irrigation Technology Based on Probit and Tobit Double Model—A Case Study of Zhangye City. Water Sav. Irrig. 2017, 12, 85–89. [Google Scholar]
- Chakravorty, U.; Dar, M.; Emerick, K. Inefficient water pricing and incentives for conservation. Appl. Econ. 2023, 15, 319–350. [Google Scholar] [CrossRef]
- Gómez-Limón, J.A.; Riesgo, L. Water pricing: Analysis of differential impacts on heterogeneous farmers. Water Resour. Res. 2004, 40, W07S05. [Google Scholar] [CrossRef]
- Esmaeili, A.; Vazirzadeh, S. Water pricing for agricultural production in the South of Iran. Water Resour. Manag. 2009, 23, 957–964. [Google Scholar] [CrossRef]
- Mosbah, E.; Zaibet, L.; Dharmapala, P.S. A new methodology to measure efficiencies of inputs (outputs) of decision making units in Data Envelopment Analysis with application to agriculture. Socio-Econ. Plan. Sci. 2020, 72, 100857. [Google Scholar] [CrossRef]
- Liu, Y.; Zou, L.; Wang, Y. Spatial-temporal characteristics and influencing factors of agricultural eco-efficiency in China in recent 40 years. Land Use Policy 2020, 97, 104794. [Google Scholar] [CrossRef]
- Huang, Q.; Wang, J.; Li, Y. Do water saving technologies save water? Empirical evidence from North China. J. Environ. Econ. Manag. 2017, 82, 1–16. [Google Scholar] [CrossRef]
- Yuan, K.; Yang, Z.; Wang, S. Water scarcity and adoption of water-saving irrigation technologies in groundwater over-exploited areas in the North China Plain. Irrig. Sci. 2021, 39, 397–408. [Google Scholar] [CrossRef]
- Ahmad, M.-U.; Masih, I.; Giordano, M. Constraints and opportunities for water savings and increasing productivity through Resource Conservation Technologies in Pakistan. Agric. Ecosyst. Environ. 2014, 187, 106–115. [Google Scholar] [CrossRef]
- Baojing, G.; Jiakun, D.; Chenchen, R.; Sitong, W.; Chen, W. Large-scale farming promotes agricultural green development in China. J. Agric. Resour. Environ. 2021, 38, 709–715. [Google Scholar]
- Mao, H.; Zhou, L.; Ying, R.; Pan, D. Time Preferences and green agricultural technology adoption: Field evidence from rice farmers in China. Land Use Policy 2021, 109, 105627. [Google Scholar] [CrossRef]
Disclaimer/Publisher’s Note: The statements, opinions and data contained in all publications are solely those of the individual author(s) and contributor(s) and not of MDPI and/or the editor(s). MDPI and/or the editor(s) disclaim responsibility for any injury to people or property resulting from any ideas, methods, instructions or products referred to in the content. |
© 2023 by the authors. Licensee MDPI, Basel, Switzerland. This article is an open access article distributed under the terms and conditions of the Creative Commons Attribution (CC BY) license (https://creativecommons.org/licenses/by/4.0/).