Abstract
In this study, we examined the effect of CO2 injection into deep saline aquifers, considering impurities present in blue hydrogen production. A fluid model was designed for reservoir conditions with impurity concentrations of 3.5 and 20%. The results showed that methane caused density decreases of 95.16 and 76.16% at 3.5 and 20%, respectively, whereas H2S caused decreases of 99.56 and 98.77%, respectively. Viscosity decreased from 0.045 to 0.037 cp with increasing methane content up to 20%; however, H2S did not affect the viscosity. Notably, CO2 with H2S impacted these properties less than methane. Our simulation model was based on the Gorae-V properties and simulated injections for 10 years, followed by 100 years of monitoring. Compared with the pure CO2 injection, methane reached its maximum pressure after eight years and eleven months at 3.5% and eight years at 20%, whereas H2S reached maximum pressure after nine years and two months and nine years and six months, respectively. These timings affected the amount of CO2 injected. With methane as an impurity, injection efficiency decreased up to 73.16%, whereas with H2S, it decreased up to 81.99% with increasing impurity concentration. The efficiency of CO2 storage in the dissolution and residual traps was analyzed to examine the impact of impurities. The residual trap efficiency consistently decreased with methane but increased with H2S. At 20% concentration, the methane trap exhibited higher efficiency at the end of injection; however, H2S had a higher efficiency at the monitoring endpoint. In carbon capture and storage projects, methane impurities require removal, whereas H2S may not necessitate desulfurization due to its minimal impact on CO2 storage efficiency. Thus, the application of carbon capture and storage (CCS) to CO2 emissions containing H2S as an impurity may enable economically viable operations by reducing additional costs.
1. Introduction
The South Korean government announced the “First Master Plan for implementing the Hydrogen Economy” in November 2021, the goal of which was to become a leading country in the hydrogen economy. They intended to produce 750,000 tons of blue hydrogen by 2030 and 2 million tons by 2050, according to the Ministry of Trade, Industry, and Energy in 2021 [1]. Blue hydrogen is produced using fossil fuels to generate hydrogen, and the resulting CO2 is captured and stored using carbon capture and storage (CCS) technology to prevent its atmospheric release. This is the most cost-effective method for producing clean hydrogen. One notable project in this field is the CarbonNet Project, which occurred in Victoria, Australia. Additionally, in 2023, Republic of Korea plans to implement CCS in the East Sea Gas Field, which is a depleted gas reservoir, and gradually expand its usage.
There are two methods of hydrogen production using fossil fuels: steam methane reforming (SMR) using natural gas and coal gasification. During hydrogen production, methane and H2S are generated in addition to hydrogen and CO2. The greenhouse effect of methane is approximately 20-fold that of CO2, whereas H2S is highly toxic; therefore, its atmospheric emissions are regulated. When conducting CCS projects, pure CO2 is injected because impurities in CO2 can cause an increase in the two-phase region, resulting in potential transportation issues as the critical point changes. According to a report by the International Energy Agency Greenhouse Gas R&D Programme in 2011, depending on the type of impurity, compared to pure CO2, storage capacity can be reduced by up to 40% when injected at a depth of 895 m [2]. However, removing impurities from CO2 requires installing desulfurization devices or using membranes, which incur additional costs.
In the LaBarge gas field operated by ExxonMobil in Wyoming, a gas mixture consisting of 70% H2S and 30% CO2 is injected [3]. In the Borzecin gas field in Poland, enhanced gas recovery (EGR) is the objective, and a gas mixture containing 20% H2S and CO2 is injected into the subaqueous zone of a gas–water reservoir [4]. Furthermore, Carbfix, a project conducted in Iceland, observed faster mineralization when a mixture of H2S and CO2 generated from a geothermal power plant was injected into basaltic formations than with pure CO2 [5].
Nogueira and Mamora [6] experimentally reported that impurities, such as nitrogen, oxygen, water, sulfur dioxide, nitrous oxide, and carbon monoxide, are present at approximately 1% when storing CO2 in depleted gas fields and storing the same amount of pure CO2 is possible. The impure CO2 injection does not significantly affect storage efficiency. However, this study has the limitation of lower impurity concentrations than those encountered under actual field conditions [6]. Li et al. (2017) confirmed that nitrogen is included as an impurity, and compared to that of pure CO2, its density decreases, resulting in rapid vertical movement of the gas plume, reaching the top of the reservoir, followed by a relatively large horizontal dispersion [7]. Gaus, Azaroual, and Czernichowski-Lauriol evaluated the impact of CO2 diffusion in the cap rock of the Sleipner field using a one-dimensional model and found a decrease in porosity owing to geochemical reactions [8]. Cho et al. [9] developed a simulation model for water alternating gas (WAG) using CO2 and methane. The simulation results showed that methane inclusion reduced miscibility, leading to improved oil recovery, minimized changes in permeability and porosity, and reduced moisture content in the reservoir [9]. Due to the recent increase in data availability, the application of AI in the CCS field is expanding and aiding in faster decision-making [10,11]. Kim et al. [10] presented an artificial neural network (ANN) model to predict CO2 storage efficiency in deep saline aquifers, validated against the Gorae-V structure—a potential saline aquifer for CO2 storage in Republic of Korea [10]. Sedaghat and Rouhinakhsh used the least square support vector machine (LSSVM) to study the vapor–liquid equilibrium (VLE) and phase behavior of impure CO2, such as nitrogen, hydrogen, oxygen, and argon [11]. Schöneich, May, and Vosteen observed that the density and storage capacity decreases when CO2 contains argon, oxygen, nitrogen, carbon monoxide, and hydrogen impurities. However, this study did not consider reservoir flow through simulation but used thermodynamic calculators, which have limitations in assessing the impact of H2S and methane [12].
The literature demonstrates the possibility of injecting impure CO2 based on the type and concentration of impurities and the characteristics of the storage reservoir. However, research involving impurities in CCS has primarily focused on enhanced oil recovery (EOR) and EGR, and limitations have been observed concerning lower impurity concentrations than those encountered under actual field conditions. Herein, we examined CO2 injection into deep saline aquifers, considering impurities present in blue hydrogen production. The properties of the Gorae-V structure were obtained, and a 3D model was created to investigate the injection of impure CO2 using the reservoir simulation software GEM 2023.10 developed by CMG. Impurities that can be generated during hydrogen production, such as methane and H2S, which are regulated by atmospheric emissions, were selected. The concentration of impurities included in CO2 was set to a realistic level for field applications. The changes in properties that occur when these impurities are present in CO2 were calculated, and the pressure changes in the reservoir and variations in CO2 storage capacity were researched according to the type and concentration of impurities.
2. Theoretical Background
First, understanding hydrogen production methods that use fossil fuels and the types of impurities is necessary to evaluate the impact of the impurities generated during hydrogen production in CCS, which can be involved in the CO2 capture process. Hydrogen production from fossil fuels can be divided into natural gas and coal gasification methods. The typical method for producing hydrogen using natural gas is SMR, which involves reacting methane with water to produce hydrogen and carbon monoxide, as shown in Equation (1). Equation (2) describes the water–gas shift (WGS) reaction that converts carbon monoxide into hydrogen and CO2. To prevent corrosion in an SMR reactor, natural gas should be pretreated to capture H2S using desulfurization or capture devices. In the CO2 capture process, methane that does not react with water is captured along with CO2. Understanding the effects of impurities entering the storage layer is crucial [13].
Coal gasification involves the partial oxidation of pulverized coal using a gasifier to produce synthesis gas, which consists primarily of carbon monoxide and hydrogen. The composition of syngas varies depending on coal composition, and methane and H2S can be generated during the gasification process. Coal gasification is primarily performed in the form of an integrated gasification combined cycle, and the major chemical reactions involved are shown in Equations (3)–(5). The carbon monoxide emitted from the gasifier is converted to hydrogen through a WGS reaction, similar to Equation (2) [14].
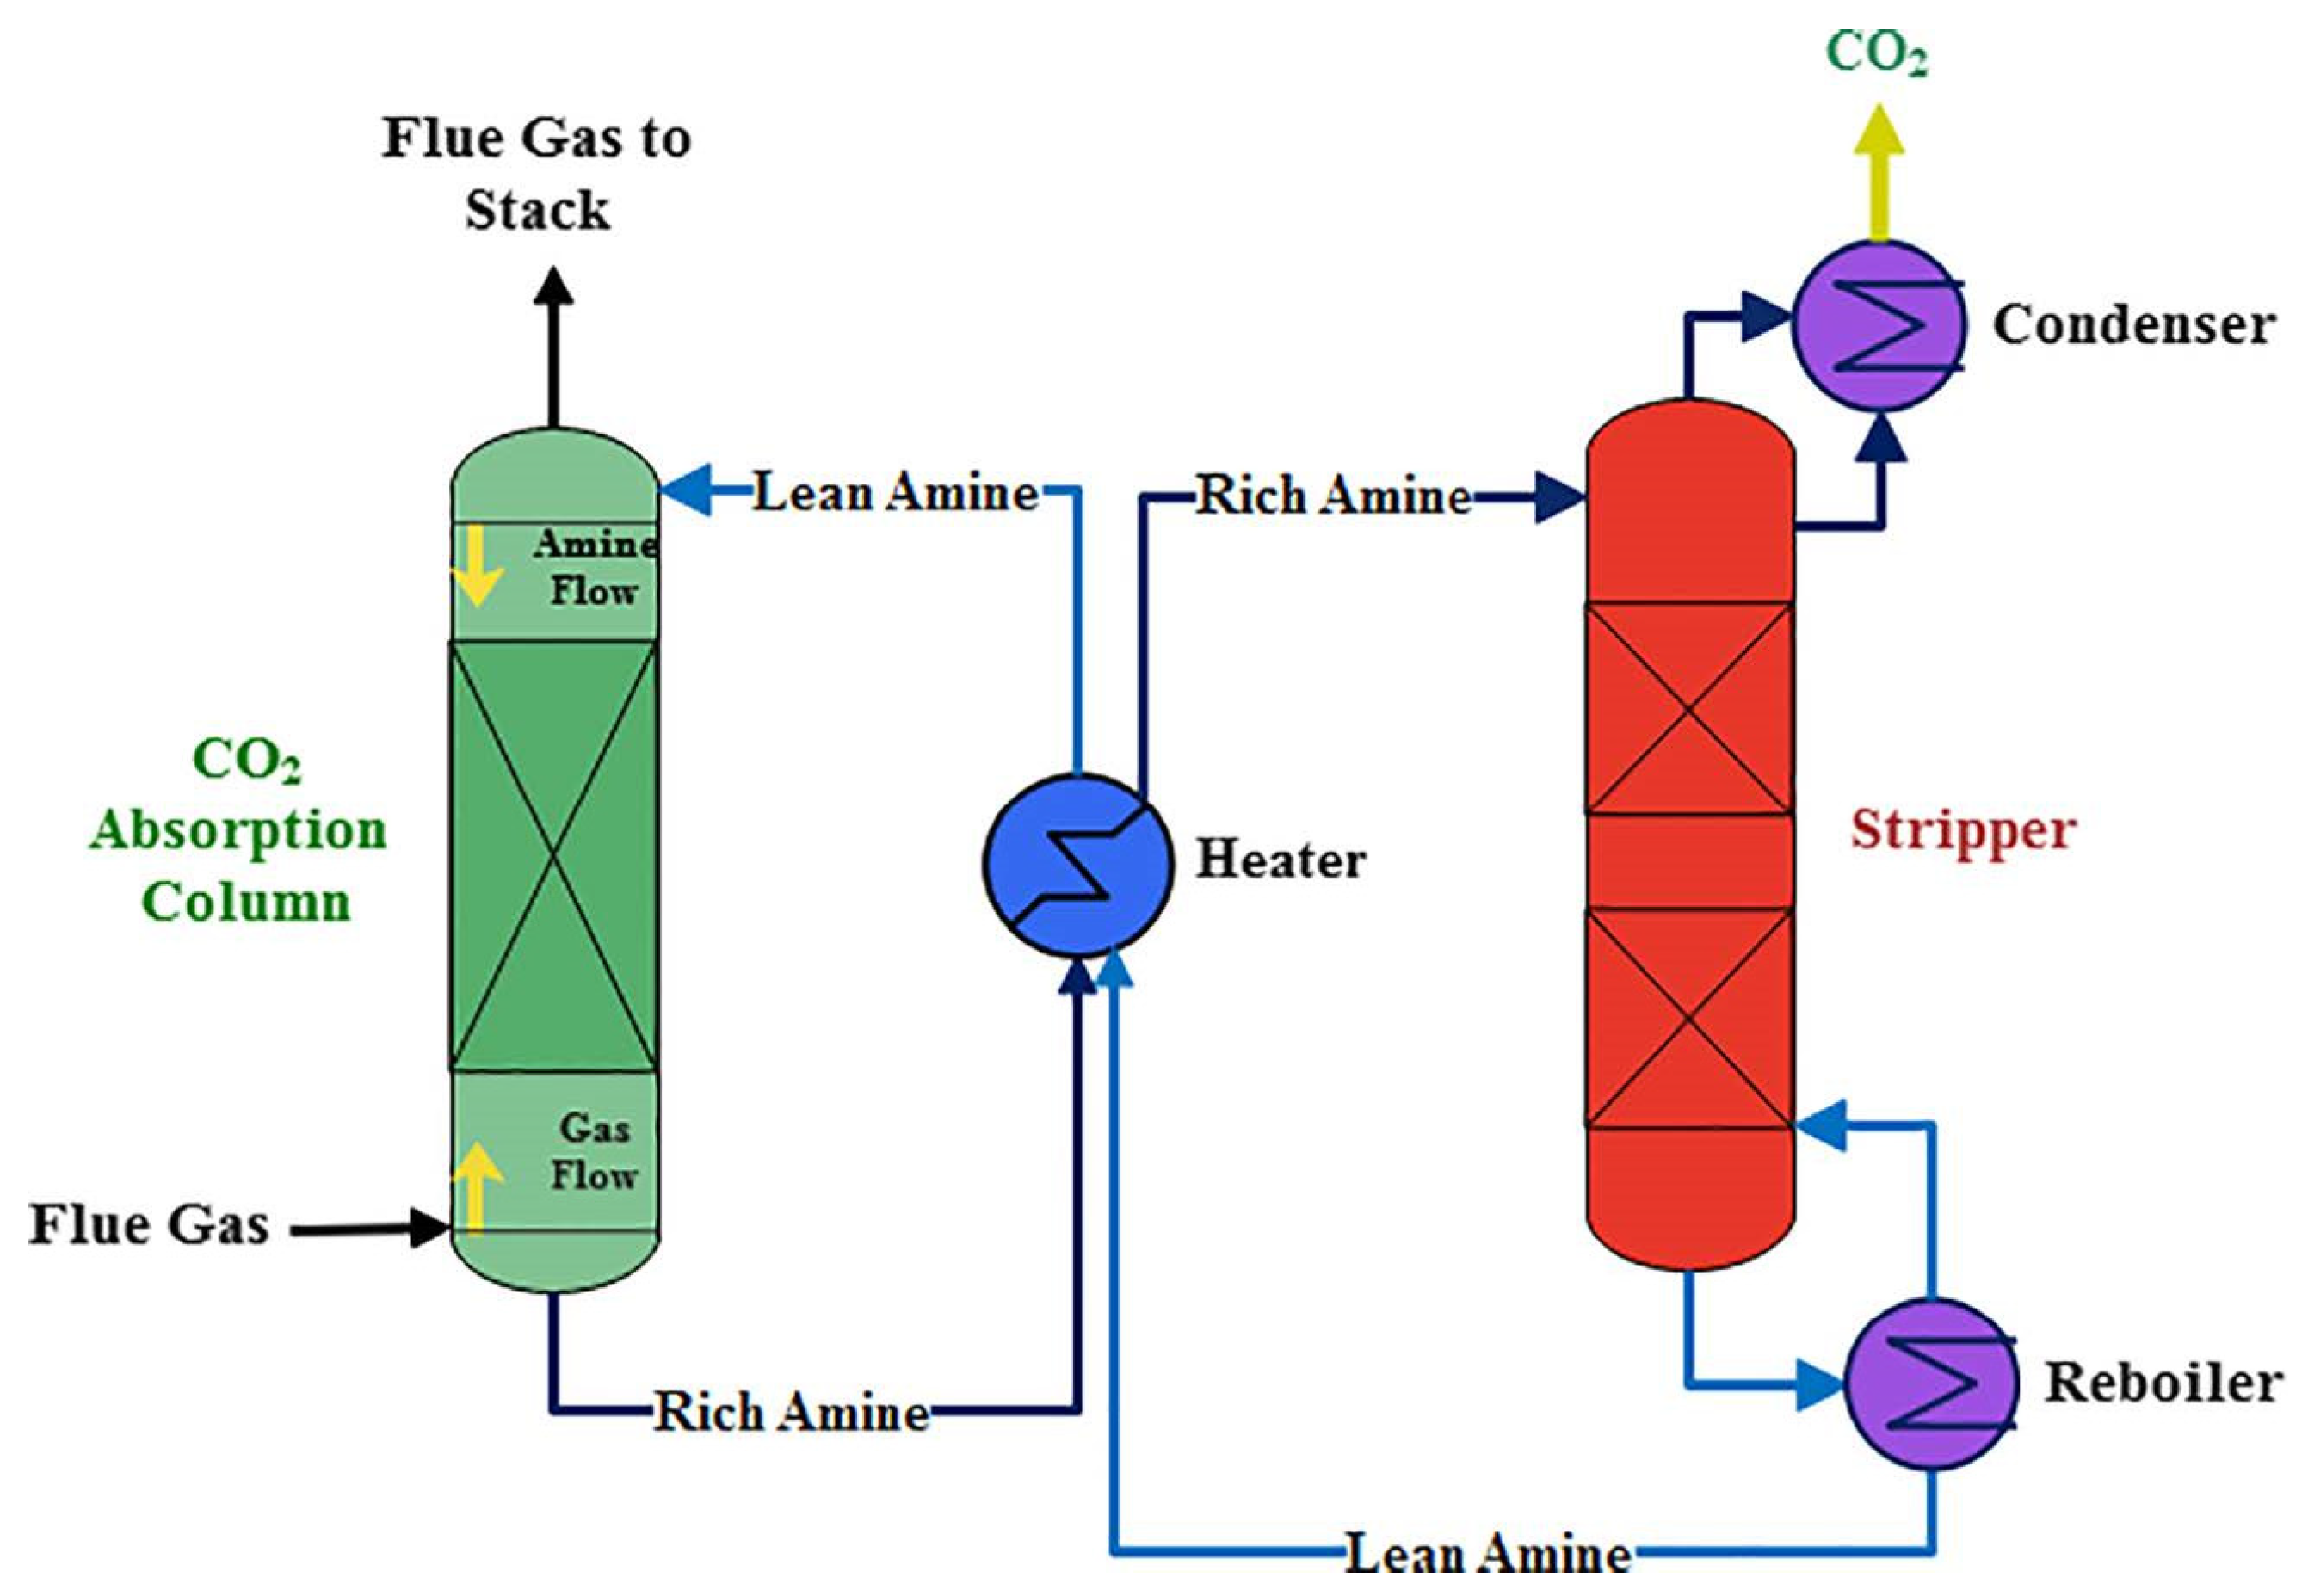
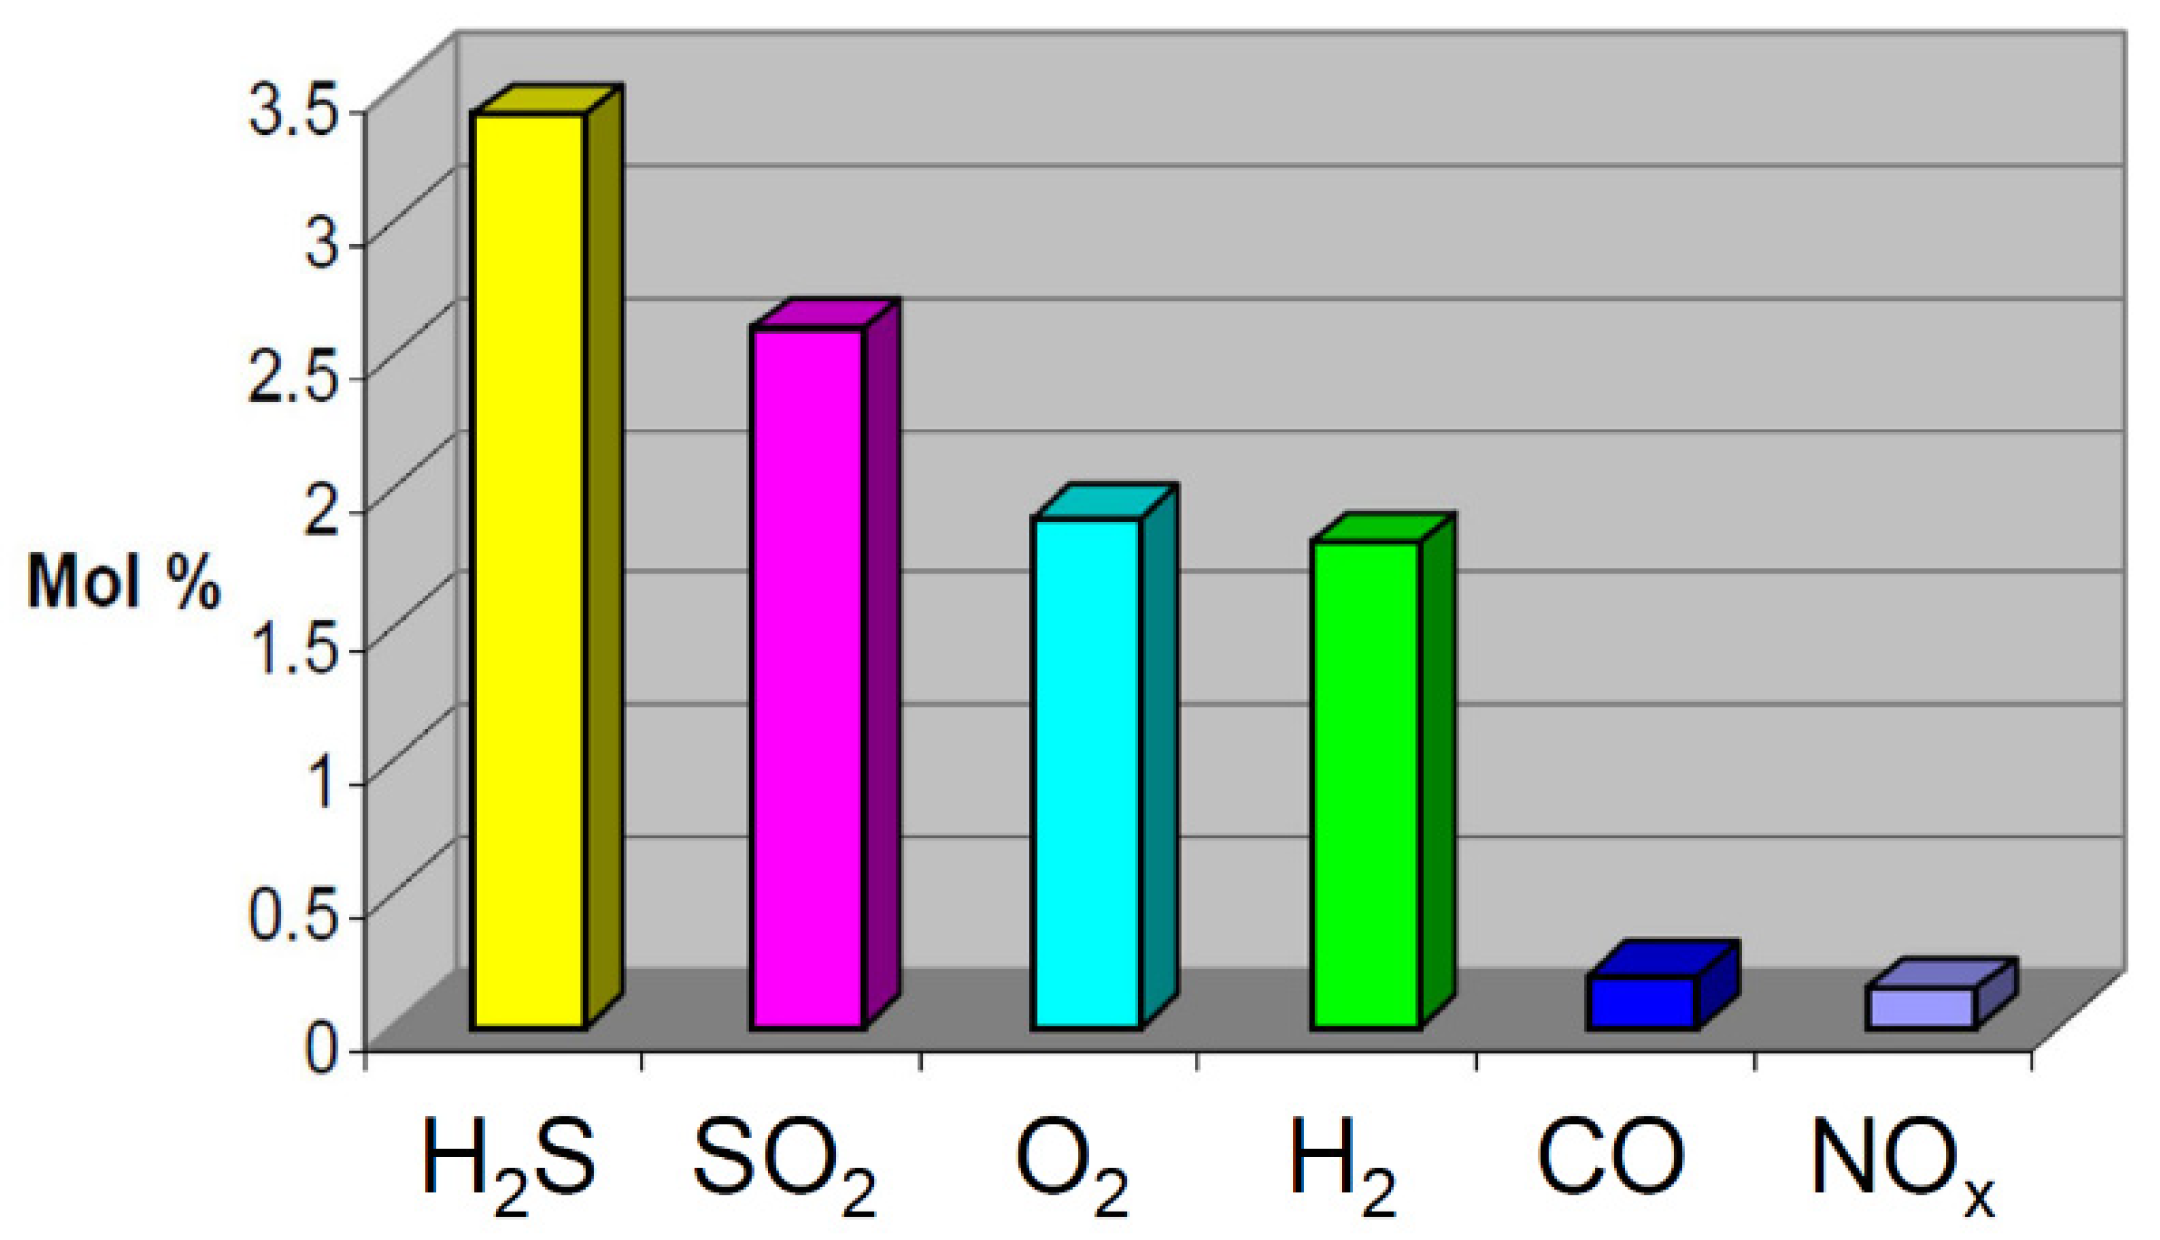
Table 1 displays possible impurities that may occur during the CO2 capture process using various methods. The most common method for capturing CO2 is absorption using amine-based solvents such as monoethanolamine (MEA). Amine solvents have excellent absorption capabilities for CO2, as well as acidic gases such as H2S. The CO2 absorption process consists of absorber and regenerator towers, as shown in Figure 1 [15]. In the absorber tower, the synthesis gas containing CO2 and the lean amine solution are injected into the upper and lower sections, respectively, where the amine solution absorbs CO2. The amine solution, now rich in CO2 (rich amine), is discharged to the lower part of the absorber tower and preheated in a heat exchanger before being injected into the upper part of the regenerator tower. In the high-temperature regenerator tower, the CO2 is released in the upper section through a reverse reaction, whereas the amine solution (lean amine) is returned to the absorber tower through a heat exchanger and cooler [15,16]. As shown in Figure 2, the absorbent can capture CO2 and also acidic substances, such as H2S or sulfur dioxide. Depending on the process, impurities such as methane or hydrogen may be included [17].

Table 1.
Possible impurities during the CO2 capture process [18].

Figure 1.
Basic flowsheet of the monoethanolamine CO2 capture process. Reproduced with permission from Aghel et al. [16], International Journal of Greenhouse Gas Control; published by Elsevier in 2022.

Figure 2.
Maximum impurity levels in co-captured CO2 [16].
The CO2 injected into the reservoir should not leak. To ensure this, the target storage formation should have good porosity, and an impermeable cap rock should be present at the top, such as shale. The primary target formations for CCS include depleted oil and gas fields, saline aquifers, and deep coal seams. Saline aquifers are more widely distributed than other CO2 storage candidates and are globally recognized as potentially storing the greatest amount of CO2, ranging from a minimum of 1000 Gt to a maximum of 10,000 Gt, as shown in Table 2 [19].
Table 2.
CO2 potential storage capacity of the CCS site [19].
The injected CO2 in the reservoir is trapped through four mechanisms: structural trapping, residual trapping, dissolution trapping, and mineral trapping. However, storing impure CO2 underground can affect CO2 storage due to the characteristics of the impurities and changes in properties caused by mixing. Compared to pure CO2, when methane is mixed with CO2 for EOR and used in a WAG process, the deposition of asphaltenes decreases, the hydrophilicity of the reservoir rock is maintained, and the relative permeability increases. Consequently, compared to pure CO2, after the WAG process, the amount of CO2, including methane, captured in the residual trap decreases by 30% [9].
From a geochemical perspective, CO2 and impurities affect the acidity generation, dissolution, and precipitation of minerals in reservoir rock. According to Aminu’s research [20], when pure CO2 was injected into a saline aquifer, the pH decreased to 5.97, and carbonate minerals such as calcite in the rock dissolved, resulting in changes in permeability. When nitrogen dioxide was included as an impurity, strong acidity was formed, and the pH decreased from 5.97 to 5.23, whereas in the case of sulfur dioxide, the pH decreased to 5.86. However, when H2S was included, the pH increased from 5.97 to 6.55. When pure CO2 was injected, the permeability of the sample increased from 240 to 254 md. However, nitrogen dioxide decreased the permeability to 140 md, and sulfur dioxide decreased it to 225 md, whereas H2S showed a similar permeability to pure CO2 at 255 md. The decrease in permeability in the presence of acidic nitrogen dioxide and sulfur dioxide was due to an increase in the precipitation of carbonate and sulfate minerals [19]. Additionally, when sulfur dioxide is injected along with CO2 into an undersaturated quartz state in a saline aquifer, it causes precipitation and reduces the permeability of the reservoir [19]. Ionization occurs when H2S and CO2 are injected into a saline aquifer. Equations (6)–(8) represent the reactions that occur when these substances are injected into a saline aquifer [21].
Furthermore, impurities can lead to a decrease in gas density, resulting in an increased buoyancy-driven increase in the velocity of the gas plume and a decrease in the contact time between the brine and gas, leading to a reduction in dissolution efficiency. A decrease in density reduces the amount of CO2 that can be retained within the pore space. When impurities such as nitrogen are present, they can also cause a decrease in viscosity, similar to the case of reduced density, resulting in an increased plume flow velocity and decreased dissolution trapping and residual trapping efficiencies [7].
3. Methods
3.1. Fluid Model
To simulate the behavior of CO2 in a deep saline aquifer, the pressure–volume–temperature and density of mixtures were calculated in CMG-WinProp using the Peng–Robinson equation (PR-EOS). The PR EOS is suitable for predicting the phase behavior of gas–liquid systems under high pressure and is commonly used for CCS processes involving mixtures, such as gas processing, oil refining, and petrochemical processes [22]. The PR-EOS applied to a mixture of components is given by Equations (9)–(16), as follows:
where is the pressure (atm), is the temperature (K), is the volume of the mixture, is the universal gas constant, a is the coefficient for volume calculation by the attraction effect, is the coefficient for volume calculation by the repulsion effect, is the critical temperature, is the critical pressure, is the acentric factor, is the mole fraction (single component in mixtures), and is the binary parameter [23].
The viscosity of the gas was estimated using the Jossi–Stiel–Thodos correlation. The process of dissolving CO2 in the formation of water is described by Equation (17).
where is gas phase of , is aqueous phase of [24].
CO2 rapidly dissolves in formation water, and from a thermodynamic perspective, it can be assumed to be in an equilibrium state. Equations (18) and (19) represent the thermodynamic equilibrium state using the fugacity [25].
where is the fugacity of the component of the gas phase, calculated by the PR-EOS; is the fugacity of the component of the aqueous phase, calculated by Henry’s law using components of fugacity and concentration; is the mole fraction of component in the liquid phase; and is Henry’s constant, which is a function of the system pressure, temperature, and aqueous phase in saline water [25].
The molecular diffusion of gas in a liquid phase is driven by concentration gradients and is modeled based on Fick’s second law, as described by Equation (20).
where c is the concentration of a component, and is Fick’s diffusion coefficient [25].
The initial temperature and pressure of the saline aquifer, along with the critical properties and acentric factors for each component used in the calculation of the fluid properties, are presented in Table 3.
Table 3.
Parameter for fluid modeling, Reproduced with permission from Reid et al. [26], The Properties of Gases and Liquids; published by AIP Publishing in 1959.
3.2. Reservoir Model
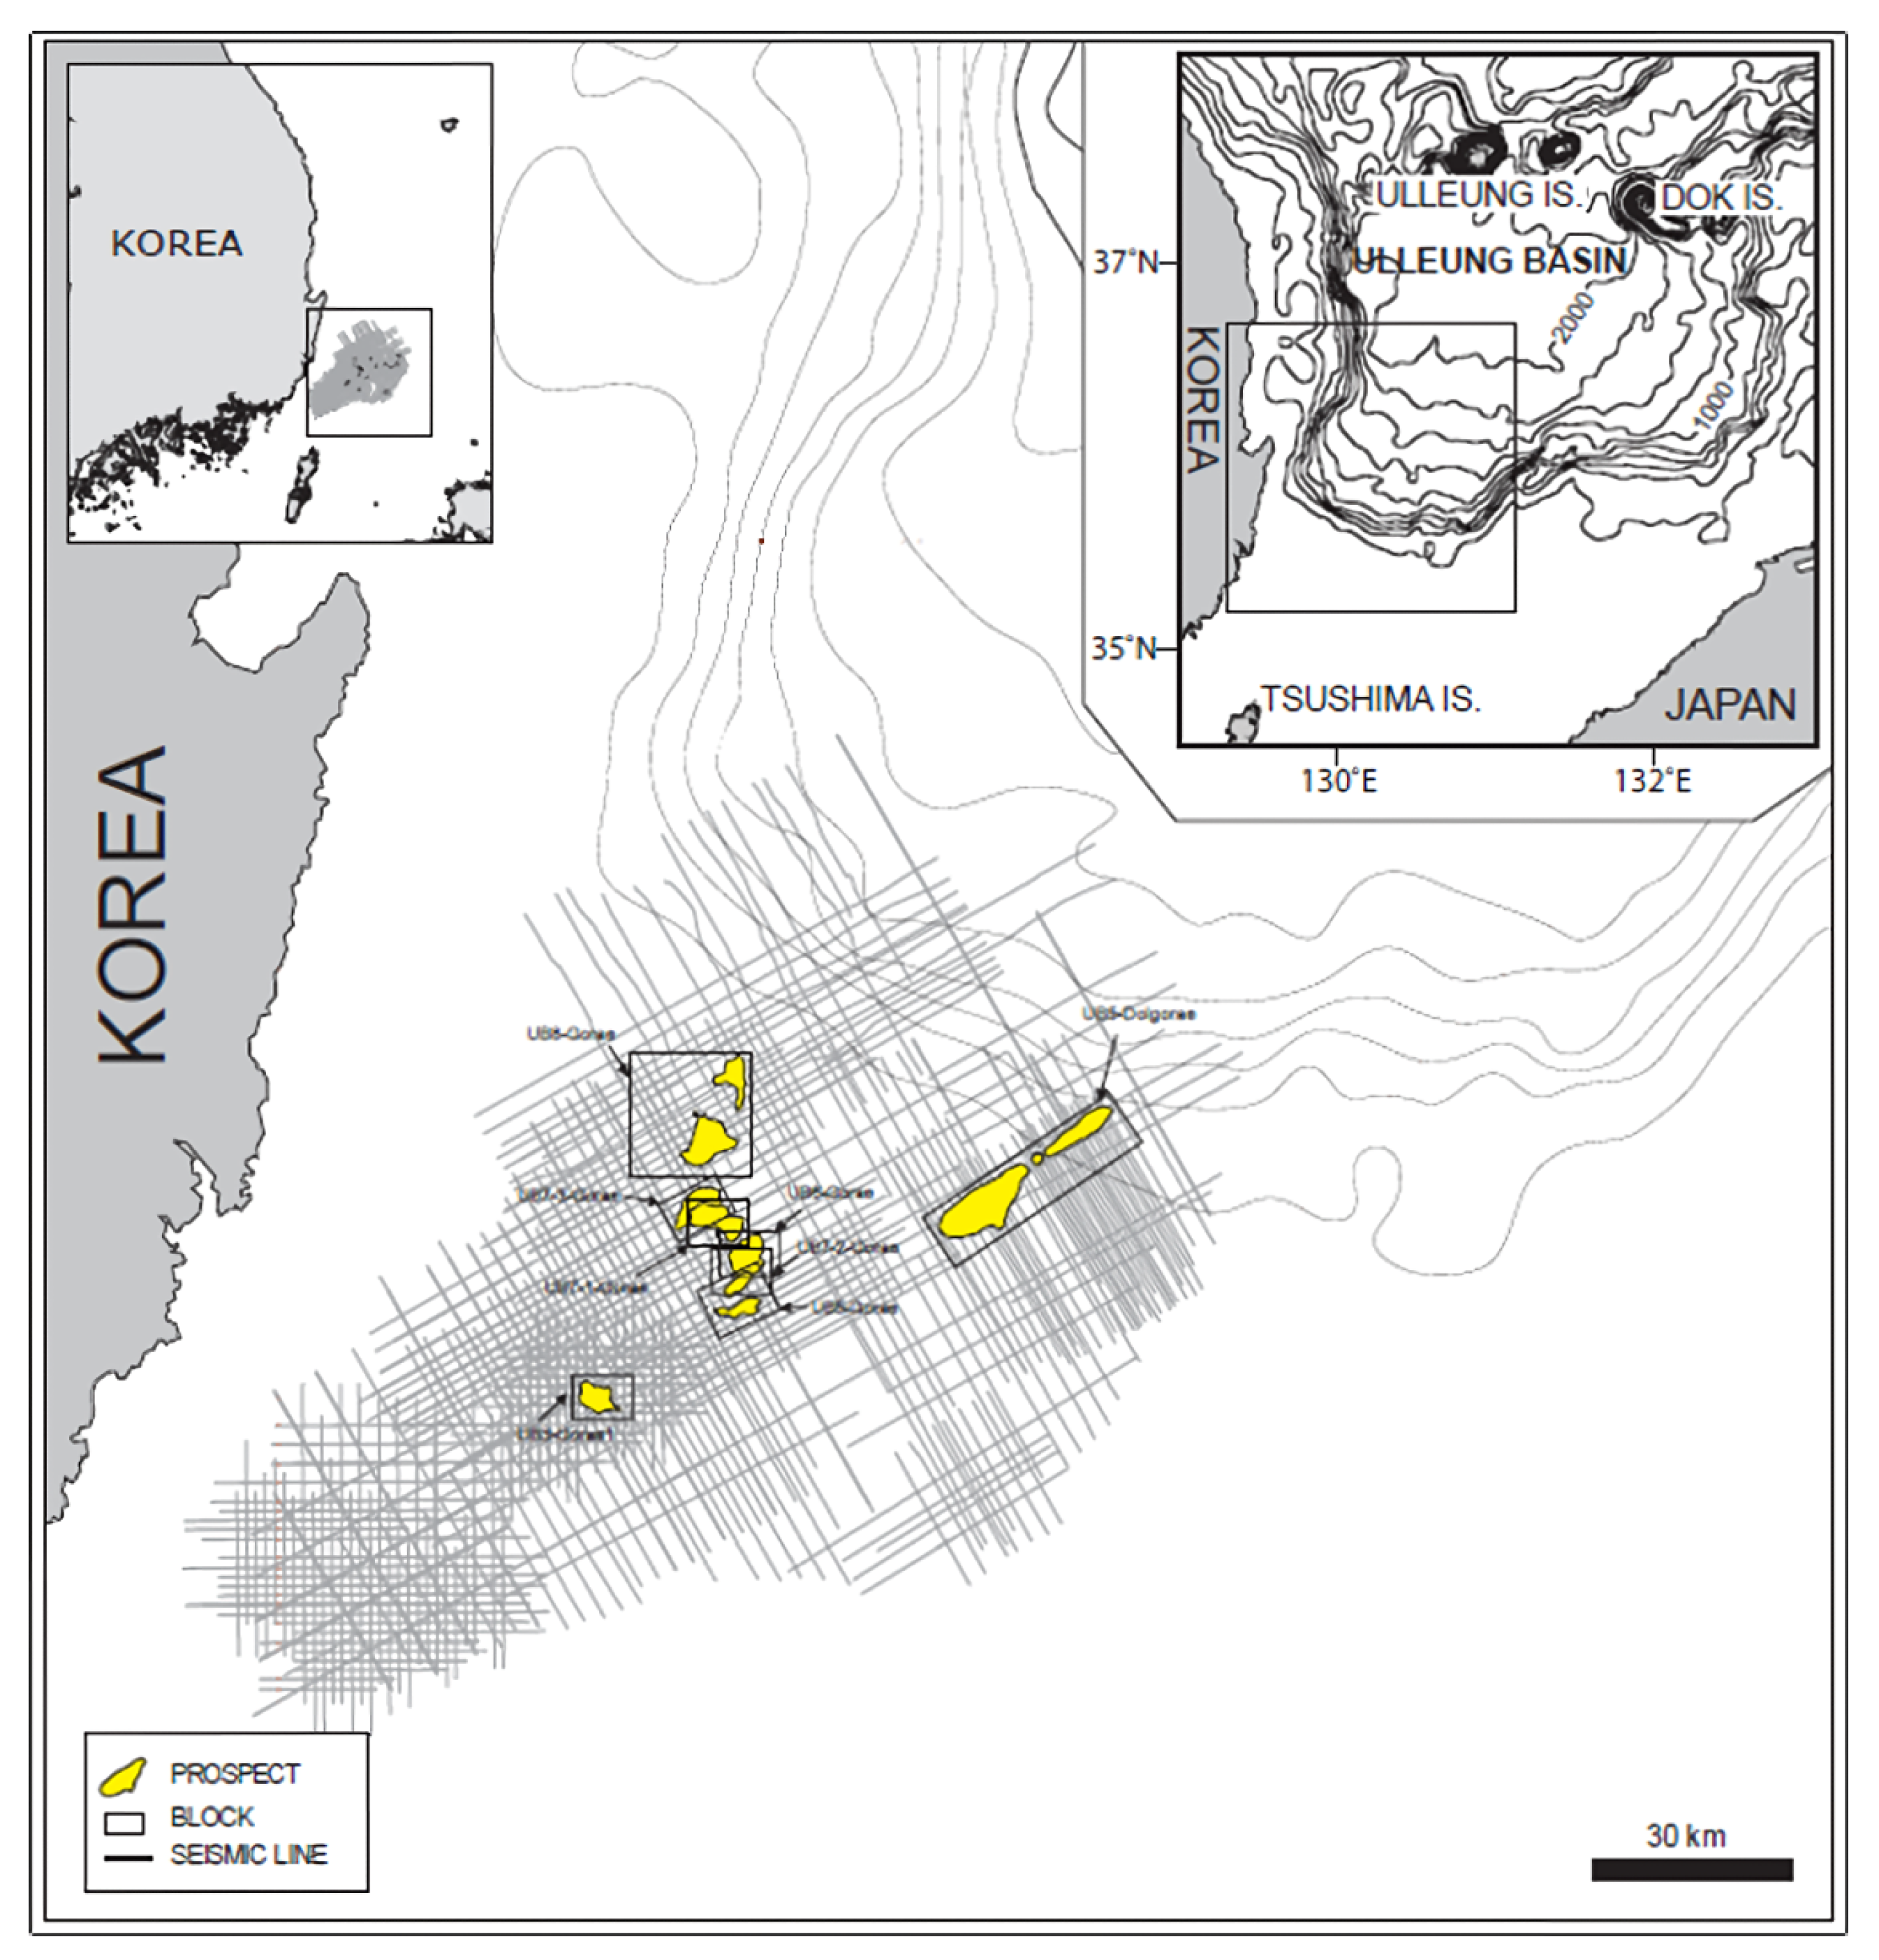
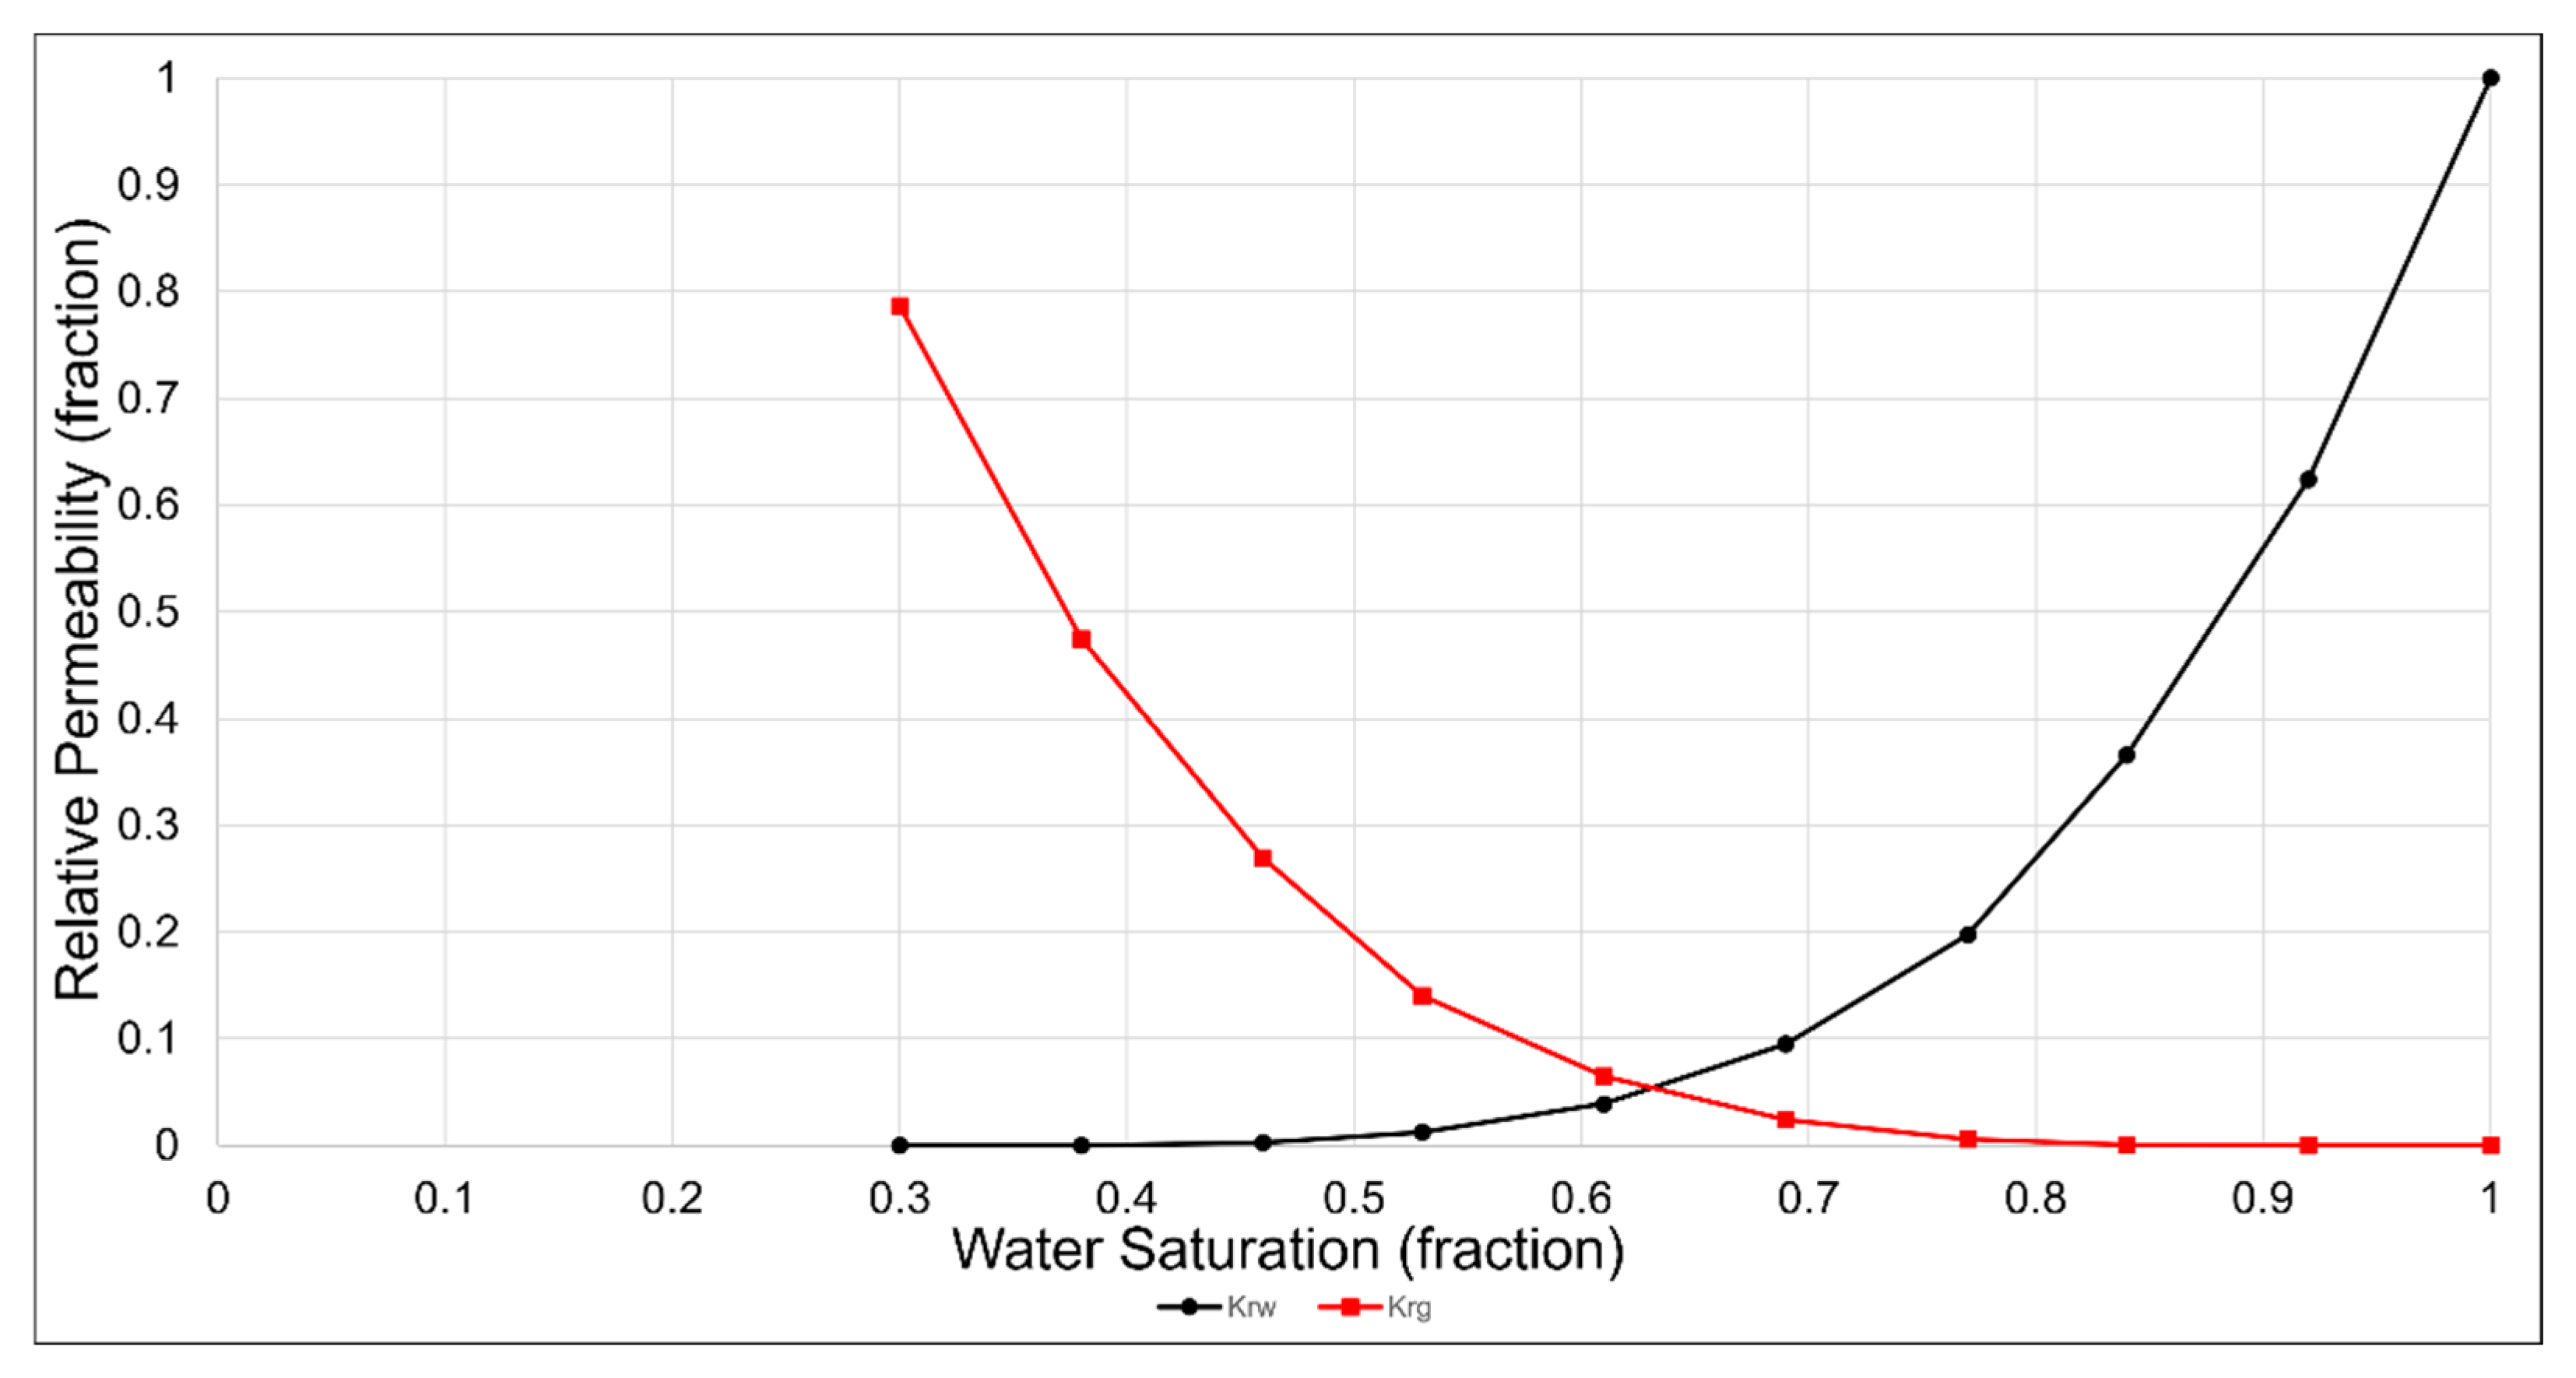
Simulations of CO2 storage in the deep saline aquifer were conducted using the compositional simulation software GEM developed by CMG. The simulations were run on Intel i9-12900K CPU, 32 GB RAM, and NVIDIA GeForce RTX 3070 GPU. The average elapsed time for simulations was 5 min. The deep saline aquifer of the Gorae-V structure, which includes the Donghae gas field, was used as the target reservoir for storage and is located 60 km offshore, east of Ulsan, as shown in Figure 3 [27]. As shown in Table 4, the depth of the saline aquifer is 2450 m, and the initial pressure and temperature are 24.8 MPa and 103 °C, respectively. The porosity of the aquifer is 16%, and it exhibits horizontal and vertical permeabilities of 50 and 5 mD, respectively [28]. The reservoir model was constructed as a rectangular shape with a grid size of 100 m in the horizontal direction and a height of 6 m. The grid array was set to 33 × 33 × 10, totaling 10,890 grids. The reservoir characteristics in the simulation model were assumed to be homogeneous and isotropic; the relative permeability is shown in Figure 4 [29].
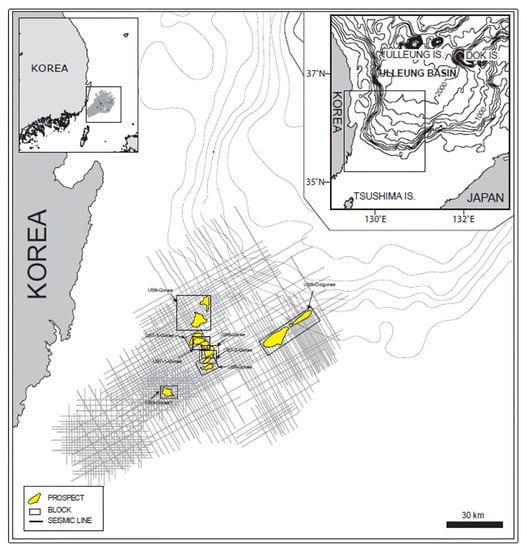
Figure 3.
Location of the CO2 storage site in the Ulleung Basin [27].
Table 4.
Model parameters for CO2 injection simulation [28].
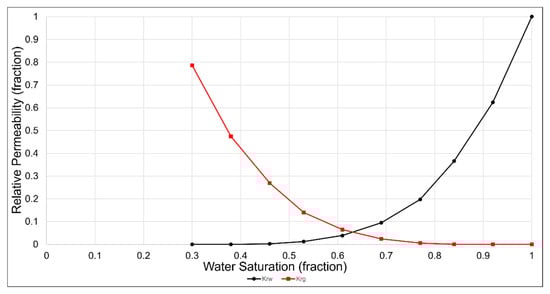
Figure 4.
Water and gas relative permeability curves of the Gorae-V structure [29].
3.3. CO2 Injection Scenarios
Table 5 displays operating parameters for CO2 injection simulation in this study. CO2 was injected through the three centered bottom cells of the model to enable the gas to rise and implement residual trapping owing to buoyancy differences. The injection rate was controlled by adjusting the bottom-hole pressure (BHP) of the injection well. The maximum BHP was set to 38 MPa, which corresponds to 80% of the rock fracturing pressure, known to be 48 MPa for the Gorae-V structure deep saline aquifer [30]. The CO2 injection rate was set to 146.4 tons per day. After the injection was completed, monitoring was conducted for the next 100 years to observe changes in trapping owing to CO2 plume migration. This model only included structural trapping, residual trapping, and dissolution trapping without considering the influence of mineral dissolution and precipitation on the deep saline aquifer. The selected impurities for injection were methane and H2S, which can be present in CO2 from precombustion processes. The impurity concentration was set to 3.5%, representing the maximum H2S content for amine-based absorbents [15] and 20%, as reported in a project conducted in Borzecin, Poland [4].
Table 5.
Operating parameters for CO2 injection simulation.
4. Analysis of Simulation Results
4.1. Fluid Model Results
The properties of CO2 and impurities are presented in Table 6 under the initial temperature and pressure conditions in the target formation. Pure CO2 had a molar mass of 44.01 g/mol, molar volume of 0.0802 m3/kmol, density of 548.5 kg/m3, and viscosity of 0.45 cp. When methane was present at 3.5%, the volume occupied by the gas mixture increased by 5.13%, and at a concentration of 20%, it occupied 27.16%, exceeding its proportion in the mixture. In contrast, when H2S was present at 3.5%, it occupied a lower percentage of the volume (2.24%), and at a concentration of 20%, it occupied 13.66%, which was lower than its concentration in the injected H2S. In both cases, the molar mass decreased when methane or H2S was present as an impurity. With 3.5% methane, the molar mass decreased by 97.78% to 43.03 g/mol, and with 20% methane, it decreased by 87.3% to 43.42 g/mol. With 3.5% H2S, the molar mass decreased by 99.2% to 43.66 g/mol, and with 20% H2S, it decreased by 95.5% to 42.02 g/mol. The molar volume increased in the presence of methane. With 3.5% methane, it increased to 0.0824 m3/kmol (a 2.74% increase), whereas with 20% methane, it reached 0.0921 m3/kmol (a 14.84% increase). However, H2S caused a slight decrease in molar volume. With 3.5% H2S, it decreased to 0.0800 m3/kmol (a 0.25% decrease), and with 20% H2S, it decreased to 0.0776 m3/kmol (a 3.24% decrease). Differences in the molar volume resulted in a significant decrease in the gas density in the presence of methane. With 3.5% methane, density decreased to 521.97 kg/m3 (a 95.16% decrease), and with 20% methane, it decreased to 417.25 kg/m3 (a 75.16% decrease). In contrast, H2S caused a smaller decrease in density. With 3.5% H2S, the density decreased to 546.07 kg/m3 (a 99.56% decrease), and with 20% H2S, it decreased to 521.78 kg/m3 (a 98.77% decrease), showing a smaller reduction than that of methane. The viscosity also decreased when methane was present. With 3.5% methane, the viscosity was 0.043 cp (a 95.56% decrease), and with 20% methane, it was 0.037 cp (an 82% decrease). H2S did not affect viscosity when present at 3.5%; however, with 20% H2S, the viscosity increased to 0.045 cp (a 2.22% increase). When non-condensable gases such as methane are included as impurities, an increased volume ratio inside the gas results in reservoir conditions. However, H2S is compressed, leading to a decrease in its volume. Owing to these characteristics, when methane is included as an impurity, the molar volume increases compared to that when only pure CO2 is present, whereas the presence of H2S causes a decrease in the molar volume. The density difference between pure CO2 and the impurities varied. Methane showed a larger reduction in density as its concentration increased; however, when H2S was present, the relative difference in density was smaller.
Table 6.
Properties of gas at the target formation.
4.2. Dynamic Simulation Model Results
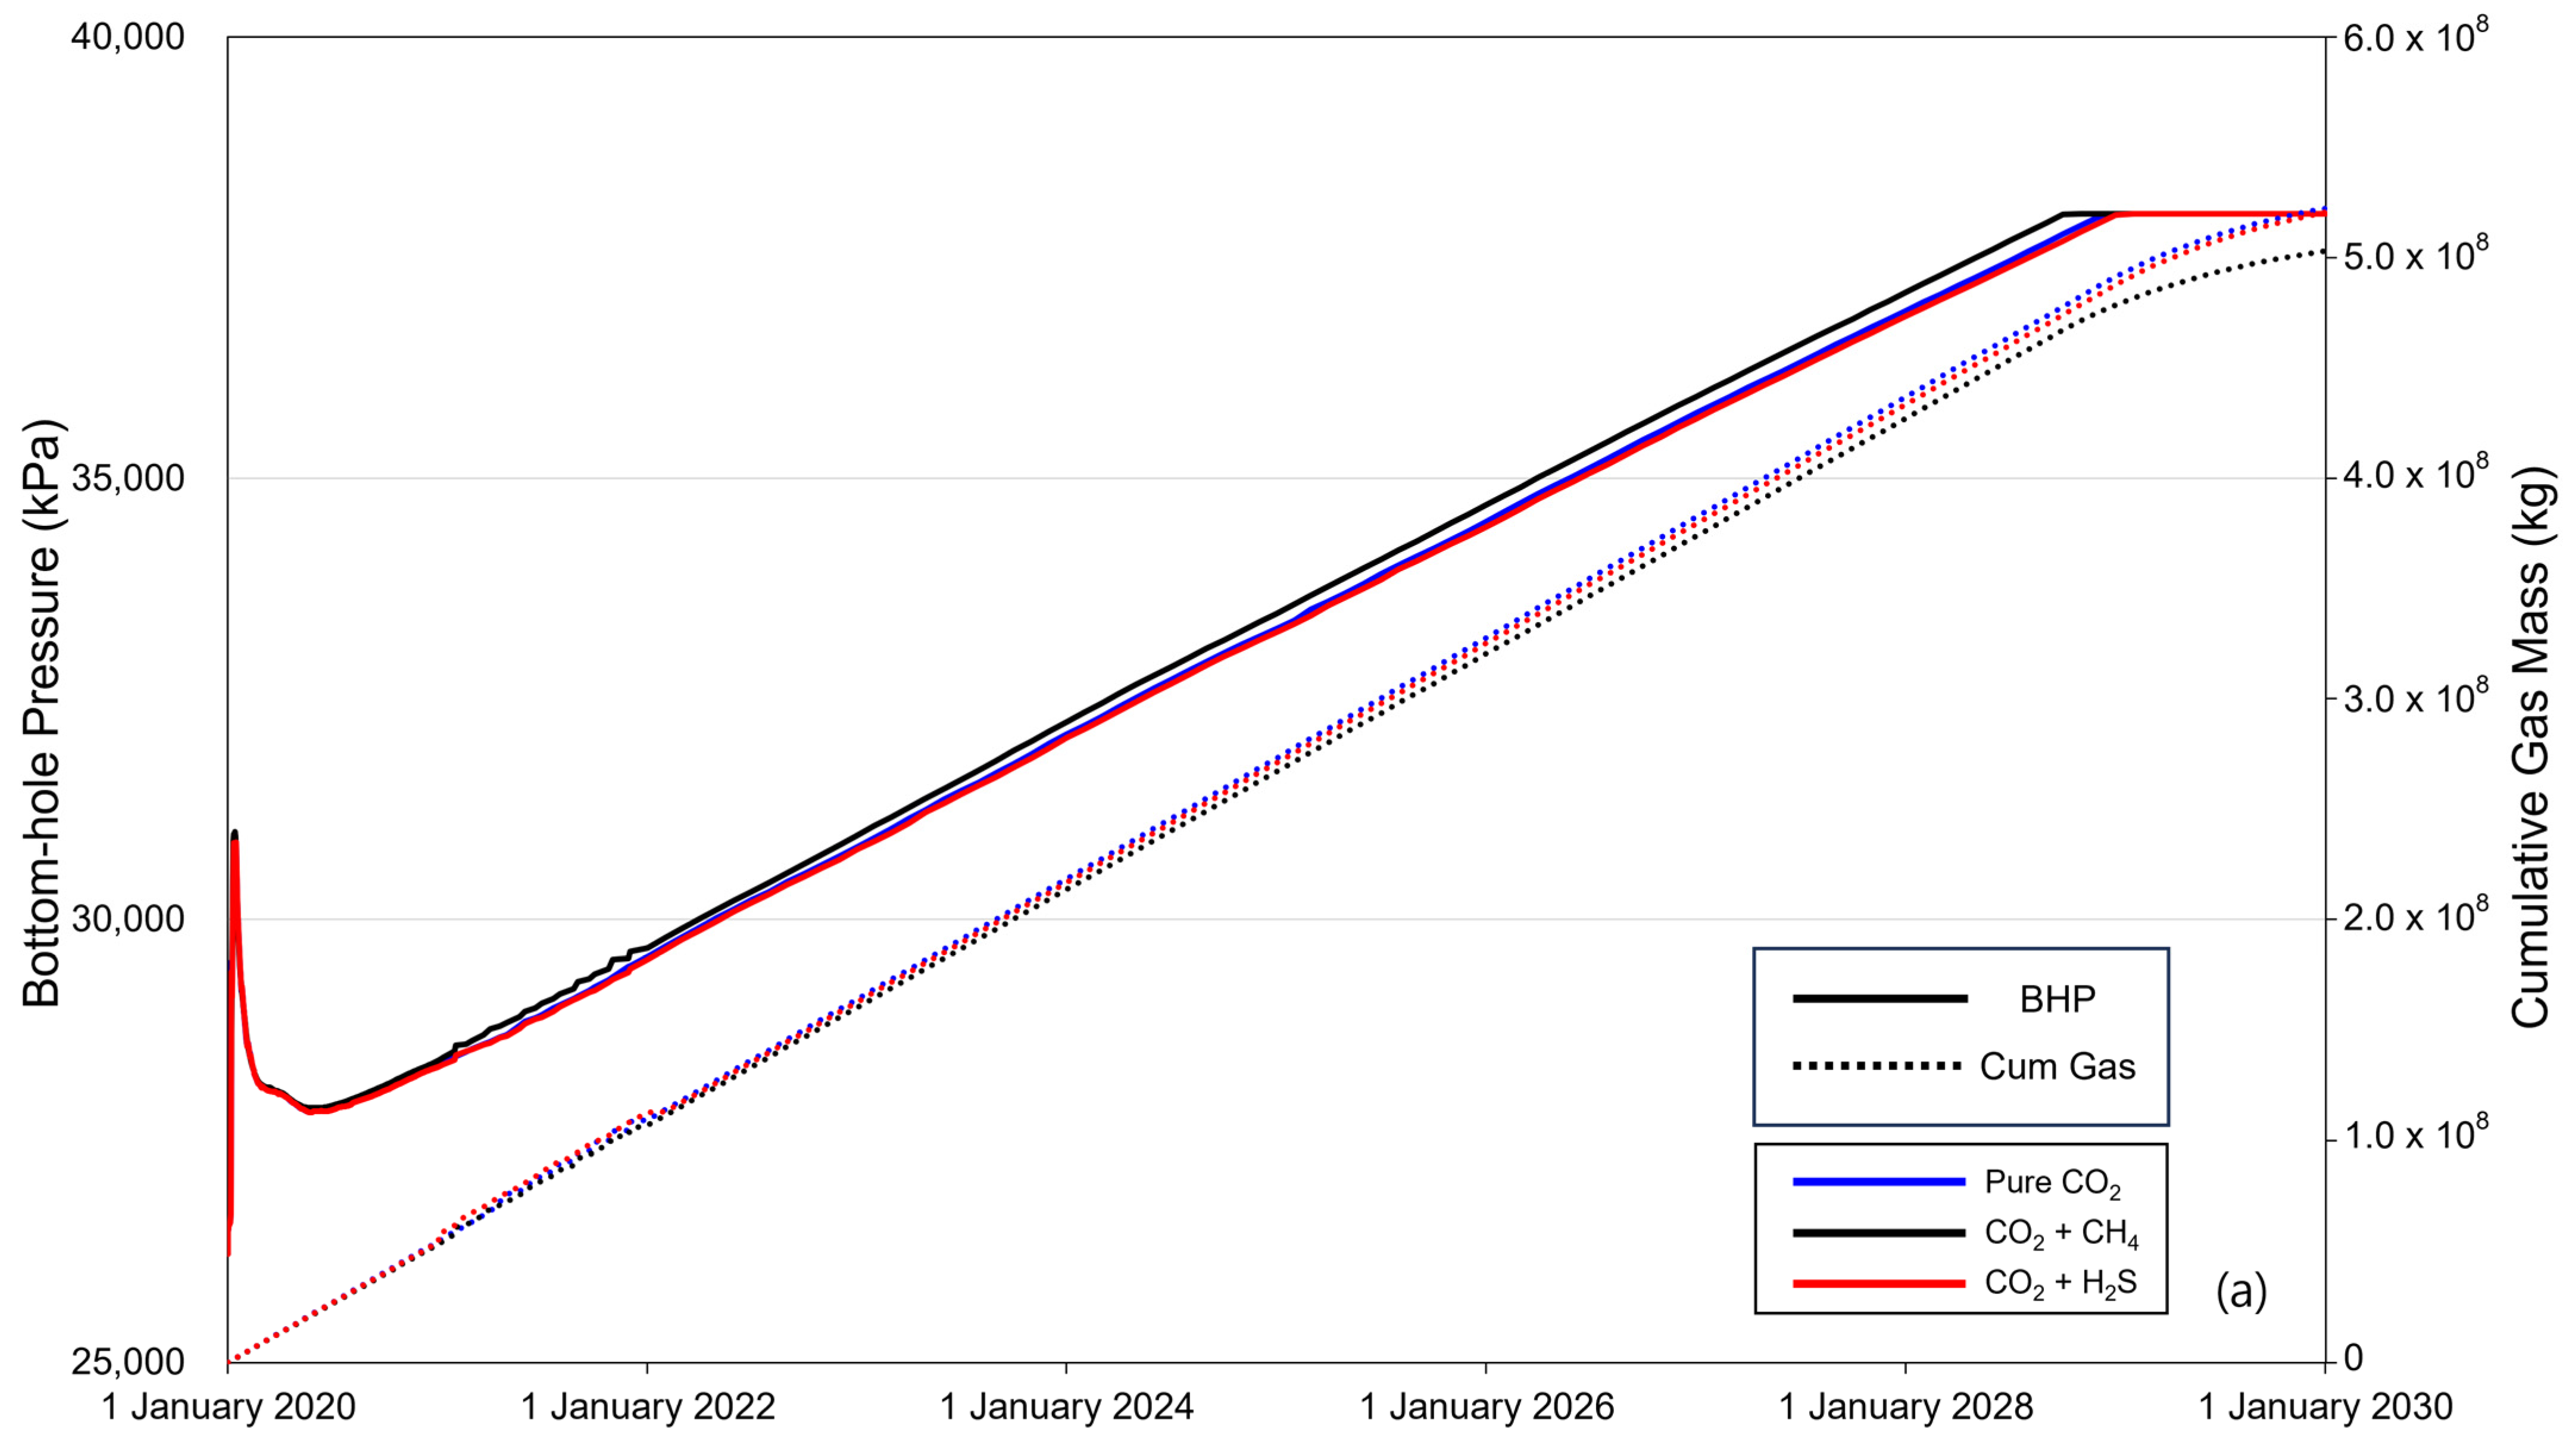
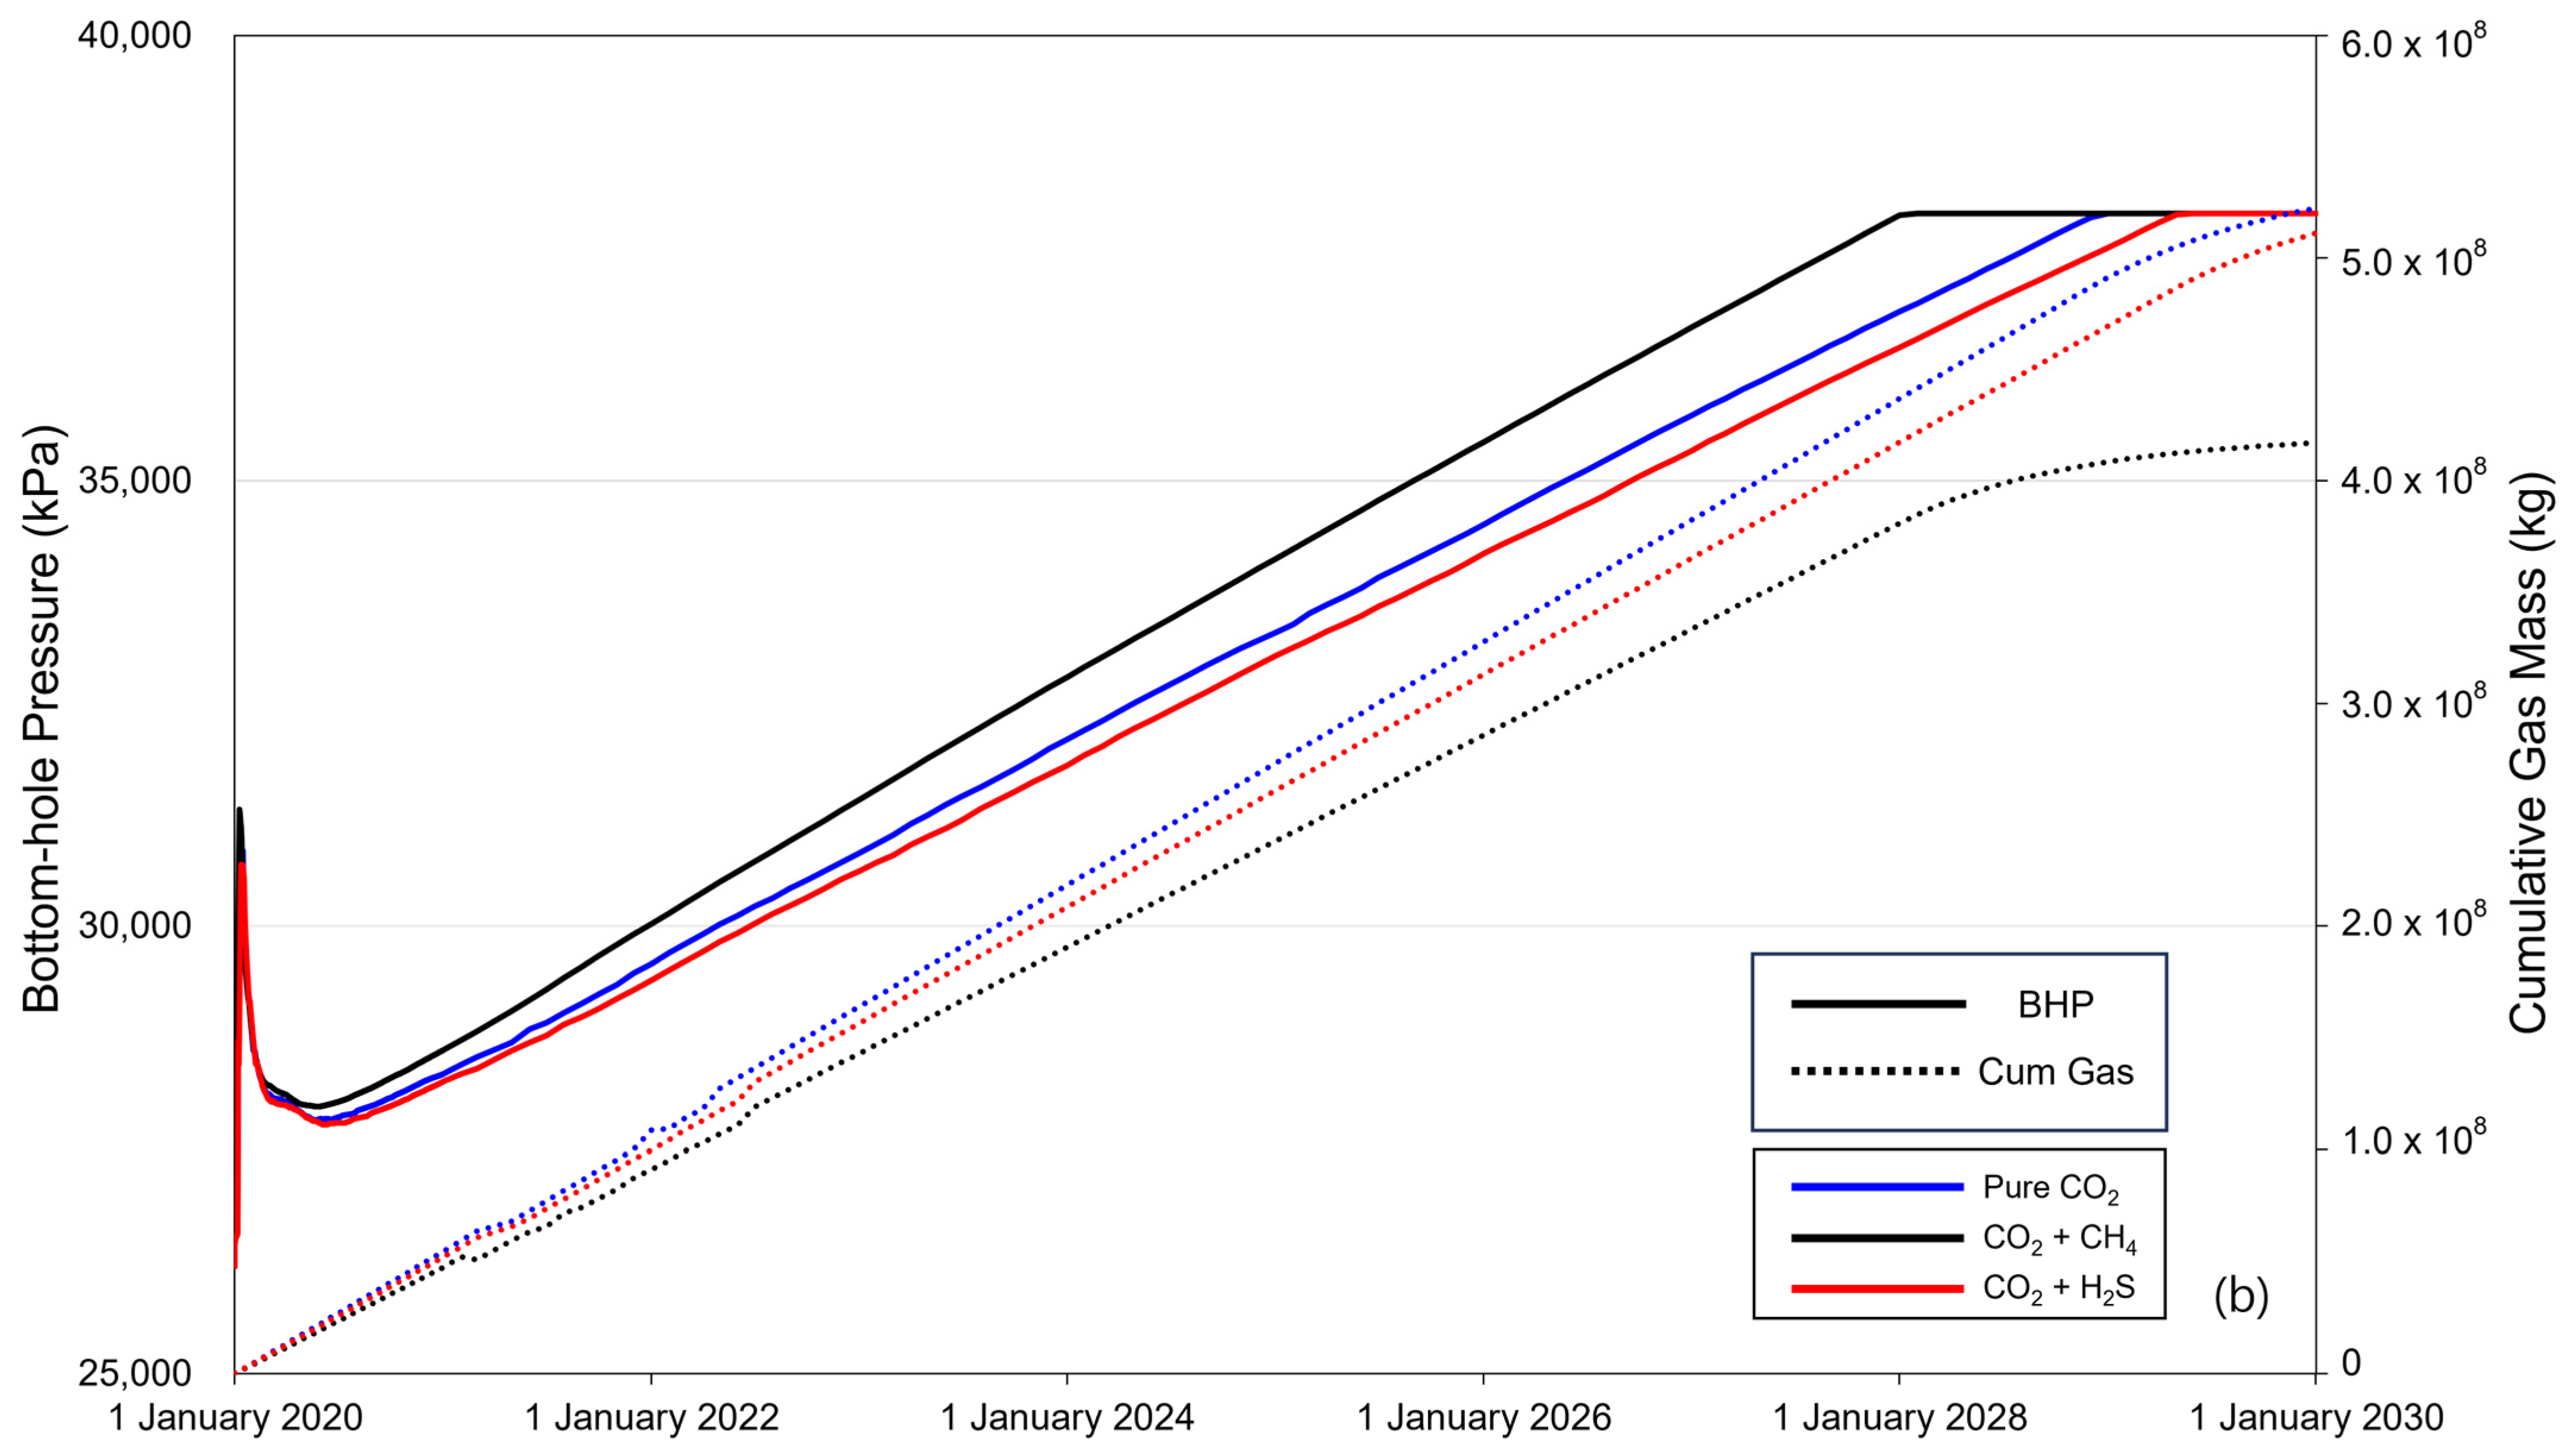
Figure 5 shows the BHP (solid line) and cumulative gas mass (dotted line) over the 10-year period of CO2 injection. When CO2 is injected into the saline formation, the injection fluid is momentarily compressed near the injection well to displace the formation water, causing a rapid increase in the BHP. The increased pressure then decreases as CO2 flows and subsequently increases linearly with increasing injection rate. The BHP exhibited a constant trend after reaching a maximum pressure of 38,000 kPa, with the timing varying depending on the presence and concentration of impurities. The sequence of BHP reaching the maximum pressure was methane, pure CO2, and H2S. The cumulative gas mass increased linearly until BHP reached the maximum pressure, and the injected gas mass followed the order of pure CO2–H2S–methane. After the BHP reached its maximum pressure, the cumulative gas mass decreased gradually. Additionally, comparing the overall changes in BHP and the trends in cumulative gas mass between cases with impurity concentrations of 3.5% (Figure 5a) and 20% (Figure 5b), the difference caused by the impurities became more pronounced as concentration increased.
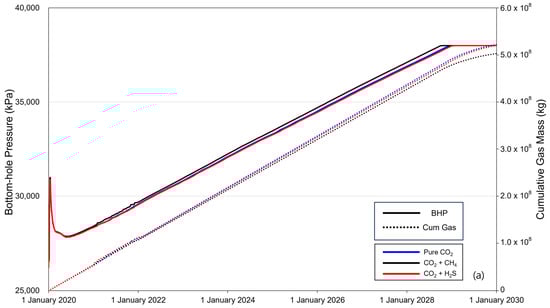
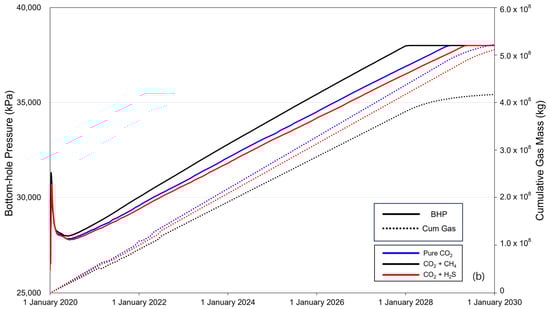
Figure 5.
Bottom-hole pressure (BHP) and cumulative gas mass during the gas injection process ((a) contains 3.5% impurity, and (b) contains 20% impurity).
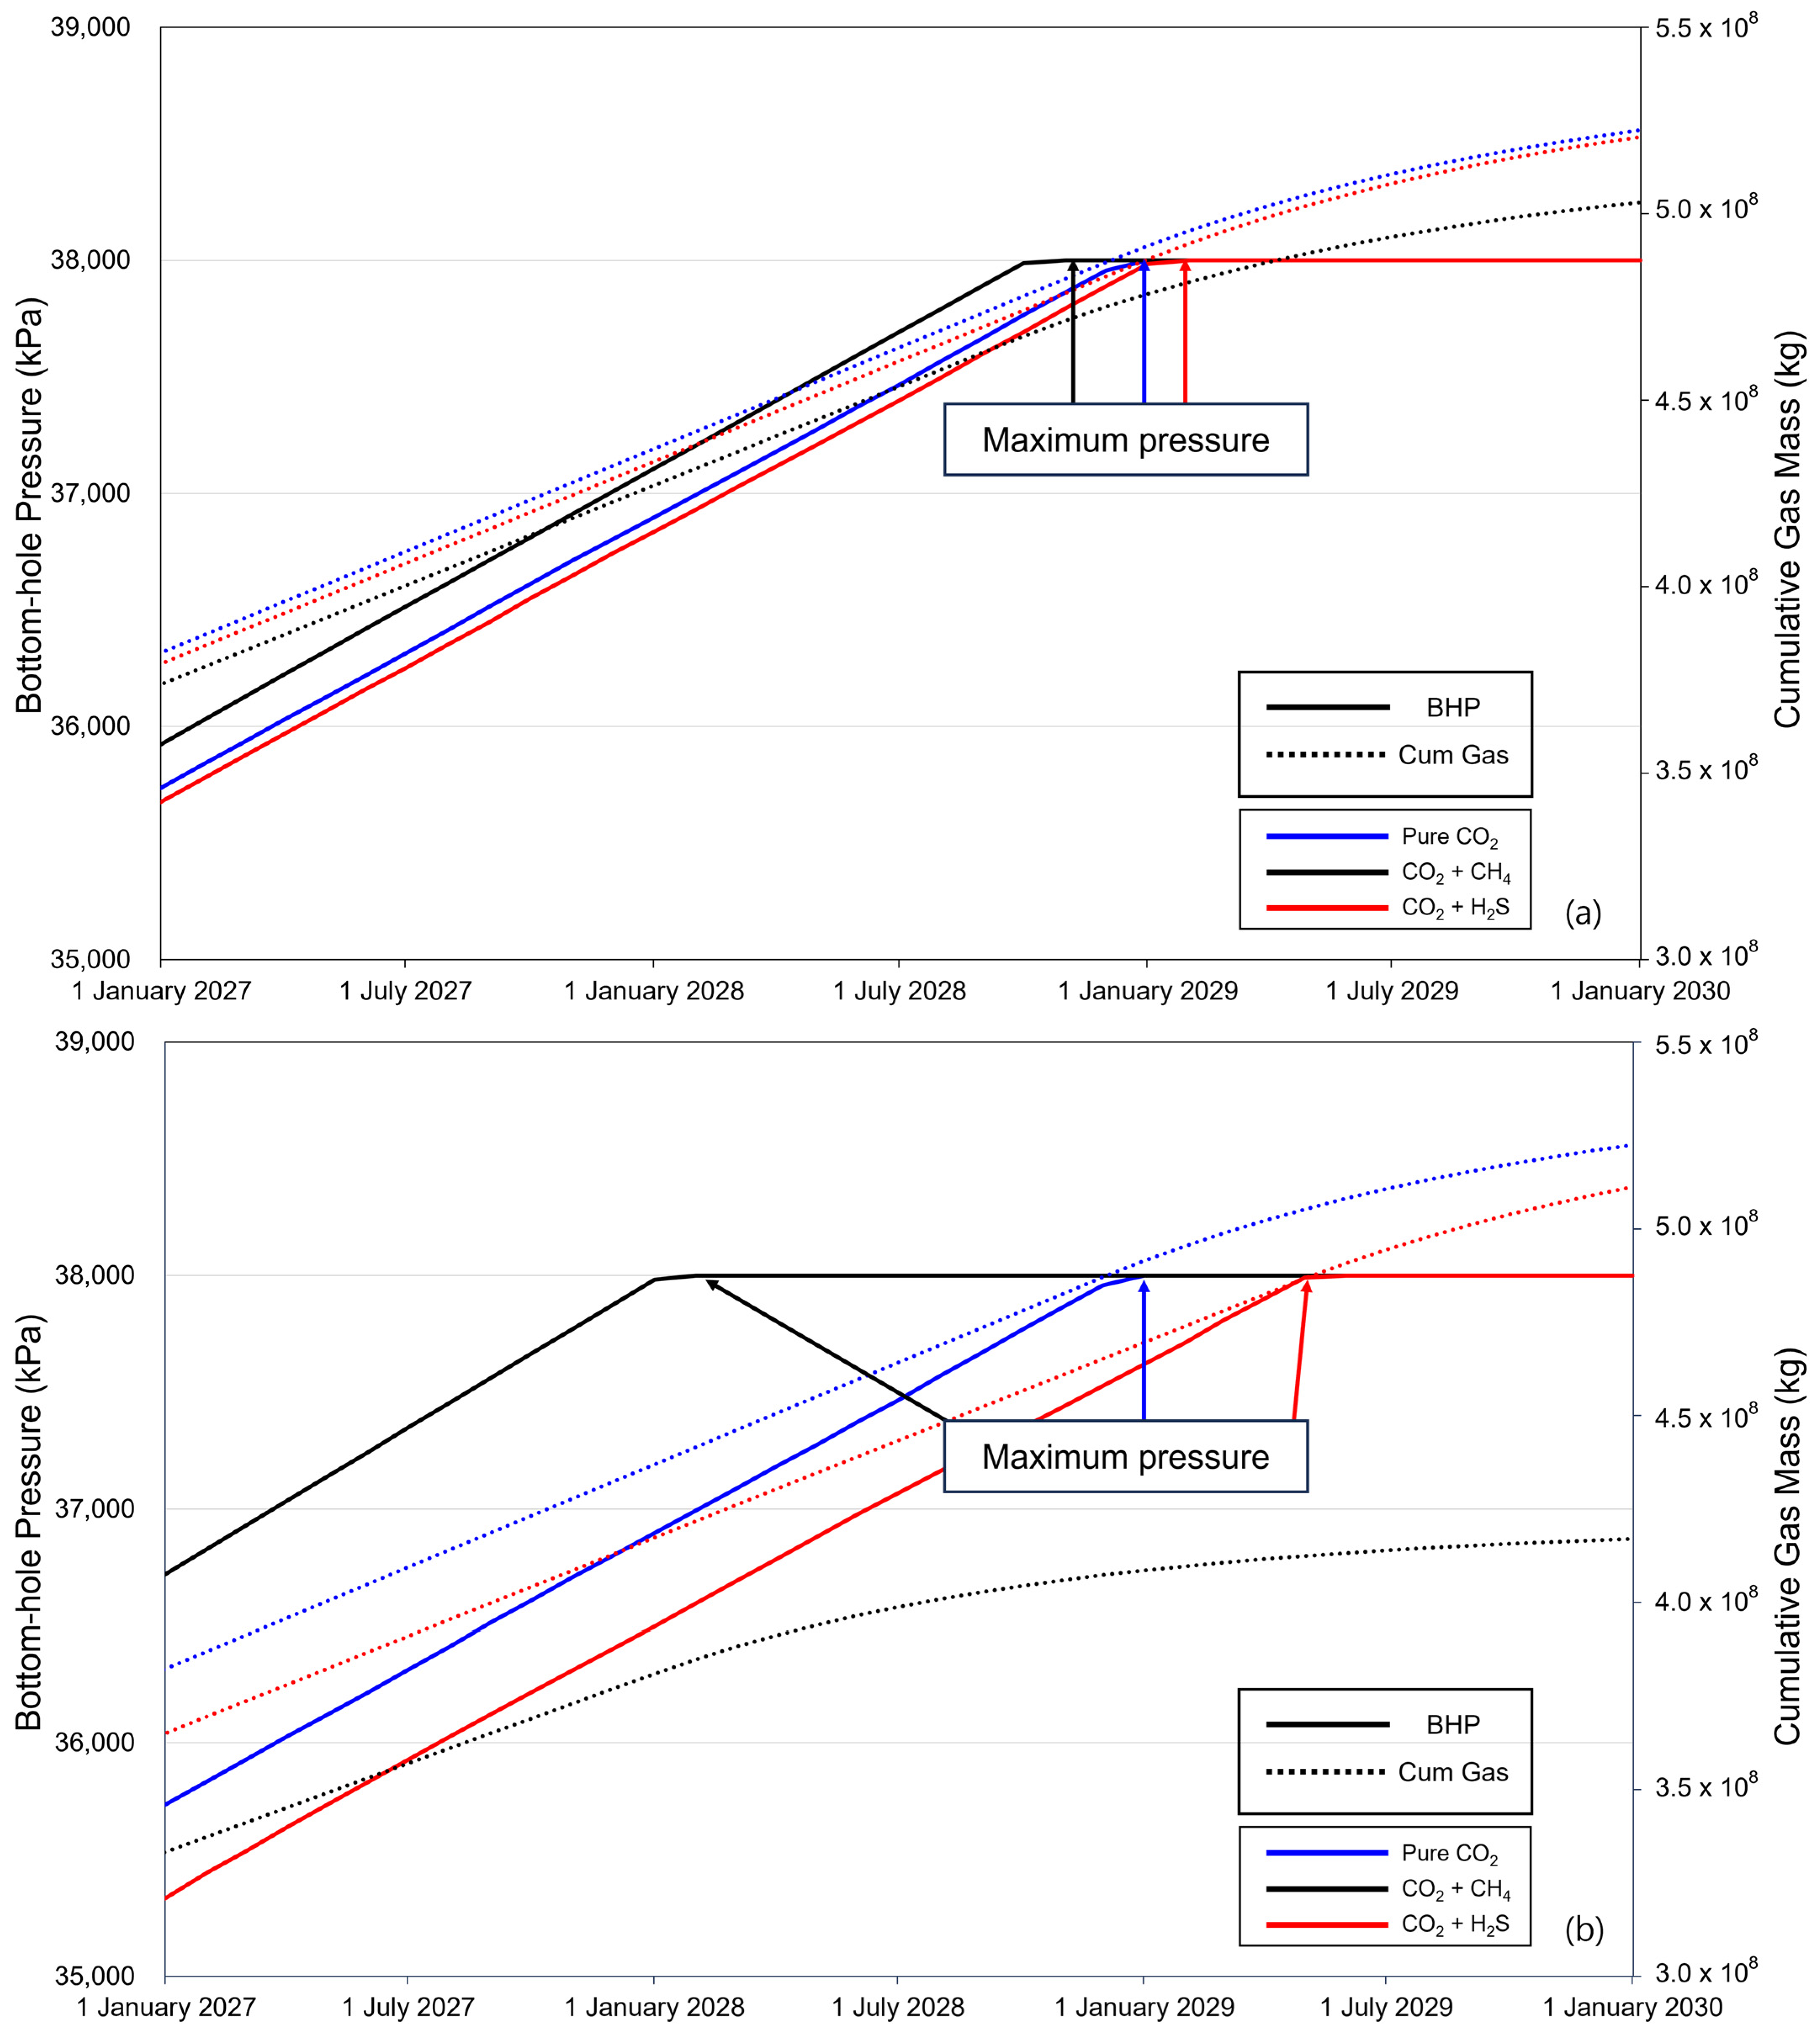
The BHP and cumulative gas mass during the last 3 years of injection are shown in Figure 6. For the pure CO2 injection, the BHP reached its maximum pressure in January 2029. With 3.5% methane, it took 8 years and 11 months from the start of injection to reach the maximum pressure, and when the methane concentration was 20%, it took 8 years to reach the maximum pressure from the start of injection. When the concentration of H2S was 3.5%, it took nine years and two months from the start of injection to reach the maximum pressure, and with a concentration of 20%, it took nine years and six months. These observations reveal that, compared to pure CO2, methane accelerates the reaching of the maximum pressure, whereas the presence of H2S delays the time required to reach the maximum pressure relative to pure CO2. This is because methane causes a significant decrease in density and an increase in the volume it occupies within the gas mixture, resulting in a rapid increase in pressure. In contrast, the volume fraction of H2S decreases, and the pressure increase within the aquifer is relatively slow.
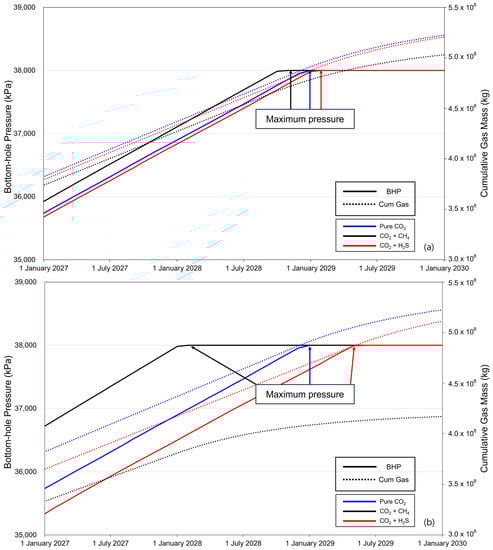
Figure 6.
Differences in time to reach the maximum pressure and cumulative gas injection with impurities 3 years before the end of the injection ((a) contains 3.5% impurity, and (b) contains 20% impurity).
The cumulative gas mass tended to decrease after the rate of increase after BHP reached the maximum pressure. When the methane concentration was 3.5%, the cumulative gas injection at the maximum pressure was 97.6% compared to that of pure CO2; however, at the end of the injection, it decreased to 96.31%. At a concentration of 20%, 87.21% of the gas was injected at the maximum pressure; at the end of the injection, it decreased to 79.82%. For H2S at a concentration of 3.5%, the cumulative gas masses at the maximum pressure reaching point and at the end of the injections were 99.21% and 99.73%, respectively. Furthermore, at a H2S concentration of 20%, the cumulative gas masses, compared to pure CO2 at max pressure, were 96.60% and 97.86%, respectively. Based on these results, the cumulative injected gas mass varies depending on the time required to reach the maximum pressure, and the variation increases with impurity concentration.
The difference in CO2 injection efficiency owing to impurities during the last 3 years before the end of the injection is described in Table 7. Two years before the end of the injection, on 1 January 2028, when the impurity concentration was 3.5%, the CO2 injection efficiency was 96.5% regardless of the type of impurity. However, when the impurity concentration was set to 20%, including methane, it resulted in an efficiency of 79.7%, and including H2S, it resulted in an efficiency of 80.8%, showing a difference of within 1% compared with the CO2 injection efficiency without impurities. One year before the end of the injection (1 January 2029), the BHP reached the maximum pressure when injecting pure CO2. However, when injecting CO2 mixed with methane, the BHP reached the maximum pressure earlier, resulting in reduced injection rates. Consequently, when the methane content was 3.5%, the CO2 injection efficiency decreased to 96.1%, and when 20% methane was present, it decreased further to 76.2%. However, the CO2 injection efficiency with H2S as an impurity showed no significant change compared with that of the previous year. In 2030, when methane was present, the injection efficiency of pure CO2 showed a gradual decline, with an efficiency of 95.4% at a 3.5% methane concentration and an efficiency of 73.16% at a 20% methane concentration. When H2S was present as an impurity, BHP reached its maximum pressure between 2029 and 2030, after which the injection rate began to decrease. As a result, at the end of the injection period, when the H2S concentration was 3.5%, the CO2 injection efficiency increased to 96.91% compared with that of pure CO2 and 81.99% when the concentration was 20%. Therefore, before reaching the maximum BHP pressure, the designed impurities were injected; however, after reaching that point, the storage efficiency varied based on the properties of the impurities.
Table 7.
Differences in CO2 injection efficiency owing to impurity.
4.3. Effects of Impurities on CO2 Trapping Efficiency
The efficiency of CO2 storage in the dissolution and residual traps was analyzed to examine the impact of impurities on CO2 trapping. Figure 7 illustrates the variation in the efficiency of the residual trap. When methane concentration was 3.5%, the efficiency of the residual trap was 96.5% at the end of the injection but decreased to 95.7% after 100 years of monitoring. At a methane concentration of 20%, the efficiency of the residual trap was 83.3% at the end of the injection but decreased to 71.2% at the monitoring endpoint. However, in the case of a H2S concentration of 3.5%, the efficiency of the residual trap was 96.7% at the end of the injection and increased to 97.1% at the monitoring endpoint. At a concentration of 20%, the efficiency was 80.8% at the end of the injection but increased to 82.3% at the monitoring endpoint. The efficiency of the residual trap consistently decreased when methane was included and showed an increasing trend with H2S. At a concentration of 20%, the efficiency of the residual trap for methane was higher than that for H2S at the end of the injection; however, at the monitoring endpoint, the efficiency of the H2S trap was higher.
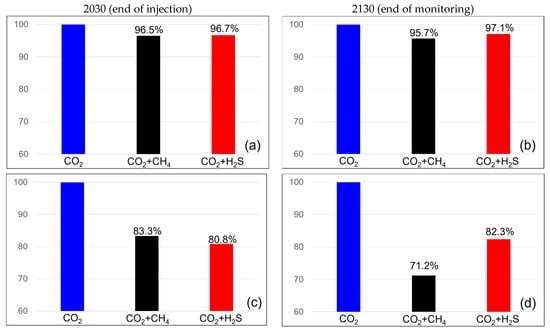
Figure 7.
Residual trapping efficiency differences between the end of the injection (left) and monitoring (right) with impurities ((a,b) contains 3.5% impurity, (c,d) contains 20% impurity).
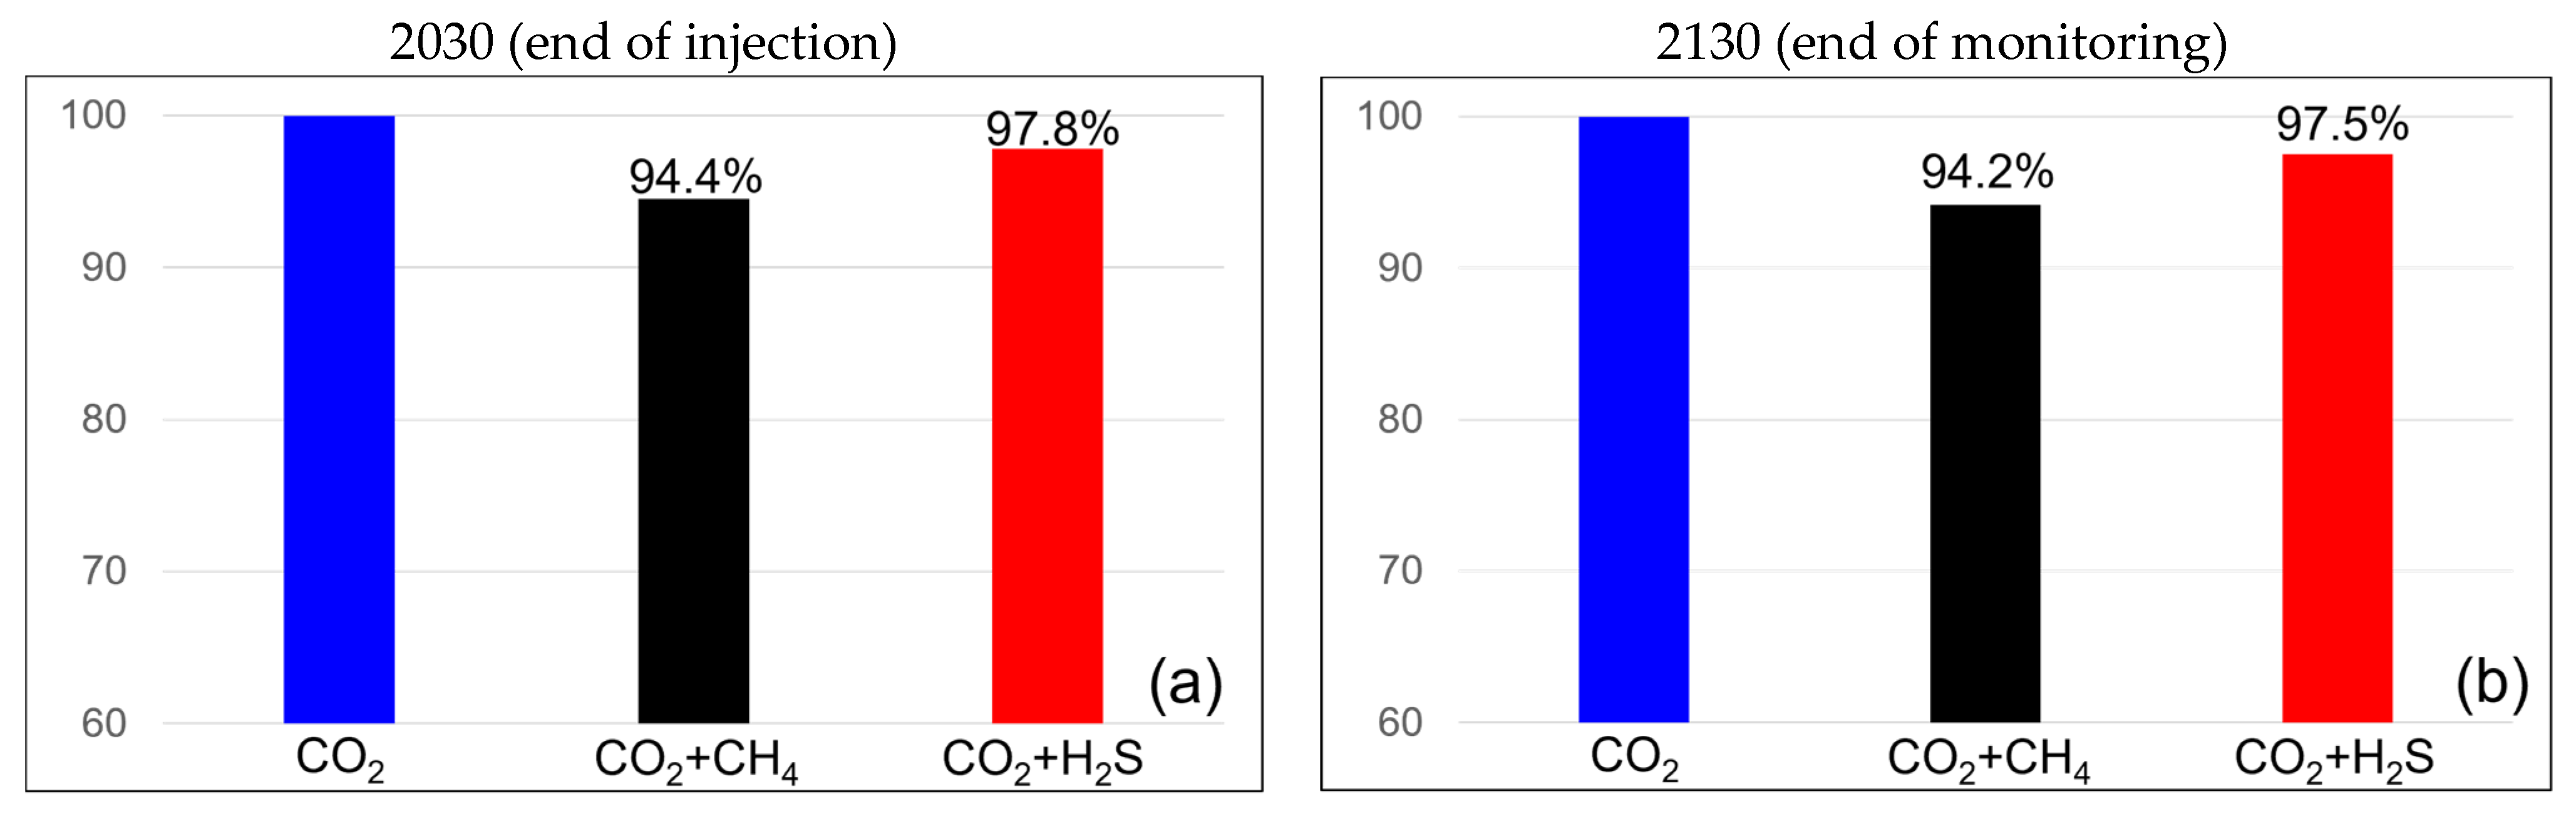
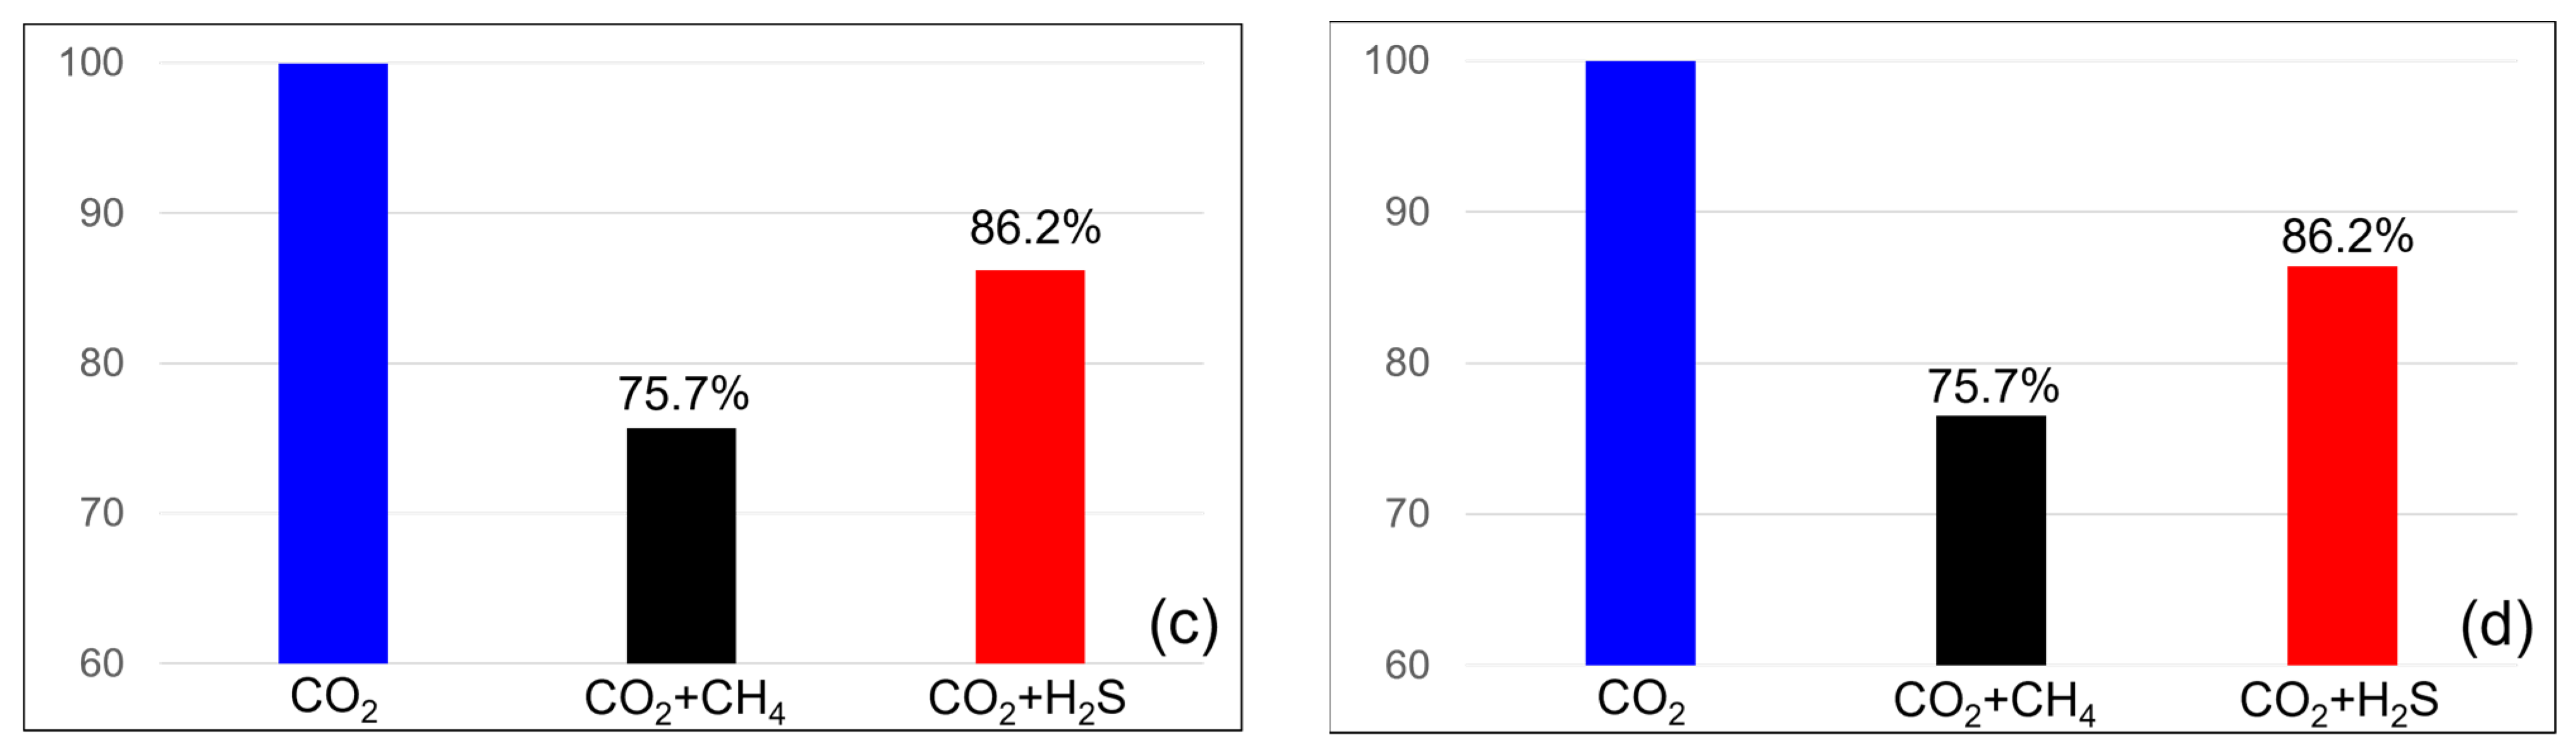
The efficiencies of the dissolution traps are shown in Figure 8. When methane was present at 3.5%, the dissolution trap efficiency was 94.2% at the end of the injection and remained constant at 94.2% at the monitoring endpoint. When the methane concentration was 20%, the efficiency was 75.7% at both the end of injection and the monitoring endpoint. In the case of H2S at a concentration of 3.5%, the dissolution trap showed an efficiency of 97.8% at the end of the injection, which decreased slightly to 97.5% at the monitoring endpoint. For H2S at a concentration of 20%, the efficiency remained the same at both the end of injection and the monitoring endpoint at 86.2%. H2S exhibited a higher dissolution trap efficiency than methane, and unlike the residual trap, it showed minimal changes over time.
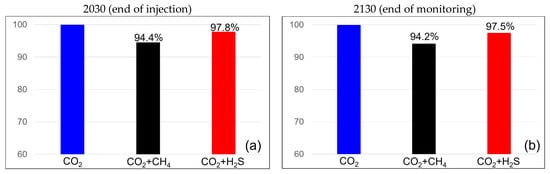
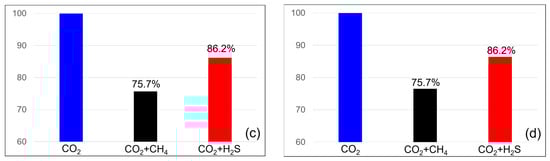
Figure 8.
Differences in solubility trapping efficiency between the end of the injection (left) and monitoring (right) with impurities ((a,b) contains 3.5% impurity, (c,d) contains 20% impurity).
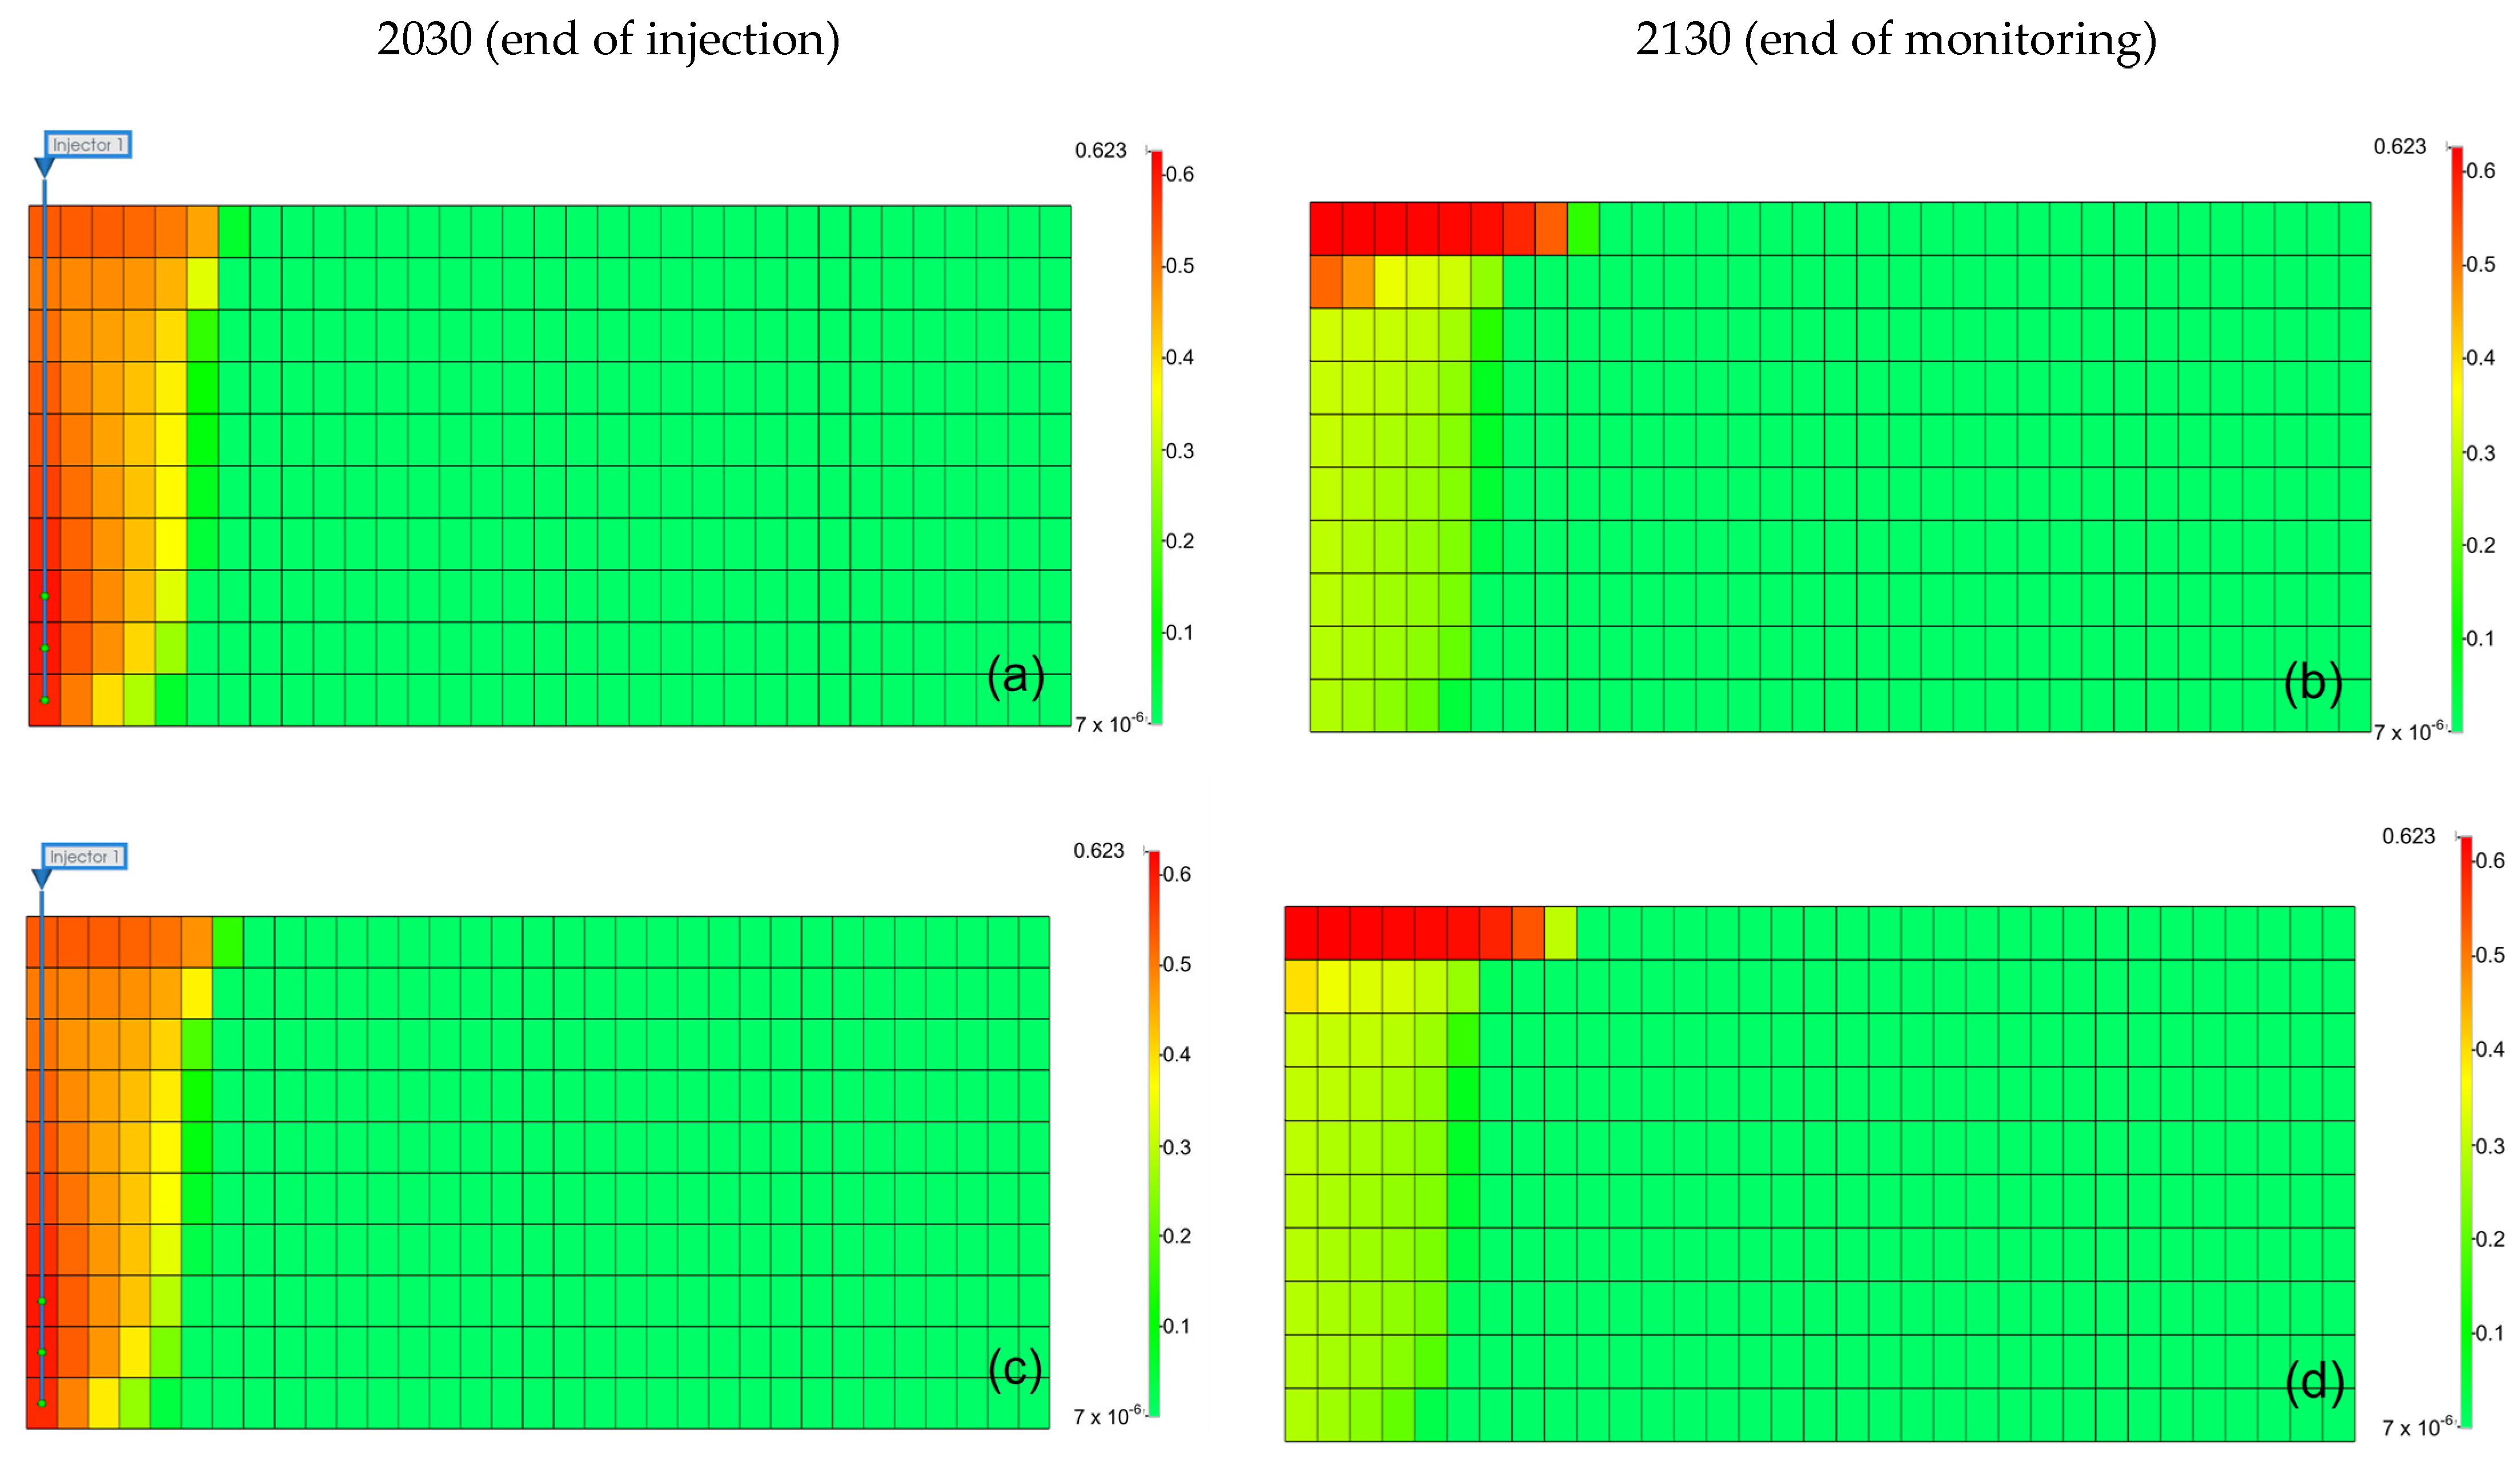
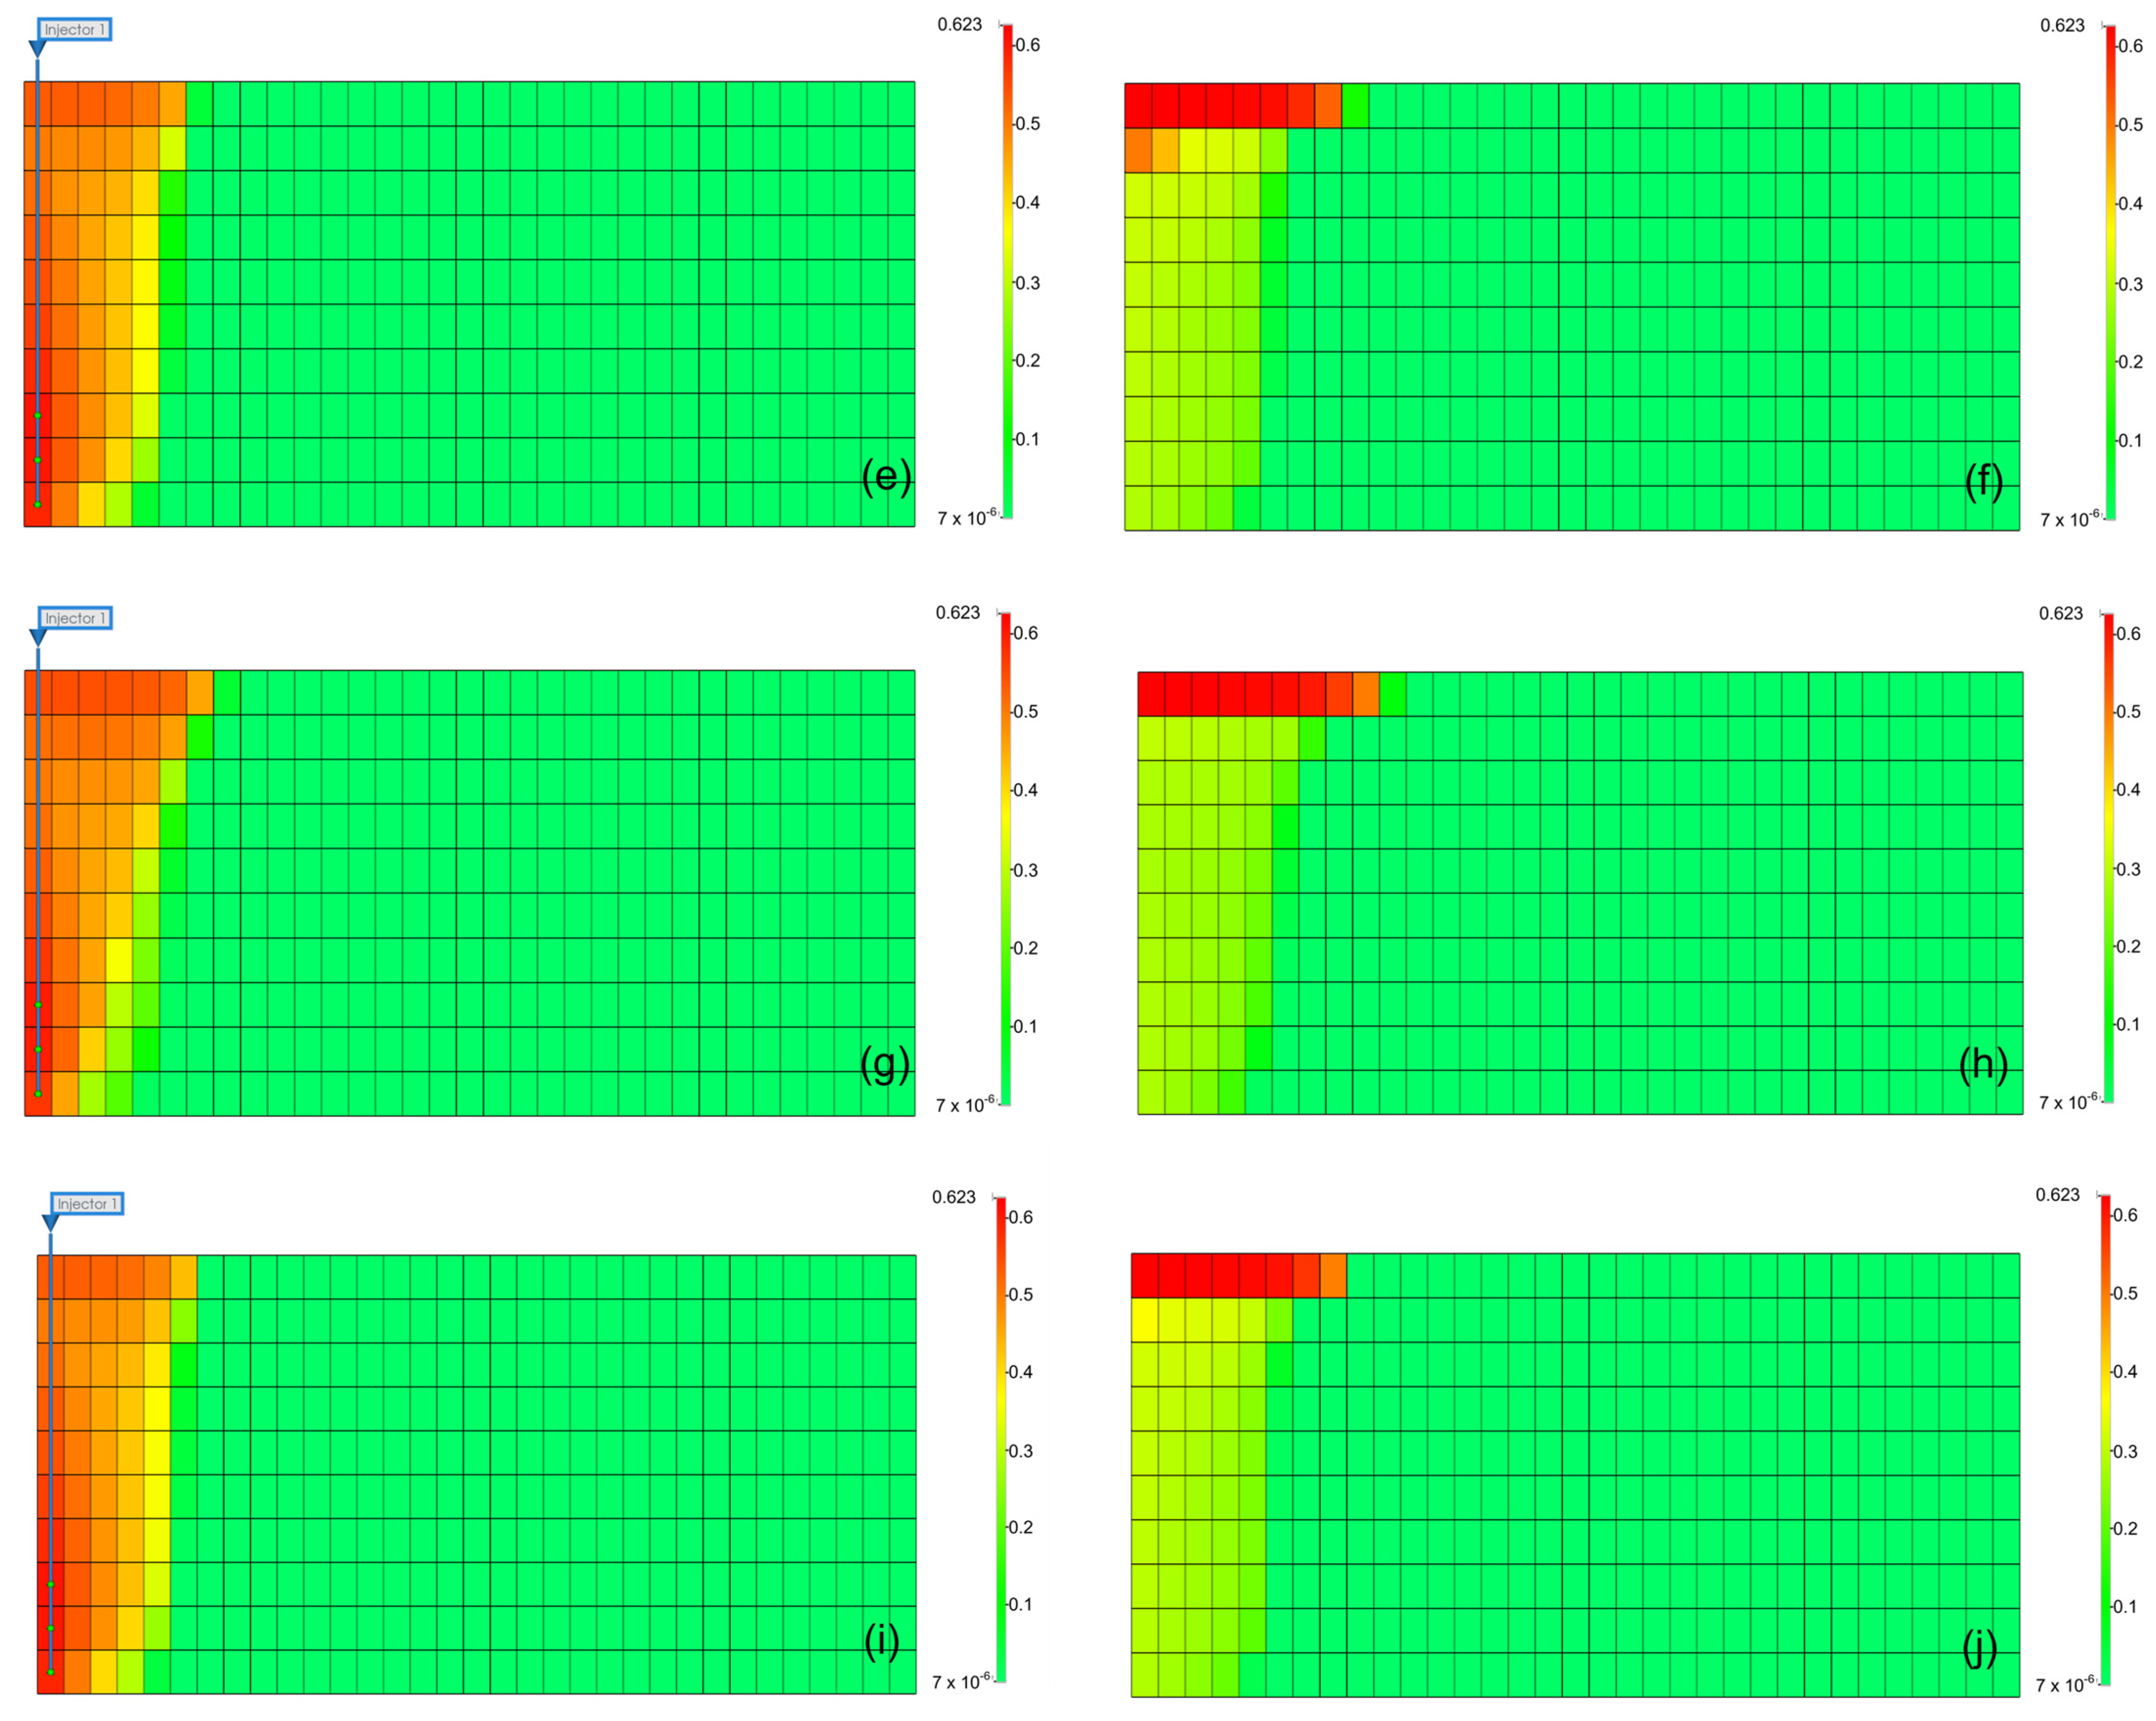
The results can be interpreted based on the behavior of gases in the aquifer. Figure 9 illustrates the gas saturation within the aquifer. When methane was present as an impurity, the gas saturation near the injection well was lower than that of pure CO2, and owing to the density difference of gases, methane moved faster to the upper part of the aquifer, reducing the contact time between the gas and formation water, leading to a decrease in the solubility effect [31]. Furthermore, when methane was included, the residual gas saturation was lower than that with pure CO2 because the presence of methane reduced the volume fraction and viscosity of CO2 in the gas mixture, negatively affecting the residual trapping efficiency. However, when H2S was included, although the density decreased, the volume fraction of CO2 within the gas increased. Because of the higher viscosity compared to that of pure CO2, the residual trapping efficiency in the residual trap was higher.
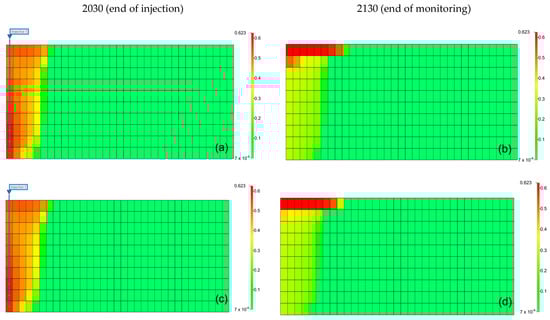
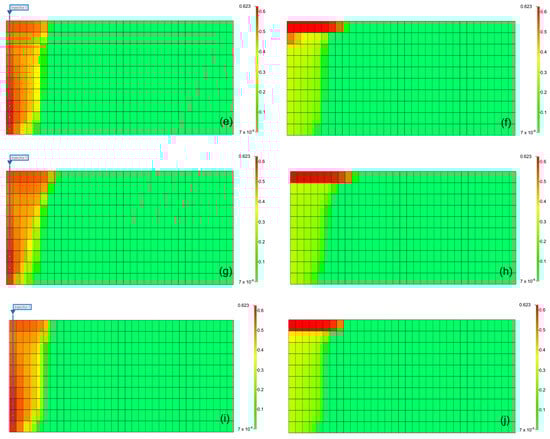
Figure 9.
Distribution of gas saturation at the end of the injection (left) and monitoring (right) ((a,b) pure CO2, (c,d) CO2 (96.5%) + CH4 (3.5%), (e,f) CO2 (96.5%) + H2S (3.5%), (g,h) CO2 (80%) + CH4 (20%), (i,j) CO2 (80%) + H2S (20%)).
5. Discussion
In the hydrogen production process, impurities, such as H2S and methane, are present in the CO2 stream. We conducted simulations that considered the properties and injection of these impurities into the CO2 stream under aquifer conditions. When non-condensable gases such as methane were included as impurities, compared to pure CO2, significant differences occurred, whereas the presence of H2S did not cause significant differences. Additionally, during the aquifer injection simulations, when methane was included, the BHP reached the maximum pressure more rapidly than with pure CO2, whereas H2S exhibited a delayed effect. This difference increased as impurity concentration increased and affected the injection rate and total gas volume injected after reaching the maximum pressure. Moreover, when methane was included as an impurity, the density, viscosity, and volume ratio changed, leading to reduced efficiency in both residual and solubility trapping, which can permanently store CO2. Based on these findings, for CCS projects involving CO2 streams with methane impurities, separation techniques, such as membrane systems, may be necessary for impurity removal. However, if H2S is present as an impurity, it may not significantly impact the storage efficiency, indicating that facilities such as desulfurization units may not be required for CO2 streams with H2S impurities. The application of CCS to carbon dioxide emissions containing H2S as an impurity reduced additional costs and ensured stable carbon storage. Additionally, the presence of H2S did not significantly affect CCS efficiency in our study. Therefore, it enables economically feasible CCS operations.
6. Conclusions
In this study, CO2 storage efficiency was analyzed when CO2, along with impurities such as methane and H2S, which are captured by CO2 in the hydrogen production process, was injected into a deep saline aquifer. Fluid modeling was conducted by mixing methane and H2S with CO2, followed by the simulation of injection into a 3D saline aquifer model. The following conclusions were drawn from this study:
- Impurities affected the CO2 stream under initial reservoir conditions. In the case of methane, the density decreases compared to that of pure CO2, and its volume ratio increases, whereas the viscosity decreases. In contrast, a smaller change in density is shown in H2S than in methane, and its volume decreases relative to the injection concentration, whereas, compared to pure CO2, its viscosity increases;
- When the same amount of gas is injected into the reservoir, reaching the pressure limit of the reservoir occurs more rapidly when methane is present, while that with H2S takes longer than that with pure CO2. The difference in the time required to reach the pressure limit increases with impurity concentration. These phenomena affect the amount of CO2 injected into the stream;
- Once the pressure limit is reached, the injection amounts differ, leading to variations in CO2 storage. Methane present at 3.5% resulted in 95.04% CO2 injection, and at 20%, only 73.16% CO2 was injected. In contrast, with H2S at 3.5%, 96.91% CO2 was injected, and at 20%, 81.99% CO2 was injected. Consequently, methane stores less CO2 relative to the mixture ratio, whereas H2S stores more;
- Methane results in a relatively low density, reducing the contact time between the brine and CO2 and decreasing the dissolution effect. The CO2 volume ratio within the gas mixture also decreases, leading to a reduced amount of CO2 that can be retained in the rock pores;
- When storing CO2 underground, methane causes a rapid increase in BHP and decreases storage efficiency. However, if H2S is not removed and injection occurs with CO2, the BHP increases more slowly than with the pure CO2 injection. Additionally, the volume ratio of CO2 in the mixed gas decreases, leading to improved storage efficiency. For CCS projects, methane impurities in the CO2 stream require removal. In contrast, H2S may not require steps such as desulfurization because it does not significantly impact CO2 storage efficiency. Employing CCS for carbon dioxide emissions containing H2S as an impurity can enable economically viable operations by reducing additional costs.
Author Contributions
S.K.: conceptualization, methodology, writing—original draft, visualization, and validation; S.-M.K.: project administration and writing—review and editing; H.J.: supervision, writing—review and editing, and validation. All authors have read and agreed to the published version of the manuscript.
Funding
This work was supported by the Energy & Mineral Resources Development Association of Korea (EMRD) grant funded by the Korean government (MOTIE) (2021060001, Data science-based oil/gas exploration consortium), (2) a 2021 research grant from Kangwon National University, and (3) the “Regional Innovation Strategy (RIS)” through the National Research Foundation of Korea (NRF) funded by the Ministry of Education (MOE) (2022RIS-005).
Institutional Review Board Statement
Not applicable.
Informed Consent Statement
Not applicable.
Data Availability Statement
Data will be made available on request.
Conflicts of Interest
The authors declare that they have no known competing financial interests or personal relationships that could have appeared to influence the work reported in this paper.
Nomenclature
| List of Abbreviations | |
| CO2 | Carbon dioxide |
| H2S | Hydrogen sulfide |
| CCS | Carbon capture and storage |
| LSSVM | Least square support vector machine |
| VLE | Vapor–liquid equilibrium |
| SMR | Steam methane reforming |
| WAG | Water alternating gas |
| EOR | Enhanced oil recovery |
| EGR | Enhanced gas recovery |
| WGS | Water gas shift |
| CMG | Computer modeling group |
| CH4 | Methane |
| H2O | Water |
| H2 | Hydrogen |
| CO | Carbon monoxide |
| C | Carbon |
| O2 | Oxygen |
| MEA | Monoethanolamine |
| COS | Carbonyl sulfide |
| Ar | Argon |
| SOx | Sulfur oxide |
| NOx | Nitrogen oxide |
| N2 | Nitrogen |
| NH3 | Ammonia |
| pH | Power of hydrogen |
| H2CO3 | Carbonic acid |
| H+ | Hydrogen ion |
| HCO3− | Bicarbonate |
| HS− | Bisulfide |
| H3O+ | Hydronium ion |
| PR-EOS | Peng–Robinson equation of state |
| BHP | Bottom-hole pressure |
| Cum Gas | Cumulative gas |
| List of Symbols | |
| Pressure | |
| R | Universal gas constant |
| T | Temperature |
| Volume of mixture | |
| b | Repulsion effect |
| Critical temperature | |
| Critical pressure | |
| Mole fraction | |
| Binary parameter | |
| Fugacity of gas phase | |
| Fugacity of aqueous phase | |
| Fugacity of component | |
| Mole fraction of in the liquid phase | |
| Henry’s constant | |
| Concentration | |
| Time | |
| Fick’s diffusion coefficient | |
| Greek Symbol | |
| Acentric factor |
References
- Ministry of Trade, Industry and Energy. First Master Plan for Implementing the Hydrogen Economy. Available online: https://www.motie.go.kr/motie/ms/nt/announce2/bbs/bbsView.do?bbs_seq_n=67130&bbs_cd_n=6 (accessed on 7 June 2023).
- Wang, J.; Ryan, D.; Anthony, E.J.; Wigston, A. Effect of Impurities on Geological Storage of CO2 2. EAGHIG; Global CCS Institute: Cheltenham, UK, 2011. [Google Scholar]
- Exxon Mobil. Shute Creek. Exxon Mobil Shute Creek Treating Facility Subpart PR Amended Monitoring, Reporting and Verification Plan 2019. Available online: https://www.epa.gov/sites/default/files/2019-12/documents/shutecreekmrvplan2019.pdf (accessed on 6 June 2023).
- Szott, W.; Łętkowski, P.; Gołąbek, A.; Miłek, K. Modelling of the long-term acid gas sequestration and its prediction: A unique case study. Energies 2020, 13, 4701. [Google Scholar] [CrossRef]
- Clark, D.E.; Oelkers, E.H.; Gunnarsson, I.; Sigfússon, B.; Snæbjörnsdóttir, S.Ó.; Aradóttir, E.S.; Gíslason, S.R. Carbfix2: CO2 and H2S mineralization during 3.5 years of continuous injection into basaltic rocks at more than 250 °C. Geochim. Cosmochim. Acta 2020, 279, 45–66. [Google Scholar] [CrossRef]
- Nogueira, M.; Mamora, D.D. Effect of flue-gas impurities on the process of injection and storage of CO2 in depleted gas reservoirs. J. Energy Resour. Technol. 2008, 130, 013301. [Google Scholar] [CrossRef]
- Li, D.; He, Y.; Zhang, H.; Xu, W.; Jiang, X. A numerical study of the impurity effects on CO2 geological in layered formation. Appl. Energy 2017, 199, 107–120. [Google Scholar] [CrossRef]
- Gaus, I.; Azaroual, M.; Czernichowski-Lauriol, I. Reactive transport modelling of the impact of CO2 injection on the clayey cap rock at Sleipner (North Sea). Chem. Geol. 2005, 217, 319–337. [Google Scholar] [CrossRef]
- Cho, J.; Min, B.; Kwon, S.; Park, G.; Lee, K.S. Compositional modeling with formation damage to investigate the effects of CO2-CH4 water alternation gas (WAG) on performance of coupled enhanced oil recovery and geological carbon storage. J. Petrol. Sci. Eng. 2021, 205, 108795. [Google Scholar] [CrossRef]
- Kim, Y.; Jang, H.; Kim, J.; Lee, J. Prediction of storage efficiency on CO2 sequestration in deep saline aquifers using artificial neural network. Appl. Energy 2017, 185, 916–928. [Google Scholar] [CrossRef]
- Sedaghat, M.; Rouhibakhsh, K. Investigation of carbon dioxide capture and storage by a novel LSSVM-GA method. Pet. Sci. Technol. 2020, 38, 421–427. [Google Scholar] [CrossRef]
- Schöneich, S.; May, F.; Vosteen, H.D. Influence of Impurities in CO2-Rich Gas Mixtures on the Storage Capacity of Mature Natural Gas Fields; DGMK/ÖGEW-Frühjahrstagung; Fachbereich Aufsuchung und Gewinnung: Celle, Germany, 2007. [Google Scholar]
- Lee, Y.; Kim, G.; Ki, S.; Seo, J. Development of Conceptual Cost Estimation Model for an Economic Analysis of Steam Methane Reforming based Hydrogen Production. J. Korean Soc. Miner. Energy Resour. Eng. 2022, 59, 193–204. [Google Scholar] [CrossRef]
- Kim, J.W.; Sim, K.S. Hydrogen Production Technologies from Coal. J. Korean Hydrog. Energy Soc. 1996, 7, 193–206. [Google Scholar]
- Aghel, B.; Janati, S.; Wongwises, S.; Shadloo, M.S. Review on CO2 capture by blended amine solutions. Int. J. Greenh. Gas Control 2022, 119, 103715. [Google Scholar] [CrossRef]
- Sanz, W.; Mayr, M.; Jericha, H. Thermodynamic and economic evaluation of an IGCC plant based on the Graz cycle for CO2 capture. In Proceedings of the ASME Turbo Expo 2010: Power for Land, Sea, and Air, Glashow, UK, 14–18 June 2010; pp. 493–503. [Google Scholar] [CrossRef]
- Lavalin, S.N.C. Impact of Impurities on CO2 Capture, Transport and Storage; IEA: Paris, France, 2004. [Google Scholar]
- Metz, B.; Davidson, O.; Cononck, H.; Loos, M.; Meyer, L. IPCC Special Report on Carbon Dioxide Capture and Storage; Cambridge University Press: New York, NY, USA, 2005; pp. 105–179. [Google Scholar]
- IEA Energy Technology Systems Analysis Programme. CO2 Capture and Storage; IEA ETSAP Technology Brief E14. 2010. Available online: https://iea-etsap.org/E-TechDS/PDF/E14_CCS_oct2010_GS_gc_AD_gs.pdf (accessed on 13 June 2023).
- Aminu, M.D.; Nabavi, S.A.; Manovic, V. CO2-brine-rock interactions: The effect of impurities on grain size distribution and reservoir permeability. Int. J. Greenh. Gas Control 2018, 78, 168–176. [Google Scholar] [CrossRef]
- Wang, Z.; Wang, J.; Lan, C.; He, I.; Ko, V.; Ryan, D.; Wigston, A. A study on the impact of SO2 on CO2 injectivity for CO2 storage in a Canadian saline aquifer. Appl. Energy 2016, 184, 329–336. [Google Scholar] [CrossRef]
- Huh, C.; Kang, S.G. Effect of nitrogen impurity on process design of CO2 marine geological storage: Evaluation of equation of state and optimization of binary parameter. J. Korea Soc. 2009, 12, 217–226. [Google Scholar]
- Feizabadi, S.A. An Equation-of-State Based Mathematical Modeling of Four-Phase Flow in Porous Media. Ph.D. Thesis, University of Calgary, Calgary, AB, Canada, 2013. [Google Scholar]
- Nghiem, L.; Sammon, P.; Grabenstetter, J.; Ohkuma, H. Modeling CO2 storage in aquifers with a fully-coupled geochemical EOS compositional simulator. In Proceedings of the SPE/DOE symposium on Improved Oil Recovery, Tulsa, OK, USA, 17–21 April 2004. [Google Scholar]
- Rezk, M.G.; Farid Ibrahim, A.; Adebayo, A.R. Influence of impurities on reactive transport of CO2 during geo-Sequestration in saline aquifer. Fuel 2023, 344, 127994. [Google Scholar] [CrossRef]
- Reid, R.C.; Sherwood, T.K.; Street, R.E. The Properties of Gases and Liquids. Phys. Today 1959, 12, 38–40. [Google Scholar] [CrossRef]
- Ministry of Oceans and Fisheries. Available online: https://www.mof.go.kr/doc/ko/selectDoc.do?menuSeq=971&bbsSeq=10&docSeq=2046 (accessed on 28 August 2023).
- Lee, Y.S.; Park, Y.C.; Kwon, S.I.; Sung, W.M. The feasibility study for CO2 sequestration into deep saline aquifer at Goare-V structure in Korea. J. Korean Soc. Geosyst. Eng. 2008, 45, 381–393. [Google Scholar]
- Kim, N.H.; Jung, H.S.; Kim, G.D.; Jeong, H.; Shin, H.; Kwon, Y.K.; Choe, J. The stability assessment of an aquifer in Pohang Yeongil bay due to CO2 injection. J. Eng. Geol. 2018, 28, 183–192. [Google Scholar]
- Law, D.H.-S.; Bachu, S. Hydrogeological and numerical analysis of CO2 disposal in deep aquifers in the Alberta sedimentary basin. Energy Convers. Manag. 1996, 37, 1167–1174. [Google Scholar] [CrossRef]
- Blanco, S.T.; Rivas, C.; Fernández, J.; Artal, M.; Velasco, I. Influence of methane in CO2 transport and storage for CCS technology. Environ. Sci. Technol. 2012, 46, 13016–13023. [Google Scholar] [CrossRef] [PubMed]

Disclaimer/Publisher’s Note: The statements, opinions and data contained in all publications are solely those of the individual author(s) and contributor(s) and not of MDPI and/or the editor(s). MDPI and/or the editor(s) disclaim responsibility for any injury to people or property resulting from any ideas, methods, instructions or products referred to in the content. |
© 2023 by the authors. Licensee MDPI, Basel, Switzerland. This article is an open access article distributed under the terms and conditions of the Creative Commons Attribution (CC BY) license (https://creativecommons.org/licenses/by/4.0/).