Article

Study on Carbon Emission Measurement and Influencing Factors for Prefabricated Buildings at the Materialization Stage Based on LCA

School of Civil Engineering Architecture and Environment, Hubei University of Technology, Wuhan 430068, China
*
Author to whom correspondence should be addressed.
Sustainability 2023, 15(18), 13648; https://doi.org/10.3390/su151813648
Submission received: 16 August 2023 / Revised: 11 September 2023 / Accepted: 11 September 2023 / Published: 12 September 2023
(This article belongs to the Special Issue Low-Carbon Buildings and Climate Change Mitigation)

Abstract

:
To conduct a more in-depth study on carbon emissions and influencing factors during the materialization stage of prefabricated buildings, this paper focused on a residential prefabricated building in Beijing. The LCA method, combined with BIM technology, was utilized to establish a process-based “LCA-BIM” carbon emission statistical platform and to propose a carbon emission calculation method. The carbon emissions during the materialization stage were calculated. The results revealed that the production of building materials contributed the highest proportion of carbon emissions, accounting for 85.73% of the total emissions during the materialization stage. Specifically, reinforcing steel and concrete dominated the overall carbon emissions from building materials, accounting for 97.44% of the total. Through a quantitative analysis in the process of carbon emissions calculation, the main factors influencing the carbon emissions during the production stage of building materials were identified. This study adopts a combined approach of empirical analysis and a literature review, establishing six basic hypotheses for four aspects: material selection, energy consumption, material storage, and carbon emissions in the production stage of building materials. A structural equation model was used to theoretically validate the influencing factors in the production stage of prefabricated building materials. SPSS27.0 and AMOS28 software were employed for data analysis. From the perspective of the overall impact, material selection had the strongest overall impact on the production stage of building materials, followed by energy consumption, while material storage had the smallest overall impact. From the perspective of direct impacts, energy consumption had the strongest direct impact on the carbon emissions in the production stage of the building materials. The findings of this study can provide a theoretical reference for national institutions and businesses for carbon emission evaluation and decision-making.

1. Introduction

Currently, China is gradually accelerating its process of industrialization, resulting in a continuous increase in greenhouse gas emissions. The total carbon emissions rank among the highest in the world. In order to showcase its role as a major country, China is shouldering an increasingly important responsibility in reducing greenhouse gas emissions. Data indicate that the construction industry accounts for 40% of global energy-related carbon emissions [1], and its impact on the environment is profound and long-lasting. According to the “Research Report on China’s Building Energy Consumption and Carbon Emissions (2020)” [2], the total carbon emissions from China’s construction industry reached 4.93 billion tons of CO2 in 2018, equivalent to 51.3% of the country’s total carbon emissions [3,4]. In order to achieve China’s proposed goals of “peak carbon emissions” and “carbon neutrality” [5,6,7], it is essential to effectively control the carbon emissions from the construction industry. The “14th Five-Year Plan for the Development of the Construction Industry” issued by China’s Ministry of Housing and Urban-Rural Development encouraged the development of prefabricated buildings, with prefabricated buildings accounting for over 30% of new buildings by the end of the planning period [8]. Currently, the carbon emissions of China’s construction industry mainly come from traditional “cast-in-place” buildings [9,10,11], with reinforcement steel and concrete being the primary building materials, resulting in significant carbon emissions during the construction stage. To meet modern environmental standards, it is necessary to reform traditional construction methods and adopt low-carbon building materials and construction techniques, to reduce carbon emissions [12,13,14]. Prefabrication technology [15,16] is one of the key means of energy conservation and emission reduction. Compared to cast-in-place structures, prefabricated composite panels require less concrete, reinforcement steel, and formwork, and can also reduce the generation of construction waste. With its environmental benefits, prefabricated construction [17,18] has been widely applied in countries around the world.
Against the backdrop of low-carbon development, numerous scholars have conducted extensive research on the carbon emissions of buildings. According to research by Yan [19], the operational stage accounts for approximately 80% of the total life cycle of carbon emissions of buildings, while the materialization stage accounts for nearly 20%. The materialization stage [20] refers to the process of material production, component processing and manufacturing, product transportation, and construction installation, before the building is put into use. From an overall perspective, the carbon emissions in the materialization stage are not high. However, considering the annual average carbon emissions [21,22], the carbon emissions in the materialization stage are much higher than those in the operational stage, making the study of this stage significant. Researchers have conducted studies on the calculation of carbon emissions in the materialization stage of buildings. Xiao [23] conducted a calculation study on the carbon emissions in the materialization stage of a railway bridge. The results showed that the carbon emissions in the materialization stage of the bridge were 70,426,750 kg, with material production contributing as much as 78%, the transportation stage contributing 15%, and construction stage contributing the lowest, at only 8%. Qian [24] calculated the materialization stage carbon emissions of a certain rail transit station as an example and, through a case analysis, found that steel accounted for a higher proportion in the carbon emissions from building materials, at 50.84%; diesel was the main source of carbon emissions from machinery consumption, accounting for 70.62%; and personnel accounted for a high proportion of 78%. Luo [25] proposed a calculation method for materialization carbon emissions in the design stage, providing suitable methods for different design stages. The materialization carbon emissions of prefabricated buildings were evaluated by Sun [26], and through empirical analysis of relevant cases, the evaluation result of the project was classified as AA grade, representing a moderate level of carbon emissions. Wang [27] conducted a comparative analysis of the materialization carbon emissions between prefabricated buildings and cast-in-place buildings, and the results showed that the carbon emissions per square meter in the materialization stage of prefabricated buildings were reduced by 2.65 kg compared to cast-in-place buildings. This study primarily focuses on the impacts generated by prefabricated buildings in the materialization stage.
Traditional carbon emission calculations suffer from the complexity of measurement methods and a lack of accuracy. The emergence of building information modeling (BIM) technology [28] has transformed the traditional calculation methods, by providing coordination and visualization capabilities. BIM plays a crucial role in the design and construction stages, breaking through the limitations of traditional carbon emission calculations by leveraging 3D models and project information. Core design software such as Revit2023 and quantity surveying software such as GTJ2021 [29] can significantly improve the accuracy and completeness of quantity data. In quantifying building carbon emissions, both domestic and international scholars commonly utilize the life cycle assessment (LCA) [30] method from a managerial perspective, to evaluate the environmental impacts of carbon emissions during the building production stage.
Currently, there is a significant amount of research on carbon emission calculation methods, but there has been relatively limited research on exploring the influencing factors [31]. Regarding the study of factors influencing building carbon emissions, literature surveys have revealed a main focus on two areas. First, from the perspective of the entire construction industry, research has been conducted on the factors affecting carbon emissions in the industry. For example, Yang [32] utilized scenario analysis and found that building area and energy consumption are key factors influencing carbon emissions in the construction industry. Second, research has focused on the entire lifecycle of buildings or solely on the carbon emissions factors during the operational stage. For instance, G. Becker [33] used a life cycle inventory analysis to assess the carbon emissions of five different types of residential building, and found that the building envelope played a significant role in carbon emissions during both the construction and operational stages. Structural equation modeling (SEM), which combines factor analysis and path analysis techniques, can evaluate the structure and relationships between various factors and assess the overall fit of the model. Given the strengths and applicability of SEM, it can effectively support this study.
This study adopts the life cycle assessment (LCA) method in conjunction with BIM technology to construct a process-based “LCA-BIM” [34] carbon emissions statistical platform. The study defines the boundaries for greenhouse gas emissions and the materialization stage carbon emission calculation for prefabricated buildings. Furthermore, a carbon emissions estimation model for the materialization stage of prefabricated buildings is proposed. The main influencing variables affecting carbon emissions in the production stage of building materials were identified through a quantitative analysis of the carbon emission measurement process. By combining existing research findings and empirical analysis, all influencing variables were determined. The internal structure was analyzed using a structural equation model (SEM), to theoretically validate the influencing variables and determine their strength and weakness, as well as identify the key influencing factors.

2. Research Methodology

The research methodology of this paper primarily encompassed three aspects: LCA, carbon emissions calculation, and analysis of influencing factors. The interrelationships between the methods are illustrated in Figure 1.

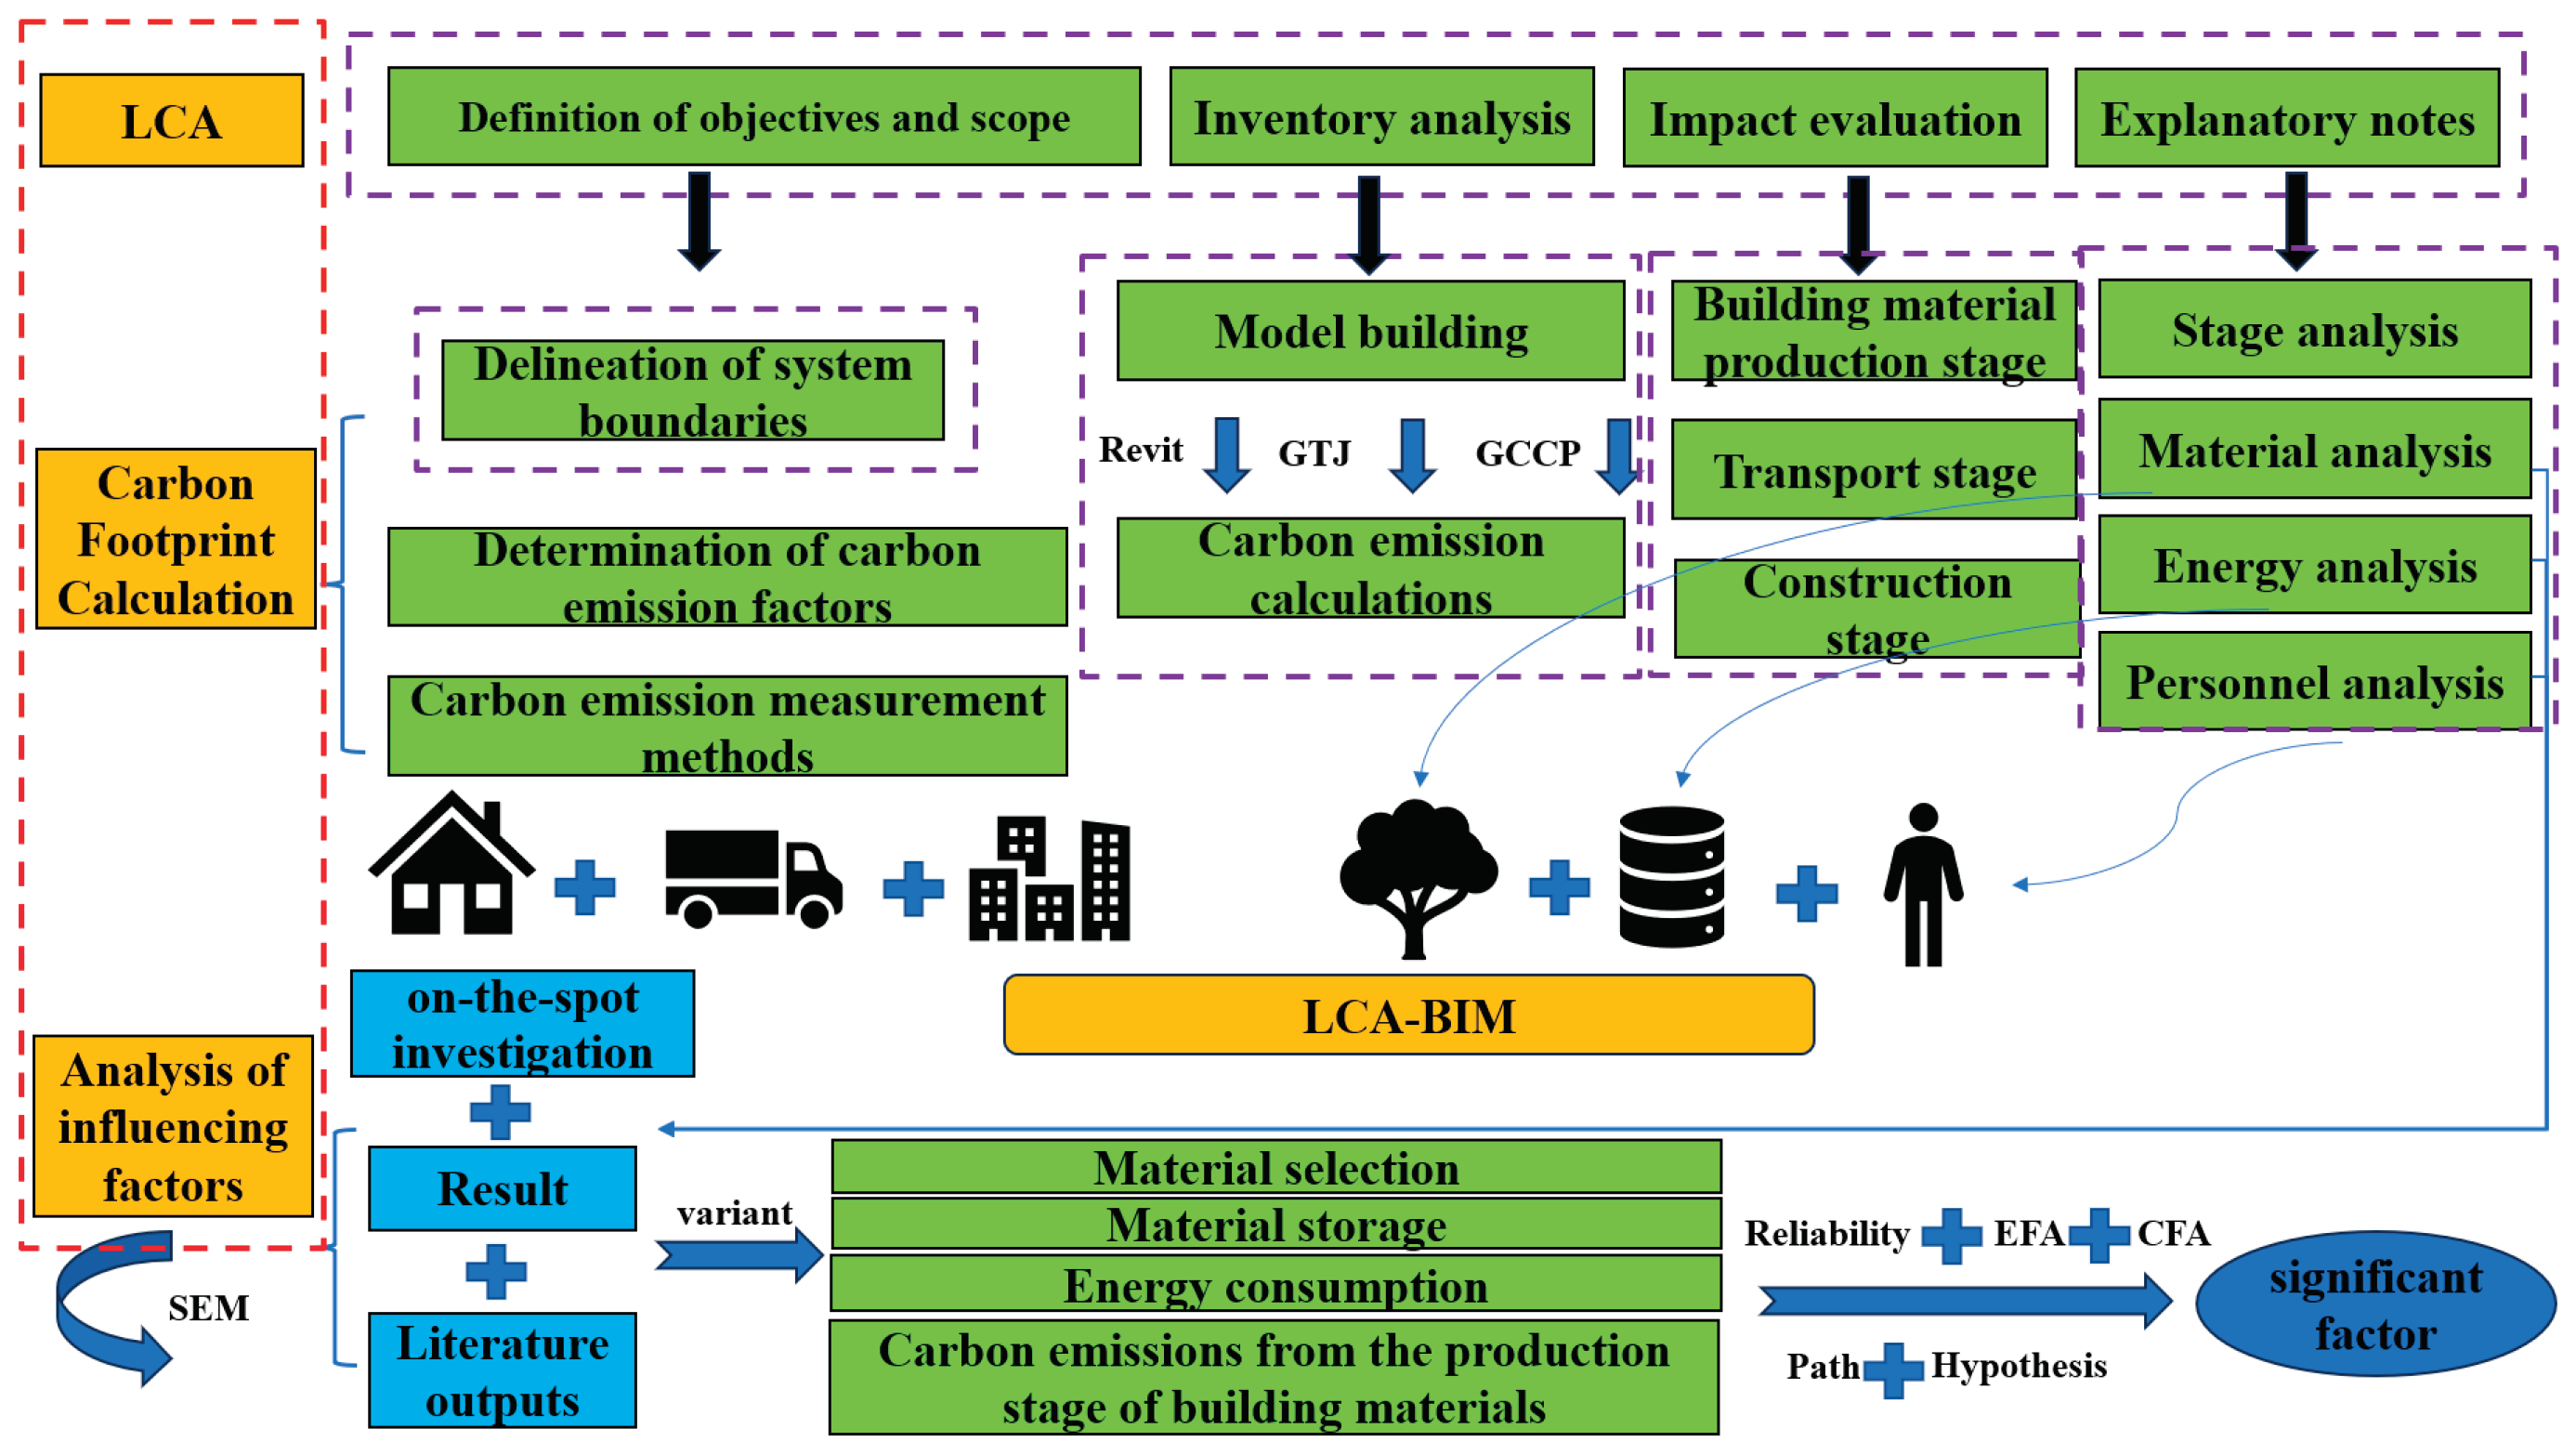
2.1. LCA Methodology

LCA is a method used to assess the environmental impact of a product throughout its lifecycle [30]. This study adopted a process-based analysis approach [30], known for its detailed and accurate procedures and that has gained significant recognition from the International Organization for Standardization (ISO). The LCA methodology is illustrated in Figure 2. The LCA method is divided into four steps, according to ISO 14040 [35] standard:
(1)
Goal and scope definition: Define the objectives, scope, and boundaries of the LCA study.
(2)
Inventory analysis: Collect data on energy and material consumption, and establish input or output inventories.
(3)
Impact assessment: Use the results from the inventory analysis to assess relevant potential environmental impacts.
(4)
Interpretation of results: Combine the results from the inventory analysis, conduct quantitative evaluations, and provide conclusions and recommendations.

2.2. Carbon Emission Calculation Methodology

2.2.1. Scope Boundary for Greenhouse Gas Measurements

The six greenhouse gases (GHGs) controlled under the Kyoto Protocol [36,37] are CO₂, CH₄, N₂O, HFCs, PFCs, and SF6. According to the Fifth Assessment Report of the Intergovernmental Panel on Climate Change (IPCC) [38], CO2 is the main greenhouse gas responsible for carbon emissions, accounting for 76% of the total. Since GHGs such as CH₄ account for a relatively low percentage and have less impact on the atmosphere, this study focused on studying CO2 as the target of carbon emissions.

2.2.2. Materialization Stage Carbon Emission Measurement Boundary

According to the definition of the materialization stage in building construction, the environmental carbon emissions generated by prefabricated buildings in this stage include three aspects: building material production, transportation, and construction. Some scholars have referred to this stage as the study of “from cradle to site” [20]. The carbon emissions in the building material production stage originate from the production of raw materials and the processing of prefabricated components. The carbon emissions in the transportation stage result from the transportation of materials and prefabricated components. The carbon emissions in the construction stage arise from the energy consumption of construction machinery and personnel during the installation of prefabricated components or cast-in-place parts. The boundaries for calculating the carbon emissions in the materialization stage are depicted in Figure 3.

2.2.3. Determination of Carbon Emission Factors

Due to regional and other differences, there is a lack of unified standards for determining carbon emission factor data in different countries. In this study, the carbon emission factors used were based on relevant research findings from both domestic and international sources, as well as data evaluated by the Intergovernmental Panel on Climate Change (IPCC). References for the carbon emission factors included the “2016 IPCC National Greenhouse Gas Inventory Guidelines” [38] and the “Calculation Standard for Building Carbon Emissions” GB/T51366-2019 [39]. For a detailed list of commonly used carbon emission factors, please refer to Table 1 and Table 2.

2.2.4. Building a Platform for Carbon Emission Statistics

Using BIM technology for modeling and calculating carbon emissions can improve the accuracy and efficiency of estimation, effectively avoiding the complexity and potential errors that can arise from manual calculations. By utilizing dynamic BIM models, it is possible to perform both horizontal and vertical comparisons of components, while also obtaining precise information on labor, materials, and machinery used in a construction project, thus enabling more accurate carbon emission calculations. If carbon emissions are estimated and solutions are proposed early in the design stage, significant reductions in carbon emissions can be achieved in the subsequent project stages [23].
First, using Revit software, we created an architectural model based on the drawing information and selected appropriate materials and components from the family library. In this case study, a distinction was made between conventional components and prefabricated components, considering that the building in question was a prefabricated building. Next, we input the material and energy consumption information for the components. Due to the close integration between GTJ software and local building market rates and relevant specifications, the quantity surveying results were more in line with actual construction engineering. Finally, we imported the Revit model into GTJ software using the GFC [40] plugin, to obtain a summarized bill of quantity for the model. For parts that are difficult to represent in specific quantities, such as the calculation of energy consumption during the transportation stage, the bill of quantity data can be imported into GCCP [41] software, for conversion between quantity and consumption. GCCP6.0 software provides detailed reports on various sub-items, including labor, materials, machinery, and more. Lastly, we input the labor, material, and machinery energy carbon emission factors into an Excel spreadsheet and compared them with the project quantities. By using the carbon emission calculation formula, the cumulative carbon emissions were calculated, resulting in the total carbon emissions for the materialization stage of the prefabricated building construction.
The concept of LCA can be applied to the analysis of processes in architectural projects. This was specifically demonstrated in the analysis of the bill of quantity and the use of BIM technology to solve the bill of quantity for sub-items. Therefore, it was possible to establish a process-based “LCA-BIM” carbon emission calculation platform. The specific process for carbon emission calculation is outlined in Figure 4.

2.2.5. Carbon Emission Measurement Modelling

This study divided the carbon emissions in the materialization stage into three stages: materials production, transportation, and construction. The specific calculation boundaries can be seen in Figure 3. Once the calculation boundaries had been determined, a carbon emissions calculation model was established. The total carbon emissions in the materialization stage were the sum of the carbon emissions from these three stages. The specific calculation model is as follows:
C = C P + C T + C C
where C is the total carbon emissions in the materialization stage (kgCO2e); CP is the carbon emissions in the production stage of building materials (kgCO2e); CT is the carbon emissions in the transportation stage (kgCO2e); and CC is the carbon emissions in the construction stage (kgCO2e).
  • The Production Stage of Building Materials
This stage of CO2 generation consists of two components: the production of building materials, and the carbon emissions from the processing of prefabricated components.
The carbon emissions from the production of building materials were calculated using the following formula:
C P 1 = i = 1 n J i W i
where Cp1 is the carbon emissions from the production of building materials (kgCO2e); n denotes the number of unit processes; Ji denotes the amount of the ith building material used; and Wi denotes the carbon emission factor for the ith building material.
The carbon emissions from the processing of prefabricated components were calculated according to the following formula:
C P 2 = d = 1 m W d e = 1 n E e , d V e
where Cp2 is the carbon emissions of precast processing (kgCO2e); m indicates the number of types of energy used; n indicates the number of types of precast processing; Ee,d indicates the amount of energy d used to produce a unit volume of precast e; Ve indicates the volume of precast e; and Wd indicates the carbon emission factor of energy d.
  • The Transportation Stage
This stage of CO2 generation consists of two components: carbon emissions from the transportation of building materials and carbon emissions from the transportation of prefabricated components.
The carbon emissions from the transportation of building materials were calculated according to the following formula:
C T 1 = i = 1 n M i L i W i
where CT1 is the carbon emissions of the building transportation process (kgCO2e); Mi denotes the usage of the ith building material (in tons); Li denotes the average transportation distance of the ith building material (in kilometers); and Wi denotes the carbon emission factor per unit weight of transportation distance under the transportation mode of the ith building material (in kgCO2e/t·km).
The carbon emissions from the transportation of prefabricated components were calculated according to the following formula:
C T 2 = f = 1 g W f e = 1 n L e , f Z e
where CT2 is the carbon emissions (in kgCO2e) of the transport process of prefabricated components; g denotes the number of transported prefabricated component types; Wf denotes the carbon emission factor of transport mode f; Le,f denotes the transport distance of transported component e using transport mode f; and Ze denotes the total weight of the eth prefabricated component.
  • The Construction Stage
The generation of CO2 in this stage contains two components: carbon emissions generated by construction machinery and carbon emissions generated by construction personnel at the construction site. As the standard has not yet explicitly defined a manual carbon emission factor, this study used a value of 2.07 kgCO2/person-working day for the carbon emissions of personnel per working day (working days were calculated on the basis of 8 h/day), based on Huang [42] who stated that the average annual carbon emissions of individuals are 2268 kg/year.
The carbon emissions from construction machinery were calculated according to the following formula:
C C 1 = d = 1 y W d e = 1 n E e , d V e
where CC1 is the carbon emissions of construction machinery (kgCO2e); y is the number of types of energy used; Wd is the energy carbon emission factor; Ee,d is the amount of energy d used to manufacture a unit volume of a precast or cast-in-place componente; and Ve is the volume of the precast or cast-in-place component e.
The carbon emissions of construction workers were calculated according to the following formula:
C C 2 = e = 1 n R e V e W r
where CC2 is the carbon emissions of the construction crew (kgCO2e); Re is the manual use of manufacturing component e; Ve is the volume of a component e; and Wr is the manual carbon emission factor.
  • Uncertainty and assumptions
Different researchers have conducted studies on the carbon emissions of prefabricated buildings. However, the use of different calculation models and variations in system boundaries resulted in significantly different research results. For instance, Xie [43] considered a conversion to CO2 equivalent when calculating greenhouse gases, while Sun [26] took material recycling into account in the production stage of carbon emissions calculation. These differences in factors can lead to varying carbon emission values. Therefore, in this study, the following assumptions were made during the calculation process:
Based on the drawing requirements, the transportation distance for prefabricated components was set at 150 km; the default transportation distance for concrete was 40 km; and for other building materials, the default transportation distance was 500 km (GB/T51366-2019) [39].
The project was located in Beijing, and the relevant carbon emissions data were based on the local standards and specifications of Beijing, which may differ from other regions.
In the carbon emission calculation process, commonly used major materials (concrete, rebar, fired bricks, steel, coatings, and sand) were listed and explained. Materials with lower quantities and lower costs, for which it is difficult to obtain carbon emission factors, were not included in the list. The omission of these materials may have impacted the final results [30].

3. Empirical Analysis

3.1. Case Overview

This project considered a residential building, Block 9, located in a plot in Beijing. The building consists of triplex units and adopts a prefabricated shear wall structure, with a prefabrication rate of 41.1%. It has nine above-ground floors and two underground floors, with a building height of 28.79 m and a total floor area of 5410.16 m2. The project was modeled using Revit software, and then imported into GTJ construction measurement software by Glodon in GFC format [40]. A model visualization is shown in Figure 5.

3.2. Analysis of the Carbon Emission Results

The case study is located in Beijing and relied on standards such as “Beijing Housing Construction and Decoration Engineering”, “Measurement Specification for Bill of Quantities (2013-Beijing)”, and “Budgetary Quotas for Construction Projects in Beijing” [44] to calculate the quantity, labor, material, and machinery consumption of the Block 9 project. Considering carbon emission factors, the calculated results for labor, material, and machinery carbon emissions at each stage are shown in Table 3. The carbon emission intensity per unit area for this project’s building was 387.29 kgCO2e/m2. Research by Wen [45] suggests that the carbon emission intensity per unit area for traditional cast-in-place buildings is 396.32 kgCO2e/m2. Compared to that, there was a reduction of 9.03 kgCO2e/m2, which is equivalent to 2.28%, indicating a significant carbon reduction effect.

3.2.1. Analysis of Carbon Emissions by Stage

Comparing carbon emissions across stages, as shown in (Figure 6), the production stage had the highest carbon emissions, reaching 1,796,362.23 kgCO2e, and accounting for 85.73% of the total. The transportation stage followed, with carbon emissions of 179,057.78 kgCO2e, accounting for 8.55%. The construction stage had the lowest carbon emissions, amounting for 119,890.02 kgCO2e. The high carbon emissions from building materials during the production stage were attributed to the large quantities and high emission coefficients. The carbon emissions from transportation exceeded those from the construction stage, due to the diverse range of materials involved in transporting prefabricated components over long distances, resulting in significant carbon emissions. In contrast, the consumption of labor, materials, and machinery energy during the construction of cast-in-place components was higher than that in transportation but the difference was not substantial. Overall, the carbon emissions from the transportation stage were greater than those from the construction stage.
According to the results shown in Figure 7a,b, it can be observed that there were differences in the carbon emission sources between the prefabricated and cast-in-place components. The main source of carbon emissions for the prefabricated components was the material production stage, accounting for 83.74%, particularly in the production of concrete and reinforcement. The second-largest source was the carbon emissions from the transportation of prefabricated components, accounting for 9.44%. The smallest contribution to carbon emissions was from the consumption of construction personnel in the construction stage, which only accounted for 0.32%. This is because prefabricated components are primarily manufactured in the production stage and require minimal labor during the construction stage, with construction machinery only used for transportation and installation.
For the cast-in-place components, the primary source of carbon emissions was also the material production stage. As seen in Figure 6, the carbon emissions from transportation were 87,030.42 kgCO2e, while the carbon emissions in the construction stage were 111,016.11 kgCO2e. This indicates that the carbon emissions generated during the construction stage were higher than those from transportation, due to the significant energy consumption of the construction machinery and the use of human resources during the concrete pouring and construction processes. Therefore, different strategies need to be adopted for carbon emission control for different types of components. For prefabricated components, it is important to focus on optimizing material production and the transportation process of prefabricated elements. For cast-in-place components, emphasis should be placed on optimizing the energy consumption of concrete pouring, construction machinery, and personnel.

3.2.2. Analysis of Personnel Carbon Emissions

By referring to “Beijing House Construction and Decoration Engineering” [44], it was determined that the amount of labor consumed during the construction of prefabricated components was as shown in Table 4. The highest emitting composite workday, for prefabricated stairs, was 1.436/m3. Through calculating, the carbon emissions generated by different prefabricated components, in terms of labor, was obtained, as shown in Figure 8. The carbon emissions generated by construction personnel for prefabricated walls were the highest, accounting for 41.74% and resulting in 932.62 kgCO2e, while the carbon emissions for composite floor slabs were 886.84 kgCO2e. The higher carbon emissions from prefabricated walls compared to composite floor slabs can mainly be attributed to the greater use of labor and time in the production process of the prefabricated walls. Additionally, although the quantity of composite floor slabs was 2.15-times that of the prefabricated walls, the composite workday for composite floor slabs was only 1/10 of prefabricated walls. Therefore, the carbon emissions from the composite floor slabs were 4.91% less than for the prefabricated walls. To further reduce carbon emissions, efforts could be made to reduce labor usage and working time during the production process of prefabricated walls, or more focus could be placed on the production of prefabricated components with lower composite workdays, such as composite floor slabs.

3.2.3. Analysis of Material Carbon Emissions

By analyzing the material quantity lists and carbon emission coefficients, the carbon emissions of the different materials were calculated. The results indicated that concrete and reinforcement were the main sources of carbon emissions, accounting for 97.44% of the material composition. This was due to the large quantities of these materials used in construction. As shown in Figure 9, concrete had the highest carbon emissions among all building materials, reaching 688,789.43 kgCO2e, followed by reinforcement, with emissions of 552,132.30 kgCO2e. The carbon emissions form reinforcement, concrete, and galvanized angle steel during the material production stage far exceeded those during the transportation stage. This is because the carbon emission factors of these primary building materials are high, such as 2340 kgCO2e/t for reinforcement, 295 kgCO2e/t for concrete, and 2757 kgCO2e/t for galvanized angle steel. On the other hand, the carbon emissions of sintered bricks were the lowest, only 229.38 kgCO2e. This is because the quantity used was relatively small, and the carbon emission factors during both the production and transportation stages were lower. According to the statistics, the carbon emissions of sand during the material transportation stage were far greater than those during the production stage, approximately 57-times higher. This indicates that when considering carbon emissions in the construction industry, the impact of material transportation should be taken into account, in addition to the carbon emission factors of materials.

3.2.4. Analysis of Carbon Emissions from Mechanical Energy

By calculating the number of shifts of construction machinery used, we were able to determine the carbon emissions resulting from their energy consumption, based on the energy consumption and carbon emission factors for each shift. The carbon emission parameters for each piece of construction machinery are shown in Table 5. With the exception of heavy-duty vehicles, which consumed petrol, all other machinery consumed electric energy.
As shown in Figure 10, electric energy consumption accounted for 80.46%, while petrol energy accounted for 19.54%. This was mainly due to the dominant consumption of electric energy during this stage. The crane produced the highest carbon emissions, at 13,215.26 kgCO2e, while the mortar mixer produced only 253.19 kgCO2e. Through analysis, it can be seen that the crane had the highest number of shifts, which was mainly due to its on-site transportation and lifting of other materials such as the prefabricated components. Additionally, its consumption per shift was higher, at 164.31 kWh, which led to a larger overall carbon emissions output. On the other hand, the mortar mixer only consumed 8.61 kWh per unit shift, which was a much lower electrical energy consumption.

4. Analysis of Carbon Emission Factors

4.1. Carbon Emissions Impact Factor Assessment Modelling

4.1.1. Selection of Latent and Dominant Variables

Based on the literature review and the analysis of factors influencing carbon emissions in the materialization stage conducted by Du [46], and in consideration of the quantification process data for carbon emissions in the materials production stage obtained from practical surveys, we chose material selection, material storage, energy consumption, and carbon emissions in the material production stage as four latent variables for analysis. The corresponding manifest variables are shown in Table 6.

4.1.2. Research Hypothesis

Based on the assumption principle that “the sample covariance matrix equals the model covariance matrix” [47], in order to study the degree of influence of latent variables on carbon emissions in the material production stage, the assumed model path relationships were as shown in Figure 11, and the following hypotheses [48] were proposed:
H1: 
Material selection has a positive and significant impact on material storage.
H2: 
Material selection has a positive and significant impact on energy consumption.
H3: 
Material selection has a positive and significant impact on carbon emissions in the material production stage.
H4: 
Material storage has a positive and significant impact on energy consumption.
H5: 
Material storage has a positive and significant impact on carbon emissions in the material production stage.
H6: 
Energy consumption has a positive and significant impact on carbon emissions in the material production stage.

4.1.3. Model Evaluation Indicators

To ensure the internal consistency of the scale and the reliability of the sample data, it was necessary to conduct reliability and validity tests on the sample, as well as assess the overall fit of the model using fit indices [49,50]. In this study, Cronbach’s α was used for the reliability analysis. Validity analysis was conducted considering both exploratory factor analysis (EFA) and confirmatory factor analysis (CFA) [51,52]. For exploratory factor analysis, the KMO and Bartlett’s test were referred to, while for confirmatory factor analysis, measures such as the average variance extracted (AVE), composite reliability (CR), discriminant validity, and factor loading were employed. Model fit [53,54] was mainly evaluated using five indices: the chi-square to degrees of freedom ratio (CMIN/DF), goodness-of-fit index (GFI), adjusted goodness-of-fit index (AGFI), comparative fit index (CFI), and root mean square error of approximation (RMSEA). Mediation effects [48] were examined based on three indices: the mediation path, direct and indirect effect coefficients, and the confidence interval of the effects.

4.2. SEM-Based Analysis of Carbon Emission Factors

This study utilized a questionnaire survey design [49,55] and collected a total of 315 sample data from relevant business personnel or research scholars using a 7-point Likert scale [56] (ranging from “very small impact” to “very large impact”, correspondingly scored from 1 to 7). Among them, there were 35 invalid samples, leaving a total of 280 valid samples for analysis. The study used a total scale consisting of 13 items, meeting the requirement of having a sample size in structural equation modeling (SEM) at least five-times larger, and preferably ten-times larger, than the number of items [50].

4.2.1. Reliability Test

In this study, the sample data were subjected to Cronbach’s α reliability testing for four latent variables using SPSS 27.0 software [56]. The results are presented in Table 7. The carbon emissions during material selection and building material production stage demonstrated a reliability coefficient greater than 0.8, indicating excellent reliability. Material storage and energy consumption also exhibited a reliability coefficient above 0.7, indicating good reliability, and all variables passed the reliability test. In Table 7, it can be observed that the composite reliability was around 0.8, indicating the good reliability of the sample.

4.2.2. EFA Validity Test

By conducting a KMO test and Bartlett’s sphericity test on the sample, which was utilized to examine the intercorrelation among variables, it was found that the overall correlation was favorable, as shown in (Table 8).

4.2.3. CFA Validity Test

An analysis of confirmatory factor validity was conducted using the maximum likelihood estimation method [31,62] (ML) in AMOS software. The corresponding output values are presented in Table 9. The data indicate that the sample’s convergent validity was concentrated around 0.6, with factor loadings overall approaching 0.8, demonstrating good convergence. In Table 10, the discriminant validity test results show that the diagonal values of each latent variable (square root of convergent validity) were larger than the correlation coefficients with other variables, indicating a good discriminant effect [50].

4.2.4. Path Coefficients and Hypothesis Testing

A structural equation model diagram was created using AMOS software [65], and the results are shown in Figure 12. The model demonstrated a good fit, as indicated by the data results in Figure 12 and Table 11. All indicators passed a reasonable test, resulting in a rating of “good”.
To further examine the significance of each path, the related indicators such as path coefficients are reported in Table 12. The significance difference of path coefficients within the 95% confidence interval [48,50] was determined by the p-value, with values below 0.05 indicating significance and values above 0.05 indicating insignificance. From Table 12, it can be seen that the path from material storage to energy consumption was not significant. Through an analysis, it was concluded that energy consumption primarily depends on factors such as material usage and storage solutions, which do not cause significant differences in quantity. Thus, this finding is consistent with practical engineering considerations. The p-values of the remaining paths were all below 0.05, indicating significance and confirming the validity of the hypothesized paths.

4.2.5. Analysis of Model Data

A theoretical model with material storage and energy consumption as mediating variables [48] was constructed in this study to investigate the indirect factors influencing carbon emissions during the building material production stage. Bootstrap resampling [66] was used to repeatedly sample the data 300 times, to test the mediating effects of material storage and energy consumption. The specific output results are shown in (Table 13), indicating significant mediating path effects.
To further analyze the impact of each latent variable on the carbon emissions during the building material production stage, the output results from AMOS are presented in Table 14. According to the ranking of the total effect values, material selection had the greatest influence, followed by energy consumption, and finally material storage. This result suggests that building material production should start from the source, by implementing appropriate material selection strategies, prioritizing the use of low-carbon and environmentally friendly materials [67]. On the other hand, the consideration of rational material storage is relatively less significant. Analyzing Figure 12 allows a deeper understanding of the extent to which the manifest variables influenced the latent variables. From the material selection latent variable, it can be observed that traditional high-carbon materials have the greatest direct impact on material selection, indicating that they can effectively reflect the influence of material selection on carbon emissions during the building material production stage. The coefficients of the remaining manifest variables were all around 0.75, indicating similar levels of influence. In the future, the production process should make greater use of new low-carbon materials, such as recycled aggregate concrete [68]. Regarding material storage, it can be seen that storage solutions had the greatest impact, indicating that they can effectively reflect the influence of material storage on carbon emissions during the building material production stage. As for energy consumption, the unit process had the largest impact, indicating that it can effectively reflect the influence of energy consumption on carbon emissions during the building material production stage. The utilization of renewable energy sources is relatively low, so in the production process, it would be advisable to streamline processes and utilize renewable energy sources such as solar power [69,70,71] to reduce carbon emissions.

5. Discussion

Currently, domestic and international scholars mainly focus on studying the carbon emissions of buildings themselves, without conducting in-depth analysis of carbon emission factors. Most studies emphasize the entire lifecycle of buildings or their operational stages, with relatively few studies on the carbon emissions during the materialization stage. This paper filled this research gap by investigating the carbon emissions during the materialization stage of prefabricated buildings. We developed a carbon emission statistical platform, called “LCA-BIM”, based on process analysis and proposed a calculation model for the materialization stage of prefabricated buildings. Through quantitative analysis of actual cases, this study identified the key influencing factors during the building material production stage, which has the highest carbon emissions. While previous research analyzed the influencing factors for the materialization stage of buildings [45], further research on the factors affecting the stage with the highest carbon emissions has not been conducted. This study verified the theoretical validity using a structural equation model (SEM) and revealed the relationships and impact levels. The findings of this study can provide a theoretical reference for national institutions and businesses in carbon emissions evaluation and decision-making.
Based on the research content of this paper, there are several limitations and prospects: (1) This paper referenced the standards and specifications of Beijing, so it has regional limitations. (2) In the calculation of carbon emissions, materials with low quantities, low costs, and difficult-to-obtain carbon emission factors were not listed or explained, which may have impacted the results. (3) The “LCA-BIM” carbon emission statistical platform developed in this study cannot monitor components in real-time.
Based on the research content of this paper, future research could further expand on the following aspects: the development of the BIM digital platform, prefabrication rate, cost, and research on new low-carbon materials to better support China’s carbon emission reduction efforts.

6. Conclusions

(1)
For the materialization stage with the highest annual average carbon emissions, this study constructed a carbon emission statistical platform, called “LCA-BIM”, based on process analysis. Furthermore, a carbon emission calculation model for the materialization stage of prefabricated buildings was proposed. Through empirical analysis, the carbon emissions for each stage were ranked from high to low, as follows: material production stage, construction stage, material transportation stage, prefabricated component transportation stage, and prefabricated component production stage.
(2)
Through quantitative analysis in the process of carbon emission calculation, the main factors influencing carbon emissions in the production stage of building materials were identified. This study adopted a combined approach of empirical analysis and a literature review, establishing six basic hypotheses about four aspects: material selection, energy consumption, material storage, and carbon emissions in the production stage of building materials. A structural equation model was used to theoretically validate the influencing factors in the production stage of prefabricated building materials. Through this analysis, it was found that, from the perspective of overall impact, material selection had the strongest overall impact on the production stage of building materials, followed by energy consumption, while material storage had the smallest overall impact. From the perspective of direct impact, energy consumption had the strongest direct impact on carbon emissions in the production stage of building materials. Therefore, national governments should vigorously promote the research and development of low-carbon materials and the use of renewable energy, which could significantly reduce carbon emissions.

Author Contributions

Conceptualization, Z.Z. and P.X.; methodology, Z.Z.; software, P.X.; validation, Z.Z., P.X. and D.X.; formal analysis, P.X.; investigation, P.X.; resources, Z.Z.; data curation, P.X.; writing—original draft preparation, P.X.; writing—review and editing, Z.Z., P.X. and D.X.; visualization, P.X.; supervision, Z.Z. and D.X.; project administration, Z.Z.; funding acquisition, D.X. All authors have read and agreed to the published version of the manuscript.

Funding

This present research work was supported by the Chinese National Natural Science Foundations (Grant No.51108164).

Institutional Review Board Statement

Ethical review and approval were waived for this study, due to respondents being ensured of confidentiality and anonymity, and all participation was voluntary.

Informed Consent Statement

Informed consent was obtained from all subjects involved in the study.

Data Availability Statement

The data presented in this study are available on request from the corresponding author. The data are not publicly available, due to privacy concerns.

Conflicts of Interest

The authors declare no conflict of interest.

References

  1. Zhang, M.; Wang, C.; Wang, S.; Wang, K.; Zhang, R. Assessment of greenhouse gas emissions reduction potential in an industrial park in China. Clean Technol. Environ. 2020, 22, 1435–1448. [Google Scholar] [CrossRef]
  2. China Association of Building Energy Efficiency. China Building Energy Consumption Research Report 2020. Build. Energy Effic. 2021, 49, 30–39, (In English and Chinese). [Google Scholar]
  3. Yuan, S.; Chen, X.; Du, Y.; Qu, S.; Hu, C.; Jin, L.; Xu, W.; Yan, G. Study on the peak CO2 emission pathways in China’s construction sector. Environ. Sci. Res. 2022, 35, 394–404. [Google Scholar]
  4. Zhang, K.; Lu, Y.; Lu, H. Research on the countermeasures of high-quality development of green buildings in China under the background of double carbon target. Constr. Econ. 2022, 43, 14–20. [Google Scholar]
  5. Shi, X.; Lin, Y.; Chen, X. Development of sorbent materials for direct air capture of CO2. MRS Bull. 2022, 47, 405–415. [Google Scholar] [CrossRef]
  6. Gallant, R.; Farooque, A.A.; He, S.; Kang, K.; Hu, Y. A Mini-Review: Biowaste-Derived Fuel Pellet by Hydrothermal Carbonization Followed by Pelletizing. Sustainability 2022, 14, 12530. [Google Scholar] [CrossRef]
  7. Pavicic, J.; Novak Mavar, K.; Brkic, V.; Simon, K. Biogas and Biomethane Production and Usage: Technology Development, Advantages and Challenges in Europe. Energies 2022, 15, 2940. [Google Scholar] [CrossRef]
  8. Xue, S.; Na, J.; Wang, L.; Wang, S.; Xu, X. The Outlook of Green Building Development in China during the “Fourteenth Five-Year Plan” Period. Int. J. Environ. Res. Public Health 2023, 20, 5122. [Google Scholar] [CrossRef]
  9. Liu, C.; Zhang, F.; Zhang, H. Comparative analysis of off-site precast concrete and cast-in-place concrete in low-carbon built environment. Fresen Environ. Bull. 2020, 29, 1804–1812. [Google Scholar]
  10. Tao, L.; Ding, P.; Yang, X.; Lin, P.; Shi, C.; Bao, Y.; Wei, P.; Zhao, J. Comparative study of the seismic performance of prefabricated and cast-in-place subway station structures by shaking table test. Tunn. Undergr. Space Technol. 2020, 105, 103583. [Google Scholar] [CrossRef]
  11. Yamany, M.S.; Elwakil, E. Modelling of cast-in-place concrete tunnel liners condition. Struct. Infrastruct. Eng. 2020, 16, 1147–1160. [Google Scholar] [CrossRef]
  12. Tikhomirov, A.S.; Sorokina, N.E.; Malakho, A.P.; Shornikova, O.N.; Filimonov, S.V.; Avdeev, V.V. Thermophysical properties of carbon-carbon materials based on graphite foam. Refract. Ind. Ceram. 2016, 57, 18–21. [Google Scholar] [CrossRef]
  13. Chan, M.; Masrom, M.A.N.; Yasin, S.S. Selection of Low-Carbon Building Materials in Construction Projects: Construction Professionals’ Perspectives. Buildings 2022, 12, 486. [Google Scholar] [CrossRef]
  14. Cao, H.; Wen, L.; Guo, Z.; Piao, N.; Hu, G.; Wu, M.; Li, F. Application and prospects for using carbon materials to modify lithium iron phosphate materials used at low temperatures. Carbon 2022, 192, 483. [Google Scholar] [CrossRef]
  15. Du, Q.; Bao, T.; Li, Y.; Huang, Y.; Shao, L. Impact of prefabrication technology on the cradle-to-site CO2 emissions of residential buildings. Clean. Technol. Environ. 2019, 21, 1499–1514. [Google Scholar] [CrossRef]
  16. Hong, J.; Shen, G.Q.; Li, Z.; Zhang, B.; Zhang, W. Barriers to promoting prefabricated construction in China: A cost-benefit analysis. J. Clean. Prod. 2018, 172, 649–660. [Google Scholar] [CrossRef]
  17. Zhu, K.; Zhang, Y.; Meng, X.; Ma, Z. Structural Assembly Analysis of Concrete Buildings with Intelligent Finite Element Analysis. J. Sens. 2022, 2022, 6701021. [Google Scholar] [CrossRef]
  18. Zheng, C.; Ge, B. Research on assembled building structure in farmland hydraulic structure. Fresen Environ. Bull. 2020, 29, 4430–4436. [Google Scholar]
  19. Yan, L.; Chen, Z.; Zou, Y.; He, X.; Cai, C.; Yu, K.; Zhu, X. Field Study of the Interior Noise and Vibration of a Metro Vehicle Running on a Viaduct: A Case Study in Guangzhou. Int. J. Environ. Res. Public. Health 2020, 17, 2807. [Google Scholar] [CrossRef]
  20. Ding, Z.; Liu, S.; Luo, L.; Liao, L. A building information modeling-based carbon emission measurement system for prefabricated residential buildings during the materialization stage. J. Clean. Prod. 2020, 264, 121728. [Google Scholar] [CrossRef]
  21. Huang, K.; Wang, J.C. Greenhouse Gas Emissions of Tourism-Based Leisure Farms in Taiwan. Sustainability 2015, 7, 11032–11049. [Google Scholar] [CrossRef]
  22. Sinha, P.; Schew, W.A.; Sawant, A.; Kolwaite, K.J.; Strode, S.A. Greenhouse Gas Emissions from US Institutions of Higher Education. J. Air Waste Manag. 2010, 60, 568–573. [Google Scholar] [CrossRef] [PubMed]
  23. Xiao, L.; Li, Z.; Wang, C.; Zhang, H.; Guo, S.; Liu, W.; Wang, J. BIM-based carbon emission measurement of railway physical stage. Constr. Econ. 2022, 43, 295–301. [Google Scholar]
  24. Qian, S. LCA-based carbon emission analysis of rail transit stations. Urban Express Transp. 2022, 35, 16–21. [Google Scholar]
  25. Luo, Z.; Cang, Y.; Yang, L.; Wang, Y. Research on building-based carbon emission calculation method for the whole design process. Build. Sci. 2021, 37, 1–7. [Google Scholar]
  26. Sun, Y.; Liu, J.; Xia, B.; Liu, S. Research on the evaluation of carbon emission in the stage of prefabricated building construction. J. Shenyang Univ. Archit. (Nat. Sci. Ed.) 2018, 34, 881–888. [Google Scholar]
  27. Wang, T.; Zhang, J.; Zhao, W.; Yang, F.; Zhang, Y. Research on carbon emission model establishment of prefabricated building in the physical and chemical stages and comparative evaluation with cast-in-place buildings. New Build. Mater./Xinxing Jianzhu Cailiao 2022, 88–91. [Google Scholar]
  28. Chen, F.F.; Yang, Y.; Li, J.; Tian, A. Calculation and evaluation of building thermal energy consumption and carbon emissions based on BIM technology. Therm. Sci. 2023, 27, 1223–1230. [Google Scholar] [CrossRef]
  29. Hongyan, W.; Wen, W. Comparative Analysis of Civil Engineering Quantity Calculation Based on Glodon GTJ and Revit. IOP Conf. Ser. Earth Environ. Sci. 2021, 791, 12052. [Google Scholar] [CrossRef]
  30. Li, X.; Xie, W.; Xu, L.; Li, L.; Jim, C.Y.; Wei, T. Holistic life-cycle accounting of carbon emissions of prefabricated buildings using LCA and BIM. Energy Build. 2022, 266, 112136. [Google Scholar] [CrossRef]
  31. Wang, B.; Huang, C.; Wang, H.; Liao, F. Impact Factors in Chinese Construction Enterprises’ Carbon Emission-Reduction Intentions. Int. J. Environ. Res. Public. Health 2022, 19, 16929. [Google Scholar] [CrossRef]
  32. Yang, T.; Pan, Y.; Yang, Y.; Lin, M.; Qin, B.; Xu, P.; Huang, Z. CO2 emissions in China’s building sector through 2050: A scenario analysis based on a bottom-up model. Energy 2017, 128, 208–223. [Google Scholar] [CrossRef]
  33. Verbeeck, G.; Hens, H. Life cycle inventory of buildings: A calculation method. Build. Environ. 2010, 45, 1037–1041. [Google Scholar] [CrossRef]
  34. Lu, K.; Jiang, X.; Tam, V.W.Y.; Li, M.; Wang, H.; Xia, B.; Chen, Q. Development of a Carbon Emissions Analysis Framework Using Building Information Modeling and Life Cycle Assessment for the Construction of Hospital Projects. Sustainability 2019, 11, 6274. [Google Scholar] [CrossRef]
  35. Arvanitoyannis, I.S. ISO 14040: Life Cycle Assessment (LCA)–Principles and Guidelines. In Waste Management for the Food Industries; Academic Press: Cambridge, MA, USA, 2008; pp. 97–132. [Google Scholar]
  36. Kim, D.S.; Sung, Y.J.; Lee, J.W.; Kim, S.B.; Park, K.S. Investigation into Methods for reducing Greenhouse Gas Emission in Paper Industry with Development of Greenhouse Gas Inventory. J. Korea Tappi. 2012, 44, 49–57. [Google Scholar]
  37. Gregory, R.P. The effect of atmospheric greenhouse gases on firm value and firm size distribution. J. Clean. Prod. 2022, 358, 131751. [Google Scholar] [CrossRef]
  38. Drouet, L.; Bosetti, V.; Tavoni, M. Selection of climate policies under the uncertainties in the Fifth Assessment Report of the IPCC. Nat. Clim. Chang. 2015, 5, 937. [Google Scholar] [CrossRef]
  39. GB/T51366-2019; Ministry of Housing and Urban G Rural Development of the People’s Republic of China. Standard for building carbon emission calculation; China Architecture& Building Press: Beijing, China, 2019. (In Chinese)
  40. Wang, L.; Wang, J. Comparative study on the reliability of engineering calculation modes based on BIM. Constr. Technol. 2018, 47, 22–26. [Google Scholar]
  41. Zheng, Y.; Lai, J.; Wu, S.; Sun, X. An Empirical Study on Carbon Emission Reduction Strategies for Construction Projects Based on the Bill of Quantities. J. Eng. Manag. 2018, 32, 12–17. [Google Scholar]
  42. Huang, Q. Research on Carbon Emission Calculation and Emission Reduction Measures of Prefabricated Building Based on Life-Cycle Asses; Guangdong University of Technology: Guangzhou, China, 2023. [Google Scholar] [CrossRef]
  43. Xie, W.; Li, X.; Yang, T.; Lin, J.; Huang, S.; Xu, L. A study on carbon emission measurement in the construction stage of prefabricated buildings. J. Eng. Manag. 2022, 36, 52–57. [Google Scholar]
  44. Shen, Z.; Jensen, W.; Berryman, C.; Zhu, Y. Comparative study of activity-based construction labor productivity in the United States and China. J. Manag. Eng. 2011, 27, 116–124. [Google Scholar] [CrossRef]
  45. Wen, R.; Shen, J.; Chen, Y.; Zhang, Y. A review of foreign studies on energy consumption and carbon emissions of buildings with different structures. J. Jishou Univ. (Nat. Sci. Ed.) 2015, 36, 67–74. [Google Scholar]
  46. Du, Q.; Pang, Q.; Bao, T.; Guo, X.; Deng, Y. Critical factors influencing carbon emissions of prefabricated building supply chains in China. J. Clean. Prod. 2021, 280, 124389. [Google Scholar] [CrossRef]
  47. Tan, C.; Diao, F.; Yi, Y. A study on the factors influencing information encounter behavior in academic social networks. Intell. Sci. 2023, 41, 41–50+98. [Google Scholar]
  48. Sun, R.; Wang, P. A study on the factors influencing pilot fatigue based on structural equation modeling. J. Saf. Environ. 2022, 22, 3252–3258. [Google Scholar]
  49. Abdelaal, F.; Guo, B.H.W. Stakeholders’ perspectives on BIM and LCA for green buildings. J. Build. Eng. 2022, 48, 103931. [Google Scholar] [CrossRef]
  50. Li, M.; Chen, W.; Li, L. Research on calculation and influencing factors of carbon emission during the materialization phase of prefabricated buildings. J. Saf. Environ. 2022, 1–10. [Google Scholar] [CrossRef]
  51. Jiang, L.; Wang, Y.; Zhang, Y.; Li, R.; Wu, H.; Li, C.; Wu, Y.; Tao, Q. The Reliability and Validity of the Center for Epidemiologic Studies Depression Scale (CES-D) for Chinese University Students. Front. Psychiatry 2019, 10, 315. [Google Scholar] [CrossRef]
  52. Marsh, H.W.; Morin, A.J.S.; Parker, P.D.; Kaur, G. Exploratory Structural Equation Modeling: An Integration of the Best Features of Exploratory and Confirmatory Factor Analysis. Annu. Rev. Clin. Psychol. 2014, 10, 85. [Google Scholar] [CrossRef]
  53. Edwards, K.D.; Konold, T.R. Impact of Informative Priors on Model Fit Indices in Bayesian Confirmatory Factor Analysis. Struct. Equ. Model. 2023, 30, 272–283. [Google Scholar] [CrossRef]
  54. Raykov, T.; Lee, C.; Marcoulides, G.A.; Chang, C. A Commentary on the Relationship Between Model Fit and Saturated Path Models in Structural Equation Modeling Applications. Educ. Psychol. Meas. 2013, 73, 1054–1068. [Google Scholar] [CrossRef]
  55. Yuan, J.; Gao, Z.; Xiang, Y. Green Energy Consumption Path Selection and Optimization Algorithms in the Era of Low Carbon and Environmental Protection Digital Trade. Sustainability 2023, 15, 15. [Google Scholar] [CrossRef]
  56. Khahro, S.H.; Kumar, D.; Siddiqui, F.H.; Ali, T.H.; Raza, M.S.; Khoso, A.R. Optimizing Energy Use, Cost and Carbon Emission through Building Information Modelling and a Sustainability Approach: A Case-Study of a Hospital Building. Sustainability 2021, 13, 3675. [Google Scholar] [CrossRef]
  57. Ay, Y.; Karadag, E.; Acat, M.B. The Technological Pedagogical Content Knowledge-practical (TPACK-Practical) model: Examination of its validity in the Turkish culture via structural equation modeling. Comput. Educ. 2015, 88, 97–108. [Google Scholar] [CrossRef]
  58. Hsiao, Y.; Kwok, O.; Lai, M.H.C. Modeling Measurement Errors of the Exogenous Composites from Congeneric Measures in Interaction Models. Struct. Equ. Model. 2021, 28, 250–260. [Google Scholar] [CrossRef]
  59. Valencia, A.; Gonzalez, G.; Castaneda, M. Structural Equation Model for Studying the Mobile-Learning Acceptance. IEEE Lat. Am. Trans. 2016, 14, 1988–1992. [Google Scholar] [CrossRef]
  60. Chen, J.; Nguyen, H.T.T.; Chou, C.; Wang, J.; Wang, T. Transit-Oriented Development: Exploring Citizen Perceptions in a Booming City, Can Tho City, Vietnam. Sustainability 2021, 13, 1370. [Google Scholar] [CrossRef]
  61. Habib, M.A.; Bao, Y.; Nabi, N.; Dulal, M.; Asha, A.A.; Islam, M. Impact of Strategic Orientations on the Implementation of Green Supply Chain Management Practices and Sustainable Firm Performance. Sustainability 2021, 13, 340. [Google Scholar] [CrossRef]
  62. Gasmi, S. Estimating parameters of a log-linear intensity for a repairable system. Appl. Math. Model. 2013, 37, 4325–4336. [Google Scholar] [CrossRef]
  63. Dos Santos, P.M.; Cirillo, M.A. Construction of the average variance extracted index for construct validation in structural equation models with adaptive regressions. Commun. Stat. Simul. Comput. 2023, 52, 1639–1650. [Google Scholar] [CrossRef]
  64. Wolf, M.G.; McNeish, D. dynamic: An R Package for Deriving Dynamic Fit Index Cutoffs for Factor Analysis. Multivar. Behav. Res. 2023, 58, 189–194. [Google Scholar] [CrossRef] [PubMed]
  65. Wang, Y.A.; Rhemtulla, M. Power Analysis for Parameter Estimation in Structural Equation Modeling: A Discussion and Tutorial. Adv. Meth. Pract. Psych. 2021, 4, 2515245920918253. [Google Scholar] [CrossRef]
  66. Hebbar, A.; Karateev, D.; Penedones, J. Spinning S-matrix bootstrap in 4d. J. High Energy Phys. 2022, 2022, 60. [Google Scholar] [CrossRef]
  67. Marey, H.; Kozma, G.; Szabó, G. Effects of Using Green Concrete Materials on the CO2 Emissions of the Residential Building Sector in Egypt. Sustainability 2022, 14, 3592. [Google Scholar] [CrossRef]
  68. Li, B.; Yu, S.; Gao, B.; Li, Y.; Wu, F.; Xia, D.; Chi, Y.; Wang, S. Effect of recycled aggregate and steel fiber contents on the mechanical properties and sustainability aspects of alkali-activated slag-based concrete. J. Build. Eng. 2023, 66, 105939. [Google Scholar] [CrossRef]
  69. Zhang, M.; Yang, Z.; Liu, L.; Zhou, D. Impact of renewable energy investment on carbon emissions in China-An empirical study using a nonparametric additive regression model. Sci. Total Environ. 2021, 785, 147109. [Google Scholar] [CrossRef]
  70. Khan, A.A.; Khan, S.U.; Ali, M.A.S.; Safi, A.; Gao, Y.; Ali, M.; Luo, J. Role of institutional quality and renewable energy consumption in achieving carbon neutrality: Case study of G-7 economies. Sci. Total Environ. 2022, 814, 152797. [Google Scholar] [CrossRef]
  71. Zhu, Q.; Chen, X.; Song, M.; Li, X.; Shen, Z. Impacts of renewable electricity standard and Renewable Energy Certificates on renewable energy investments and carbon emissions. J. Environ. Manag. 2022, 306, 114495. [Google Scholar] [CrossRef]
Figure 1. Methodological framework for the study.
Sustainability 15 13648 g001
Figure 2. LCA technical routes: (a) LCA method components; (b) LCA relationship between the steps.
Sustainability 15 13648 g002
Figure 3. Carbon emission measurement boundary for the materialization stage.
Sustainability 15 13648 g003
Figure 4. Carbon emission statistical process.
Sustainability 15 13648 g004
Figure 5. BIM 3D dynamic model of the residential building: (a) Revit 2023 model of the residential building; (b) GTJ 2021 model of the residential building.
Sustainability 15 13648 g005
Figure 6. Comparison of carbon emissions by stage.
Sustainability 15 13648 g006
Figure 7. Comparison of carbon emissions by stage in the prefabricated and cast-in-place sections: (a) Comparison of carbon emissions by stage in the prefabricated section; (b) comparison of carbon emissions by stage in the cast-in-place section.
Sustainability 15 13648 g007
Figure 8. Comparison of carbon emissions of construction personnel for different components.
Sustainability 15 13648 g008
Figure 9. Comparison of carbon emissions of different building materials at the production and transportation stages.
Sustainability 15 13648 g009
Figure 10. Comparison of carbon emissions and energy consumption types of the different construction machinery.
Sustainability 15 13648 g010
Figure 11. Links between potential variables.
Sustainability 15 13648 g011
Figure 12. Path diagram for each potential variable.
Sustainability 15 13648 g012
Table 1. Carbon emission factors for materials commonly used in construction.
Type of MaterialData SourcesEmission Factors
Ordinary silicate cementCarbon Emission Calculation Standard for Buildings GB/T 51366-2019735 kgCO2e/t
C30 concrete295 kgCO2e/m3
C50 concrete385 kgCO2e/m3
Sand2.51 kgCO2e/t
Crushed stone2.18 kgCO2e/t
Natural gypsum32.8 kgCO2e/t
Water0.168 kgCO2e/m3
Hot rolled carbon steel reinforcement2340 kgCO2e/t
Table 2. Carbon emission factors for common energy sources in building.
Type of EnergyData SourcesEmission Factors
DieselCarbon Emission Calculation Standard for Buildings GB/T 51366-201972.59 tCO2e/TJ
Petrol67.91 tCO2e/TJ
Natural gas55.54 tCO2e/TJ
Liquefied petroleum gas61.81 tCO2e/TJ
Light petrol van transport0.334 kgCO2e/t·km
Light diesel truck transport0.286 kgCO2e/t·km
North China Regional Power Grid2016 IPCC Guidelines for National Inventory Preparation0.9419 kgCO2e/k·Wh
Table 3. Carbon emissions from labor, materials, and machinery in the materialization stage.
StageSectionDetailed StageName of ComponentCarbon Emissions (kgCO2e)Section Carbon Emissions (kgCO2e)Total Carbon Emissions (kgCO2e)
Production stagePrefabricated sectionMaterial
production
Prefabricated wall228,928.04578,511.731,796,362.23
Stacked floor slab291,952.80
Prefabricated stair41,688.73
Prefabricated air conditioning panel6347.43
Prefabricated component productionPrefabricated wall2687.13
Stacked floor slab5777.99
Prefabricated stair898.69
Prefabricated air conditioning panel230.92
Cast-in-place sectionMaterial
production
Concrete666,2871,217,850.50
Paints14,713.05
Sintered bricks84.72
Galvanized angles15,894.11
Sand537.52
Steel reinforcement520,334.10
Transport
stage
Prefabricated sectionMaterial transportConcrete8457.3992,027.36179,057.78
Steel reinforcement19,463.73
Transport of
prefabricated
components
Prefabricated wall19,229.71
Stacked floor slab37,676.50
Prefabricated stair5791.84
Prefabricated air conditioning panel1408.19
Cast-in-place sectionMaterial transportConcrete22,502.4387,030.42
Paints1137.28
Sintered bricks144.66
Galvanized angles824.40
Sand30,623.45
Steel reinforcement31,798.20
Construction
stage
Prefabricated sectionConstruction
machinery
Cranes5591.968873.91119,890.02
Lorry1047.50
Construction
personnel
2234.45
Cast-in-place sectionConstruction
machinery
Cranes13,215.26111,016.11
Construction lift6090.44
Lorry6040.22
Electric welding machine5314.07
Mortar mixer253.19
Construction
personnel
80,102.93
Table 4. Quantity of work for prefabricated components and corresponding man/day figures.
Name of ComponentQuantity of Concrete (m3)Combined Working Days/m3Reinforcement Weight (t)Combined Working Days/t
Prefabricated wall237.741.1722.737.584
Stacked floor slab511.20.11348.8747.584
Prefabricated stair79.511.4367.6027.584
Prefabricated air
conditioning panel
20.430.6781.9537.584
Table 5. Carbon emission parameters for construction machinery.
Name of MachineTable Classes (Quantity)Carbon Emission Factor (kgCO2e)Unit Shift
Consumption (kWh)
Type of Energy Consumption
Cranes85.390.9419164.31Electricity
Construction lift78.990.941981.86Electricity
Lorry33.413.186356.74Fuel
Electric welding machine38.380.9419147Electricity
Mortar mixer31.220.94198.61Electricity
Table 6. Information about the variables influencing carbon emissions during the production stage of building materials.
Potential VariablesExplicit VariablesDescription of Information on Explicit Variables
Material selection (X)Traditional high-carbon material (V1)Impact of cement materials on carbon emissions
Material brand (V2)Impact of material grade
parameters on
carbon emissions
Material size (V3)The effect of material area size on carbon emissions
Material recycling rate (V4)Recycling rate of waste
materials
Material loss rate (V5)Breakage rates during
material production
Material storage (M1)Storage time (V6)The impact of long periods of material accumulation on carbon emissions
Storage options (V7)The impact of multiple
Material stockpiles on carbon emissions
Storage site (V8)The impact of indoor and outdoor stockpiling on
carbon emissions
Energy consumption (M2)Unit process (V9)Impact of different production processes on carbon emissions
Type of energy consumption (V10)Impact of different electricity and fuel energy types on
carbon emissions
Renewable energy usage rate (V11)Renewable energy
consumption/total energy consumption
Carbon emissions from the production stage of building materials (Y)Production of prefabricated
components (V12)
Carbon emissions from prefabricated component
production
Material production (V13)Carbon emissions from material production
Table 7. Reliability verification indicators.
Potential VariablesCronbach’s αInspection ConditionsNumber of Items
Material selection0.870A Cronbach’s alpha coefficient of less than 0.6 is considered to have insufficient internally consistent reliability; reaching 0.7 to 0.8 indicates that the scale has relatively good reliability; and reaching 0.8 to 0.9 indicates that the scale has very good reliability [57,58]5
Material storage0.7873
Energy consumption0.7943
Carbon emissions from the production stage of
building materials
0.8442
Table 8. Exploratory Factor Validation Indicators.
Potential VariablesKMOBartlettInspection Conditions
Material selection0.870<0.001Structural validity when the KMO test coefficient is greater than 0.5 or 0.6 and the p-value of Bartlett’s sphericity test is less than 0.05 [59,60,61]
Material storage0.787<0.001
Energy consumption0.794<0.001
Carbon emissions from the production stage of
building materials
0.844<0.001
Table 9. Validation factor validation indicator.
Potential VariablesExplicit VariablesConvergent
Validity (AVE)
Combined
Validity (CR)
Factor Loading VolumeInspection Conditions
Material selection (X)V10.5760.8710.799Convergent validity should be greater than 0.5. The higher the AVE, the higher the
convergent validity; the acceptable threshold of combined reliability is 0.7, with a higher
V20.736
V30.770
V40.733
V50.770
Material storage (M1)V60.5530.7870.749
V70.756
V80.727
Energy consumption (M2)V90.5640.7940.846CR value indicating higher internal consistency; the factor loadings were greater than 0.6 and less than 0.95 [63]
V100.670
V110.742
Carbon emissions from the production stage of building materials (Y)V120.7610.8620.831
V130.898
Table 10. Distinct validity analysis.
Potential VariablesMaterial
Selection
Material
Storage
Energy
Consumption
Carbon Emissions from the Production Stage of Building Materials
Material selection0.759
Material storage0.262 ***0.744
Energy consumption0.319 ***0.121 *0.751
Carbon emissions from the
production stage of building materials
0.374 ***0.326 ***0.336 ***0.872
Note: * p < 0.05. *** p < 0.001 [64].
Table 11. Model fit results.
Potential VariablesReasonable Range [64]ResultsAssessment Level
GFI>0.8, reasonable model fit; >0.9, good model fit0.963Good
AGFI>0.8, reasonable model fit; >0.9, good model fit0.943Good
RMR<0.08, reasonable model fit; <0.05, good model fit0.034Good
RMSEA<0.08, reasonable model fit; <0.05, good model fit0.028Good
NFI>0.8, reasonable model fit; >0.9, good model fit0.954Good
IFI>0.8, reasonable model fit; >0.9, good model fit0.991Good
Table 12. Path coefficient and significance test.
Hypothetical PathStandardization
Factor
S.E.C.R.pSignificance
Material storageMaterial selection0.3150.0794.294***Significant
Energy consumptionMaterial selection0.3590.0884.790***Significant
Energy consumptionMaterial storage0.0400.0830.5330.594Not Significant
Carbon emissions from the production stage of building materialsMaterial selection0.2300.0673.1980.001Significant
Carbon emissions from the production stage of building materialsMaterial storage0.2830.0623.941***Significant
Carbon emissions from the production stage of building materialsEnergy consumption0.2890.0574.007***Significant
Note: *** p < 0.001 [64].
Table 13. Intermediary Effect Test Table.
Intermediary PathwayType of
Impact
EffectS.E.Zp[Boot 95% CI]
Material selectionMaterial storageCarbon emissions from the production stage of building materialsIndirect impact0.094(0.032)2.9320.003 **[0.034,0.155]
Direct impact0.348(0.078)4.489<0.001 ***[0.206,0.513]
Total impact0.442(0.075)5.894<0.001 ***[0.316,0.593]
Material selectionEnergy consumptionCarbon emission from the production stage of building materialsIndirect impact0.051(0.023)2.2200.026 *[0.015,0.098]
Direct impact0.391(0.095)4.105<0.001 ***[0.201,0.549]
Total impact0.442(0.097)4.555<0.001 ***[0.232,0.603]
Note: * p < 0.05. ** p < 0.01. *** p < 0.001 [64].
Table 14. Value of the impact of potential variables on carbon emissions in the production stage of building materials.
ImpactMaterial SelectionMaterial StorageEnergy Consumption
Direct impact0.230.2830.289
Indirect impact0.182
Total impact0.4120.2830.289
Disclaimer/Publisher’s Note: The statements, opinions and data contained in all publications are solely those of the individual author(s) and contributor(s) and not of MDPI and/or the editor(s). MDPI and/or the editor(s) disclaim responsibility for any injury to people or property resulting from any ideas, methods, instructions or products referred to in the content.

