Article

The influence of Socio-Psychological Factors on Residents’ Willingness to Practice Sustainable Waste Handling in Dammam City, Saudi Arabia

by
Ossama Ahmed Labib
1,*,
Latifah Binti Abd Manaf
2,
Amir Hamzah Bin Sharaai
2,
Siti Sarah Binti Mohamad Zaid
2 and
Muhammed Salisu Khalil
3
1
Department of Environmental Health, College of Public Health, Imam Abdulrahman Bin Faisal University, Dammam 34212, Saudi Arabia
2
Department of Environment, Faculty of Forestry and Environment, Universiti Putra Malaysia, Serdang 43400 UPM, Selangor, Malaysia
3
Department of Environmental Management and Toxicology, Federal University Gida Sitin, Dutse 720101, Nigeria
*
Author to whom correspondence should be addressed.
Sustainability 2023, 15(18), 13654; https://doi.org/10.3390/su151813654
Submission received: 1 August 2023 / Revised: 27 August 2023 / Accepted: 7 September 2023 / Published: 13 September 2023

Abstract

:
An increase in solid waste production may affect sustainable solid waste handling practices such as indirect disposal and sanitary landfilling. The objective of this study was to explore the possibility of Dammam residents’ participation in sorting and recycling by comparing sustainable waste handling practices from different income level groups according to family income levels to determine the impacts of independent variables on the willingness of residents to participate in sustainable waste handling practices. There was a statistically significant difference between low and high levels of awareness and perceived behavior control in Dammam City households’ willingness to sort waste and recycle; however, at the middle level, there was only a significant difference in perceived behavior control. Moreover, there was a statistically significant difference between high and middle levels in government facilitators regarding sorting and recycling willingness in Dammam City. The descriptive analysis comprised 450 participants (37.8%) in middle levels, (44.2%), high levels, and (18%) low levels. The results of the participants’ attitudes consisted of sorting (57.1%) and recycling (55.1%), as well as awareness (46.9%) and sorting and recycling (47.1%) in high-income levels. In perceived behavior control, the participants’ results were 47.7% for sorting and 49.6% for recycling in the middle level. Regarding, MI, SI, and GF, the participants’ results in the high-income levels were greater than the others (44.2%, 51.1%, and 57.1%, respectively) toward sorting and recycling. Only awareness between low-income and high-income groups and between the middle-income and high-income groups was significant; therefore, it was supported in some instances and not in others.

1. Introduction

Accelerated and continuous growth in the urban population has caused an increase in municipal solid waste (MSW) generation, which, consequently, has a serious environmental and socio-economic impact. Municipal solid waste (MSW) is defined as solid wastes that are produced from different environments such as from public places, offices, households, and hospitals, which are related to the governmental responsibilities of municipal waste for collection, transportation, and final disposal [1]. The improper handling and disposal of waste is a growing concern as the amount of waste generation increases worldwide [1,2,3]. Annually, Saudi Arabia generates 1.5–1.8 billion metric tons of MSW, with the per capita waste generation estimated to range from 1.5 to 1.8 kg per person per day, indicating the magnitude of the problem that civic bodies face. Moreover, it has been estimated that this will increase to about 25 billion tons by 2050 [4,5].
Currently, Dammam City, which is a major city in the Eastern Province, has an increasing population with a growth rate of about 4.1%. In 2020, the population of Dammam was estimated to be around 1.2 million [6,7]. There are various municipal solid waste types (MSWs). Typically, organics comprise a major portion (40%) of solid waste, of which food waste is the most prominent waste stream (50.6%). Food waste comprises 37% of solid waste generation in KSA [8]. Food waste contains rice (38.7%), meat (25%), bakery products (18.7%), and fats (13%) [9]. Wood is the second largest, and plastic is the third largest stream. However, other components in the waste stream include textiles (6%), glass (5%), and minerals (8.1%) [10]. Figure 1 shows the composition of solid waste in Saudi Arabia.
Some factors cause an increase in waste generation, such as urbanization and industrialization changes in consumption patterns and lifestyle, which have a harmful effect on public health and the environment [11,12,13]. The government of Saudi Arabia realized that a permanent solution to the issues of solid waste management must be found to achieve reducing of the solid waste accumulation with its benefiting. Regarding the national budget for the year 2017, the government allocated a huge amount of money (54 billion Saudi riyals) for public municipal services, including solid waste disposal. The Saudi government has been keen to encourage participation in sustainable solid waste recycling programs by creating resident awareness and providing financial support and modern technologies under strong regulations and legislations governing solid waste management under the supervision of the Ministry of Municipal and Rural Affairs to ensure implementation and integrated success [14].
Nevertheless, more needs to be done by both the government and private organizations to improve the SWM situation in the country. This can be achieved through modernizing the waste management sector by providing material recovery facilities, introducing waste-to-energy systems, and recycling infrastructure, which, if properly implemented, can significantly improve the solid waste management situation and produce good business opportunities for the citizens [14]. This research aimed to investigate the socio-psychological factors that influence the participation of Saudi Arabian residents’ willingness through three points. The first point illustrates the importance of spreading sufficient awareness among citizens about the nature of sorting and returning solid waste because of its importance and benefit to society, as governments supporting the community need to be able to identify the importance of sorting and recycling and the importance of a product that supports the economy and increases the income of families in the community. The second point reinforces the role of perceived behavioral control through government agencies that should provide waste sorting and recycling infrastructures. The third point is to emphasize the importance of normative factors for which measures must be taken to enhance social impact; moreover, they should be created to encourage all people to participate in waste sorting and recycling to improve social impacts and relationships, as well as to evaluate waste handling participation.

2. Literature Review

Solid waste management provides the essential services of collecting, storing, and transporting and offers solutions to treat aesthetic, conservation, economic, and public health considerations. Solid waste management relates to how solid waste can be utilized as a resource. Every household and business owner across the world should engage in proper solid waste management ([15,16,17]. The main idea behind waste handling is the repurposing of waste produced as a product for use as raw material in certain industries, such as plastic, which is considered the third largest solid waste stream in Saudi Arabia. However, only 15–20% of plastic waste is recyclable through segregation, and most of it is disposed of in landfills. Therefore, pyrolysis is used as a plastic treatment and power generation method in the form of fuel oil and valuable products such as coal [4,9,18,19,20].
Improper waste handling practices are responsible for the second highest share of greenhouse gas emissions (GHGE) (CO2, CH4, N2O) aside from fossil fuels [10,21]. It was forecast that most of the dumping sites in the country may likely reach their capacities in the coming few years, which indicates the need to change from current waste management practices to sustainable waste management practices such as waste separation and recycling approaches [6].
Hornik, in 1995, assumed that economic incentives can only be used for participation in solid waste sorting and recycling in the short run. Social and psychological factors are effective means that have been used to urge citizens to recycle waste by creating environmental awareness and providing facilities for solid waste recycling [22,23,24]. Positive changes in their behavior depend on how they perceive differences in an individual’s social and psychological background, which influence their decision to participate in waste sorting and recycling. Therefore, significant effort is required to motivate and enlighten people to understand and appreciate the importance of practicing responsible and sustainable waste management as well as managing their waste more sustainably by sorting and recycling waste at the source [25].
Previous literature on the recycling of household solid waste has mainly focused on how to recycle waste according to certain criteria, including changing societal behavior to understand what is meant by recycling waste, as well as how to develop plans for how to properly handle waste, and that there should be cooperation between the formal and informal sectors in a manner that is consistent with the unification of solid waste [26,27,28]. However, few studies have examined the influence of psychological factors that influence recycling behavior to determine residents’ willingness to engage in waste management [29,30].
Saudi Arabia has faced challenges caused by a critical increase in solid waste relating to population increases [19,26,31]. Saudi Arabia has been facing rapid population growth, urbanization, and industrialization, which has led to the generation of a high level of solid waste [32]. The country’s population has increased, on average, by 3.4% over the last four decades, and more than 75% of the population lives in urban areas, which brings about the need for the authorities to initiate measures to improve waste source separation and recycling among residents in the country. Additionally, the rate of urbanization in KSA has risen from 50 to 80% of the total population from 1970 to the present. This situation has also resulted in the increasing problem of a huge amount of uncontrolled solid waste being generated [33], and a high percentage of the waste is generated in the seven major cities of KSA (Riyadh, Jeddah, Makkah, Madina, Al-Taif, Dammam, and Al-Hassa). Specifically, the three largest cities of KSA; Riyadh, Jeddah, and Dammam produced more than 6 million tons of solid waste annually, which indicates the magnitude of the problem faced by civic bodies [14]. The collection systems in waste sorting and recycling include waste containers, collection vehicles, distance to collection stations, and the whole scheme’s design. The household waste collection system varies among countries: some countries (mostly developing countries) lack organized collection systems, while others (mostly developed countries) have organized collection systems with separate collection containers for recyclable fractions at the doorstep [34]. Studies on waste sorting and recycling have reported approaches that encourage the participation of households in recycling and maximize the amount of recyclable items put out for recycling. These approaches include assessing the socio-economic factors in a study area; moreover, the conducting of pre-audits of the study area is considered a part of a program that is related to the recycling of municipal solid waste and the investigation of a household’s understanding of recycling programs [35,36]. Table 1 shows the generation rate analysis of solid waste in the Eastern Province. It shows a conceptual framework of influences of psychological and external factors on sustainable waste handling practices [22,37,38,39,40,41].
Figure 2 shows the number of participants and respondents involved in this study in measuring the influences of psychological and external factors on residents’ willingness to participate in sustainable waste handling through communication with the Eastern Province Municipality of Dammam using multistage sampling data through subgroup samples related to different income levels that were obtained using a survey on household residents in Dammam. Finally, data analysis and the mapping integration of socio-income levels are included. In the pilot study, the samples were randomly selected and identified from the different districts of Dammam under study. The pilot study was administrated and carried out enumerators with 50 responses were administered by using multi-stage sampling technique via the enumerators through divides large population of Dammam City into stages of different income areas such as high, middle and low to make sample process more practical. After the instrumentation development, the pilot study tested by a group of 50 random individuals with no regard to sample locations which included more than 80% of the total neighborhood districts that follow the city of Dammam. Naturally, the samples of this study were selected while considering the diversity in the different income levels in the districts (categorized as high, middle, and low) to maintain accuracy and avoid any errors.
Table 2 shows the different income levels according to income levels indicators (more than 6000 SR represents a high level; more than 1000 SR and less than 6000 SR represents the middle level, and, finally, less than 1000 SR represents the low level) and the classification of different income levels in the Eastern Province Municipality; specifically, in the three districts of Dammam City. West Dammam City has a total of 19 neighborhoods, Middle Dammam City has a total of 28 neighborhoods, and East Dammam City has a total of 28 neighborhoods. In total, the districts of Dammam City have 22 high-income neighborhoods, 31 middle-income neighborhoods, and 22 low-income level neighborhoods. This study examined the socio-economic activities practiced in Dammam to assess the pattern of urban growth and the socio-economic trends of the Dammam metropolitan area over a period of time. Moreover, it studied a region that died quickly and has been stylized throughout history as it moved from a group of small cities to an urban center locally and internationally. We introduced the life patterns that have affected social and economic growth, and attention was paid to environmental practices employed to maintain a clean environment from pollution. The aim was to address urban planning, provide public services, and work to solve any problems that appear later, as the public and private sectors benefit from an economic and social point of view. Later, as a benefit to the public and private sectors in economic and social terms, the quality of urban life is considered to meet the important needs that contribute significantly to the management of the social life of the population and improves the urban environment by communicating with the public through awareness programs and re-directing investments to other sectors such as tourism, trade, and agriculture [42]. The aim was to rearrange the neighborhoods in the city so that there is a factor of living standards and determine whether the level of income is high, medium, or low according to the division and whether it occurs in the public or private sector. Table 2 shows income levels in the districts of Dammam City in different regions.

3. Problem Statement

According to this study, there is a lack of guidelines and regulations in solid waste segregation in Dammam City, and solid wastes are collected from households or community bins and disposed of in landfills, which is the standard method of waste treatment in Saudi Arabia [16,43]. Also, there is no real program for treating municipal solid waste, except landfilling in hazardous landfills such as Abqaiq, near Dammam. Solid waste separation from different sources is not mandatory for residents, and there are no guidelines or regulations for segregation. The lack of waste segregation has an impact on waste handling practices and the disposal of waste into improper containers on the street. Later, waste pickers or cleaning contractors sort through these waste containers to extract the recyclable materials [42,43]. In this study, strong emphasis will be placed on the ‘individual factor’. That is to say, the essential unit for this research is the household, which is examined through two aspects: the first is raising awareness among the residents by studying the impact of psychological and external factors on Dammam’s residents. The second is to work on solving the problem from its foundation and improving sustainable waste [16,44,45].

4. Focus on the Study
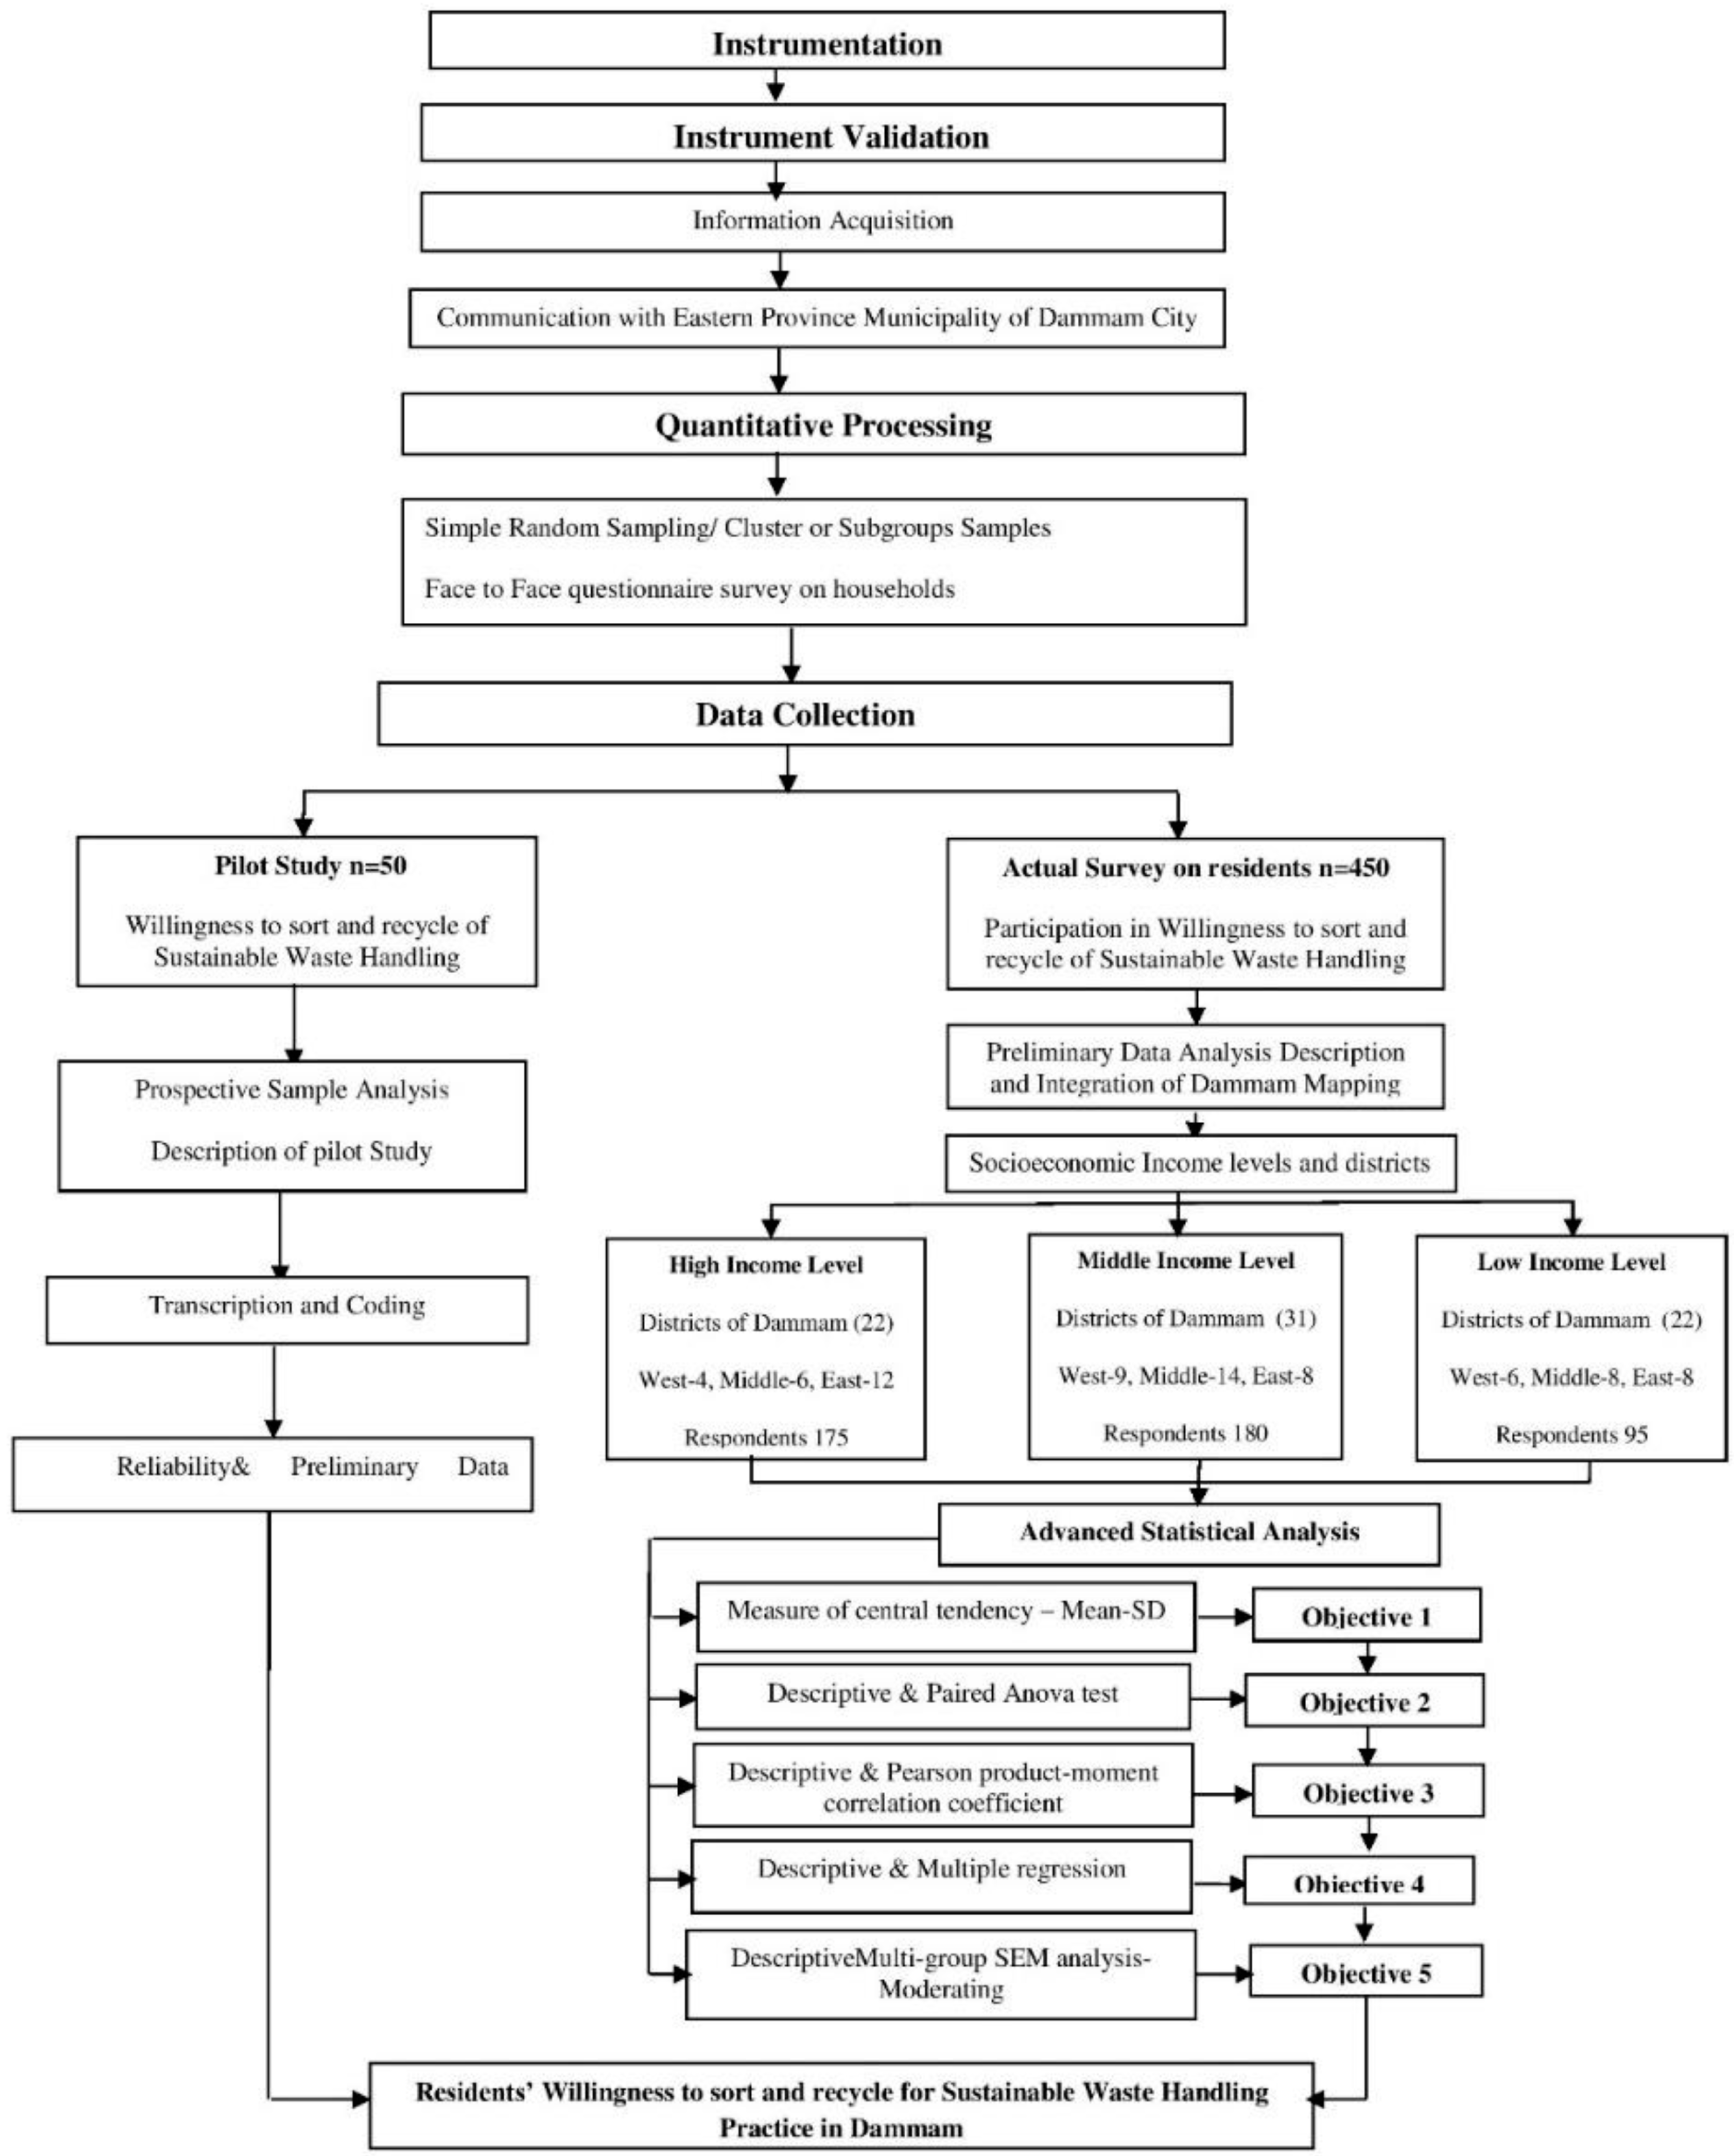
This study used the theory of planned behavior (TPB), which is a conceptual framework that examines the factors influencing someone’s behavior toward a particular issue [46,47,48]. The application of TPB in Saudi Arabia concerning the influences of psychological factors on waste handling in different income levels will fill a knowledge gap [30,31,47,48,49]. It is considered a good city for this study because it is the capital of the Eastern area and the most populous in Saudi Arabia. Also, 31% of residents are in the high-income category, 42% are in the middle-level category, and 27% are in the low-level category [4].
To the best of the researcher’s knowledge, there is a lack of studies that have investigated the determinants of residents’ waste handling practices, particularly in Dammam City, using the combined effects of psychological factors. The present study intends to fill this gap. In this study, emphasis is placed very much on the ‘individual factor’. That is to say, the essential unit for this research is the household. By understanding individual residents’ waste-sorting and recycling practices, those practices can then be combined to provide the behaviors of streets, neighborhoods, communities, and the entire Dammam City. (The first point—awareness of waste sorting and recycling—is given as it has a significant impact on household waste sorting and recycling, and relevant governments are raising sufficient awareness of waste sorting and recycling).

5. Methodology

The sampling technique used in this study was simple random sampling. Using the Cochrane method, the sample size represented all the residents of the city and was calculated with great accuracy, as it was applied and analyzed using a large-scale sample size [25,50,51]. In Dammam City, the management of MSW and the collection, transportation, and disposal of waste to landfills or dumpsites without material or energy recovery is the responsibility of the local municipality, while the regulation of the waste produced is carried out by the local affairs and ministry of municipalities [6,27]. The main method of waste disposal is landfilling, and a small amount of the waste is converted to compost [26,52]. This study covered different income levels, including 29.33% at a high level, 41.33% at a middle level, and 29.33% at a low level. This study also covered districts in different regions, the results of which were 37.33% in the eastern region, 37.33%, in the middle region, and 25.33% in the western region. Also, the selection of respondents in Dammam City began with contacting with Eastern Province Municipality to gain permission to gather information from respondents using a face-to-face method and interviews. The respondents were chosen randomly according to income levels determined in the different districts of Dammam City. Moreover, for each district, the population area was divided into three different income levels, in which the total number of respondents was chosen proportionally to the total population for each category [25]. In Dammam City, it is estimated that 331,000 households in 75 neighborhood districts consist mostly of independent villas and low-rise residential buildings. Table 3 shows the different income levels regarding different percentages of the respondents in Dammam.
Figure 3 shows the distribution of different districts in different regions (east, middle, and west) in Dammam City. Figure 4 shows the distribution of different districts in different regions in Dammam City.
The questionnaire related to psychological and external factors that affected waste handling participants, including demographic questions and different psychological factors. These were categorical variables questions [53]. Table 4 shows the different independent influencing factors on residents’ sustainable waste handling in Dammam, such as psychological and external factors [54,55].

6. Results and Discussion

This study analyzes and describes the respondents’ socio-economic profiles and their levels of psychological factors that impact their willingness toward waste handling. A t-test analysis was conducted to provide insights into the differences in the mean score of the variables among the high- and low-income households. The second part provides inferential statistics along with the results of the correlation analysis [56].
The participants’ responses on all the independent variables were categorized using a range of scores. One can obtain the range of a given datum by finding the difference between the highest and lowest scores, as reported by Howell, 2011 [37].

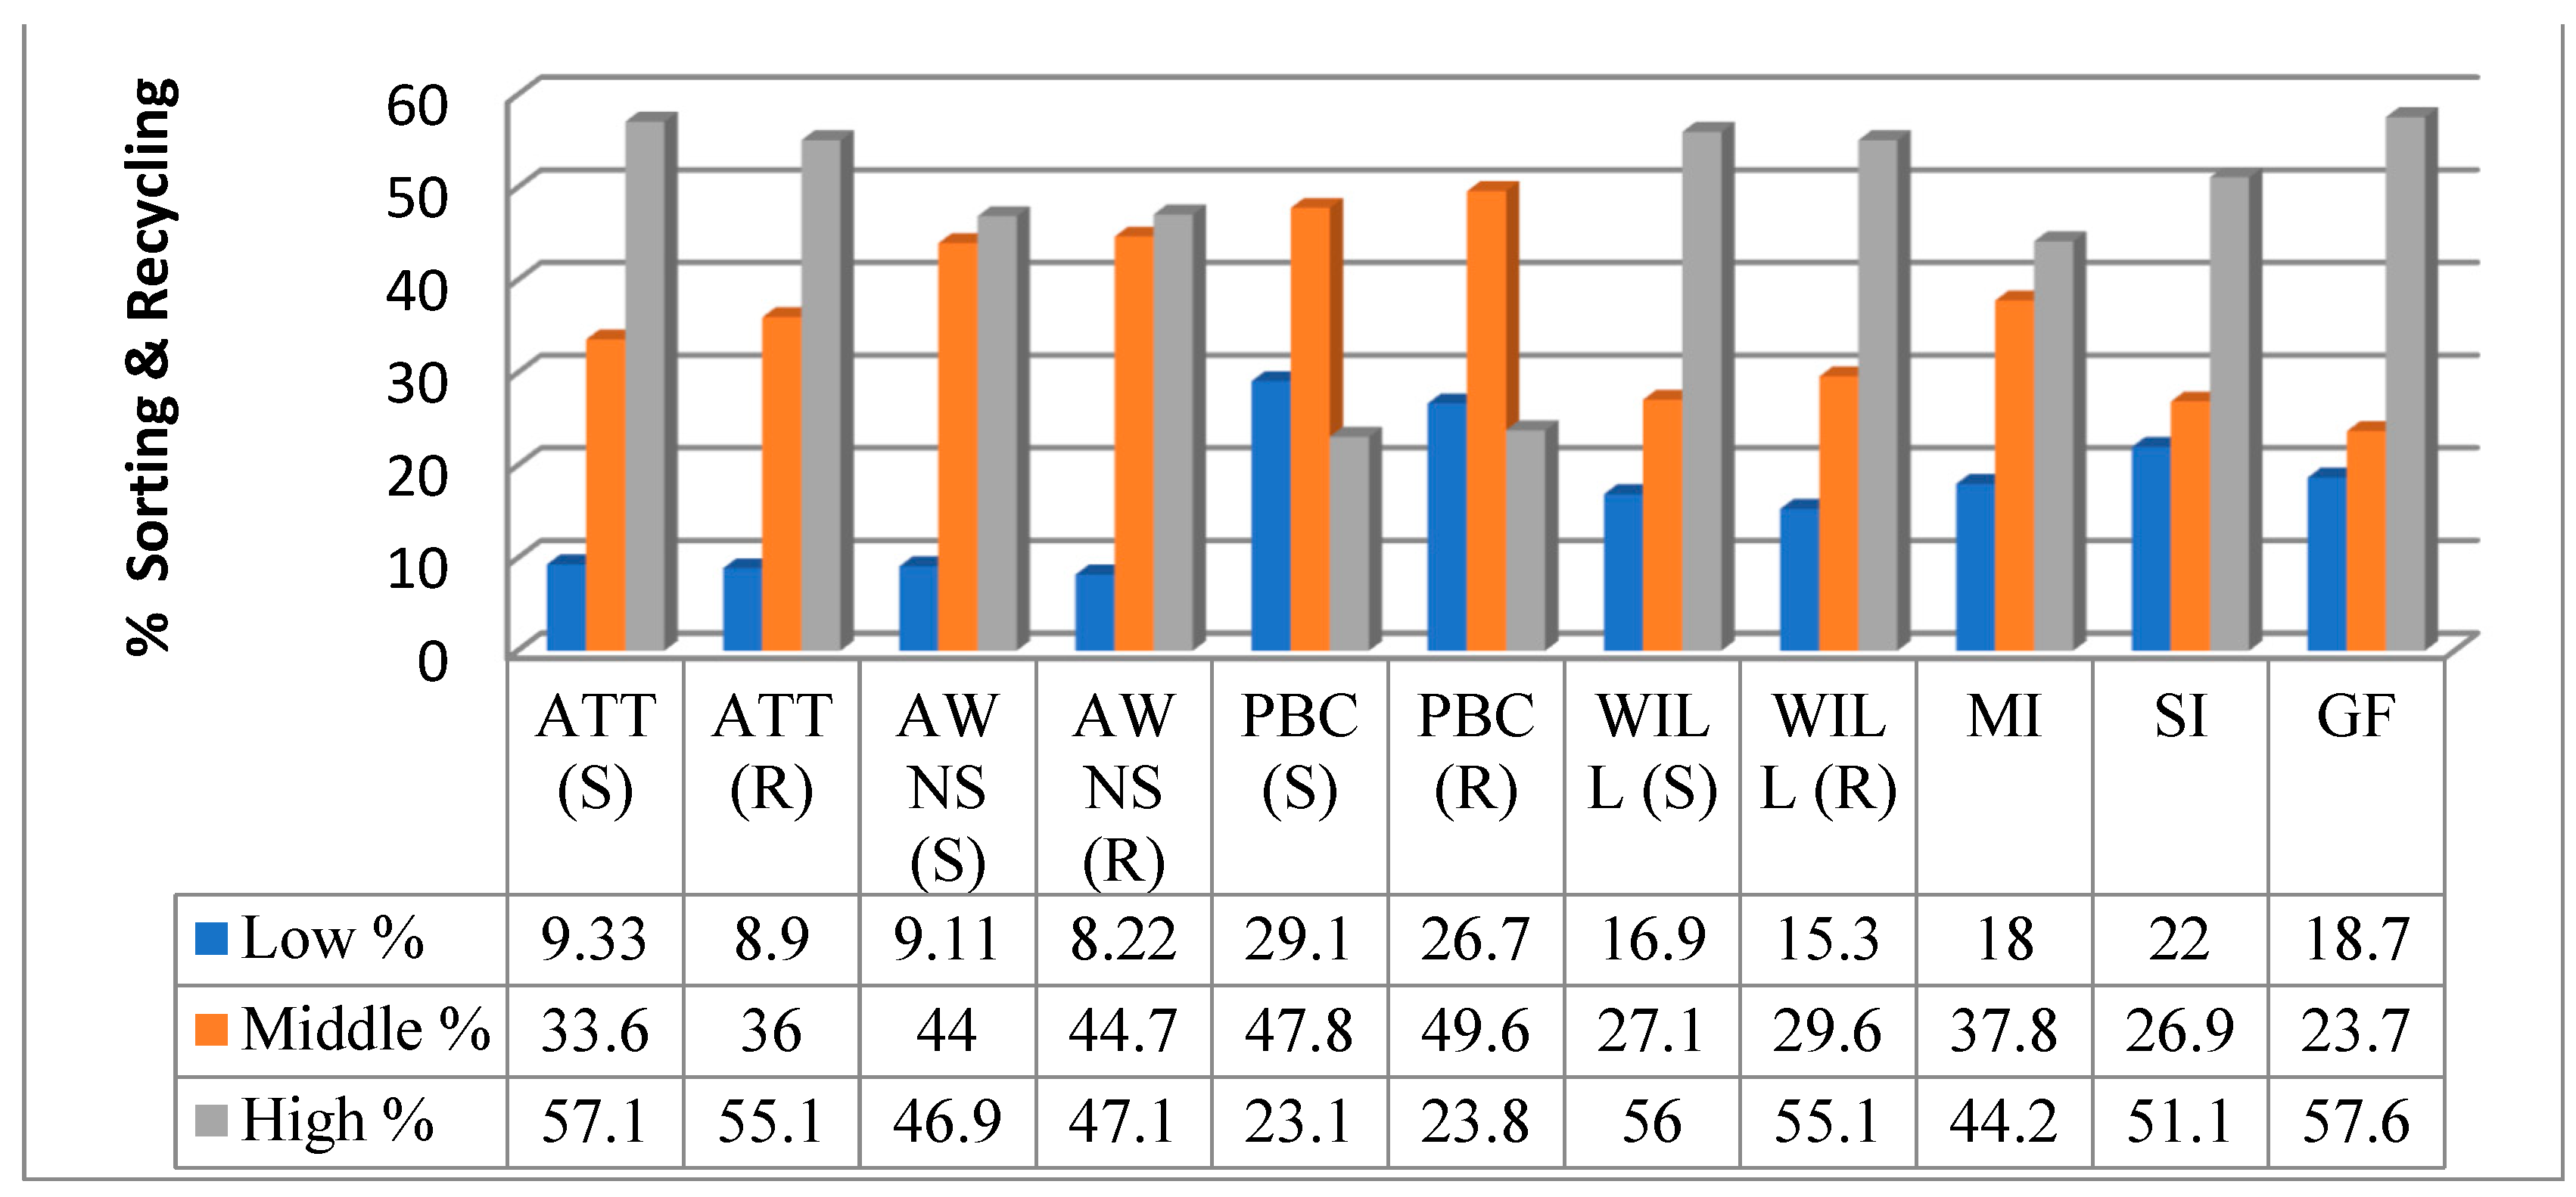
6.1. Levels of Variables of the Study in Sorting and Recycling

This research assessed the different levels of psychological factors concerning waste handling in Dammam City. Figure 4 summarizes the participants’ levels to elucidate the variables of the study.
Figure 4 shows, based on the results of the descriptive and t-test 241 analyses, the descriptive result revealed that most of the respondents (56% and 55.1%) were highly willing to sort and recycle their waste, respectively. A high score in willingness toward waste sorting and recycling suggests that households had the intention of participating in waste handling practice but may be restricted by some factors, such as a market incentive (easy access to the market for recyclables) and government facilitators (recycling facilities). The participants included those of low- and high-income status in Dammam City.

6.2. ANOVA-Test Analysis to Compare High-, Middle-, and Low-Income Groups on the Variables of the Study

The next objective after determining the level of the variables of the research was the independent sample ANOVA-test analysis, which was conducted to determine if there were statistically significant differences between low- and high-income groups based on their attitudes, awareness, perceived behavioral control, market incentive, social influence, and willingness. An independent ANOVA test was used because this study had three independent groups: low-, middle-, and high-income groups. Table 5 presents the results of the hypotheses, which were formulated and tested.
Table 6 shows that only awareness between the low-income and high-income groups, and between the middle- and high-income groups, is significant; therefore, it was supported in some instances but not in others. There was a significant difference in the mean score of PBC among all the income levels except in the cases of middle-income and high-income levels and high-income level and middle-level levels. In government facilitators, there was a significant difference between the middle-income and high-income levels and between the high- and middle-income government facilitators. Therefore, between middle and high levels, and between high and middle levels, were confirmed.
Based on the ANOVA results in Table 6, the pairs of means that were significantly different from each other include high-income and low-income, middle-income and low-income, and middle-income and high-income households. This is because the pairs showed a significant difference at a 0.0001 confidence level. They also showed the absence of zero between the upper and lower bounds of each pair. Therefore, it was accepted. This means that high-income households were significantly different from that of low-income and middle-income households. Similarly, middle-income households exhibited statistically significant differences.

6.3. Comparing the Three Different Income Level Groups with Dammam City Residents’ Psychological Factors

Based on the ANOVA results in Table 4, the pairs of means that were significantly different from each other include high-income and low-income, middle-income and low-income, and middle-income and high-income households. This is because the pairs showed a significant difference at a 0.0001 confidence level. They also showed the absence of zero between the upper and lower bounds of each pair. Therefore, it was accepted. This means that high-income households were significantly different from that of low-income and middle-income households. Similarly, middle-income households exhibited statistically significant differences in their willingness toward waste handling.
Considering the objective of this study is to assess the levels of residents’ psychological factors in different income level groups in Dammam City based on the result of the descriptive and t-test analysis, the descriptive result revealed that most of the respondents (56% and 55.1%, respectively) were highly willing to sort and recycle their waste, and participants included those of low- and high-income status in Dammam City. Respondents who scored high on items measuring willingness to sort and recycle were usually those who recycled for financial benefits (market incentive) or those with high awareness of the benefit of waste sorting and recycling and had the intention to recycle the waste regardless of the availability of facilities for sorting and recycling. Most of these households come from high-income areas, as shown in Table 4, which indicated that some of them had participated in informal recycling activities. This underlines the influence of households’ income in influencing their participation in recycling [57]. Also important are the findings of the independent sample t-tests showing significant differences in the level of market incentives among households in the high- and low-income areas of Dammam City. Due to their inclination towards the financial benefits of waste sorting and recycling, low-income households are more concerned about the market for recyclable materials; hence, they scored higher on market incentives than high-income households, as indicated in Table 4. On the other hand, high-income households scored higher on government facilitators because they are more concerned about providing waste sorting and recycling facilities (government facilitators) than the market for recyclables.
This finding is consistent with that of Stoeva and Alriksson [58], who reported that low-income households in Brazil sort and recycle solid waste not because of environmental concerns but for economic gain. On the other hand, consistent with the current study’s findings, Abd Razack as he mentioned in his study [59]. He reported that high-income households participated in fewer activities due to lack of recycling facilities. Aschemann-Witzel et al. [60] also reported that high-income households cited their reasons for not participating in recycling as being inconvenient, poor infrastructure, lack of time, and law enforcement. The results of why most of the participants in high-income areas are not participating in waste handling included a lack of facilities and local collection. This indicates the benefits of recycling, which is useful for increasing the level of households’ willingness, as highlighted by Echegaray and Hansstein in 2017 [61].
Additionally, the findings of the current study revealed that participants who scored low on items measuring their willingness to sort and recycle waste were those with a low level of awareness about the benefits of the practice. Conversely, the participants who had high scores on the items measuring their willingness toward waste sorting and recycling were those with a higher awareness of the benefits of the practice. This suggests that the households’ level of awareness indicates their level of willingness toward waste handling. This finding is consistent with the findings of a study carried out in China by Wang et al. in 2016 [20].
The findings of the present study revealed that most respondents (46.9% and 47.1%) had high levels of awareness of waste sorting and recycling, and this is congruent with Davies et al. (2002) [62], who revealed that recycling intention was positively related to households’ awareness. This means that, the higher the awareness of the benefit of waste sorting and recycling, the higher a household’s level of willingness toward sustainable waste handling practices. Most of the respondents in this study responded that they were aware of the benefits of sorting waste and recycling it by indicating that recycling saves money and creates jobs [49].
This is reflected in the results of the t-test, which showed a significant difference in the mean score of government facilitators among low- and high-income households. The results show that the mitigation of waste-sorting and recycling facilities has little effect on the level of willingness among low-income households based on their mean score. This is because low-income households in Dammam City participate in informal recycling. This finding is contrary to Wan et al. (2014) [17], who revealed that positive attitudes and intention toward recycling tend to be low when there are no recycling facilities and/or local collections. The overall ANOVA test revealed significant differences among the three income groups, indicating that each income group in Dammam City has a particular 337 factor motivating their willingness to participate in waste sorting and recycling, as suggested by Khalil et al. (2019).

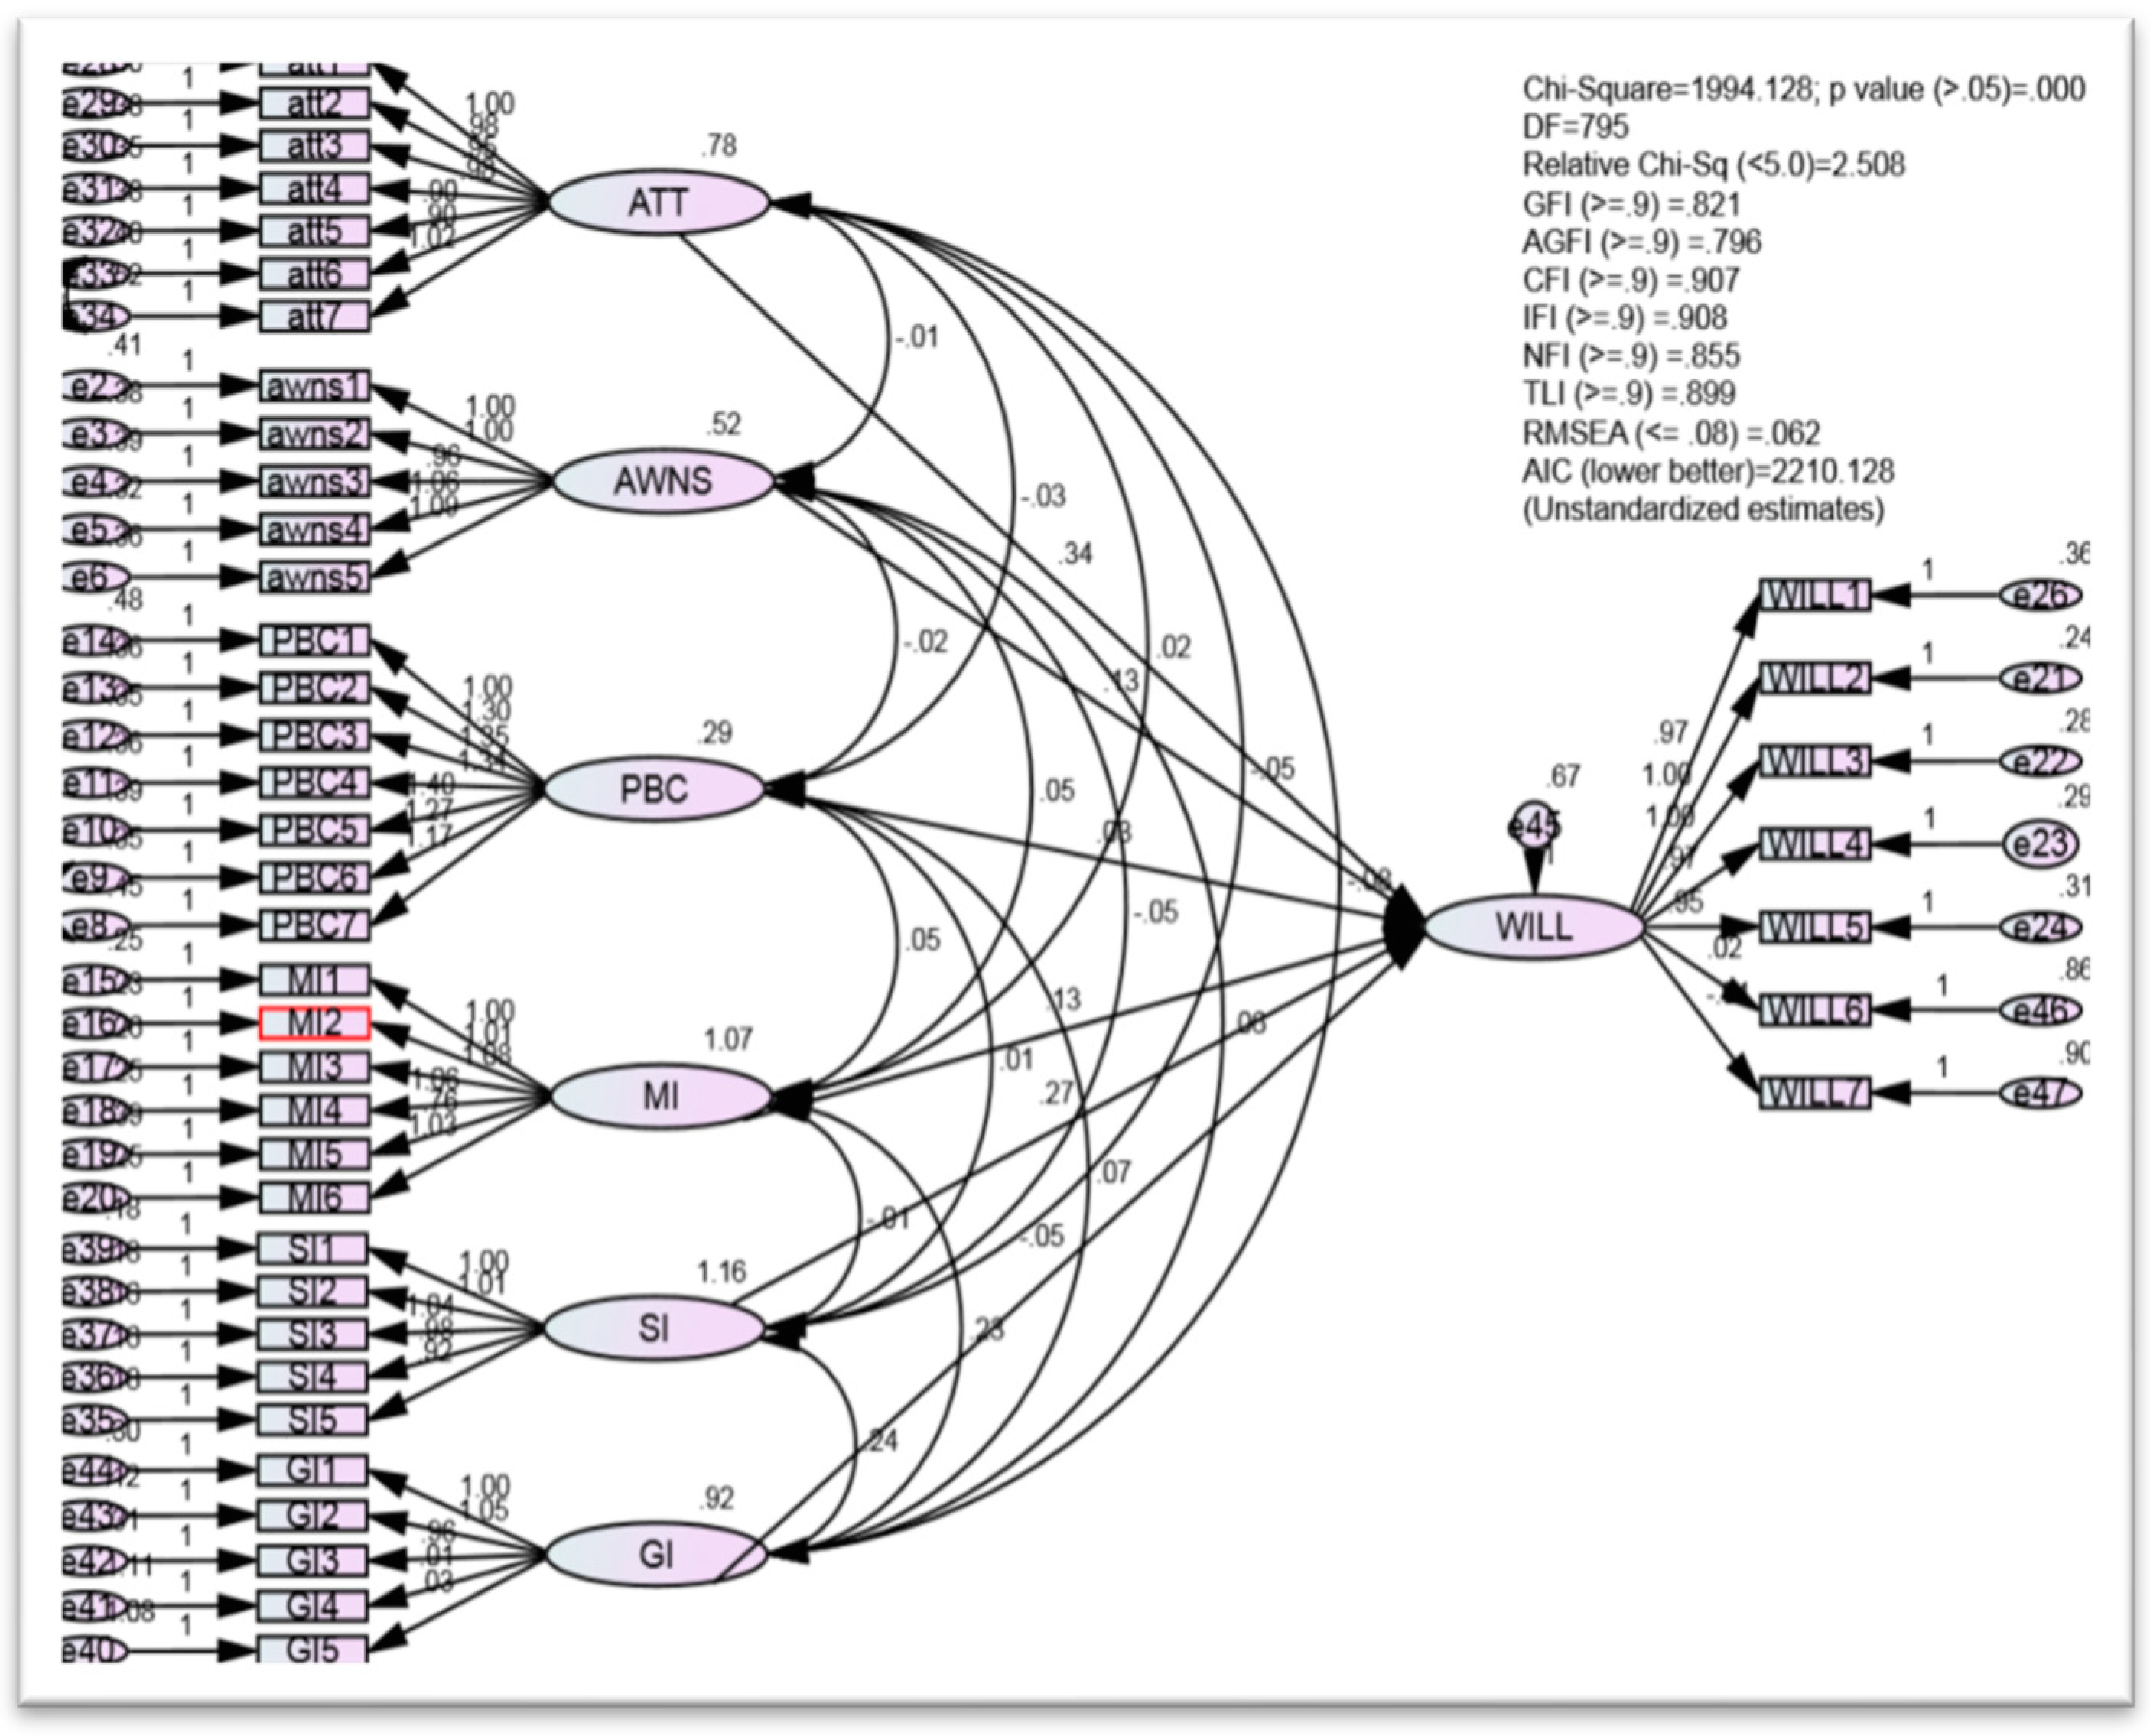
6.4. The Effect of Independent Variables on Households’ Willingness to Sort and Recycle

This method was used to determine the influences of psychological factors on people’s willingness to participate in waste handling practices in Dammam City, Saudi Arabia. This research employed a structural equation model (SEM) to determine the predictive nature of independent variables on the outcome variable. Individual and collective contributions of all the independent variables were also examined and presented. The result of the SEM Figure 5 below indicates that the independent variables collectively explained 67% of variance in willingness to sort and recycle waste, as well as the following Goodness-of-Fit indices: Chi-Square χ2 (CMIN) = 1994.128 (df = 795), Relative χ2 (CMIN/df) = 2.508, p = 0.000, AGFI = 0.796, GFI = 0.821, CFI = 0.907, IFI = 0.908, NFI = 0.855, TLI = 0.899, RMSEA = 0.062. If any three or four of the Goodness-of-Fit indices are within the threshold then the entire model is fit, as reported by Hair et al. (2010). Therefore, based on this, the structural model for this study fits the data.
This research contains several implications to guide residents in sorting and recycling the waste in their daily lives. First, given that residents’ awareness of waste sorting and recycling was not high, and because it has a significant effect on waste households, governments and relevant agencies must take measures to boost residents’ awareness. For instance, waste sorting and recycling guidelines and manuals should be created and liberally disseminated to households. These guidelines and manuals can help households identify the various kinds of waste correctly and understand how to sort waste. Residential communities can create waste sorting and recycling training courses and programs and hold contests to improve waste sorting and recycling awareness. Second, to enhance the role of perceived behavioral control further, government agencies should provide waste sorting and recycling infrastructures. Third, because of the importance of normative factors, measures should be taken to boost social influence. Finally, because of the positive effects of market incentives on waste sorting and recycling practices and their roles in facilitating participation activities, market incentives should be ensured. The forms of incentive measures can be diversified.

7. Conclusions

The study of waste sorting and recycling should be a concept that is understandable in order to improve waste management as much as possible and benefit the community. The respondents of the Dammam community were 56% male and 44% female, within a certain age group range (18–68) and had a household monthly income ranging from SR 700 to SR12000, which was distributed as 21.1% less than SR1000, 38.92% (SR1000–SR5000), and 40% more than SR5000. According to attitudes the sorting and recycling, it was found that the maximum percentage of participants was 57.1% in the high level in sorting and 55.1% in recycling. Regarding the awareness of sorting and recycling, the maximum percentage of participants at a high level was (46.9%) in sorting and (47.1%) in recycling. In perceived behavioral control (PBC) toward sorting and recycling, the maximum percentage of participants in the middle level was 47.7% in sorting and 49.6% in recycling. Regarding willingness toward sorting and recycling, the maximum percentage of participants at a high level was 56% in sorting and 55.1%. Regarding the market incentive (MI) toward sorting and recycling, the maximum percentage of participants at a high level was 44.27% in sorting and recycling. Regarding social influence (SI) toward sorting and recycling, the maximum percentage of participants at a high level was 51.1%. Regarding government facilitators (GF) toward sorting and recycling, the maximum percentage of participants at a high level was 57.1%. Therefore, the hypothesis was supported between middle and high levels and between the high and middle levels. Only awareness between low-income and high-income groups and between the middle- and high-income levels was significant; therefore, it was supported in some instances and not in others. There was a significant difference in the mean score of PBC among all the income levels except in the case of middle-income and high-income levels and between the high-income level and middle-income level. In government facilitators, there was a significant difference between the middle-income level and the high 388-income level, as well as between high and middle-income government facilitators.
In addition, the recommendations for future research in the context of the impact of psychological factors on the residents of Dammam in terms of their participation in the processes of sorting and recycling solid waste are as follows:
To redevelop the profile of recyclers and non-recyclers, an expanded theory of planned behavior (TPB) should be adopted, which facilitates the identification of how to sort and recycle extensively;
Different locations of solid waste generation should be determined in all cities in the country to determine how to evaluate the factors that affect the generation of waste using the application of the geographic information system (GIS). Moreover, the psychological factors affecting behavioral intention and the desire to participate in the sorting and recycling processes should be evaluated in all groups of the community;
The extent of the importance of the role of children in separating the source of solid waste for the practice of recycling at the family level should be highlighted;
The performance of services which are provided by governments in the collection and disposal of municipal solid waste in safe ways should be evaluated;
Competition in private sectors should be improved and encouraged, as they are keen to increase competition among the residents of the city of Dammam and work to raise the standard of living among members of the community;
Recycling programs should be developed for the residents of Dammam City at different levels of income because such programs are useful in raising the level of awareness among citizens and work to implement approved programs for how to benefit from sorting and recycling of solid waste;
The role of public awareness and education programs should be examined and developed to improve the knowledge of waste management operators and supervisors;
The training of sustainable waste handling practices in Dammam for different income levels should be developed.
Therefore, this study is considered a seminal work that determines how to dispose of solid waste through sorting and recycling, especially in areas that suffer from solid waste accumulation without participating in how to benefit from solid waste; it is considered a pioneering study that determines safe ways to benefit from solid waste.
Generally, this research attempts to construct a theoretical research model by adding a market incentive, government facilitators, and awareness into the popular theory of planned behavior to explain residents’ waste-sorting intentions. Moreover, it is also effective for understanding each household’s waste-sorting intention. Nevertheless, it is undeniable that there are several limitations in this research. Firstly, the data are only collected from Dammam City. Though Dammam City is one of the major cities and shares some common characteristics with other cities, the economic development level, residents’ environmental awareness, and the waste sorting level may be different from other cities. Thus, it should be cautioned against generalizing the current research results to another research context. In subsequent research, the survey data should be collected from more cities. Secondly, the respondents of this research are urban residents.
Analysis: The survey data collection was coded in an Excel sheet before data analysis using IBM SPSS software (Version 22). The following subsections discuss statistical techniques that determine whether a statistically significant difference existed among the groups.
Multivariate Analysis of Variance (ANOVA): As an extension of ANOVA (compare groups on a single dependent variable), MANOVA compares groups on several dependent variables that are conceptually related. MANOVA reveals whether the mean differences between groups on the combination of dependent variables are significant or occur by chance. There are several assumptions to MANOVA, which are (1) sample size, (2) normality, (3) the presence of outliers, (4) linearity, (5) homogeneity of regression, (6) multicollinearity and singularity, and (7) homogeneity of variance–covariance matrices.
MANOVA was conducted to determine if there were statistically significant differences between low- and high-income groups based on their attitudes, awareness, perceived behavioral control, market incentives, social influence, government facilitators, and willingness to sort and recycle waste. This study used an independent ANOVA because there were three income groups: low-, moderate-, and high-income groups.
Statistical Techniques to Explore Relationships: The following subsections discuss statistical techniques that evaluate the strength of the association between or among groups. Several assumptions need to be met, including the level of measurement, related pairs (same subject), the independence of observations, normality, linearity, homoscedasticity (similar variability), and missing data. Data obtained in this study were screened to ensure that no violation of any of these listed assumptions occurred.
Pearson Product–Moment Correlation: Correlation explores the direction (positive or negative) and strength of linear relationships with more than two continuous variables. Pearson’s r is used for continuous variables such as interval or ratio variables while Spearman’s is used for categorical variables such as ordinal level or ranked data. Considering that summated scores were considered, Pearson r was employed. The study used Cohen’s guidelines (1992) to interpret the strength of relationships (r) among the variables in which the value of correlation is categorized into three different levels. In the first category, r = 0.10–0.29 represents a small (weak) correlation (effect), r = 0.30–0.49 represents a medium (medium) correlation (effect), and r = 0.50–1.00 represents a large correlation (effect).
Multiple Regression: Unlike correlation, multiple regressions explore the predictive ability of independent variables on a single dependent continuous variable on a large sample size. This rigorous statistical technique reveals the predictive power of a set of variables and how much unique variance these independent variables explain in the dependent variable. For this, a good sample size is necessary, which typically ranges from 200 to 500 respondents. This study has 450 respondents.
Multiple regressions do not determine the causality of the relationships among the variables. Multiple regression assumes that independent variables are measured without error, and they are not correlated with each other; thus, it is essential that the selected independent variables in this study are reliable, which explains this study’s consideration in adopting the theory of planned behavior (TPB). Considering the additional predictor is included in TPB constructs, hierarchical multiple regression was considered, where components of attitudes, social norms, and perceived behavioral control are initially entered into the equation before entering the component of the moral norm.
Structural Equation Model Analysis (SEM): Multivariate techniques investigate a single association at a time, even though techniques such as the multivariate analysis of variance permit multiple dependent variables; however, they only represent a single relationship between the dependent and independent variables. Conversely, structural equation modeling permits a researcher to test a series of dependence associations simultaneously. The SEO technique is beneficial in testing theories that include multiple equations comprising dependence relationships, which can be applied to enhance extension education research further. This research employed a structural equation model (SEM) to determine the predictive power outcome variables.

Supplementary Materials

The following supporting information can be downloaded at: https://www.mdpi.com/article/10.3390/su151813654/s1.

Author Contributions

The author’s contribution as the corresponding author was to study conceptualization and design, data collection, and surveying along with the preparation of manuscript and drafting. Therefore, O.A.L. is contributed in this manuscript through collection of data, wrote all parts of the research and reviewed with the authors and share with the authors in statistical analysis and discussion of the results beside that replying om the reviewers comments. is responsible for the study conception and design and final approval of the manuscript’s submission. L.B.A.M. also contributed to this study as a co-author in supervising and reviewing the draft manuscript, editing it, and participating in the final approval of the manuscript. A.H.B.S. also contributed as a co-author in this study by analyzing the statistical data, as well as interpreting the results, and contributing to the results section’s review and discussion. S.S.B.M.Z. also contributed to this study as a co-author, supervising and reviewing data collection, and contributing to writing the final manuscript. Finally, M.S.K. contributed as a co-author, analyzing the statistical data and contributing to the discussion. All authors have read and agreed to the published version of the manuscript.

Funding

This manuscript sustainability-15-13654 is not funded by external funding but funded by main author funder (Ossama Ahmed labib) and grant number was (2563555) and APC was funded by (Ossama Ahmed labib).

Institutional Review Board Statement

In this section, the manuscript was reviewed through the authors in the working area and This study does not require ethical approval because the questionnaire forms included a statement not to use any information except for the sake of scientific study. It is confidential and is only used in scientific studies in a manner that requires doing so. A copy of the questionnaire form was sent as an embedded copy in the journal to clarify this.

Informed Consent Statement

This study was far from patients, and the participants had to fill out questionnaires according to what was stated in the questionnaire that the information should only be used in scientific research.

Data Availability Statement

The article is improved through Supplementary Materials, including additional data such as tables, inclusions, and appendices in a .pdf file or hard copy.

Acknowledgments

We would like to thank the Eastern Province Municipality for helping with the collection of data from residents of Dammam City, as well as everyone who contributed to the survey.

Conflicts of Interest

The authors declare no conflict of interest.

References

  1. Wang, Y.; Wang, S.; Wang, J.; Wei, J.; Wang, C. An empirical study of consumers’ intention to use ride-sharing services: Using an extended technology acceptance model. Transportation 2020, 47, 397–415. [Google Scholar] [CrossRef]
  2. Kumar, A.; Singh, S. Domestic Solid Waste Generation—A Case Study of Semi-Urban Area of Kathua District, Jammu, J & K, India. Int. J. Sci. Res. Publ. 2013, 3, 1–5. [Google Scholar]
  3. Okalebo, S.E.; Opata, G.P.; Mwasi, B.N. An analysis of the household solid waste generation patterns and prevailing management practices in Eldoret town, Kenya. Int. J. Agric. Policy Res. 2014, 2, 76–89. [Google Scholar]
  4. Zafar, S. Municipal Wastes in Saudi Arabia. Bio-Energy Consult 2020. Available online: https://www.bioenergyconsult.com/municipal-wastes-in-saudi-arabia/ (accessed on 1 January 2021).
  5. UNEP. Overview of Solid Waste Management in Kenya. 2006. Available online: http://www.unep.org/PDF/Kenya_waste_mngnt_sector/chapter3.pdf (accessed on 1 January 2021).
  6. Ouda, O.K.; Cekirge, H.M.; Raza, S.A. An assessment of the potential contribution from waste-to-energy facilities to electricity demand in Saudi Arabia. Energy Convers. Manag. 2013, 75, 402–406. [Google Scholar] [CrossRef]
  7. Zafar, S. Solid Waste Management in Saudi Arabia; Eco MENA: Doha, Qatar, 2015. [Google Scholar]
  8. Abdul-Aziz, H.M.; Isa, O.; Kadir, N.; Nordin, W.; Daud, A.; Alsebaei, A.; Abu-Rizaiza, A. Study of Baseline Data Regarding Solid Waste Management in the Holy City of Makkah during Hajj 1427. Available online: https://www.researchgate.net/publication/324731505_Study_of_baseline_data_regarding_solid_waste_management_in_the_holy_city_of_Makkah_during_Hajj_1427 (accessed on 1 January 2021).
  9. Sharma, B.K.; Moser, B.R.; Vermillion, K.E.; Doll, K.M.; Rajagopalan, N. Production, characterization, and fuel properties of alternative. Fuel Process. Technol. 2014, 144, 79–90. [Google Scholar] [CrossRef]
  10. Alam, P.; Ahmade, K. Impact of solid waste health and the environment. Int. J. Sustain. Dev. Green Econ. 2009, 2, 165–168. [Google Scholar]
  11. Al-Wabel, M.; Al Yehya, W.; Al-Farraj, A.; El-Maghraby, S. Characteristics of landfill leachates and bio-solids of municipal solid waste (MSW) in Riyadh City, Saudi Arabia. J. Saudi Soc. Agric. Sci. 2011, 10, 65–70. [Google Scholar] [CrossRef]
  12. Khan, M.M.S.; Kaneesamkandi, Z. Biodegradable waste to biogas: Renewable energy option for the Kingdom of Saudi Arabia. Int. J. Innov. Appl. Stud. 2013, 4, 101–113. [Google Scholar]
  13. Iqbal, M.; Breivik, K.; Syed, J.H.; Malik, R.N.; Li, J.; Zhang, G.; Jones, K.C. Emerging issue of e-waste in Pakistan A review of status, research needs, and data gap. Environ. Pollut. 2015, 207, 308–318. [Google Scholar] [CrossRef]
  14. Batool, S.A.; Ch, M.N. Municipal solid waste management in Lahore City District, Pakistan. Waste Manag. 2009, 6, 1971–1981. [Google Scholar] [CrossRef]
  15. Nabegu, A.B. An Analysis of Municipal Solid Waste in Kano Metropolis, Nigeria. J. Hum. Ecol. 2010, 31, 111–119. [Google Scholar] [CrossRef]
  16. Nguyen, L.T.; Zeng, M.; Tague, P.; Zhang, J. Recognizing new activities with limited training data. In Proceedings of the International Symposium on Wearable Computers 2017, Maui, HI, USA, 11–15 September 2017. [Google Scholar]
  17. Okot-Okumu, J. SSolid Waste Management in African Cities—East Africa. In Waste Management—An Integrated Vision; IntechOpen: Kampala, Uganda, 2012; ISBN 978-953-51-0795-8. [Google Scholar] [CrossRef]
  18. Henry, L.K.; Field, J.R.; Adkins, E.M.; Parnas, M.L.; Vaughan, R.A.; Zou, M.-F.; Newman, A.H.; Blakely, R.D. Tyr-95 and Ile-172 in Transmembrane Segments 1 and 3 of Human Serotonin Transporters Interact to Establish High Affinity Recognition of Antidepressants. J. Biol. Chem. 2006, 281, 2012–2023. [Google Scholar] [CrossRef] [PubMed]
  19. Wan, C.; Shen, G.Q.; Yu, A. The role of perceived effectiveness of policy measures in predicting recycling behaviour in Hong Kong. Resour. Conserv. Recycl. 2014, 83, 141–151. [Google Scholar] [CrossRef]
  20. Wang, Z.; Guo, D.; Wang, X. Determinants of residents-waste recycling behaviour intentions: Evidence from China. J. Clean. Prod. 2016, 137, 850–860. [Google Scholar] [CrossRef]
  21. Rahman, S.M.; Khondaker, A. Mitigation measures to reduce greenhouse gas emissions and enhance carbon capture and storage in Saudi Arabia. Renew. Sustain. Energy Rev. 2012, 16, 2446–2460. [Google Scholar] [CrossRef]
  22. Pakpour, A.H.; Zeidi, I.M.; Emamjomeh, M.M.; Asefzadeh, S.; Pearson, H. Household waste behaviors among a community sample in Iran: An application of the Theory of Planned Behavior. Waste Manag. 2014, 34, 980–986. [Google Scholar] [CrossRef] [PubMed]
  23. Wan, C.; Shen, G.Q.; Yu, A. Key determinants of willingness to support policy measures on recycling: A case study in Hong Kong. Environ. Sci Policy 2015, 54, 409–418. [Google Scholar] [CrossRef]
  24. Sukholthaman, P.; Chanvarasuth, P.; Sharp, A. Analysis of waste generation variables and people’s attitudes towards waste management system: A case of Bangkok Thailand. J. Mater. Cycles Waste Manag. 2017, 19, 645–656. [Google Scholar] [CrossRef]
  25. Laurence, H. End-of-life and waste management in life cycle assessment. Int. J. Life Cycle Assess. 2012, 17, 504–510. [Google Scholar]
  26. Chen, M.-F.; Tung, P.-J. The Moderating Effect of Perceived Lack of Facilities on Consumers’ Recycling Intentions. Environ. Behav. 2010, 42, 824–844. [Google Scholar] [CrossRef]
  27. Nguyen, T.T.P.; Zhu, D.; Le, N.P. Factors influencing waste separation intention of residential households in a developing country: Evidence from Hanoi, Vietnam. Habitat Int. 2015, 48, 169–176. [Google Scholar] [CrossRef]
  28. Olaizola, I.; Andez, F.S.; Molina, V. Gender issues related to choosing the successor in the family business. Eur. J. Fam. Bus. 2015, 7, 1–2. [Google Scholar]
  29. Al-Khatib, I.A.; Arafat, H.A. A review of residential solid waste management in the occupied Palestinian Territory: A window for improvement. Sage J. Waste Manag. Res. 2010, 28, 481–488. [Google Scholar] [CrossRef]
  30. Habibi, F.; Asadi, E.; Sadjadi, S.J.; Barzinpour, F. A multi-objective robust optimization model for site-selection and capacity allocation of municipal solid waste facilities: A case study in Tehran. J. Clean. Prod. 2017, 166, 816–834. [Google Scholar] [CrossRef]
  31. Zhang, H.; Wen, Z.-G. Residents’ Household Solid Waste (HSW) Source Separation Activity: A Case Study of Suzhou, China. Sustainability 2014, 6, 6446–6466. [Google Scholar] [CrossRef]
  32. Gajalakshmi, S.; Abbasi, S.A. Solid Waste Management by Composting: State of the Art. Crit. Rev. Environ. Sci. Technol. 2008, 5, 311–400. [Google Scholar] [CrossRef]
  33. White, K.M.; Hyde, M.K. The role of self-perceptions in the prediction of household recycling behavior in Australia. Environ. Behav. 2012, 44, 785–799. [Google Scholar] [CrossRef]
  34. Miafodzyeva, S.; Brandt, N. Recycling Behaviour Among Householders: Synthesizing Determinants Via a Meta-analysis. Waste Biomass Valor. 2013, 4, 221–235. [Google Scholar] [CrossRef]
  35. Greaves, M.; Zibarras, L.D.; Stride, C. Using the theory of planned behavior to explore environmental behavioral intentions in the workplace. J. Environ. Psychol. 2013, 34, 109–120. [Google Scholar] [CrossRef]
  36. Esmaeilian, B.; Wang, B.; Lewis, K.; Duarte, F.; Ratti, C.; Behdad, S. The future of waste management in smart and sustainable cities: A review and concept paper. Waste Manag. 2018, 81, 177–195. [Google Scholar] [CrossRef] [PubMed]
  37. Carrus, G.; Passafaro, P.; Bonnes, M. Emotions, habits and rational choices in ecological behaviours: The case of recycling and use of public transportation. J. Environ. Psychol. 2008, 28, 51–62. [Google Scholar] [CrossRef]
  38. Swami, V.; Coles, R.; Stieger, S.; Pietschnig, J.; Furnham, A.; Rehim, S.; Voracek, M. Conspiracist ideation in Britain and Austria: Evidence of a monological belief system and associations between individual psychological differences and real-world and fictitious conspiracy theories. Br. J. Psychol. 2011, 102, 443–463. [Google Scholar] [CrossRef]
  39. Bortoleto, A.P.; Kurisu, K.H.; Hanaki, K. Model development for household waste prevention behaviour. Waste Manag. 2012, 32, 2195–2207. [Google Scholar] [CrossRef]
  40. Lei, C.F.; Ngai, E.W.T. A research agenda on managerial intention to green it adoption: From norm activation perspective. In Proceedings of the PACIS 2014, Chengdu, China, 24–28 June 2014. [Google Scholar]
  41. Botetzagias, I.; Dima, A.-F.; Malesios, C. Extending the Theory of Planned Behavior in the context of recycling: The role of moral norms and of demographic predictors. Resour. Conserv. Recycl. 2015, 95, 58–67. [Google Scholar] [CrossRef]
  42. Latifee, H.; Sajib, M.D.; Hafiz, E. Readymade garment industries going green. Financ. Express 2017, 4, 55–58. [Google Scholar]
  43. Miandad, R.; Anjum, M.; Wagas, M. Solid Waste Management in Saudi Arabia. J. Sci. Food Agric. 2016, 1, 13–26. [Google Scholar]
  44. Zhang, D.; Huang, G.; Yin, X.; Gong, Q. Residents’ Waste Separation Behaviors at the Source: Using SEM with the Theory of Planned Behavior in Guangzhou, China. Int. J. Environ. Res. Public Health 2015, 12, 9475–9491. [Google Scholar] [CrossRef]
  45. Xu, L.; Ling, M.; Lu, Y.; Shen, M. External influences on forming residents’ waste separation behaviour: Evidence from households in Hangzhou, China. Habitat Int. 2017, 63, 21–33. [Google Scholar] [CrossRef]
  46. Kelly, J.R.N. An Overview of Conflict; Lippincott Williams & Wilkins: Philadelphia, PE, USA, 2006; Volume 25. [Google Scholar]
  47. Ghani, W.A.W.A.K.; Rusli, I.F.; Biak, D.R.A.; Idris, A. An application of the theory of planned behaviour to study the influencing factors of participation in source separation of food waste. Waste Manag. 2013, 33, 1276–1281. [Google Scholar] [CrossRef]
  48. Islam, M.S.; Sultana, A.; Rasheduzzaman, M.; Kundu, G.K.; Kamal, A.K.I.; Uddin, M.K. Uddin, Assessment of the Present State and Economical Prospects of Solid Waste at Amin Bazar Waste Dumping Site, Dhaka, Bangladesh. J. Sci. Res. 2015, 7, 129–137. [Google Scholar] [CrossRef]
  49. Khalil, M.S.; Ho, Y.M.; Manaf, L.A.; Sharaai, A.H.; Nabegu, A.B. Income Perspective on the Factors Influencing Households’ Recycling Intention: Implications from the Extended Theory of Planned Behaviour. J. Malays. Inst. Plan. 2019, 2, 191–202. [Google Scholar]
  50. Howell, D.C. Statistics for the Behavioural Sciences, 7th ed.; Cengage Learning Products: Belmont, CA, USA, 2011. [Google Scholar]
  51. Aron, A. Online Dating: The Current Status—And Beyond. Psychol. Sci. Public Interest 2012, 13, 1–2. [Google Scholar] [CrossRef] [PubMed]
  52. Hayes, R.; Dear, B.; Li, G.; Virgona, J.; Conyers, M.; Hackney, B.; Tidd, J. Perennial pastures for recharge control in temperate drought-prone environments. Part 1: Productivity, persistence and herbage quality of key species. N. Z. J. Agric. Res. 2010, 53, 283–302. [Google Scholar] [CrossRef]
  53. Fisher, C.; Bashyal, S.; Bachman, B. Demographic impacts on environmentally friendly purchase behaviors. J. Target. Meas. Anal. Mark. 2012, 20, 172–184. [Google Scholar] [CrossRef]
  54. Ajzen, I.; Fishbein, M. The influence of attitudes on behavior. In The Handbook of Attitudes; Albarracin, D., Johnson, B.T., Eds.; Psychology Press: New York, NY, USA, 2005; pp. 173–221. [Google Scholar]
  55. Meyer, R.; Liebe, U. Are the affluent prepared to pay for the planet? Explaining willingness to pay for public and quasi-private environmental goods in Switzerland. Popul. Environ. 2010, 32, 42–65. [Google Scholar] [CrossRef]
  56. Zainudin, M.M.; Afthanorhan, A.; Mohammed, M. Comparison Between CB-SEM and PLS-SEM: Testing and Confirming the Maqasid Syariah Quality of Life Measurement Model. J. Soc. Sci. Res. 2019, 3, 608–614. [Google Scholar]
  57. Hornik, J.; Joseph, C.; Mandansky, M.; Narayana, C. Determinant of recycling behavior: A synthesis of research result. J. Socio. Econ 2005, 24, 105–127. [Google Scholar] [CrossRef]
  58. Stoeva, K.; Alriksson, S. Influence of recycling programmes on waste separation behaviour. Waste Manag. 2017, 68, 732–741. [Google Scholar] [CrossRef]
  59. Abd’razack, N.T.; Medayese, S.; Shaibu, S.; Adeleye, B. Habits and benefits of recycling solid waste among households in Kaduna, North West Nigeria. Sustain. Cities Soc. 2016, 28, 297–306. [Google Scholar] [CrossRef]
  60. Aschemann-Witzel, J.; Jensen, J.H.; Jensen, M.H.; Kulikovskaja, V. Consumer behaviour towards price-reduced suboptimal foods in the supermarket and the relation to food waste in households. Appetite 2017, 116, 246–258. [Google Scholar] [CrossRef]
  61. Echegaray, F.; Hansstein, F.V. Assessing the intention-behavior gap in electronic waste recycling: The case of Brazil. J. Clean. Prod. 2017, 142, 180–190. [Google Scholar] [CrossRef]
  62. Akil, A.M.; Foziah, J.; Ho, C.S. The effects of socio-economic influences on households recycling behaviour in Iskandar Malaysia. Proc. Soc. Behav. 2015, 202, 124–134. [Google Scholar]
Figure 1. Different percentages of Solid Waste Generation in Saudi Arabia.
Sustainability 15 13654 g001
Figure 2. Research methodology framework for the data collection of income levels in Dammam City.
Sustainability 15 13654 g002
Figure 3. Distribution of different districts in Dammam City by neighborhoods. Source: Imam Abdulrahman Bin Faisal University, College of Arts and Department of Geography (2020).
Sustainability 15 13654 g003
Figure 4. Sorting and recycling percentage of the participants’ levels for the variables of the study. Note: ATT = attitude; AWNS = awareness; PBC = perceived behavioral control; WILL = willingness; MI = market incentive, SI =social influence; GF = government facilitators; (S) = sorting; and (R) = recycling.
Sustainability 15 13654 g004
Figure 5. The output of the integrated model, showing its predictive power.
Sustainability 15 13654 g005
Table 1. Waste generation rate analysis in the Eastern Province, Saudi Arabia.
CityPopulation (2010)Total Collected Volume per Day m3/dayTotal Refuse Volume m3/dayWaste Generation
Kg/Capita/Day
Dammam159,4002750326,1502.04
Alkhobar100,2001363161,6521.61
Dhahran25,00057367,9582.72
Rahima42,20083599,0312.35
Abaqaiq45,72778593,1012.04
Source (Solid Waste Management Practices in the Eastern Province of Saudi Arabia, 2010).
Table 2. Distribution of socio-economic income levels in Dammam City.
Regions of DammamSocio-Economic Levels of Dammam in Each District
HLMLLLTotal
West of Dammam49619
Middle of Dammam614828
East of Dammam128828
Total22312275
Note: HL = High Income Level, ML, more than 6000 SR = Middle Income Level, more than 1000 SR and less than 6000 SR, and LL = Low Income Level, less than 1000 SR.
Table 3. Income levels of population region and respondents’ districts in Dammam City.
Income LevelsPopulation RegionNo. of RespondentPercentage (%)
High Level310,00017539
Middle Level320,00018040
Low Level170,0009521
Total800,000450100
Table 4. Influencing factors that affect residents’ sustainable waste handling practices (sorting) and (recycling).
No. Factors
Psychological Factors (internal Factors)
1 Attitude
2 Awareness
3 Perceived Behavior Control
External Factors
1 Social Influences
2 Market Incentives
3 Government Facilitators
Table 5. ANOVA test analysis to compare between high-, middle- and low-income households’ levels in different variables of the study.
Willingness toward Sorting and RecyclingSignificance
AttitudeAwarenessPerceived Behavioral ControlSocial InfluenceMarket IncentiveGovernment Facilitators
Low IncomeMiddle Income0.9350.2520.0420.4860.7180.541
High Income0.3570.0010.0060.0960.570.146
Middle IncomeLow Income0.9350.2520.0420.4860.7180.541
High Income0.1690.0010.1810.1320.7310.008
High IncomeLow Income0.3570.0010.0060.0960.570.146
Middle0.1690.0010.1810.1320.7310.008
Table 6. A Bonferroni and Scheffe post hoc multiple comparisons test showing pairs of means that are significantly different from each other.
Multiple Comparisons
Dependent Variables—Willingness to Sort and Recycle
Willingness to Sort and RecycleMean DifferenceStd. ErrorSig95% Confidence Interval
Lower BoundUpper Bound
ScheffHigh IncomeLow Income−32.43553.14500.00−40.1601−24.7108
Middle Income−5.83163.44700.24−14.29812.6340
Middle IncomeHigh Income32.43503.14500.0024.710040.1600
Low Income26.60203.74930.0017.394035.8120
Low IncomeMiddle Income5.83103.44700.24−2.634814.2980
High Income−26.60383.74930.00−35.8128−17.3949
BonferroniHigh IncomeLow Income−32.43553.14500.00−39.9937−24.8773
Middle Income−5.83163.44700.27−14.11572.4520
Middle IncomeHigh Income32.43503.14500.0024.877339.9930
Low Income26.60303.74930.0017.593035.6140
Low IncomeMiddle Income5.83103.44700.27−2.452414.1150
High Income−26.60383.74930.00−35.6144−17.5933
Disclaimer/Publisher’s Note: The statements, opinions and data contained in all publications are solely those of the individual author(s) and contributor(s) and not of MDPI and/or the editor(s). MDPI and/or the editor(s) disclaim responsibility for any injury to people or property resulting from any ideas, methods, instructions or products referred to in the content.

