Article

Multiport Converter Utility Interface with a High-Frequency Link for Interfacing Clean Energy Sources (PV\Wind\Fuel Cell) and Battery to the Power System: Application of the HHA Algorithm

by
Nagwa F. Ibrahim
1,
Sid Ahmed El Mehdi Ardjoun
2,
Mohammed Alharbi
3,
Abdulaziz Alkuhayli
3,
Mohamed Abuagreb
4,
Usama Khaled
5 and
Mohamed Metwally Mahmoud
5,*
1
Electrical Department, Faculty of Technology and Education, Suez University, Suez 43533, Egypt
2
IRECOM Laboratory, Faculty of Electrical Engineering, Djillali Liabes University, Sidi Bel-Abbes 22000, Algeria
3
Department of Electrical Engineering, College of Engineering, King Saud University, Riyadh 11421, Saudi Arabia
4
Department of Electrical and Computer Engineering, Clemson University, Clameson, SC 29405, USA
5
Electrical Engineering Department, Faculty of Energy Engineering, Aswan University, Aswan 81528, Egypt
*
Author to whom correspondence should be addressed.
Sustainability 2023, 15(18), 13716; https://doi.org/10.3390/su151813716
Submission received: 22 July 2023 / Revised: 4 September 2023 / Accepted: 10 September 2023 / Published: 14 September 2023
(This article belongs to the Special Issue Energy Technology and Sustainable Energy Systems)

Abstract

:
The integration of clean energy sources (CESs) into modern power systems has been studied using various power converter topologies. The challenges of integrating various CESs are facilitated by the proper design of multi-port power converter (MPPC) architecture. In this study, a brand-new two-stage MPPC is suggested as a solution to the intermittent nature and slow response (SR) of CESs. The suggested system combines a DC\DC and a DC\AC converter and storage unit, and the suggested circuit additionally incorporates a number of CESs (PV\wind\fuel cell (FC)). This article discusses the power management and control technique for an integrated four-port MPPC that links three input ports (PV, wind, and FC), a bidirectional battery port, and an isolated output port. One of the recent optimization techniques (Harris Hawk’s algorithm) is applied to optimize the system’s controller gains. By intelligently combining CESs with complementary characteristics, the adverse effects of intermittency are significantly mitigated, leading to an overall enhancement in system resilience and efficiency. Furthermore, integrating CESs with storage units not only addresses SR challenges but also effectively combats intermittent energy supply. The proposed system exhibits improved dynamic capabilities, allowing it to efficiently distribute excess energy to the load or absorb surplus energy from external sources. This dual functionality not only optimizes system operation but also contributes to a reduction in system size and cost, concurrently enhancing reliability. A comprehensive investigation into operational principles and meticulous design considerations are provided, elucidating the intricate mechanics of the suggested MPPC system. Employing MATLAB/Simulink, the proposed architecture and its control mechanisms undergo rigorous evaluation, affirming the feasibility and efficacy of this innovative system.

1. Introduction

In order to solve concerns like accelerating environmental deterioration, dependence on fossil fuels, and global climate change, clean energy sources (CESs) are more important than ever. CESs such as solar energy (PV), wind, tidal, and biomass energy have arisen as the leading solutions within the realm of environmentally conscious energy technologies, effectively addressing the pressing worldwide energy challenges. Traditional sources like coal, oil, natural gas, and nuclear materials are characterized by their limited availability and negative ecological impact. Thus, to cater to the progressively surging global energy demand, there has been a notable uptake of CES solutions, prominently showcased by the integration of wind and PV systems in recent years [1]. One CES that can displace the usage of fossil fuels in the present is the fuel cell (FC). The FC is excellent for long-term power needs since it has a higher power density than other sources. Nevertheless, to meet the load’s high immediate energy needs, the FC must be combined with an energy storage unit. Wind speed in a definite area has a detrimental effect on how reliable the wind energy system is. Similar to this, solar radiation in a specific region has a detrimental effect on how reliable PV is. In order to improve performance and efficiency in a variety of operating conditions, auxiliary storage tools such as batteries are used in conjunction with these CESs [2,3]. To control and manage more energy sources, these systems require more converters based on the input sources. The system enlarges and weighs more, which raises the price and the complexity of the system. In accordance with some studies, multiport structures (MSs) are better suited for integrating multiple energy sources. MSs also offer a more dynamic reaction and fewer phases, which facilitates better control [4,5].
Due to the rapidly expanding potential of power converters (PCs) in contemporary power and CES applications, studies on PCs have drawn a lot of attention. As a result, there is a sizable number of studies that concentrate on PC topologies for applications related to CESs. These studies have generally covered a number of issues, including the creation of their soft switching characteristic, smoother output waveforms, high power density, and high efficacy. CESs fall within the category of resources with converter interfaces. They are linked to the electrical system by PCs, which are in charge of converting DC into AC or vice versa. The control of DC voltage and current values, which can be accomplished using DC/DC PCs, is an additional crucial function. To feed the DC current produced from the PV to the AC electrical grid, a DC/AC PC is needed. For PV, a DC/DC buck or boost PC may also be used to couple the voltage ranges of the PV and the DC/AC converter [6]. Both DFIGs and PMSGs use back-to-back (BTB) converters in wind power applications. The B2B converter comprises two VSCs connected by a single DC link, and its job is to regulate the DC voltage in order to regulate the equipment and the flow of power into the grid [7,8]. The most prevalent converters used in storage unit applications are DC/DC PCs, which modify the DC voltage level for charging or discharging, and a DC/AC PC when the charging station is linked to the main AC grid.
Designing innovative DC-DC electrical conversion systems has become more difficult as a result of recent innovations in CESs. This innovative system can comprise many different input RESs that will be combined through multiple input power converters that can handle various input suppliers and merge their benefits to give a regulated output for a number of uses. In the scientific literature, two architectures for DC-DC translation have been published: single-port architecture (SPA) and MS [9]. Numerous sources are integrated at a shared DC side in the conventional configuration, and each source is subjected to a separate DC-DC conversion stage, with each converter functioning separately [10]. A connection bus may also be installed in some circumstances to facilitate information sharing between sources. Both on\off grid hybridization energy structures utilize this DC-DC conversion mechanism [11]. The price of the converter is higher because this system requires power conversion at many stages and occasionally calls for equipment communication. The system is complicated, in part, because different converters are controlled independently [12].
Many inputs/outputs from MS are coupled to different CESs. As a substitute for using the DC-to-DC PC, a single storage unit is connected to the total energy-saving part bus (conventional structure). The performance analysis of the DC-DC PC architecture is further summarized in Table 1. The quantity of power delivered to a regulator from every input is examined for each DC-DC PC’s operation. In terms of multiple inputs/outputs, this topology is very intriguing for sustainable generating [13,14]. The multiple input single output (MISO) DC\DC PC system’s associated work is shown in Table 2.
MSs have been implemented in order to surpass the limitations of SPA. In MS, the entire building is seen as a single power converter that mixes different sources, and controllers are responsible for power management. These MSs have been introduced for a variety of uses, including hybrid RESs, aerospace, and uninterrupted power supplies [21]. This is because they have a simple framework, a minimal number of conversion parts, and fewer components. These are additionally separated into isolated and non-isolated converters. To prevent shock hazards, accomplish high voltage (HV) converting, and safeguard semiconductor components with HV ratings, isolated sorts are employed to separate the low voltage DC side from the HV side [22,23]. For this, high-frequency transformers have been employed. However, this framework’s drawback is that it must make room for a transformer core, which adds bulk and raises the price. Alternatively, non-isolated types have a candid structural design and are employed in situations where galvanic separation between the supply and load is not necessary. This topology’s advantages include a low price because of the limited number of elements and greater power density. Non-isolated types may complement the input and output impedances of the source and load, but they are unable to produce HV conversion ratios.
Impedance source or Z-source (ZS) DC-DC converters outperform traditional boost converters with regard to HV gain. Numerous scholars use quasi-ZS and ZS types to propose a variety of topologies. Reference [24] describes a brand-new collection of extended-boost quasi-ZS types. It suggested using a ZS, where the required power is supplied via two unidirectional ports and one bidirectional port [14]. When multiple unidirectional supplies are taken into consideration for one unidirectional outlet for the battery, a Z-quasi resonant DC-DC boost converter is suggested [25].
By varying the spins’ number on the HV side of the inductor, various voltages were attained in order to progress a SPA [26]. In Reference [27], a zero-current switching (ZCS) scheme for DC-DC converters was presented to create and implement a ZCS-based digital control algorithm. A one-inductor 2-input, 3-output topology for a converter can be extended to a PC with extra inputs and outputs. In Reference [28], a new configuration of switching boost operation via a dsPIC controller was used in an SP double output system to disperse the incoming power into several ports for CES applications. An example of a topology includes a non-isolated SPA with controlled capacitors for the HV and low voltage output ports, respectively, as discussed in Reference [29]. In Reference [30], the suggested model predictive controller (MPC) works well with several input/output architectures. The circuit comprising an inductor, a capacitor, and a switch is depicted as a workable extension that enables the converter to have numerous inputs. The terminal voltage of the MPC is precise concurrently by means of the power control from multiple supplies, which employ the proposed deadbeat-based control. For use in hybrid energy storage units, a buck-boost converter with an extra input port is shown to be bidirectional [31]. Certain isolated multiports, as opposed to non-isolated multiports, are presented by 1 and 2, where the multi-input high-frequency transformer is needed to supply the requisite power. Bidirectional power flow is made possible by these frameworks, which enables the best possible utilization of more power to boost system efficiency [32].
The objective of this work is to conceive and enact a non-isolated Multi-Source (MS) converter featuring a bidirectional battery interface and to enhance its efficiency in delivering consistent power to a load without any discernible fluctuations. To attain this, we have employed a novel approach, optimizing the controller parameters through the innovative Harris Hawk’s algorithm (HHA) technique. Within this study, we introduce several pioneering strategies:
  • Compact and Lightweight Design: Our system boasts a compact and lightweight design, simplifying installation and integration with existing infrastructure;
  • Enhanced Efficiency and Reliability: The system is meticulously engineered to maximize energy output from multiple CESs while prioritizing unwavering reliability for continuous power generation;
  • Efficient Utilization of Solar and Wind Energy: By seamlessly integrating solar and wind energy modules, our system optimally harnesses these renewable sources, ensuring more complete utilization of available CESs;
  • High Voltage Output with Minimal Components: Our investigated converter achieves high voltage at the output while employing a minimal number of components, streamlining its functionality;
  • Versatile Integration of CESs: The system exhibits versatility by accommodating various CESs, including Fuel Cells (FCs), wind, and Photovoltaic (PV) modules, thereby creating a resilient and diversified power generation network;
  • Bidirectional Input Ports: To facilitate battery charging and discharging, one of the input ports on our unique multiport converter is bidirectional, allowing for greater flexibility. The investigated converter comprises three inputs and a single output;
  • Backup Power Source: In addition to its primary function, this hybrid system can serve as a reliable backup power source in situations where local generators fall short, guaranteeing uninterrupted power supply to critical loads and enhancing overall system reliability.
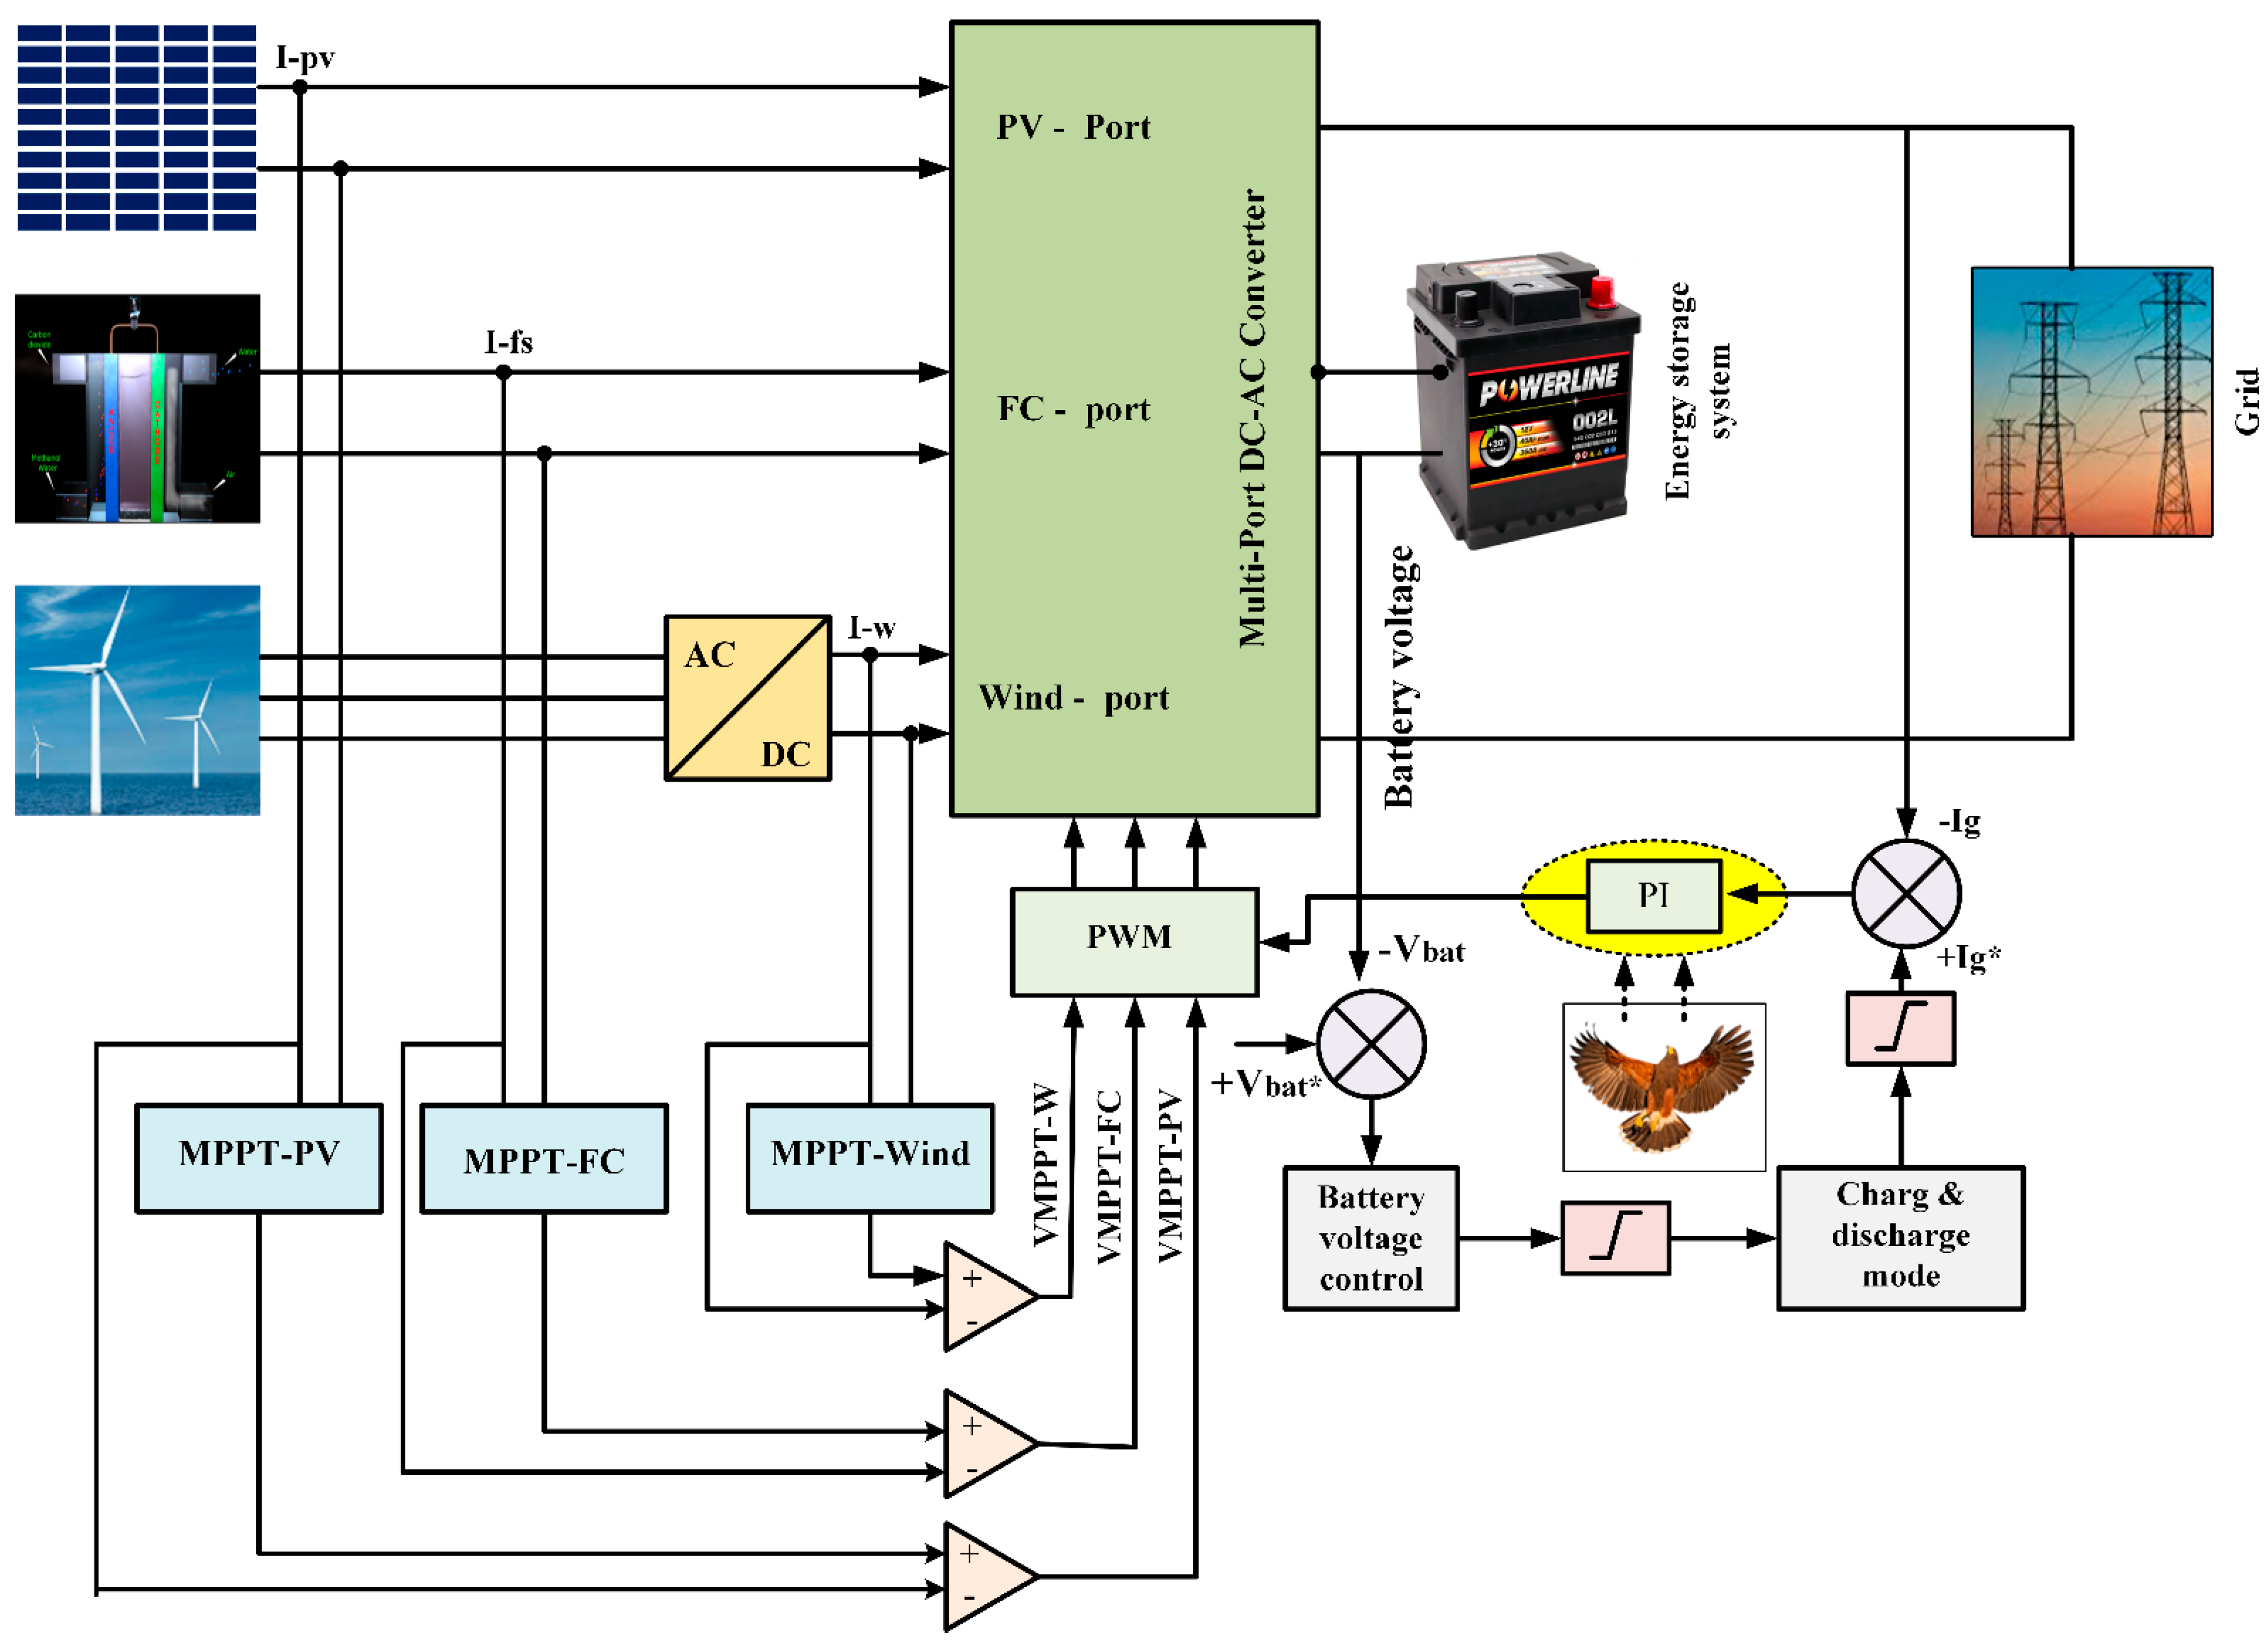
These innovative strategies collectively contribute to the advancement of power conversion technology, offering a robust and dependable solution for sustainable energy generation and distribution.
The article studies and presents certain recent advances in MS converter topologies for use in CESs. The working theory, benefits, and drawbacks of MS types are reviewed. The remaining text is divided as follows: The researched system components, modeling, and its fundamental tenets for every mode are offered in Section 2. Section 3 presents the recommended control system and application of the HHA algorithm. Section 4 contains information on thorough modeling and simulation. The analyses’ findings and the work’s conclusion are presented in the last section.

2. Addressed System

2.1. Description of the Investigated System

Figure 1 shows a system involving CESs that is linked to the grid in a two-step design. A PWM inverter and an MS DC-DC power converter make up the investigated systems [33]. The several input ports of the MS DC-DC converter serve as a connection for various sources, including FCs, wind, and PV. Its main job is to control these sources’ DC output so that it matches the necessary DC voltage for the inverter input. The converter also handles crucial control duties, including maximum power point tracking (MPPT), meant for various CESs.
As depicted in Figure 2, an innovative MS is suggested for the incorporated power management for three CESs. It comprises a unidirectional port for the PV/FC/wind to supply electricity to the battery and the load and a bidirectional port for the battery to operate without interruption. As shown in Figure 2, the investigated converter uses just one switch for every input port linked to a supply. Figure 2’s representation of the first converter unit shows that it has an L1 boost inductor, an S1 active switch, a D1 diode, and a Cdc filtering capacitor at the output. The suggested MS converter’s circuit diagram can be seen in Figure 2, and the specified circuit parameters are presented in Table 3 [34]. Three parallel ports make up the proposed converter circuit, which also has a battery for energy storage. A power diode, boost inductor, and semiconductor switch are all contained within every port. Nevertheless, the suggested MS converter design stands out because it has the fewest components compared to other converters, giving it an economic benefit [35].

2.2. System Components Modeling

This section presents the modeling of applied CESs with their parameters.

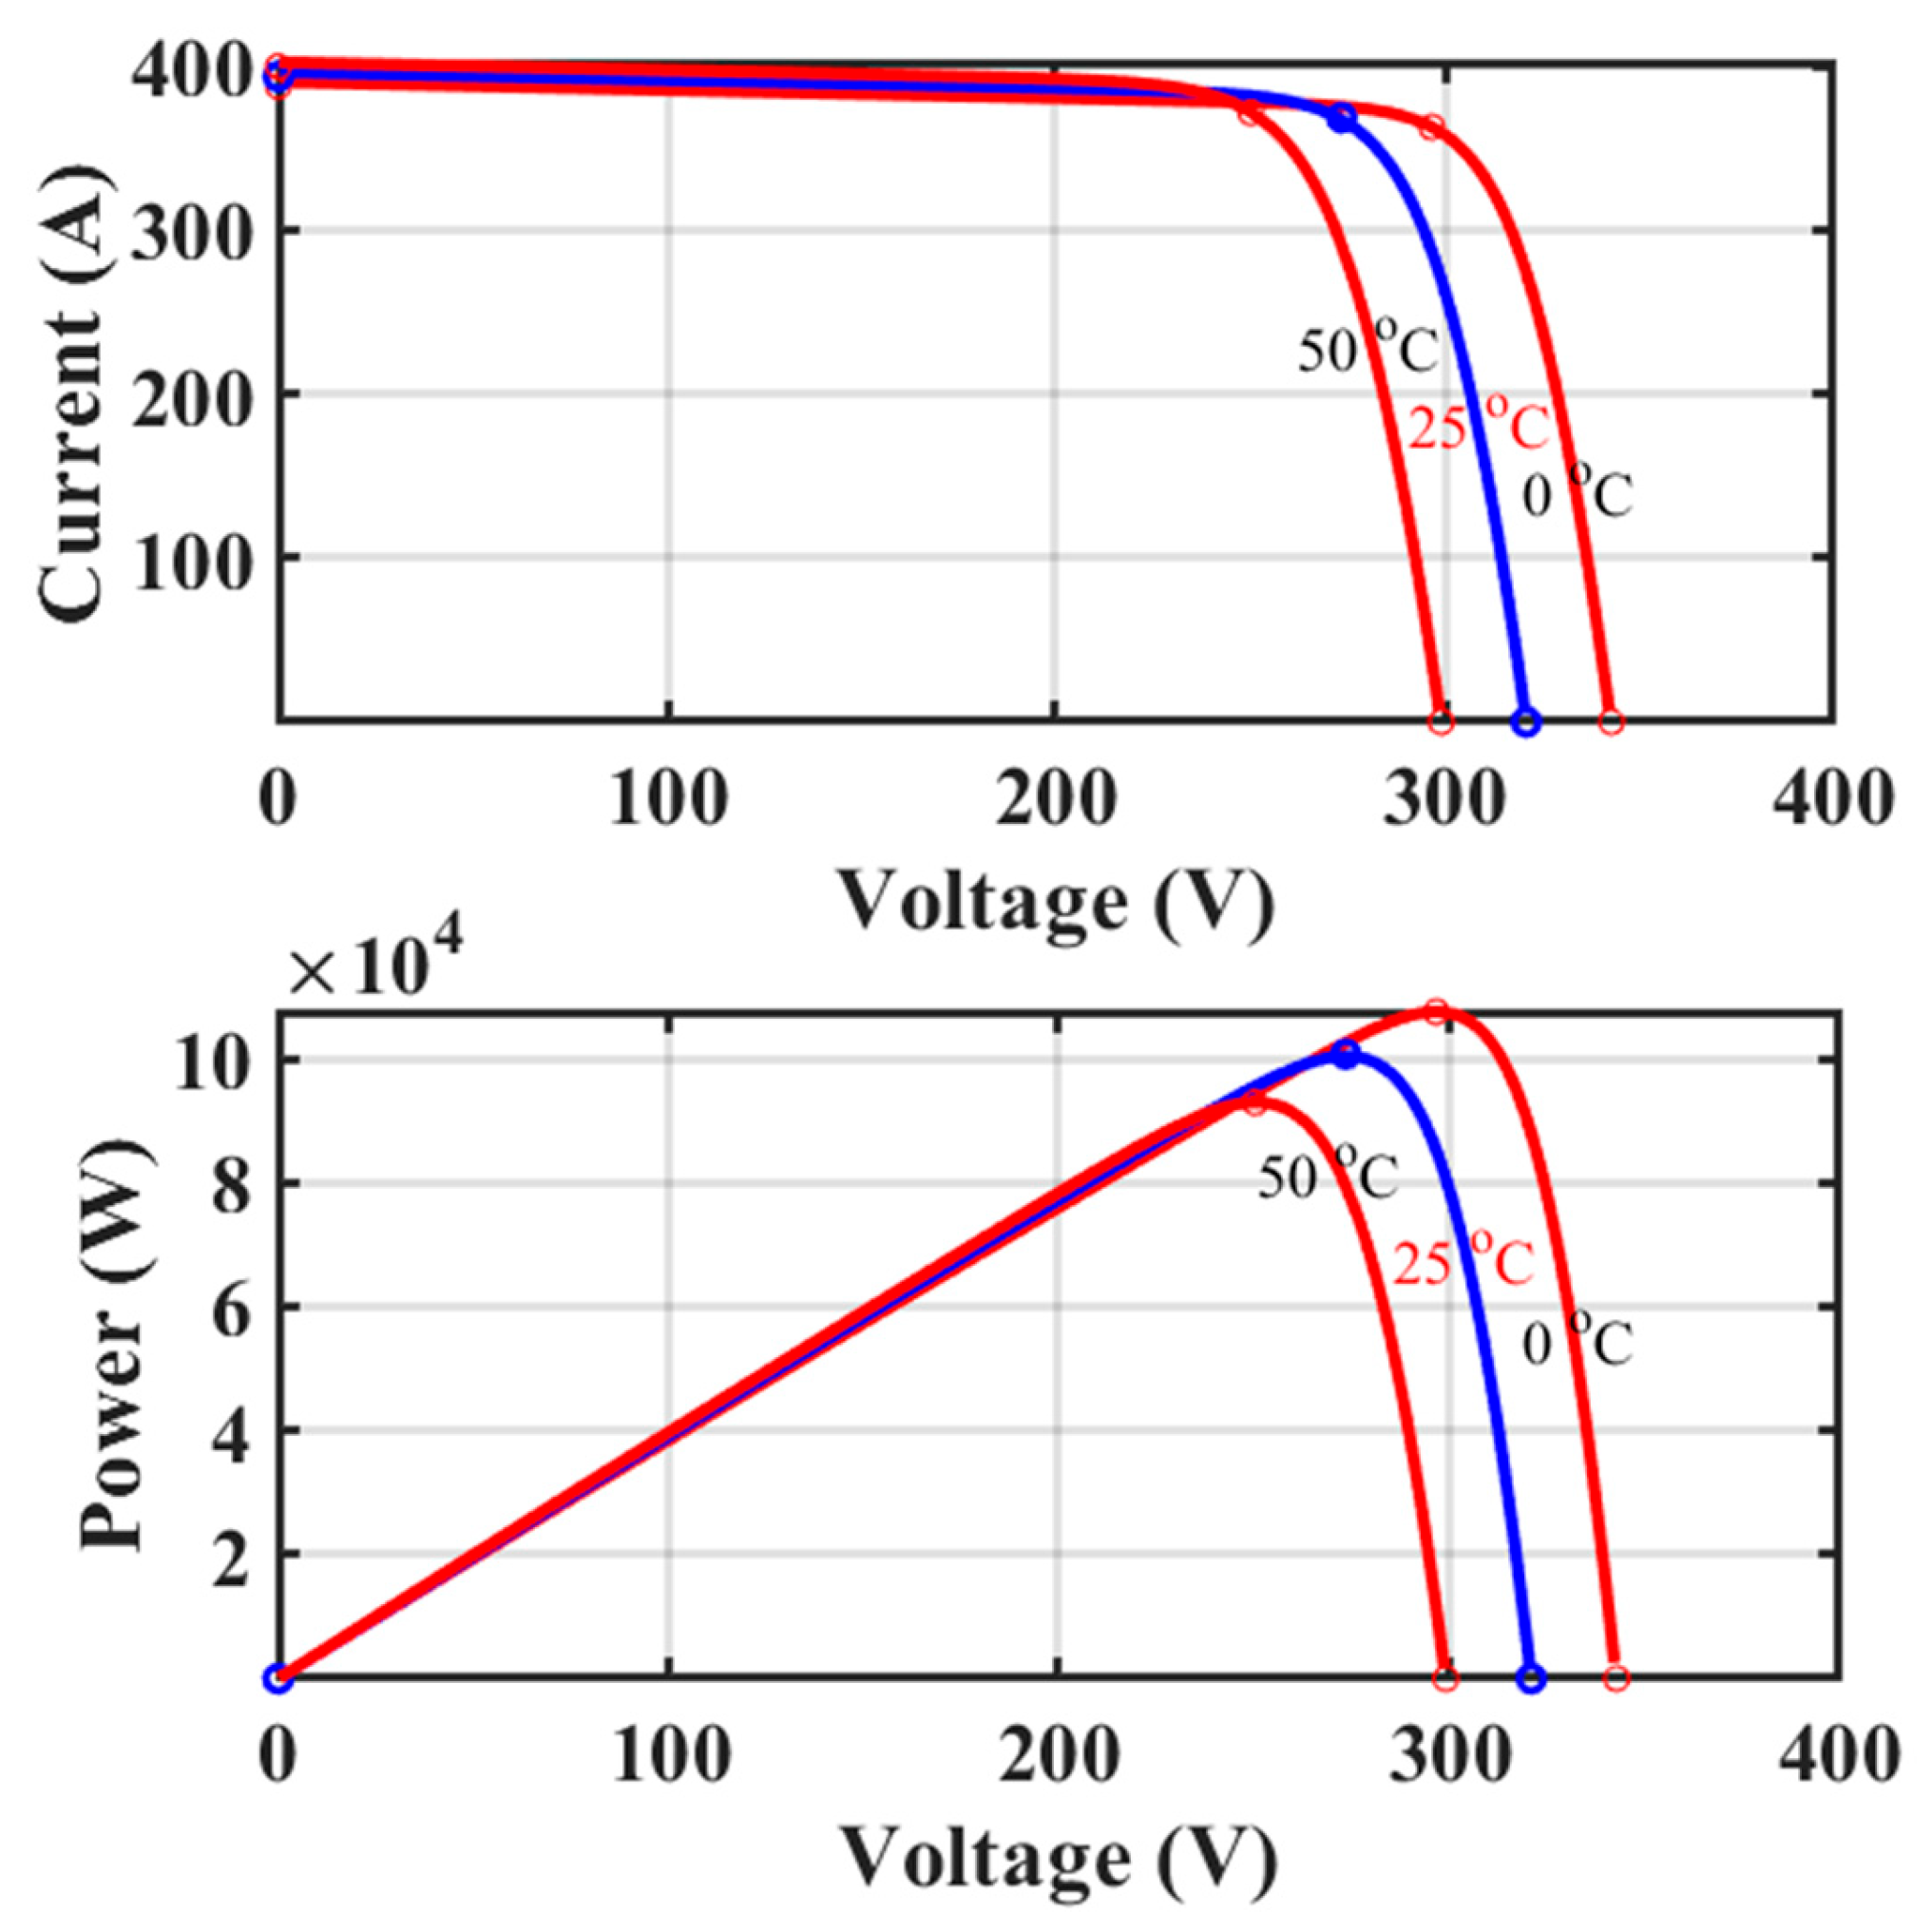
2.2.1. Modeling of PV

The PV model is fully described in Reference [36]. The next equations clarify the modeling and I-V physical characteristics of the PV [37]. The PV parameters are given in Table 4.
I = I L I O e q v + I R S n k T 1  
I L = I L T 1 1 + k o T T 1
I L T 1 = G I S C T 1 , n o m G n o m
k o = I S C T 2 I S C T 1 T 2 T 1
I O = I O ( T 1 ) T T 1 3 n e q v g n k 1 T 1 T 1
I O ( T 1 ) = I S C T 1 e q v o c T 1 n k T 1 1
R S = d v d I V O C 1 X V
X V = I O ( T 1 ) q n k T 1 e q v o c T 1 n k T 1
The PV’s power at any time (t) is determined as follows:
P P V t = S r t a η
P t t = N P V   P P V ( t )
where P t , and N P V are the total produced power, and the number of panels, respectively.

2.2.2. Modeling of Wind System (WS)

The WS model is fully described in References [38,39]. The following equations describe the modeling of the WS [40]. The WS parameters are given in Table 4.
V w i n d t = V b a s e + V r a m p + V g u s t + V n o i s
V r a m p = z e r o a t   t < T 1 R m a x R ( 1 ( t T 2 R ) / ( T 1 R T 2 R ) ) T 1 R t < T 2 R m a x R T 2 R t < T 2 R + T R
K e = 1 2 m V 2
P = 1 2 d m d t V 2
where mass flow rate can be expressed as:
d m d t = ρ A V
P = 1 2 ρ A V 3
P b = 1 2 ρ A V + V d 2 ( V 2 V 2 d )
K = V d v
P b = 1 2 ρ A V 3 ( 1 2 ( 1 + k ) ( 1 k 2 ) )
P w = 1 2 C p ( λ , β ) ρ A V 3
P t o t a l = P w N w i n d

2.2.3. FC model

The FC model is fully described in References [41,42]. The following equations describe the modeling of the FC [41,42]. The FC parameters are given in Table 4.
H 2 + O 2 H 2 O + 2 e
1 2 O 2 + 2 e O 2
H 2 + 1 2 O 2 H 2 O
The output voltage of SOFC is:
V S O F C = E V a c t V c o n V o h m
E = E O + R T 2 F ln P H 2 P 0.2 0.5 P H 2 O
I F C = I O ( e α 1 n f R T V a c t e α 2 n f R T V a c t )
V c o n = R T n f ln ( C b C )
V o h m = γ exp β 1 T 0 1 T I F C = r I F C

3. Control System and Application of HHA Algorithm

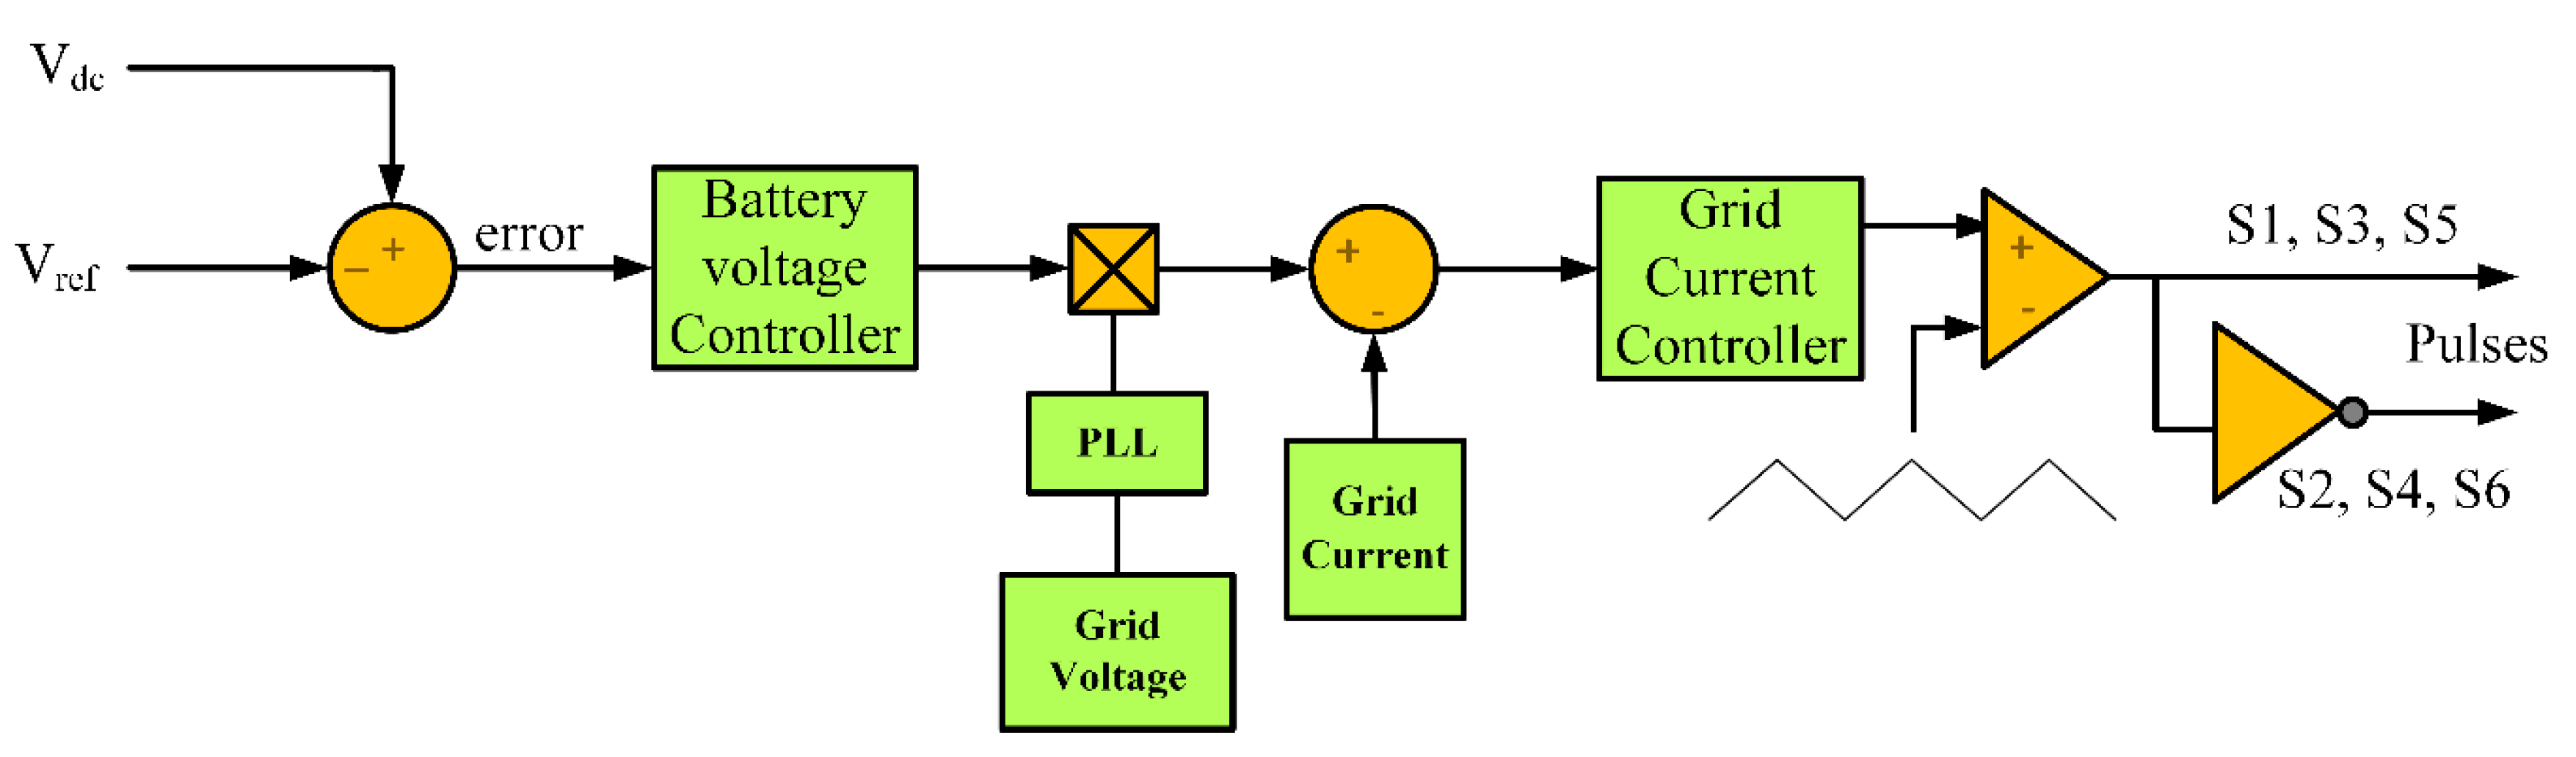
3.1. Detailed Control System
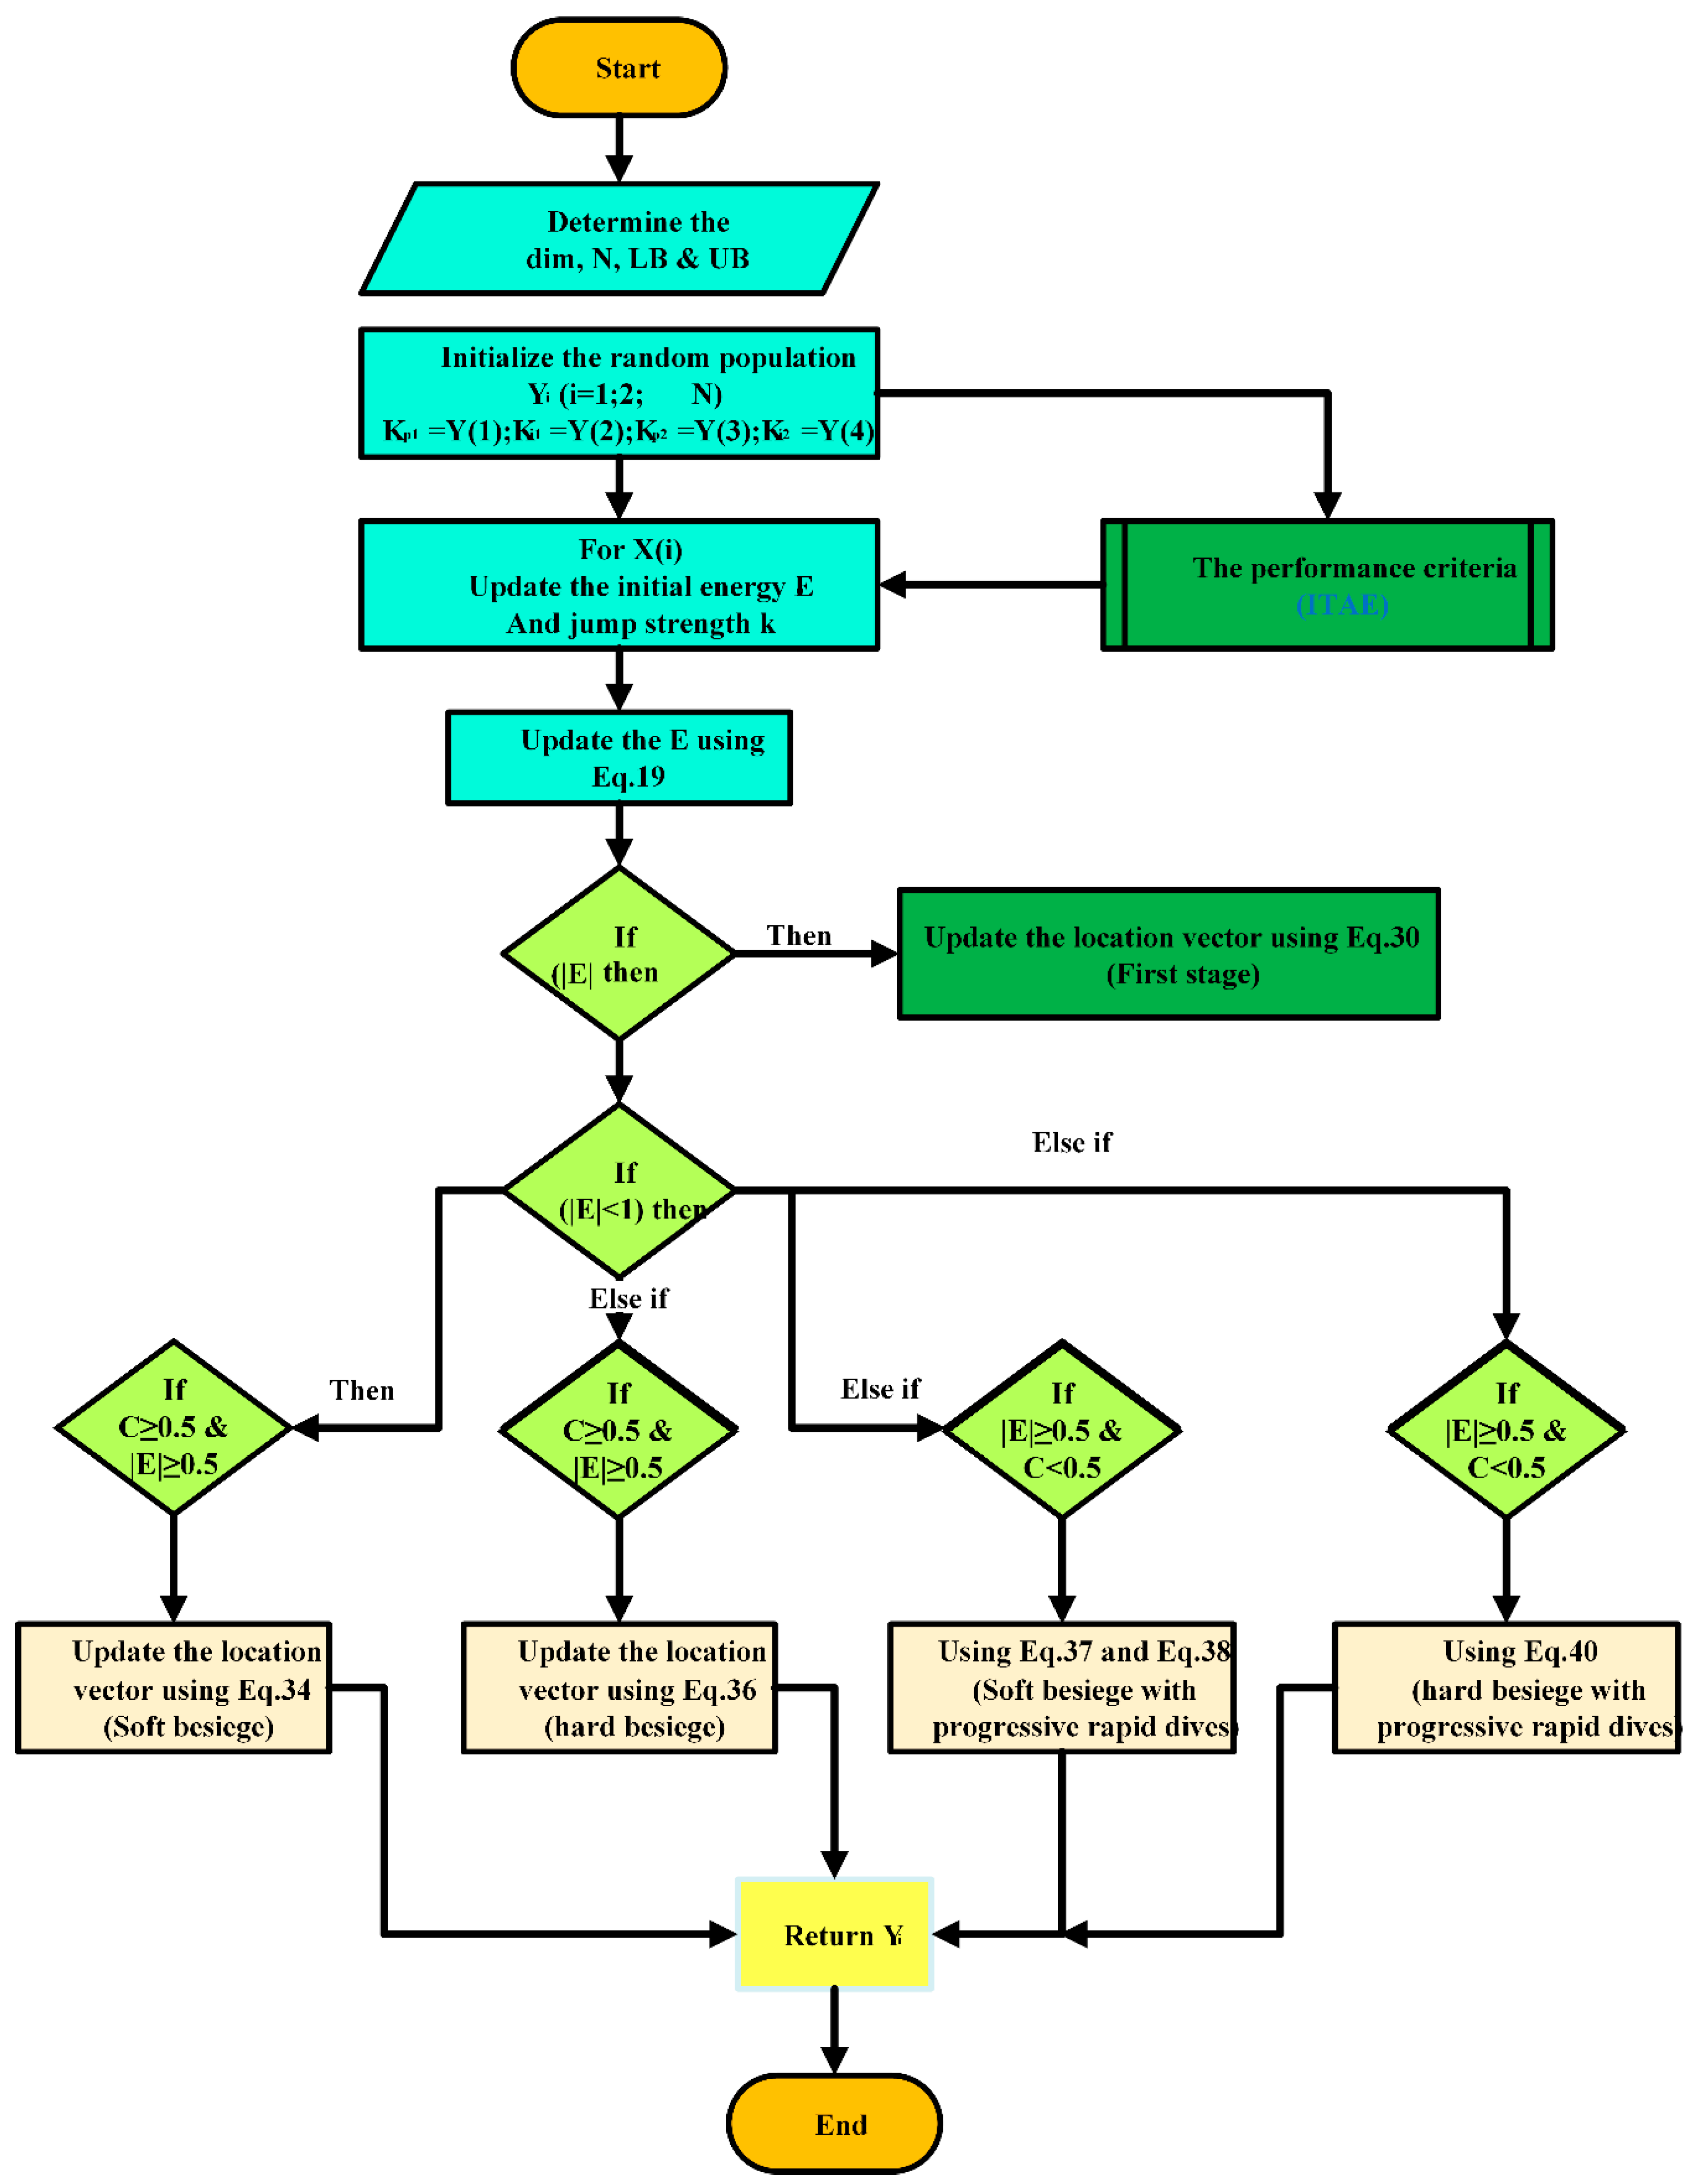
As shown in Figure 3, the investigated converter has four ports, of which three are input ports for PV, FCs, WS, and a bidirectional battery port. To achieve zero-voltage switching, the system has three major switches. The integrated sources are linked to the DC-link (DCL) via a unidirectional MS converter to maintain converter system stability in the face of load fluctuations. This strategy guarantees stability even in the face of load changes [43]. There is a one-way energy transfer from the CESs to the DCL. The converter under study can efficiently regulate the CESs to exploit the power produced by sunlight or the wind by utilizing a well-constructed MPPT technique. A bidirectional converter that is attached to the DCL functions as a regulator for feeding the battery. High charging efficiency is made possible by ensuring that the battery’s state of charge (SOC) stays near its standard value.
Figure 4 shows a condensed bidirectional control architecture. The modulation scheme uses a one-leg shoot-through method to diminish switching loss and insulated gate bipolar transistor (IGBT) conduction losses. The control technique, as shown in Figure 4, is designed to handle different load fluctuations efficiently.
Constructed on the DC-DC converter’s architecture and the corresponding circuit variables, different MPPT techniques have been used [44]. Entry capacitance ( C P V ) is detected before the panel voltage ( V P V ) and current ( I P V ). The MPPT method makes use of these two parameters to monitor the MPP in a variety of temperature and irradiance situations. As shown in Figure 5, the referring point for the panel data is determined and kept at the MPP value.
The outer voltage loop and inner current loop are used to achieve MPPT, as given in Figure 3. The output voltage drops as the MS’s current standard is raised. The voltage desired compensator and voltage feedback (VF), as a result, have the wrong indications. The VF is intended to activate interior comparators that Jerry can cause a cycle-by-cycle interruption of the pulse-width modulation (PWM) all through an overvoltage circumstance to protect the output voltage from surpassing the item’s rating. Observing the ( V P V , I P V , and P P V ) will yield the I-V and P-V curves at various cell temperatures (CTs) and a constant irradiation level (CIL), as shown in Figure 5.
This study focuses on incorporating a backup battery, where it is connected to a DCL via a bidirectional power converter (BPC), to improve power management. According to Figure 6, the BPC comprises an output filtering capacitor Cdc, two switches (S1 and S2) that allow current to flow in both directions, a boost inductor with inductance L, and a boost inductor. Two control blocks are used in the power management strategy to keep the voltage within predetermined bounds and produce the wanted energy flow under various circumstances. For the battery, these controllers produce the current reference. While the second control block controls battery charging, the first controller modifies the DCL’s voltage. It is crucial to keep the battery from experiencing a deep discharge. However, there is a constrained range of charging capacity when the battery hits a low-voltage level. When energy is recovered from the load side, this may result in over-voltage in the DCL. The lifespan of electrochemical batteries is influenced by the number of discharge cycles; hence, proper safety measures are required.
The system’s controller uses the perturb and observe (P&O) MPPT method to optimize the simultaneous usage of energy from PV, FCs, and WSs while taking into consideration a variety of meteorological conditions [45]. However, compared to solar radiation and temperature, wind speed frequently exhibits more severe variations. As made known in Figure 3, the MPPT controller practices the terminal voltage and current from each CES as input to produce the proper PWM control signal for the matching active switch. Figure 7 shows a flowchart that depicts the P&O method. Each step (kth step) takes into account the power (Ps(k)) of each source. For example, to calculate the PV’s potential for producing electricity, weather information is used. To allocate energy flow between the battery and the load, the P P V is likened to the power used up by the load ( P L ). Any extra PV energy is transferred through a bidirectional DC-DC converter and stored in the batteries ( P b a t t e r y ). Figure 7 shows a flowchart for the control method for the PV/FC/WS CESs.

3.2. HHA Algorithm

Heuristic algorithms have been utilized to augment the PI gains. The HHA emulates the supportive actions observed in the HH’s efficacious hunt strategy. Similar to other algorithms, it incorporates both exploration and exploitation phases. The HHA comprises two exploration phases and four exploitation steps, as outlined in the equations below. Additionally, the mathematical representation of this cooperative behavior proposes a new stochastic strategy for solving various optimization problems. The stages employed by HHs in hunting their rabbits are simulated and replicated in the HHA mathematical model. This study specifically employs the HHA due to its superior performance compared to 11 other approaches when tested against 29 diverse benchmark problems and 6 limited design engineering tasks. The equations presented here depict the behavior of HHs while they are in the vicinity of rabbits, and the complete concept of the HHA is elaborated in Reference [45]. The implementation of the suggested HHA on the control system is illustrated in the flow chart depicted in Figure 8.
Exploration phase:
Y t + 1 = Y r a b i t t Y m t C 3 L B + C 4 U B L B , q < 0.5 Y r a n d o m t C 1 Y r a n d o m t 2 C 2 Y t , q 0.5
Y m t = 1 N i = 1 N Y i t
The transition from exploration to exploitation:
E = E O 1 t T
Exploitation phase:
Soft besiege, C 1 2   a n d   E 1 2
Y t + 1 = Y t E q Y r a b i t t Y t
where,
Y t = Y r a b i t t Y t
Hard besiege, C 1 2   a n d   E < 1 2
Y t + 1 = Y r a b i t t E Y t
Soft besiege with progressive rapid dives, C < 1 2   a n d   E 1 2 [22]
H = Y r a b i t t E q Y r a b i t t Y t
G = H + 0.01   S   u   σ γ 1 β
where,
σ = Γ 1 + β sin ( π β 2 ) Γ 1 + β 2 β   2 ( β 1 2 ) 1 β
Hard besiege with progressive rapid dives, C < 1 2   a n d   E < 1 2
Y t + 1 = H   i f   F H < F ( Y ( t ) ) G   i f   F G < F ( Y ( t ) )
To select the finest PI parameters, the HHA is applied here. The objective function “only if” is by Equation (40) to lessen the integral time absolute error (ITAE). The selected PI gains for the investigated choices are shown in Table 5.
I T A E d \ q = 0 t e v l d \ v l q d t

4. Discussion of Simulation Results

The proposed converter was validated using thorough simulation models created in a Simulink/MATLAB program. With the aid of batteries and FCs, these versions offer an alternate emergency power source. In the simulation model, an energy management (EM) system was present that was appropriate for a variety of CESs. The HHA was designed and implemented to enhance the systems’ dynamic performance through fine-tuning the controllers’ gains. Table 6 contains a list of the proposed system’s parameters. Table 4 lists the parameters and practical details of the studied PV, WS, and FC.

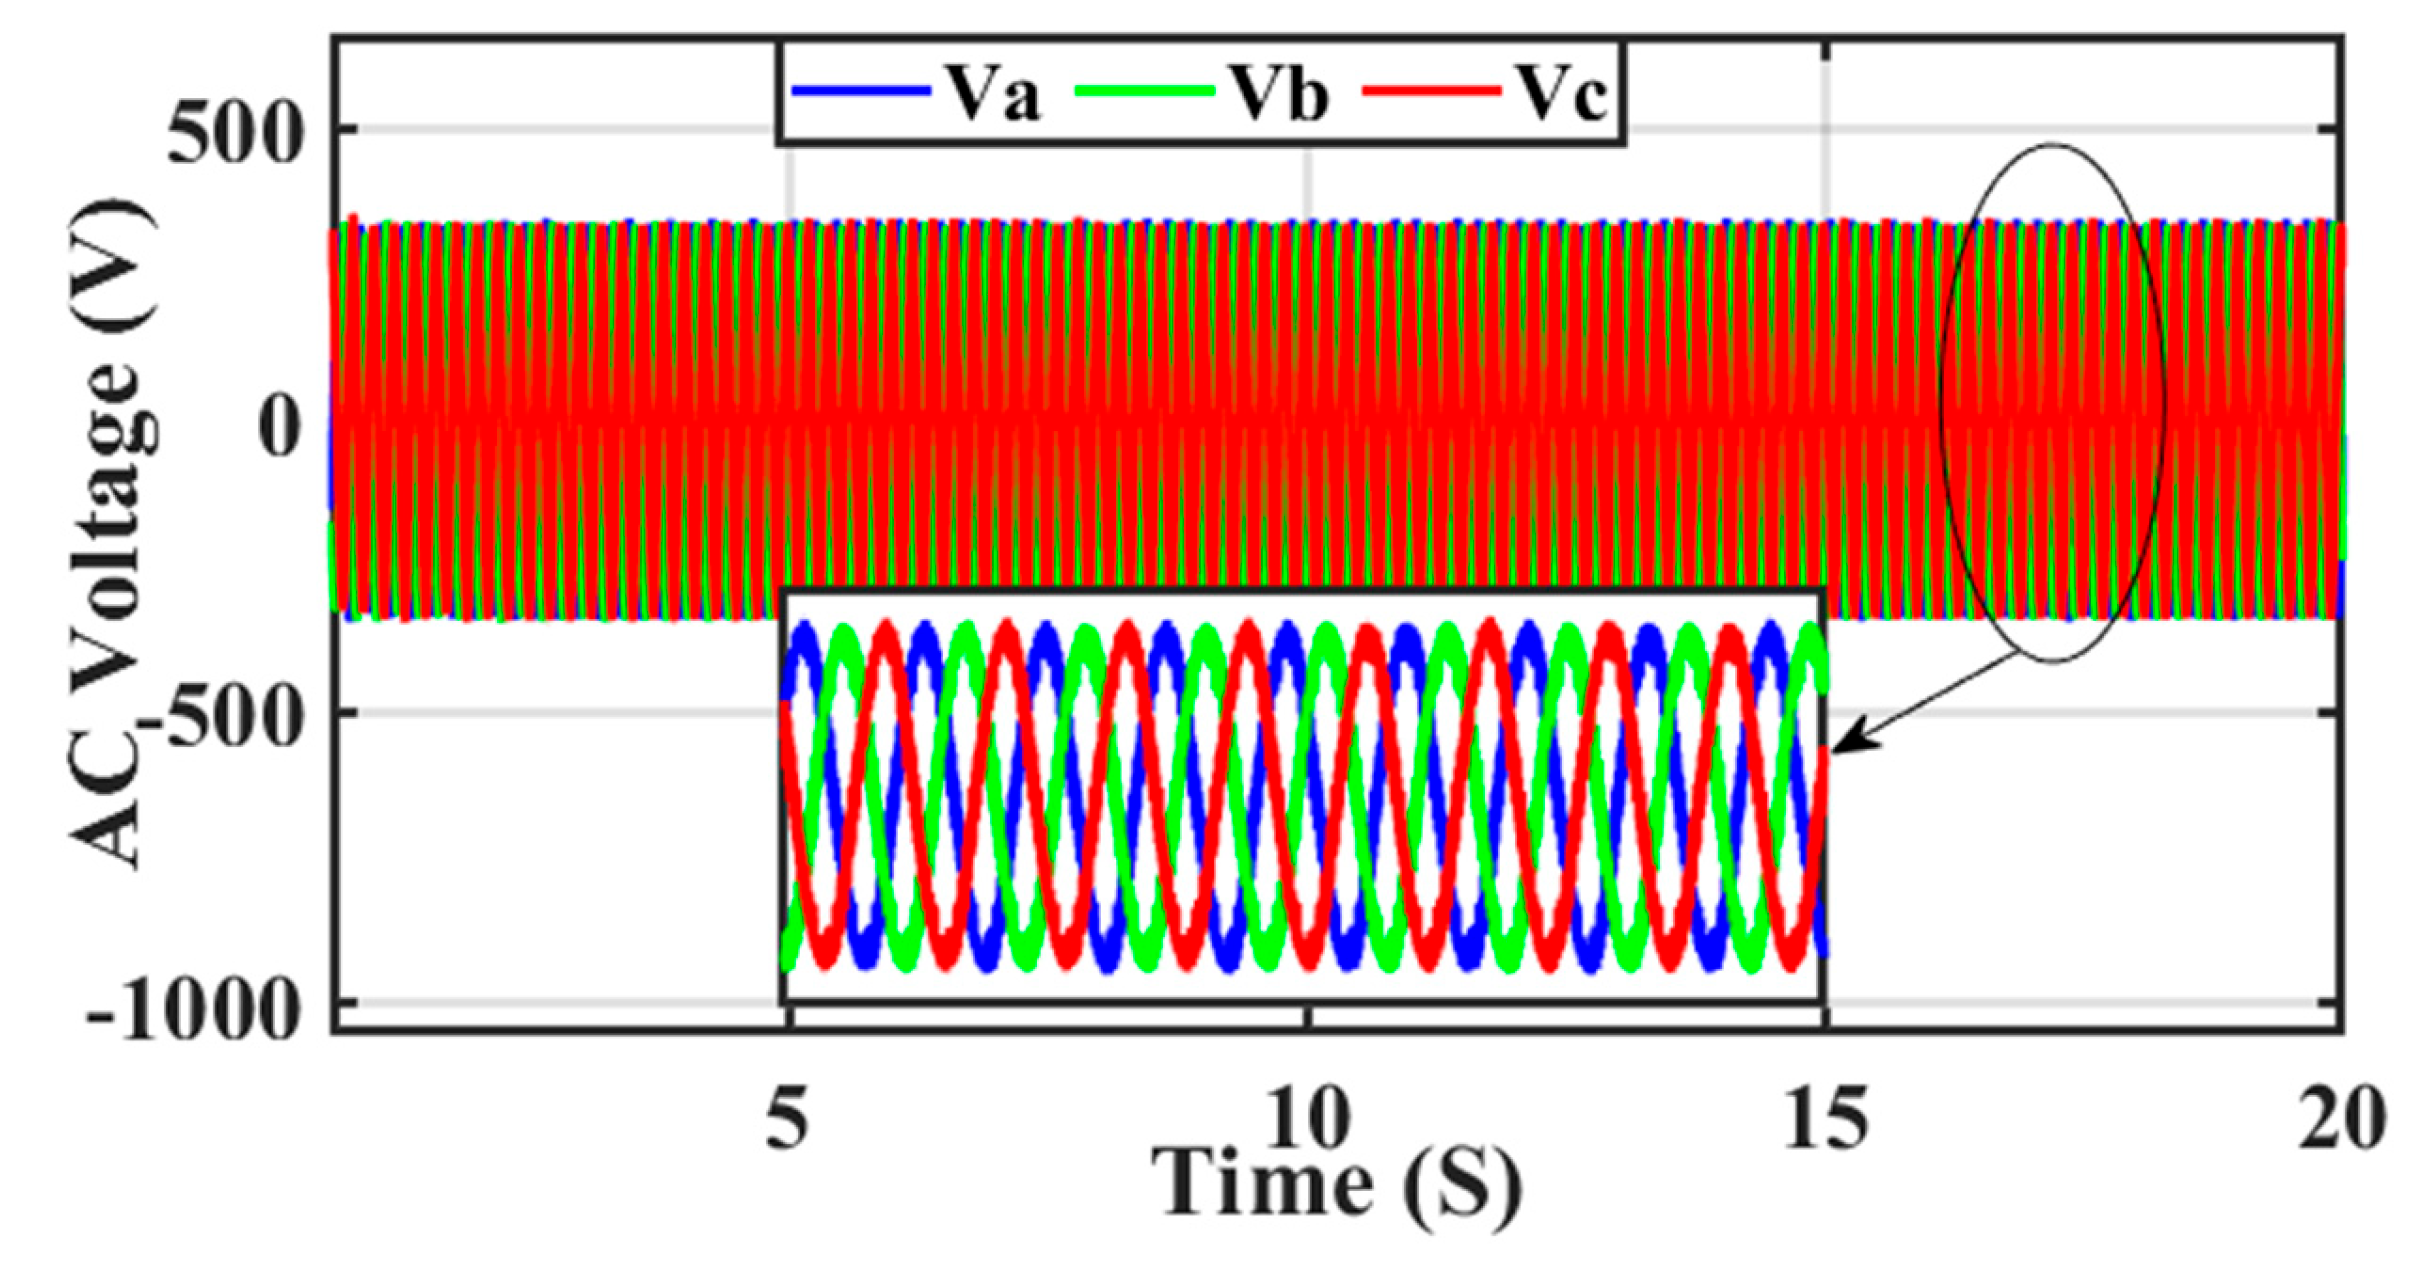
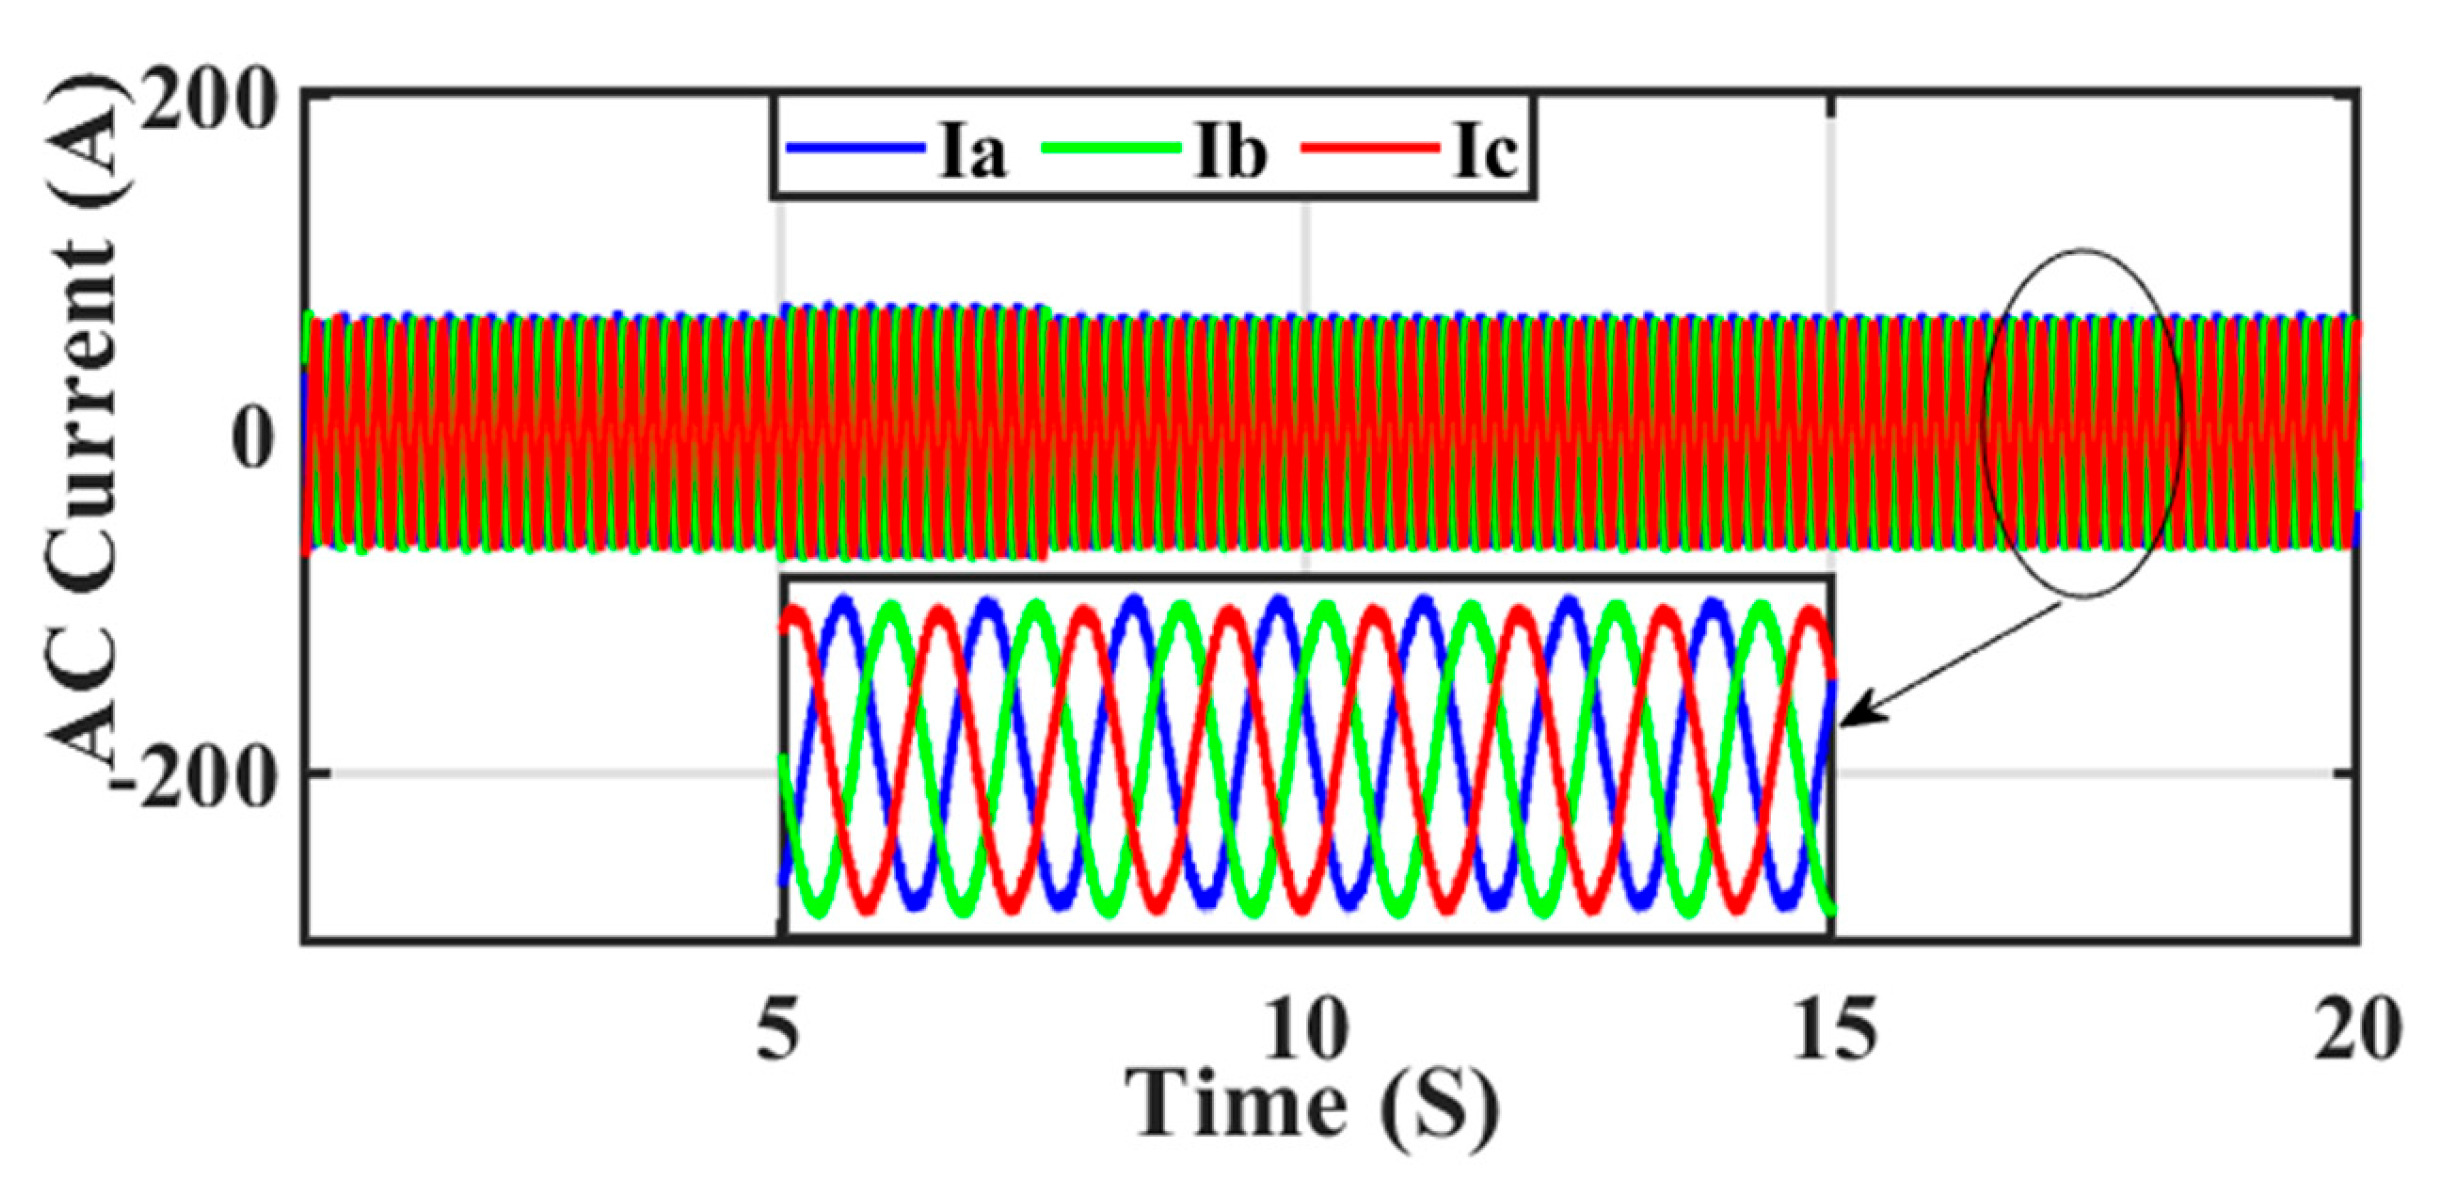
4.1. Inverter Output

As shown in Figure 9 and Figure 10, the AC inverter used an AC filter type (LCL) to supply sinusoidal three-phase currents (Is) and voltages (Vs). We can see that the V’s output was stable over time around a constant value of roughly 300 V by looking at the plot of the V’s output. The plot of I’s output, which was around a constant value of roughly 80 A, also shed light on the dynamic nature of the power supply from the inverter. It enabled us to keep an eye on the I flow to the associated loads and the grid to make sure it stayed within the required range and satisfied system requirements. Analyzing the inverter’s output V&I was used to evaluate the effectiveness and overall dependability of the power conversion process. It aided in spotting any irregularities or deviations that can call for corrective action to guarantee the system’s optimal performance.

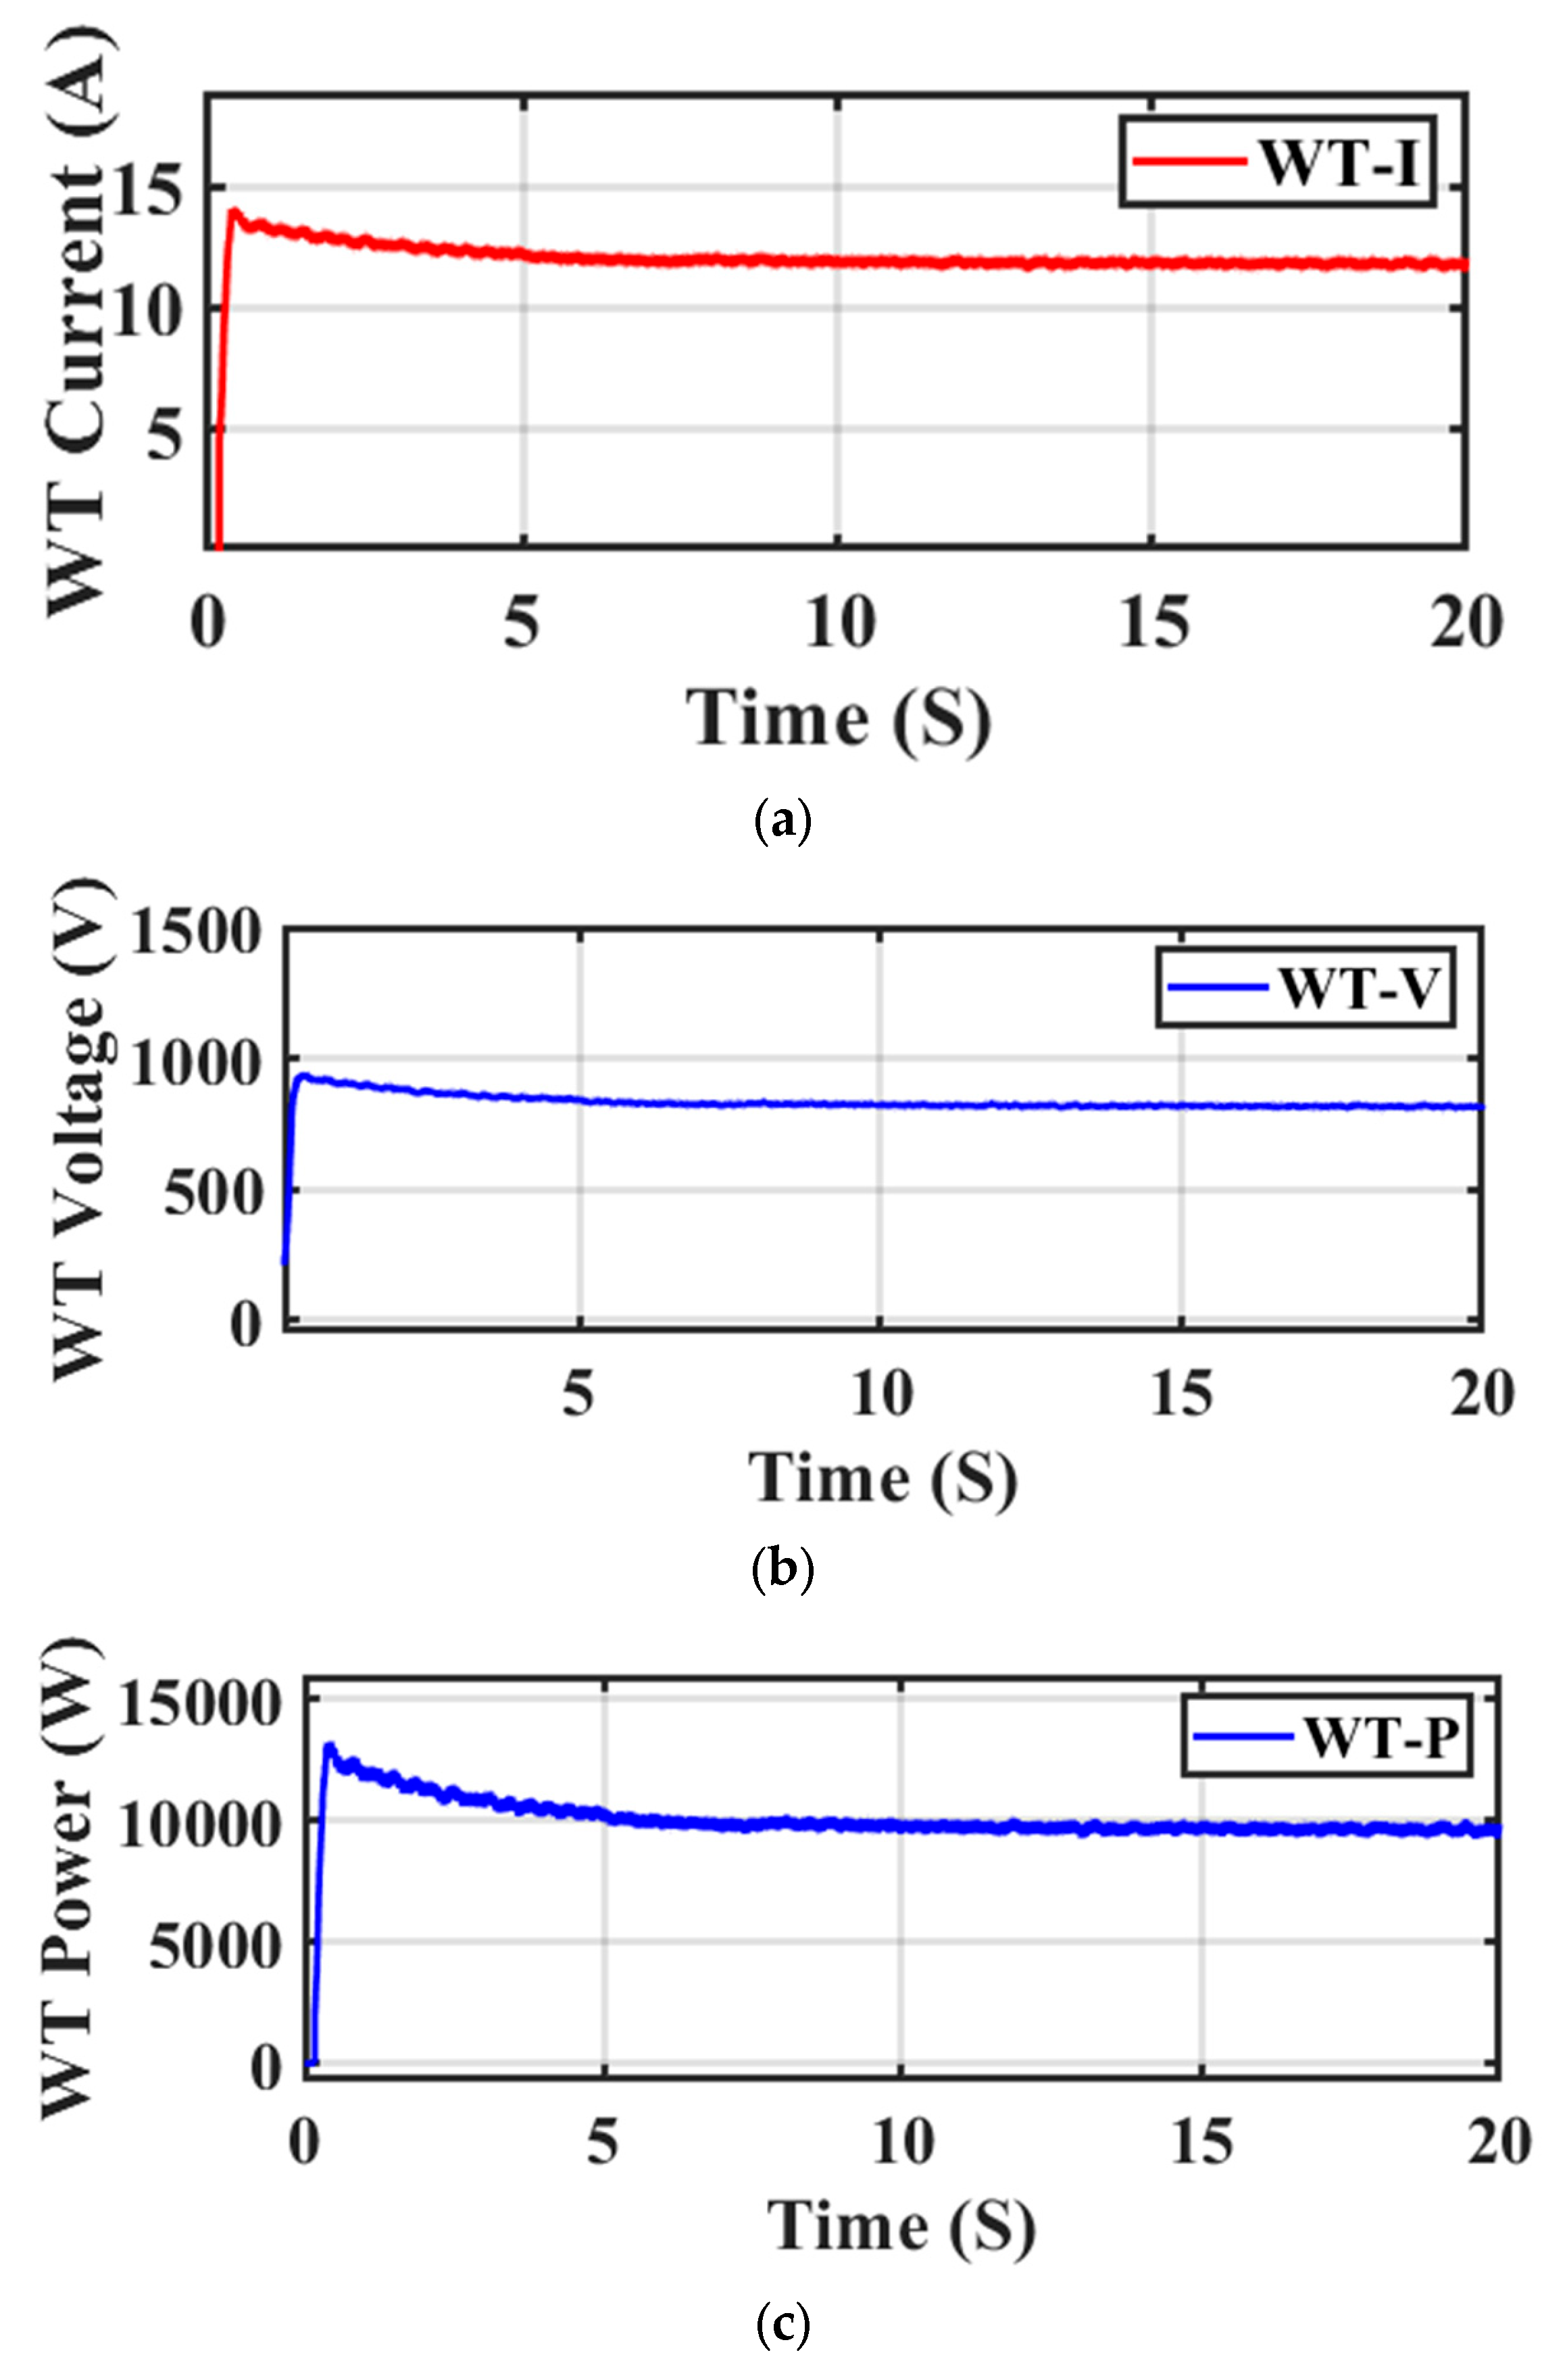
4.2. Wind Turbine (WT) Output
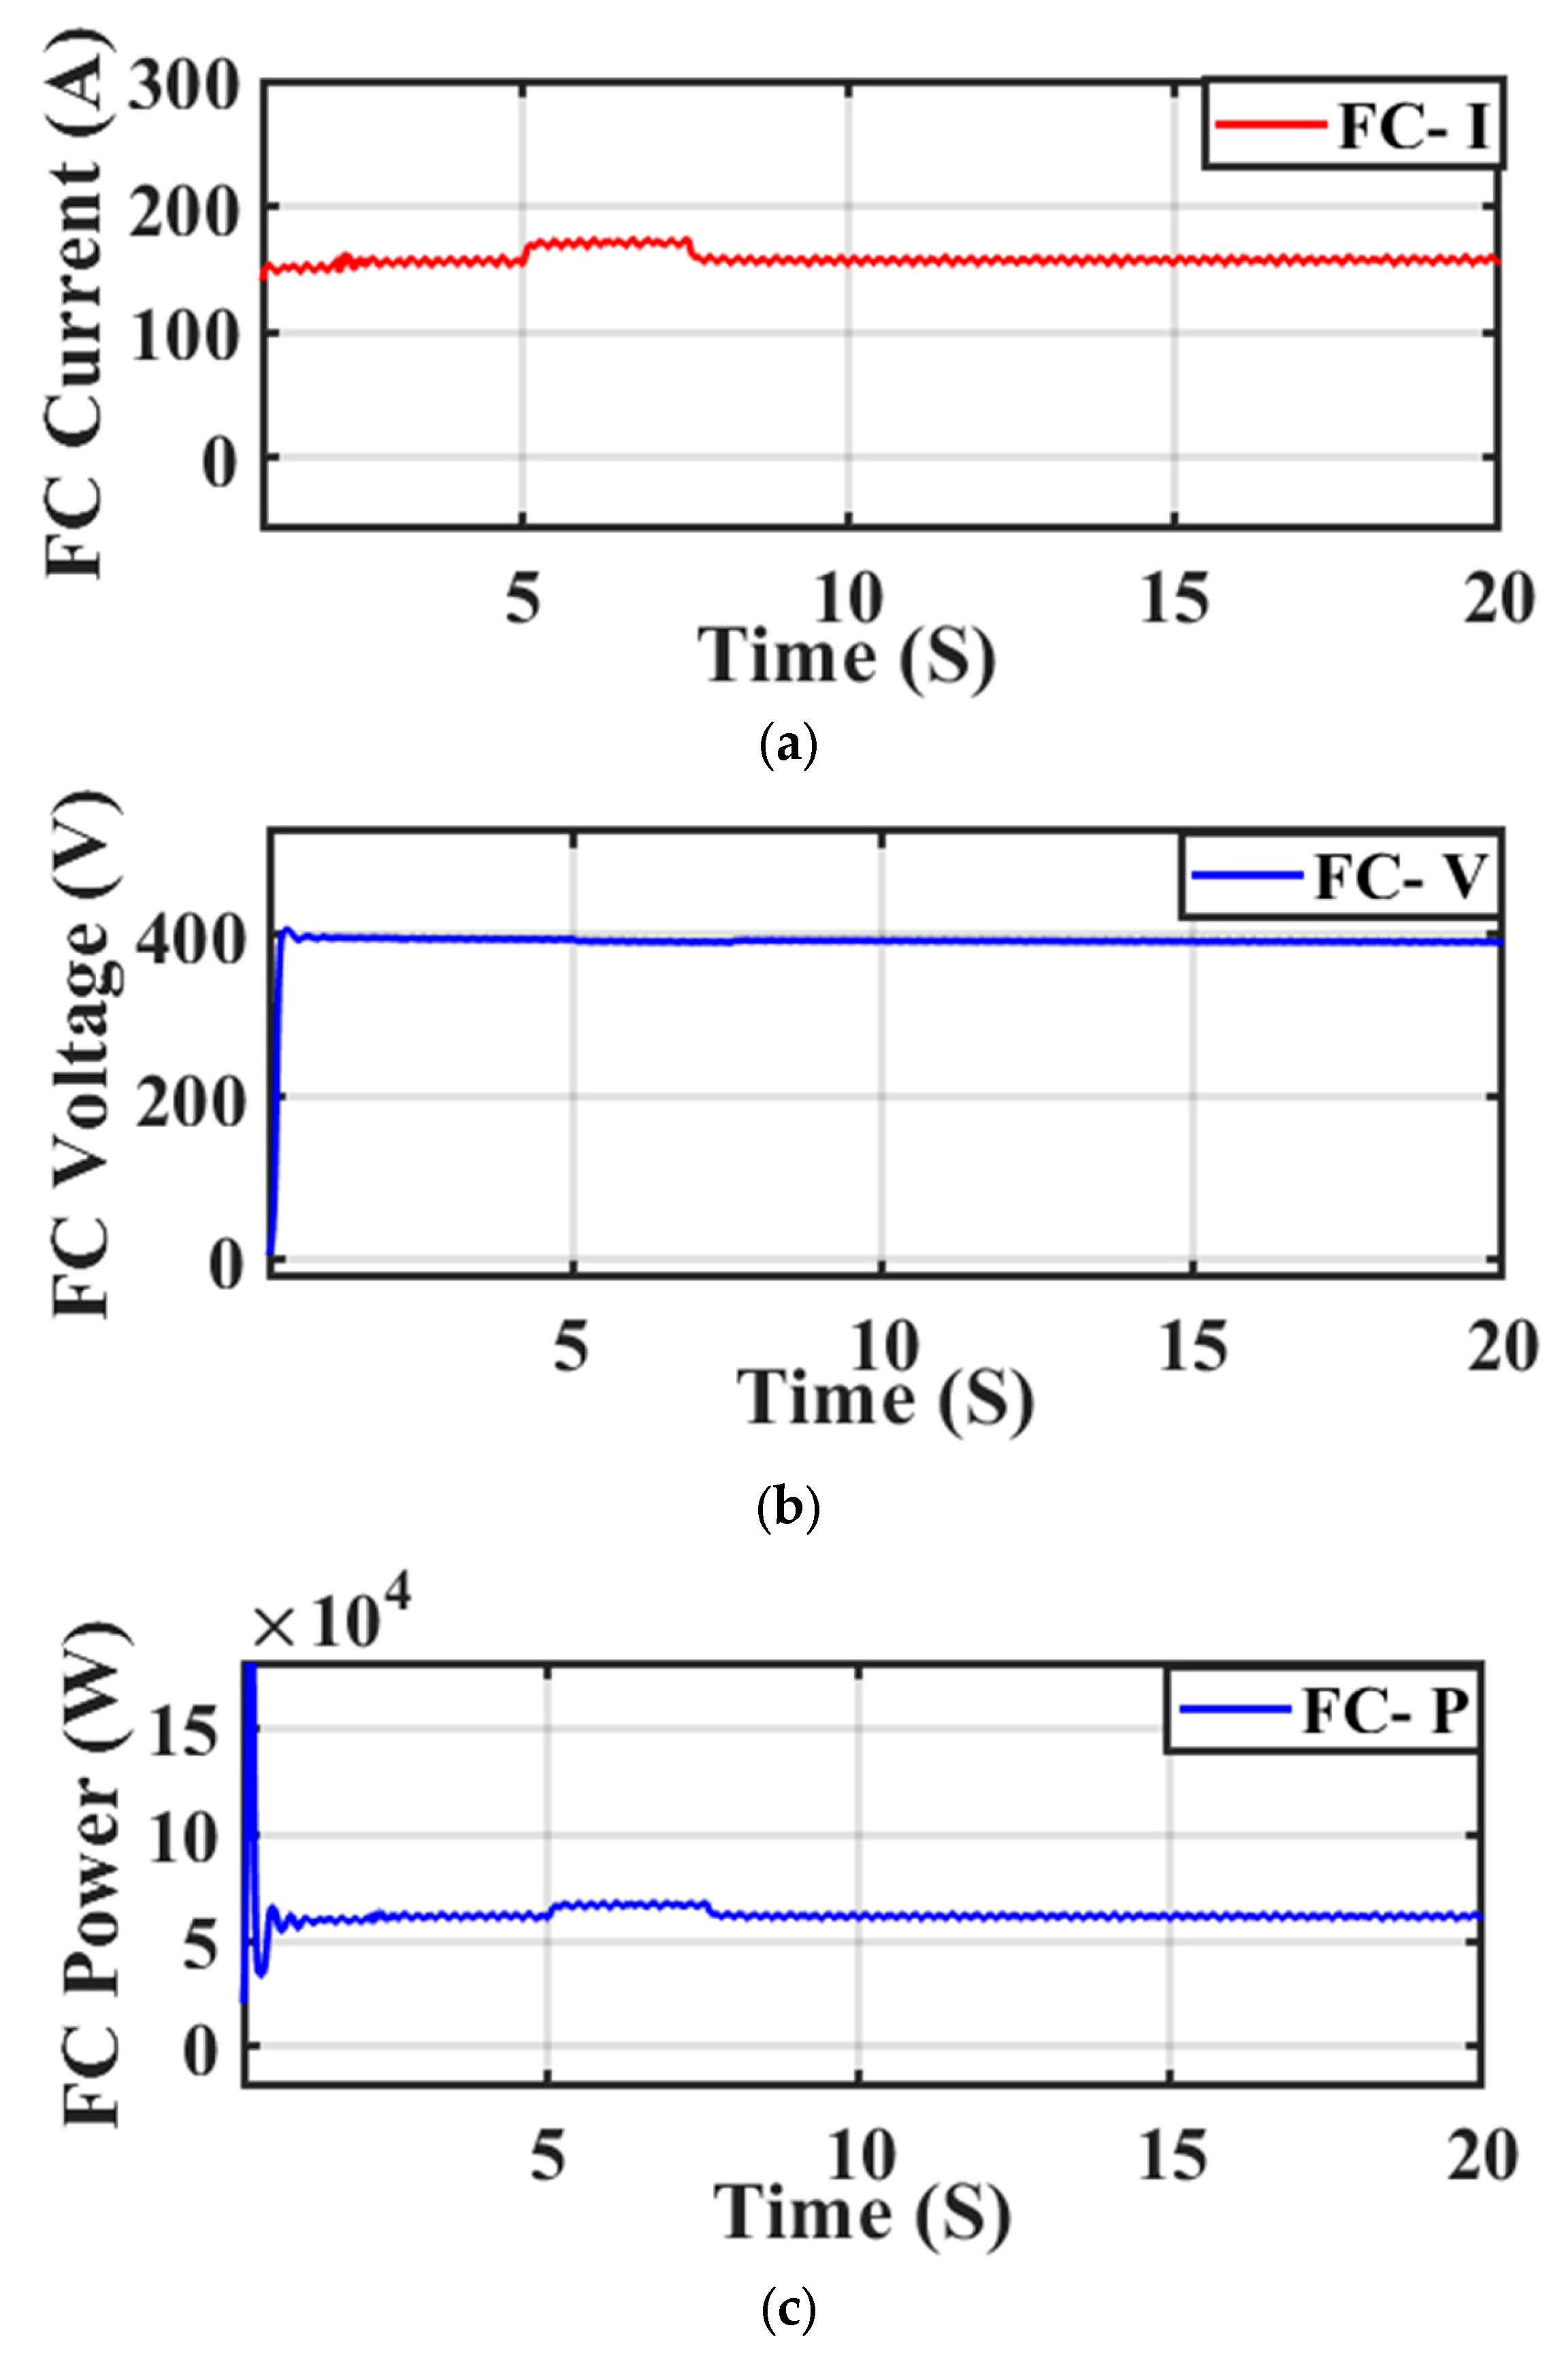
The (I, V, and P) output of a WT are given in Figure 11. It offers insightful information about the electrical behavior and operation of the WT system. The plotted I illustrates the strength and variability of the electrical current generated by the WT. We may watch the variations in I’s output, which were influenced by things like wind speed, turbine rotor speed, and load conditions. Monitoring the current allows for an evaluation of the reliability and efficiency of the 12.5 A-rated electrical output of a WT. The electrical potential difference produced by the WT is shown on the plotted V. It reflects the V level at which the associated electrical system and grid received power from the WT, which reached 800 V. To assess the consistency and dependability of the WT’s power output, it is helpful to analyze the V’s characteristics. The plotted power gives a thorough picture of the electrical power production from the WT, which reached a value of 10 kW. It illustrates the connection between the amount of power produced and the WT’s operational parameters, such as wind and rotational speeds. The performance of the WT and its capacity to satisfy the system’s power requirements can be evaluated using the plotted power.

4.3. FC Output

The properties of an FC (I, V, and P) are depicted in Figure 12. It offers insightful information about the FC system’s electrical behavior and operation. The I’s produced by the FC, which reached a value of 150 A, is shown in the current plot in terms of its magnitude and fluctuation. It enabled us to keep an eye on I’s output fluctuations, which can be influenced by variables, including fuel availability, operational temperature, and load circumstances. Assessing the I allowed for an evaluation of the FC’s electrical generation’s effectiveness and stability. The electrical potential difference produced by the FC is seen on the V plot. It reflects the V level at which the linked electrical system or load received power from the FC and achieved a value of 400 VDC. For assessing the consistency and dependability of the FC’s power output, it is helpful to analyze the V characteristics. A thorough overview of the electrical power production at the FC is given by the power plot. It illustrates the connection between the amount of electricity produced and FC operating parameters like temperature and fuel flow rate. The FC’s performance and capacity to handle the system’s increasing power requirements of up to 60 kW can be evaluated.

4.4. PV and DCL Output

The (I, V, and P) outputs of a PV system are made known in Figure 13. It offers insightful information about the PV system’s electrical operation and performance. The amount of and variation in the electrical I produced by the PV system are shown in the I plot. It enabled us to keep an eye on the variations in I output, which can be impacted by elements like solar radiation, temperature, shading, and system setup. Monitoring the I allows one to evaluate the reliability and efficiency of the PV system’s 7.5 A-rated electrical output. The electrical potential difference produced by the PV system is shown on the V curve. It stands for the V level at which the PV system supplies energy to the associated load or electrical system. The V’s output of a PV system, which reached a value of 400 V, can be evaluated by looking at the V characteristics. The power plot gives a thorough picture of the electrical power production of the PV system. It illustrates the connection between the electricity produced and the PV system’s operational parameters, such as solar irradiance and temperature. The power plot makes it possible to evaluate how well the PV system is working and its capacity to supply the system’s 3 kW worth of power demands. Nevertheless, the DCL’s V&I waveforms are depicted in Figure 14 and reached values of 800 V and 110 A, respectively.

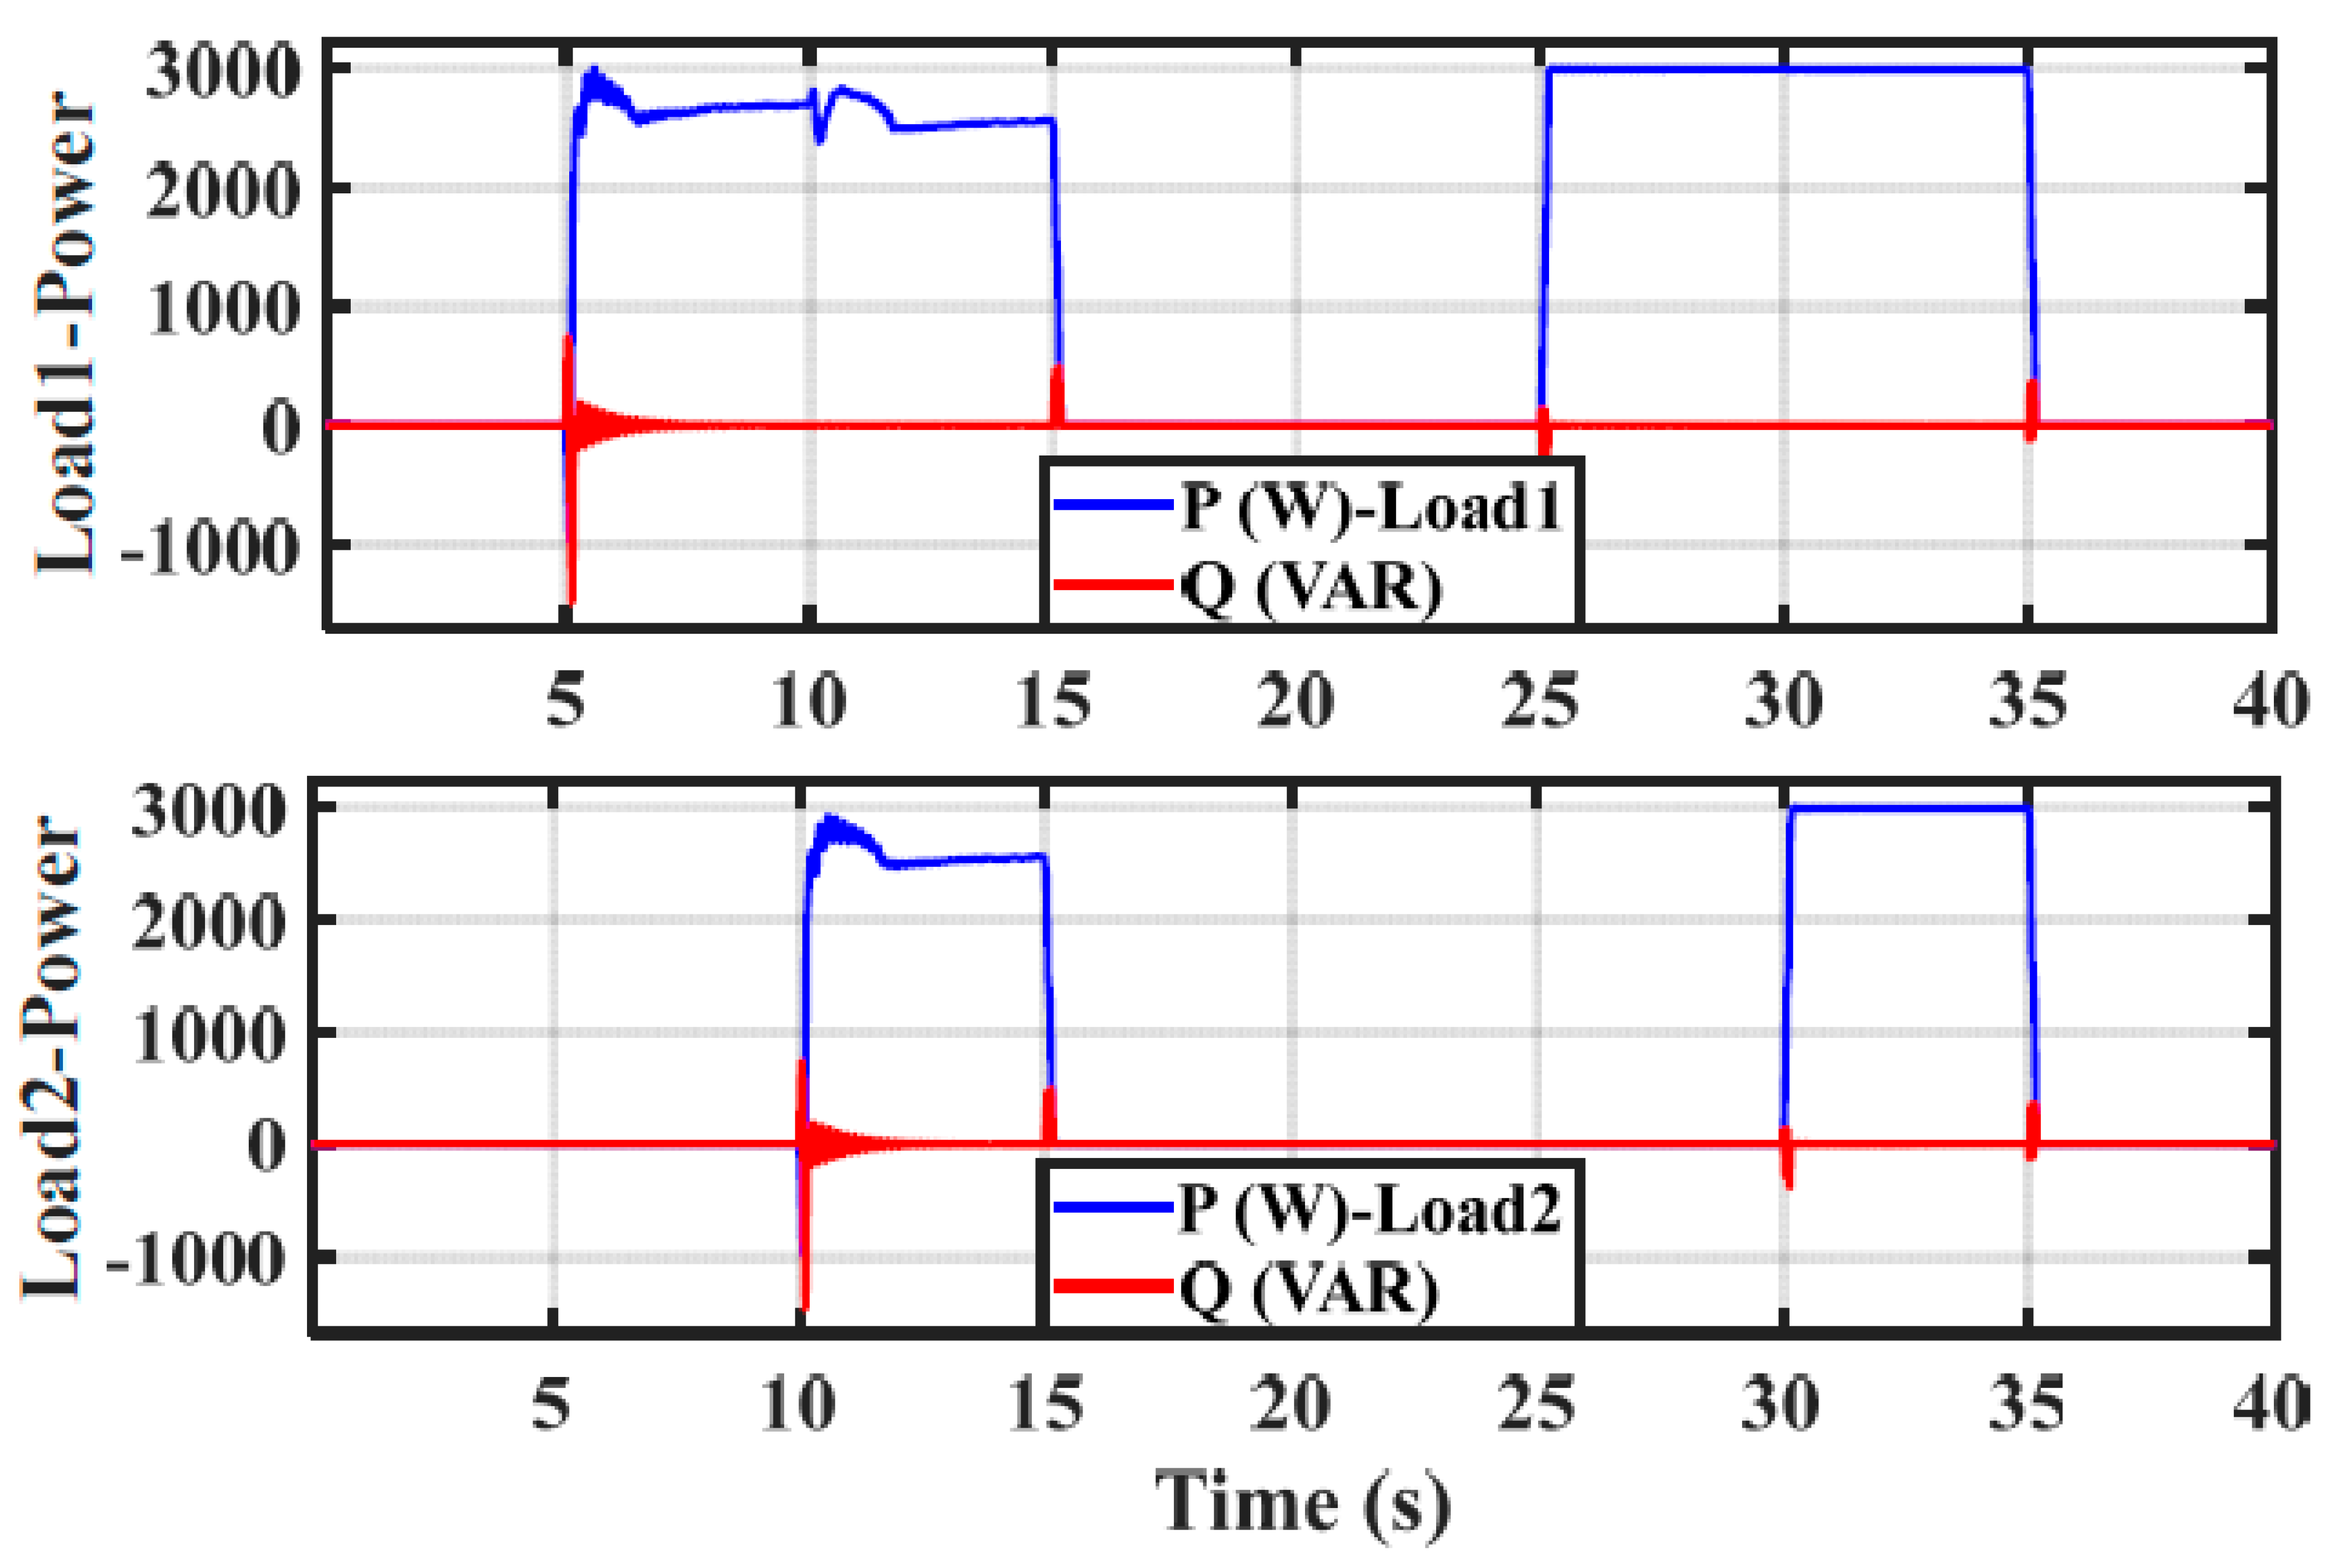
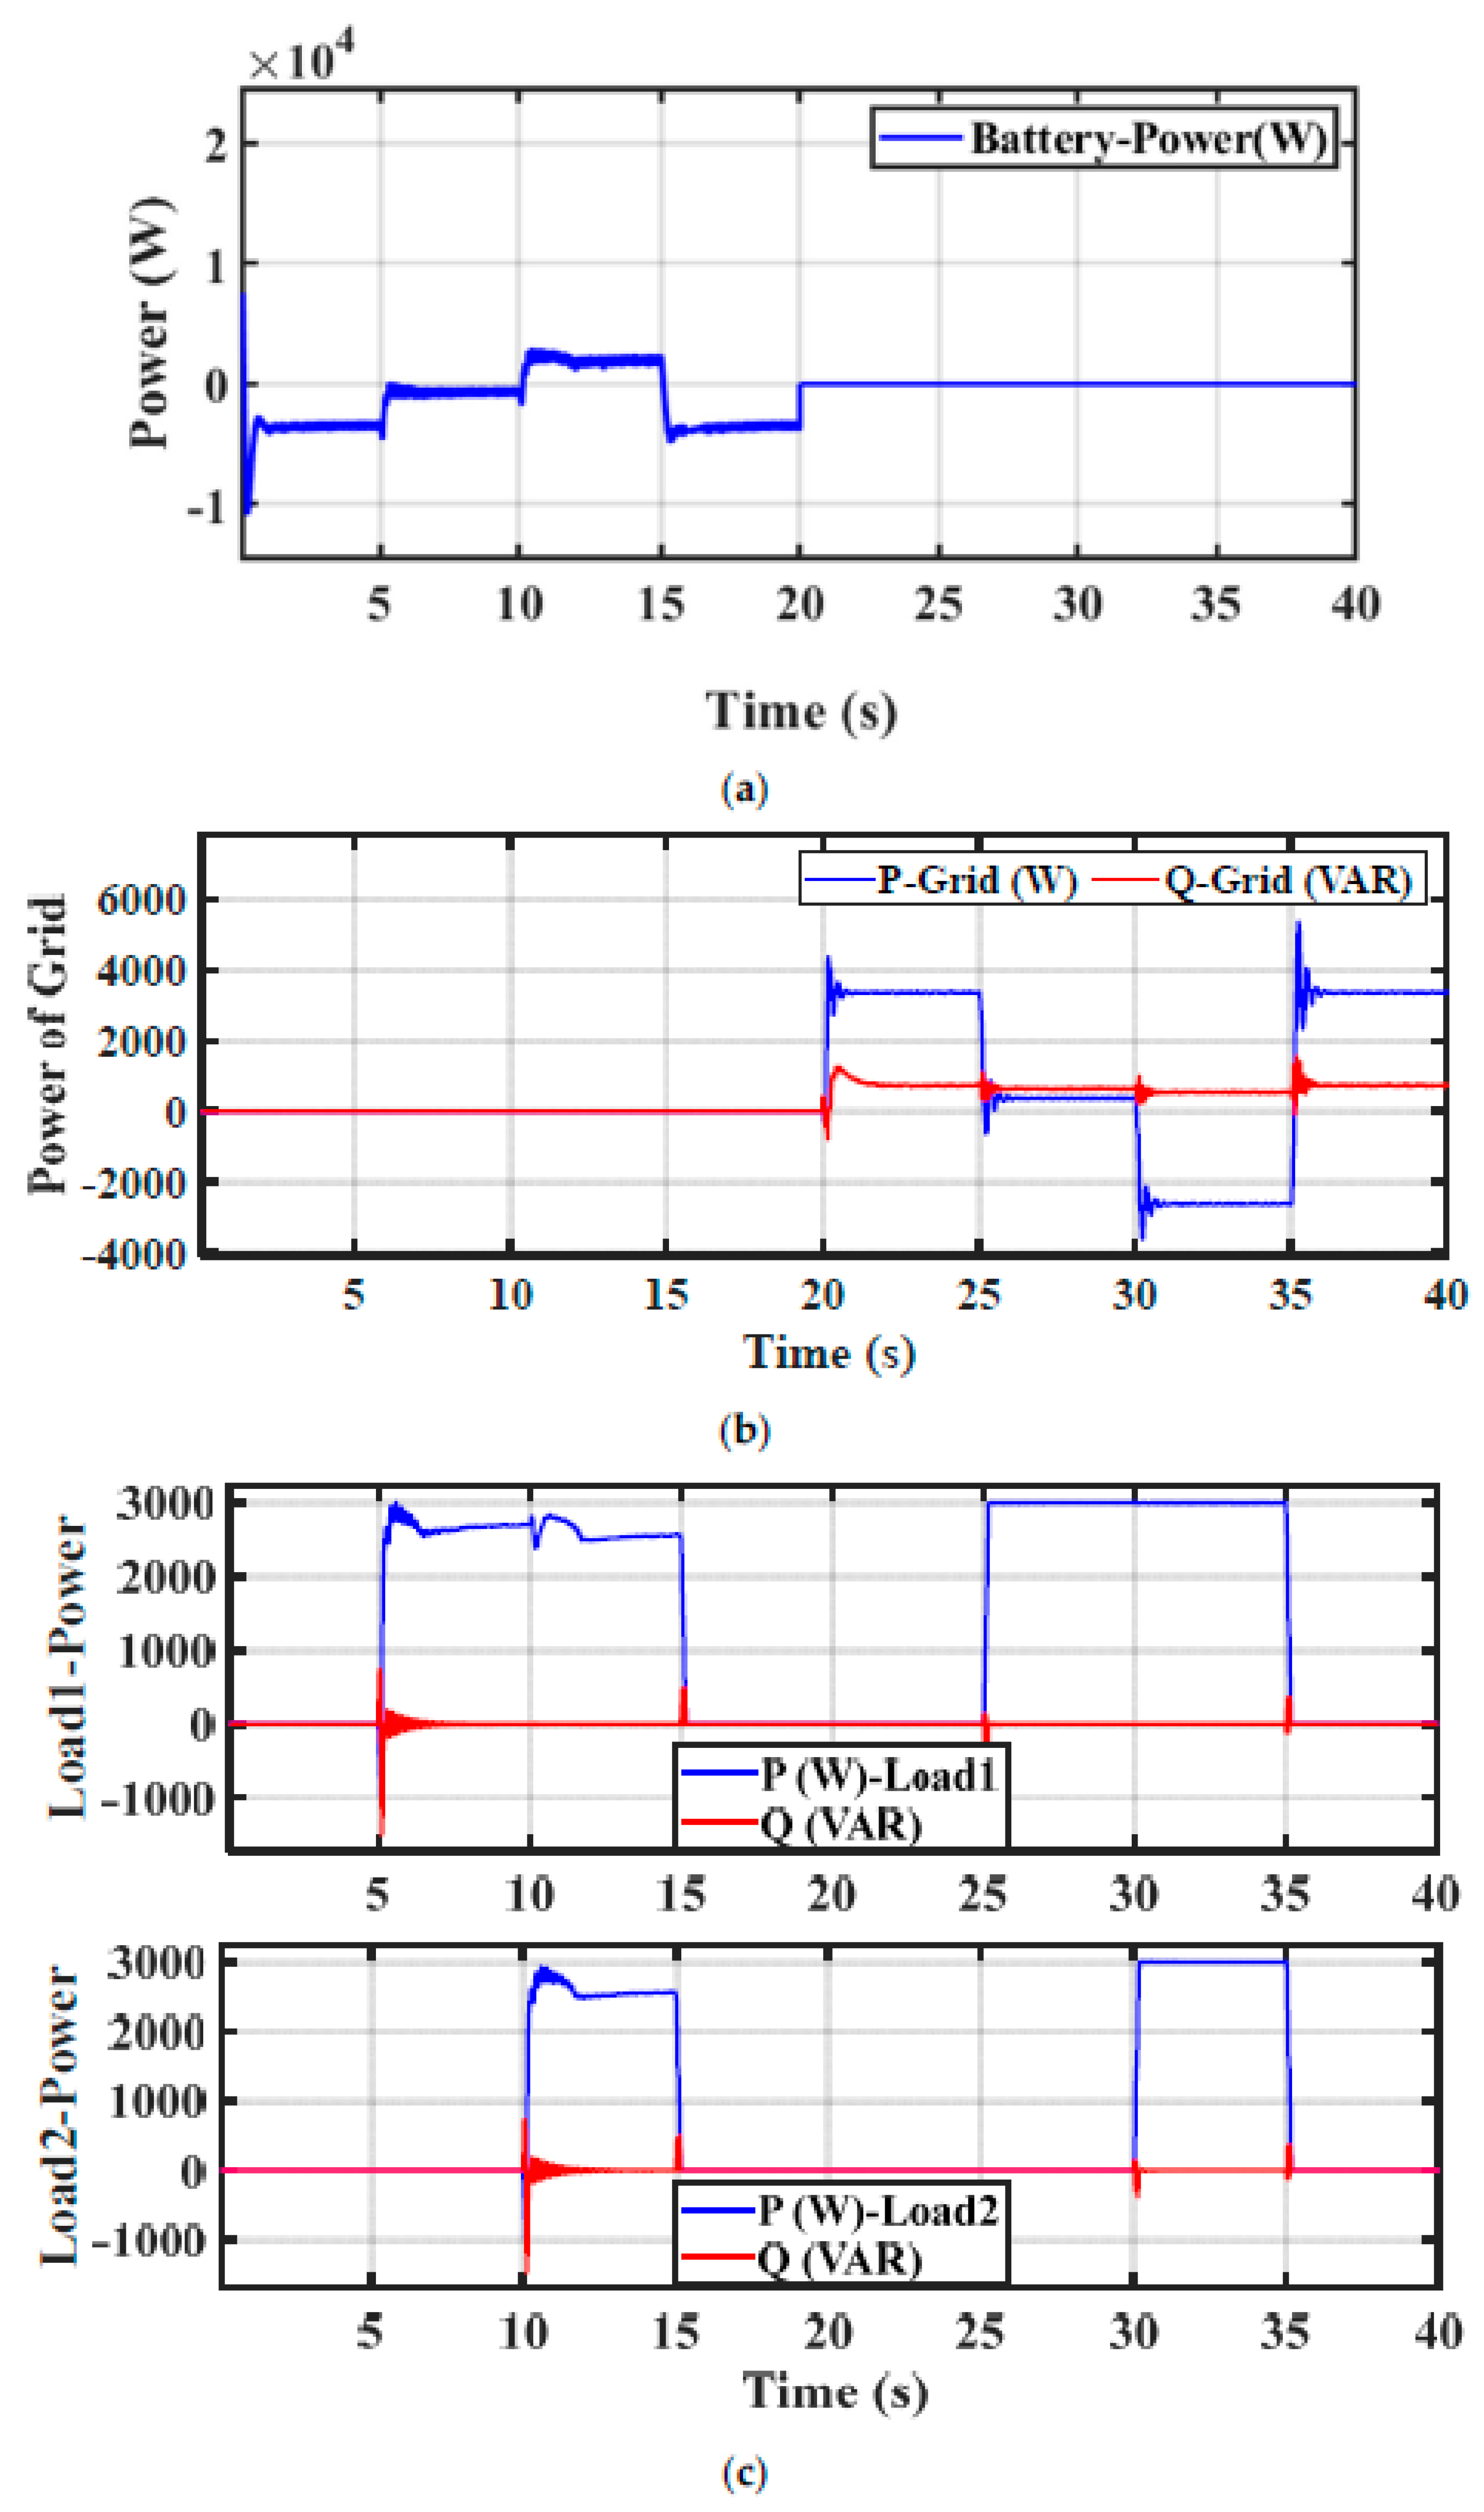
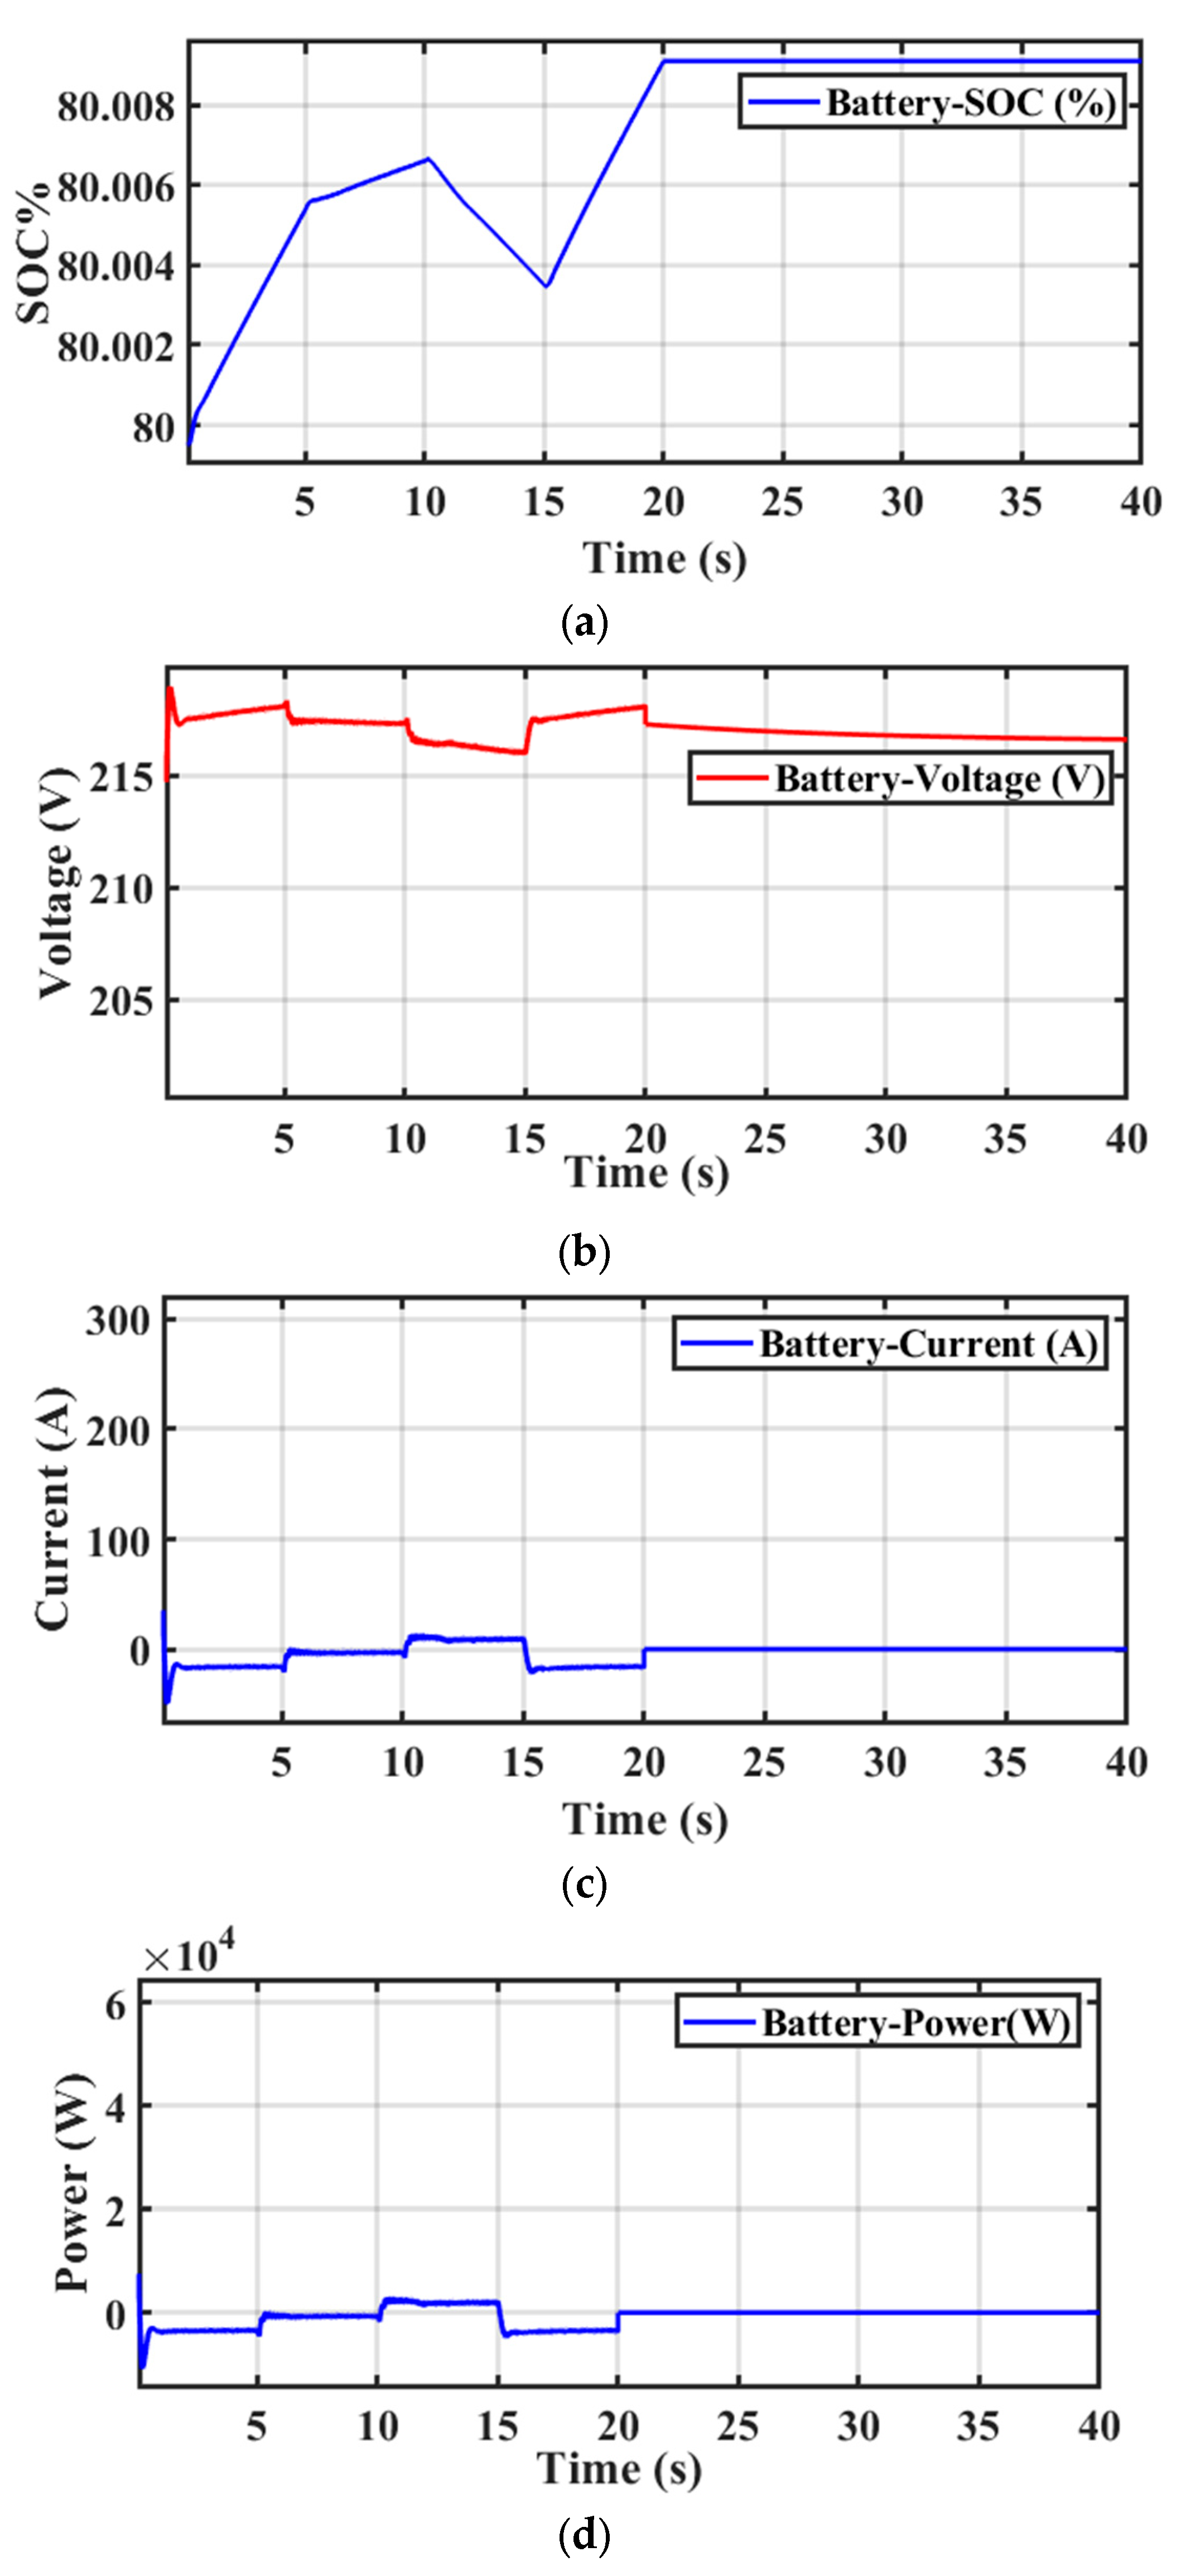
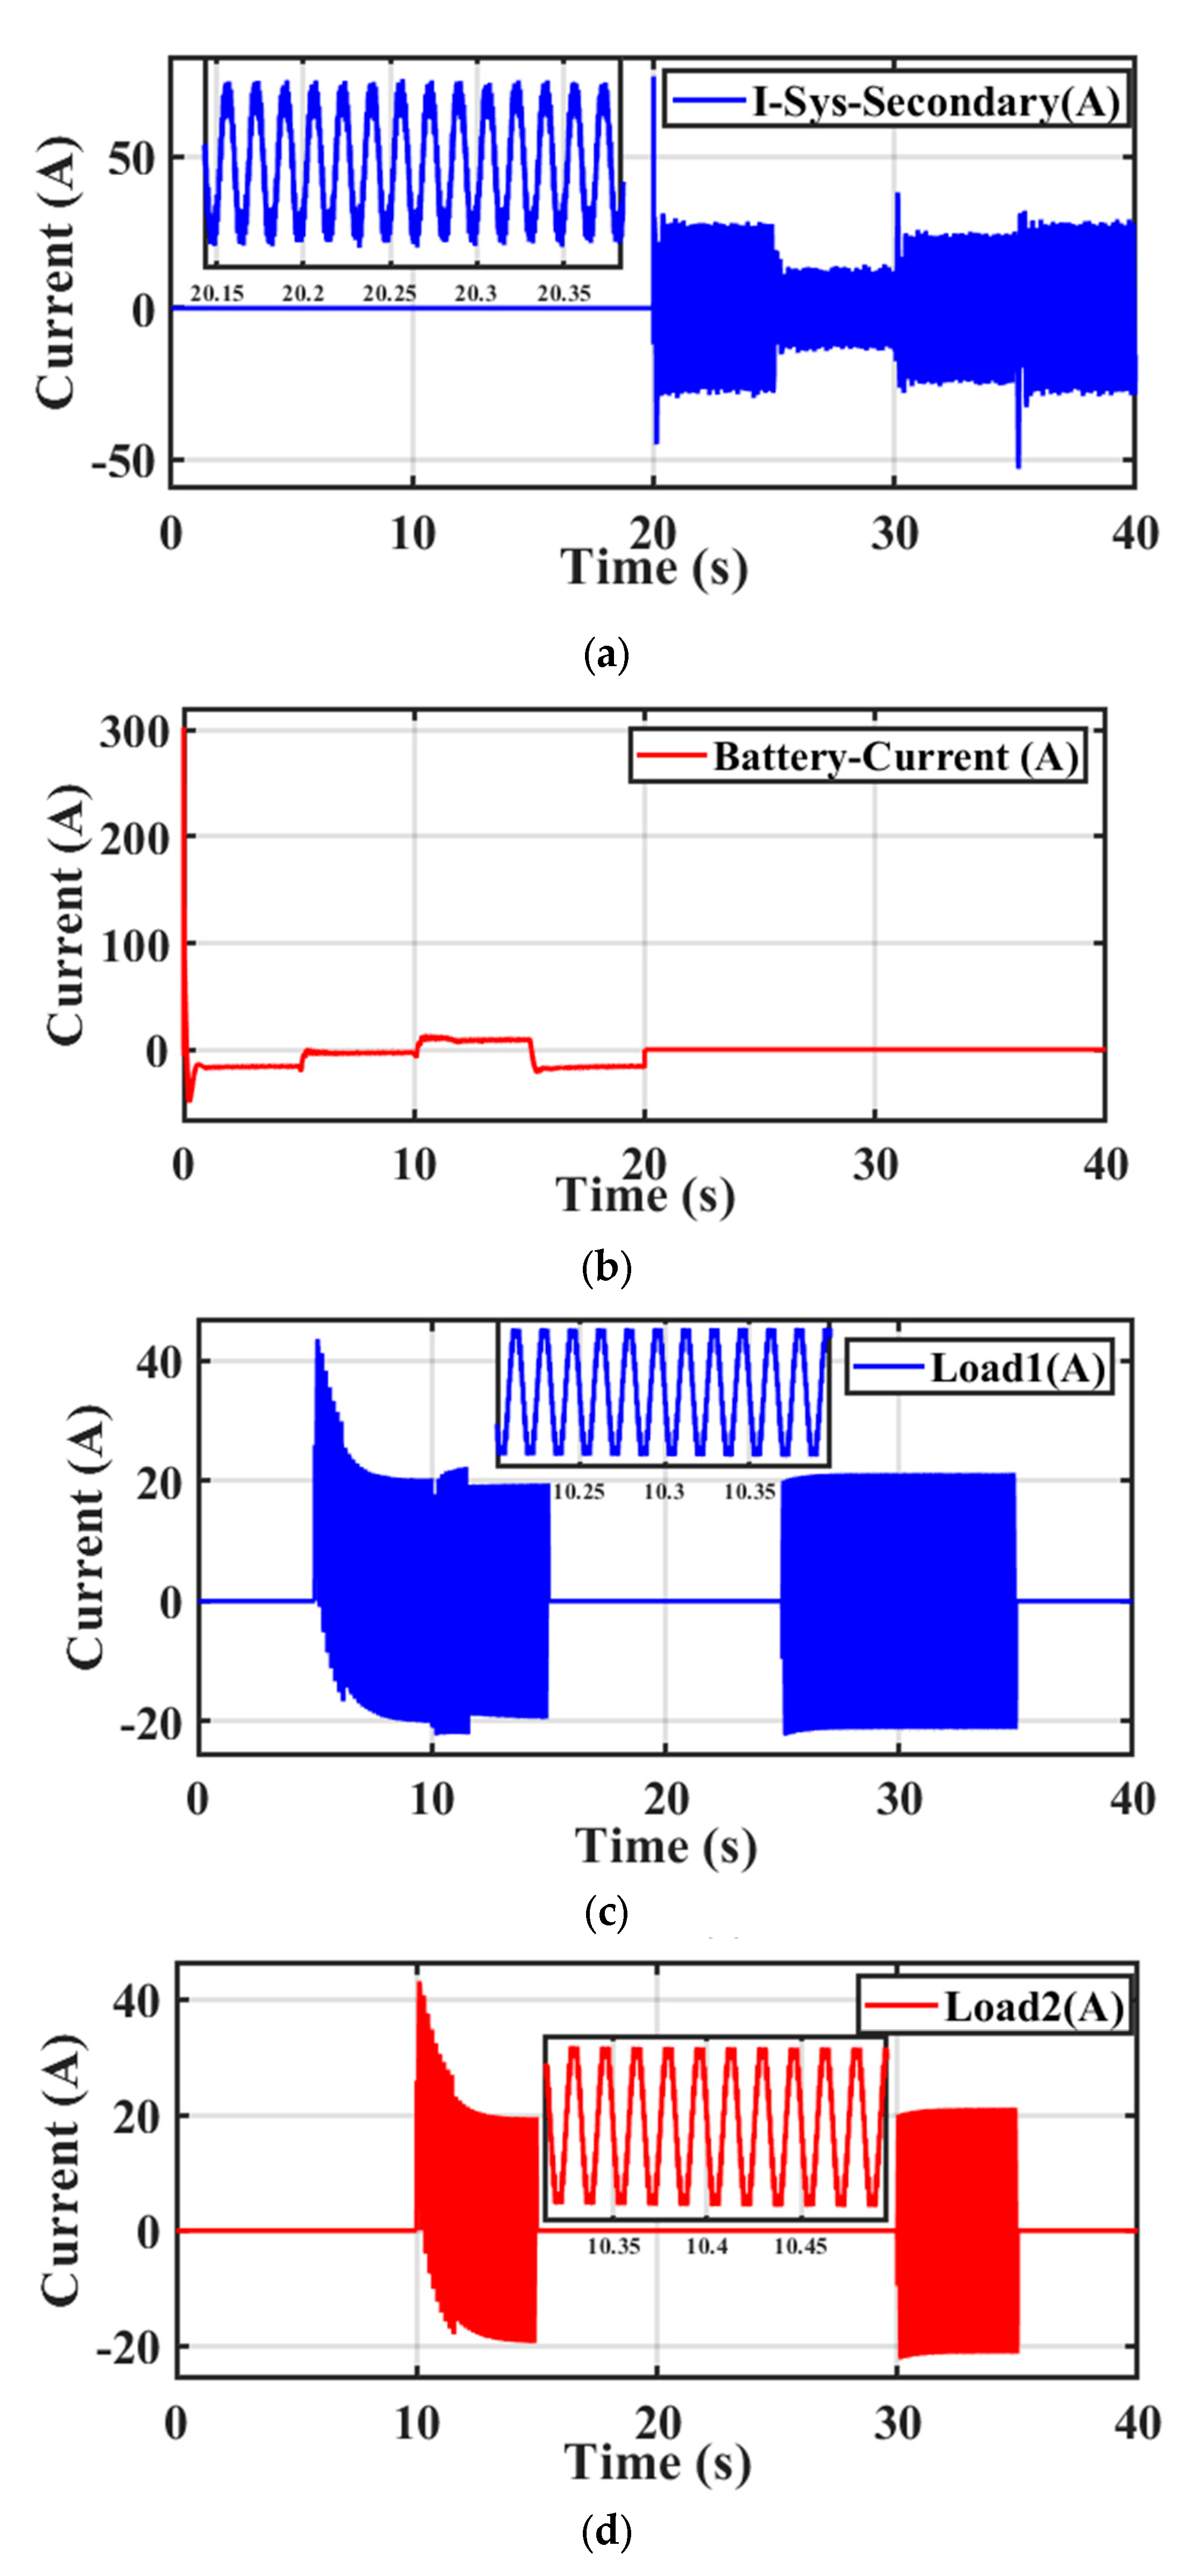
4.5. Investigated System Dynamic Performance

It is intriguing to display the system’s dynamic performance when the load changes in order to demonstrate how the grid and battery operate. Figure 15 displays the lead times for the grid connection and the energy storage system during entry loads. Figure 16 depicts the battery’s performance in times ranging from 0 to 20 s when it was not linked to the grid and in intervals of 20 to 40 s when it was removed from the grid. Additionally, it displays the battery’s charging and discharging times for the periods of 0 to 10 s and 15 to 25 s, respectively, when the energy drawn from the loads was less than the energy produced by the system. The battery discharged to make up for the disparity in drawing loads if the power gained from the loads (6 kW) was more than the power produced (5 kW). This figure also displays the power curves in the event that the battery was removed and the system was linked to the grid in the time range from 20 to 40 s. It also displays the power generated by the system and the remaining loads drawn into the grid in the time ranges from 20 to 30 s and 35 to 40 s. Additionally, the required power difference for the loads from the grid was corrected for during the time between 30 and 35 s. Additionally, the power used by the first and second loads during the battery- and grid-link period is shown in the Figure.
Figure 17 displays all reactions to battery performance in the SOC, as well as (I, V, and P) when changing loads and increasing the battery’s power consumption. When the system was linked to a battery and a power grid with shifting loads, Figure 18 compares the current response and displays the current on loads 1 and 2, respectively. Additionally, it displays the battery current during charging and discharging.

5. Conclusions

For the synchronized EM of three CESs (PV, FC, and WT) and a battery, an MS DC-DC power converter was suggested in this article. The development of an EM system and the optimal control of DC-DC power converters were fully studied. The outcomes showed that the suggested EM strategy successfully utilizes power in an efficient manner. The battery makes up for the PV units’ and FCs’ sluggish response times. Even when using a different CES, the suggested technique can distribute power between units. The efficiency of the suggested converter architecture and the improved control system were examined using MATLAB simulations. The researched converter’s benefits include its ease of use, dependability, and capacity to regulate many CESs simultaneously with MPPT. This optimized converter performs two different tasks: It regulates battery charging in grid-linked operations and serves as a boost converter to draw energy from the batteries during off-grid operations when the PV, FC, and WT cannot generate enough power to supply the loads. Moreover, the integrated converter can also be effectively used to manage the energy of various CESs with the support of a battery. Finally, it can be concluded that an adaptive energy conversion system and EM control approach involving cutting-edge control algorithms like HHA has been developed to render CESs and battery-incorporated power systems optimum, efficient, dependable, and cost-effective.

Author Contributions

Conceptualization, N.F.I. and M.M.M.; formal analysis, A.A. and U.K.; investigation, S.A.E.M.A. and M.M.M.; resources, M.A. (Mohamed Abuagreb) and M.A. (Mohammed Alharbi); writing—original draft preparation, M.M.M. and N.F.I.; writing—review and editing, N.F.I. and M.M.M.; visualization, N.F.I.; supervision, S.A.E.M.A., M.A. (Mohammed Alharbi), and A.A. Funding, M.A. (Mohammed Alharbi), and A.A. All authors have read and agreed to the published version of the manuscript.

Funding

This work was supported by the Researchers Supporting Project number (RSP2023R258), King Saud University, Riyadh, Saudi Arabia.

Institutional Review Board Statement

Not applicable.

Informed Consent Statement

Not applicable.

Data Availability Statement

Data are available on request from the authors.

Acknowledgments

The authors are grateful for the support by the Researchers Supporting Project (number RSP2023R258), King Saud University, Riyadh, Saudi Arabia.

Conflicts of Interest

The authors declare no conflict of interest.

Abbreviations

CESsClean energy sources
FCFuel cell
PVSolar energy
MSsMultiport structures
SPASingle-port architecture
DCDirect current
WSWind system
IGBTInsulated gate bipolar transistor
BPCBidirectional power converter
VFVoltage feedback
CTsCell temperatures
EMEnergy management
HVHigh voltage
ZSZ-source
ZCSZero-current switching
HHAHarris Hawk’s algorithm
MPCModel predictive controller
MPPTMaximum power point tracking
SOCState of charge
DCLDC-link
PWMPulse-width modulation
P&OPerturb and observe
CILConstant irradiation level

References

  1. Rathod, A.A.; Subramanian, B. Scrutiny of Hybrid Renewable Energy Systems for Control, Power Management, Optimization and Sizing: Challenges and Future Possibilities. Sustainability 2022, 14, 16814. [Google Scholar] [CrossRef]
  2. Chakraborty, I.; Sekaran, S.; Pradhan, S.K. An enhanced DC-DC boost converter based stand-alone PV-Battery OFF-Grid system with voltage balancing capability for fluctuating environmental and load conditions. Energy Sources Part A Recover. Util. Environ. Eff. 2022, 44, 8247–8265. [Google Scholar] [CrossRef]
  3. Mendonça, C.; Ferreira, A.; Santos, D.M.F. Towards the Commercialization of Solid Oxide Fuel Cells: Recent Advances in Materials and Integration Strategies. Fuels 2021, 2, 393–419. [Google Scholar] [CrossRef]
  4. Rahman, S.; Khan, I.; Rahman, K.; Al Otaibi, S.; Alkhammash, H.I.; Iqbal, A. Scalable multiport converter structure for easy grid integration of alternate energy sources for generation of isolated voltage sources for mmc. Electronics 2021, 10, 1779. [Google Scholar] [CrossRef]
  5. Gevorkov, L.; Domínguez-García, J.L.; Romero, L.T.; Martínez, À.F. Modern MultiPort Converter Technologies: A Systematic Review. Appl. Sci. 2023, 13, 2579. [Google Scholar] [CrossRef]
  6. Ibrahim, N.F.; Alkuhayli, A.; Beroual, A.; Khaled, U.; Mahmoud, M.M. Enhancing the Functionality of a Grid-Connected Photovoltaic System in a Distant Egyptian Region Using an Optimized Dynamic Voltage Restorer: Application of Artificial Rabbits Optimization. Sensors 2023, 23, 7146. [Google Scholar] [CrossRef]
  7. Mahmoud, M.M.; Atia, B.S.; Abdelaziz, A.Y.; Aldin, N.A.N. Dynamic Performance Assessment of PMSG and DFIG-Based WECS with the Support of Manta Ray Foraging Optimizer Considering MPPT, Pitch Control, and FRT Capability Issues. Processe 2022, 12, 2723. [Google Scholar] [CrossRef]
  8. Boudjemai, H.; Ardjoun, S.A.E.M.; Chafouk, H.; Denai, M.; Elbarbary, Z.M.S.; Omar, A.I.; Mahmoud, M.M. Application of a Novel Synergetic Control for Optimal Power Extraction of a Small-Scale Wind Generation System with Variable Loads and Wind Speeds. Symmetry 2023, 15, 369. [Google Scholar] [CrossRef]
  9. Narayanaswamy, J.; Mandava, S. Non-Isolated Multiport Converter for Renewable Energy Sources: A Comprehensive Review. Energies 2023, 16, 1834. [Google Scholar] [CrossRef]
  10. Kim, S.K.; Jeon, J.H.; Cho, C.H.; Ahn, J.B.; Kwon, S.H. Dynamic modeling and control of a grid-connected hybrid generation system with versatile power transfer. IEEE Trans. Ind. Electron. 2008, 55, 1677–1688. [Google Scholar] [CrossRef]
  11. Reddy, K.S.; Kumar, M.; Mallick, T.K.; Sharon, H.; Lokeswaran, S. A review of Integration, Control, Communication and Metering (ICCM) of renewable energy based smart grid. Renew. Sustain. Energy Rev. 2014, 38, 180–192. [Google Scholar] [CrossRef]
  12. Dhananjaya, M.; Pattnaik, S. Review on Multi-Port DC–DC Converters. IETE Tech. Rev. 2022, 39, 586–599. [Google Scholar] [CrossRef]
  13. Indragandhi, V.; Benitto, A. Performance analysis, modeling and control of multi-port DC-DC boost converter for an integrated power generation system. Indian J. Sci. Technol. 2016, 9, 1–12. [Google Scholar] [CrossRef]
  14. Rostami, S.; Abbasi, V.; Parastesh, M. Design and Implementation of a Multiport Converter Using Z-Source Converter. IEEE Trans. Ind. Electron. 2021, 68, 9731–9741. [Google Scholar] [CrossRef]
  15. Foti, S.; Testa, A.; De Caro, S.; Tornello, L.D.; Scelba, G.; Cacciato, M. Multi-level multi-input converter for hybrid renewable energy generators. Energies 2021, 14, 1764. [Google Scholar] [CrossRef]
  16. Amaleswari, R.; Prabhakar, M. Non-isolated multi-input DC-DC converter with current sharing mechanism. Int. J. Electron. 2021, 108, 1872–1890. [Google Scholar] [CrossRef]
  17. Zeng, J.; Ning, J.; Du, X.; Kim, T.; Yang, Z.; Winstead, V. A Four-Port DC-DC Converter for a Standalone Wind and Solar Energy System. IEEE Trans. Ind. Appl. 2020, 56, 446–454. [Google Scholar] [CrossRef]
  18. Mahmoudi, M.; Safari, A. LMI based robust control design for multi-input–single-output DC/DC converter. Int. J. Dyn. Control 2019, 7, 379–387. [Google Scholar] [CrossRef]
  19. Ahmed, R.M.; Zakzouk, N.E.; Abdelkader, M.I.; Abdelsalam, A.K. Modified Partial-Shading-Tolerant Multi-Input-Single-Output Photovoltaic String Converter. IEEE Access 2021, 9, 30663–30676. [Google Scholar] [CrossRef]
  20. Dhananjaya, M.; Chaitanya, B.K.; Babu, T.S.; Potnuru, D.; Aljafari, B.; Kannan, R.; Lohani, T.K. Design of multi-input single output DC–DC converter with preserved output voltage under source-fault. IET Power Electron. 2023, 16, 1732–1742. [Google Scholar] [CrossRef]
  21. Qian, Z.; Abdel-Rahman, O.; Al-Atrash, H.; Batarseh, I. Modeling and control of three-port DC/DC converter interface for satellite applications. IEEE Trans. Power Electron. 2010, 25, 637–649. [Google Scholar] [CrossRef]
  22. Zhang, Z.; Thomsen, O.C.; Andersen, M.A.E.; Nielsen, H.R. Dual-input isolated full-bridge boost dc-dc converter based on the distributed transformers. IET Power Electron. 2012, 5, 1074–1083. [Google Scholar] [CrossRef]
  23. Zheng, L.; Kandula, R.P.; Divan, D. Soft-Switching Solid-State Transformer with Reduced Conduction Loss. IEEE Trans. Power Electron. 2021, 36, 5236–5249. [Google Scholar] [CrossRef]
  24. Gajanayake, C.J.; Luo, F.L.; Gooi, H.B.; So, P.L.; Siow, L.K. Extended-boost Z-source inverters. IEEE Trans. Power Electron. 2010, 25, 2642–2652. [Google Scholar] [CrossRef]
  25. Harini, S.; Chellammal, N.; Chokkalingam, B.; Mihet-Popa, L. A Novel High Gain Dual Input Single Output Z-Quasi Resonant (ZQR) DC/DC Converter for Off-Board EV Charging. IEEE Access 2022, 10, 83350–83367. [Google Scholar] [CrossRef]
  26. Wai, R.J.; Zhang, Z.F. High-Efficiency Single-Input Triple-Outputs DC-DC Converter with Zero-Current Switching. IEEE Access 2019, 7, 84952–84966. [Google Scholar] [CrossRef]
  27. Hosseini, A.; Sheikhaei, S.; Davari, M. Design and implementation of a novel zero-current switching method for low-power DC–DC converters. IET Power Electron. 2023, 16, 1409–1424. [Google Scholar] [CrossRef]
  28. Ramu, S.K.; Paramasivam, S.; Muthusamy, S.; Panchal, H.; Sadasivuni, K.K.; Noorollahi, Y. A novel design of switched boost action based multiport converter using dsPIC controller for renewable energy applications. Energy Sources Part A Recovery Util. Environ. Eff. 2022, 44, 75–90. [Google Scholar] [CrossRef]
  29. Hasanpour, S.; Siwakoti, Y.P.; Blaabjerg, F. A New High Efficiency High Step-Up DC/DC Converter for Renewable Energy Applications. IEEE Trans. Ind. Electron. 2023, 70, 1489–1500. [Google Scholar] [CrossRef]
  30. Saadatizadeh, Z.; Heris, P.C.; Alan Mantooth, H. Modular Expandable Multiinput Multioutput (MIMO) High Step-Up Transformerless DC-DC Converter. IEEE Access 2022, 10, 53124–53142. [Google Scholar] [CrossRef]
  31. Yi, W.; Ma, H.; Peng, S.; Liu, D.; Ali, Z.M.; Dampage, U.; Hajjiah, A. Analysis and implementation of multi-port bidirectional converter for hybrid energy systems. Energy Rep. 2022, 8, 1538–1549. [Google Scholar] [CrossRef]
  32. Alajmi, B.N.; Marei, M.I.; Abdelsalam, I.; Alhajri, M.F. Analysis and design of a multi-port DC-DC converter for interfacing PV systems. Energies 2021, 14, 1943. [Google Scholar] [CrossRef]
  33. Li, Q.; Wolfs, P. A review of the single phase photovoltaic module integrated converter topologies with three different DC link configurations. IEEE Trans. Power Electron. 2008, 23, 1320–1333. [Google Scholar] [CrossRef]
  34. Almutairi, A.; Sayed, K.; Albagami, N.; Abo-Khalil, A.G.; Saleeb, H. Multi-port pwm dc-dc power converter for renewable energy applications. Energies 2021, 14, 3490. [Google Scholar] [CrossRef]
  35. Forest, F.; Meynard, T.A.; Labouré, E.; Gelis, B.; Huselstein, J.J.; Brandelero, J.C. An isolated multicell intercell transformer converter for applications with a high step-up ratio. IEEE Trans. Power Electron. 2013, 28, 1107–1119. [Google Scholar] [CrossRef]
  36. Venkateswari, R.; Rajasekar, N. Review on parameter estimation techniques of solar photovoltaic systems. Int. Trans. Electr. Energy Syst. 2021, 31, e13113. [Google Scholar] [CrossRef]
  37. Ascencio-Vásquez, J.; Bevc, J.; Reba, K.; Brecl, K.; Jankovec, M.; Topič, M. Advanced PV performance modelling based on different levels of irradiance data accuracy. Energies 2020, 13, 2166. [Google Scholar] [CrossRef]
  38. Metwally Mahmoud, M. Improved current control loops in wind side converter with the support of wild horse optimizer for enhancing the dynamic performance of PMSG-based wind generation system. Int. J. Model. Simul. 2022. [Google Scholar] [CrossRef]
  39. Boudjemai, H.; Ahmed, S.; Mehdi, E.; Chafouk, H.; Denai, M.; Alkuhayli, A.; Khaled, U.; Mahmoud, M.M. Experimental Analysis of a New Low Power Wind Turbine Emulator Using a DC Machine and Advanced Method for Maximum Wind Power Capture. IEEE Access 2023, 11, 92225–92241. [Google Scholar] [CrossRef]
  40. Eminoglu, U.; Turksoy, O. Power curve modeling for wind turbine systems: A comparison study. Int. J. Ambient Energy 2021, 42, 1912–1921. [Google Scholar] [CrossRef]
  41. Alsaidan, I.; Shaheen, M.A.M.; Hasanien, H.M.; Alaraj, M.; Alnafisah, A.S. Proton exchange membrane fuel cells modeling using chaos game optimization technique. Sustainability 2021, 13, 7911. [Google Scholar] [CrossRef]
  42. Hossain, M.B.; Islam, M.R.; Muttaqi, K.M.; Sutanto, D.; Agalgaonkar, A.P. Advancement of fuel cells and electrolyzers technologies and their applications to renewable-rich power grids. J. Energy Storage 2023, 62, 106842. [Google Scholar] [CrossRef]
  43. Sayed, K.; Abdel-Salam, M.; Ahmed, A.; Ahmed, M. New high voltage gain dual-boost DC-DC converter for photovoltaic power systems. Electr. Power Compon. Syst. 2012, 40, 711–728. [Google Scholar] [CrossRef]
  44. Mendez-Flores, E.; Ortiz, A.; Macias, I.; Molina, A. Experimental Validation of an Enhanced MPPT Algorithm and an Optimal DC–DC Converter Design Powered by Metaheuristic Optimization for PV Systems. Energies 2022, 15, 8043. [Google Scholar] [CrossRef]
  45. Ibrahim, M.H.; Ang, S.P.; Dani, M.N.; Rahman, M.I.; Petra, R.; Sulthan, S.M. Optimizing Step-Size of Perturb & Observe and Incremental Conductance MPPT Techniques Using PSO for Grid-Tied PV System. IEEE Access 2023, 11, 13079–13090. [Google Scholar] [CrossRef]
Figure 1. Illustration of the investigated system.
Sustainability 15 13716 g001
Figure 2. The suggested topology of an MS converter.
Sustainability 15 13716 g002
Figure 3. Detailed control scheme of the studied configuration.
Sustainability 15 13716 g003
Figure 4. The setup of a dual loop controller is developed for the inverter.
Sustainability 15 13716 g004
Figure 5. The I-V and P-V curves under varying CTs and CILs.
Sustainability 15 13716 g005
Figure 6. Connection of battery via bidirectional DC-DC converter with their optimized control system.
Sustainability 15 13716 g006
Figure 7. P&O-MPPT’s flowchart for the investigated CESs.
Sustainability 15 13716 g007
Figure 8. HHA flowchart.
Sustainability 15 13716 g008
Figure 9. 3-phase V’s inverter output.
Sustainability 15 13716 g009
Figure 10. 3-phase I’s inverter output.
Sustainability 15 13716 g010
Figure 11. WT outputs (I, V, and P). (a) WT current; (b) WT voltage; (c) WT power.
Sustainability 15 13716 g011
Figure 12. FC outputs (I, V, and P). (a) FC current; (b) FC voltage; (c) FC power.
Sustainability 15 13716 g012
Figure 13. PV outputs (I, V, and P). (a) PV current; (b) PV voltage; (c) PV power.
Sustainability 15 13716 g013
Figure 14. DCL outputs (I and V). (a) DCL current; (b) DCL voltage.
Sustainability 15 13716 g014
Figure 15. The lead times for both the battery and the grid connection during the entry loads.
Sustainability 15 13716 g015
Figure 16. The output active and reactive power waveforms of grid-connected PV and battery during the entry loads. (a) Battery power; (b) Grid power; (c) Load power.
Sustainability 15 13716 g016
Figure 17. The output (I, V, P, and SOC%) waveforms of the battery during the entry loads. (a) OC% of battery; (b) Battery voltage; (c) Battery current; (d) Battery output power.
Sustainability 15 13716 g017
Figure 18. The output current waveforms of the grid-connected and battery during the entry loads. (a) System secondary current; (b) Battery current; (c) Load 1 current; (d) Load 2 current.
Sustainability 15 13716 g018
Table 1. Functionality evaluation of several DC–DC PC topologies.
ParametersTraditional PC (TPC)Interleaved PCMS PC
SwitchingStiffFine Fine
Switching lossesThe highestMediumThe least
EfficiencyThe least1% higher than the TPC The highest
InputsSeparate PCs are completely combined into a hybrid system (HS).Only one inputThe multi-input HS is the most appropriate.
Stress on the switchesThe highestMediumThe least
Ripple ContentThe highestMediumThe least
Controller designSimpleSimpleComplex
StabilityNot fixed across all operational pointsNot uniform across all operational pointsStable in all working points
Circuit TopologyEvery unidirectional port and secondary topology is the most usable.Highly available architecture without a backup port and a bidirectional connectorA bidirectional connector with complex architecture and backup is accessible
Table 2. Surveying table for associated research.
Refs.YearPublisherDescriptionTechniqueFuture Work
[15]2021MDPIA dual input integrative link to the CUK PV, a SEPIC-based PC, and a wind power source are coupled to a DC microgridPWMRedesigning the circuit topographic lowers switching stress and enhances performance
[16]2020Taylor and FrancisThe innovative structure of the MS-PC allows it to alter the input source from any voltage variation while maintaining a fixed produced powerPIA better structure and control system with fewer elements will be expanded from the test results
[17]2020IEEEThe 4 DC ports of the work’s innovative DC/DC PC design can be linked: 2 input ports, a bidirectional memory port, and a galvanically separated load portZero voltage
Switching
The suggested PC will be examined using an adaptive load system
[18]2019SpringerA 3-port PC with 2 inputs and 1 output is examined. Suggested composite boost and buck-boost PC for bridging various portsLinear matrix inequalitiesThe studied controller requires experimentation with different predictive controls and a stability test
[19]2021IEEEThe suggested PV string PC was designed for multiple inputs and just one output, making it suitable for partial shadowing scenariosEvent obsessed
built on MPPT
The controller needs to advance to comply with genuine and universal MPP
[20]2023IETThe use of an MISO boost PC was suggested to increase the efficiency of renewable energy sources and output voltage while reducing the number of partsTime-sharing schemeRedesigning the circuit scheme lowers switching stress and enhances performance. Assessment of its impact on power quality
Table 3. Variables of the circuit’s values.
ParameterSymbolValueUnit
Inductor turns number T N O 25___
Core typeFerrite core (UU-95)
Self-inductance of inductor (SIOI) 1 L 1 420µH
SIOI 2 L 2 280µH
SIOI 3 L 3 300µH
PV port filter capacitor (PFC) C S 100µF
FC-PFC C F 330µF
Wind-PFC C W 100µF
Filtering capacitor C D C 330µF
Table 4. Definition of the PV cell\WS\FC parameters.
SystemParameterDefinition
PV I L Photo current
I O Saturation current of the diode
I S C Short circuit current
V O C Open circuit voltage
GIrradiance (W/m2)
k = 1.38 ×10⁻²³Boltzmann’s constant
q = 1.60 ×10⁻¹⁹Charge on an electron
TTemperature in °C
nIdeality factor
VgBandgap voltage
K0Constant which is determined from ISC vs. T, dV/dI at voc per cell
WS ρ The air density (kg/m3)
ASwept area of a rotor (m2)
P b The power extracted by blades
V Upwind velocity (m/s)
V d Downwind velocity (m/s)
V w i n d Wind speed
V b a s e Base (constant) wind speed
V r a m p Ramp wind signal
V g u s t Gust wind component
V n o i s e Noise wind component
T1RStarting time of ramp (s)
Max RThe ramp maximum value
FCVsofcVoltage of a solid oxide FC
ENernst reversible voltage
VactVoltage activation loss
VconVoltage concentration loss
VohmVoltage ohmic loss.
E0Standard potential
RUniversal gas constant
TOperating temperature in kelvins
FFaraday constant
PH2Hydrogen partial pressure
PH2OWater’s partial pressure
PO2Oxygen partial pressure
I0Exchange current
αiCoefficient of charge transfer
nNumber of moles of electrons transferred
CbConcentration at the triple-phase boundary
C∞ isBulk concentration of reactant
nNumber of moles of electrons participating in the reaction
T is the FC temperatureConstant coefficients of the FC
T0973 K
γ0.2 Ω
β−2870 K
rInternal resistance of the SOFC
Table 5. Obtained PI gains using the HHA technique.
TechniqueObtained PI Gains
K p 1 K p 2 K i 1 K i 2
HHA-PI (proposed)3.76549.02241.973135.9733
Table 6. Parameters of the studied system.
DescriptionSpecifications
PV panelMSX60 60 W
Open circuit voltage ( V O C )21 V
Short circuit current ( I S C )3.75 A
The voltage at max power ( V M )17.23 V
Current at max power ( I M )3.7 A
Maximum power ( P M )60 W
Battery modelLead acid battery model
Maximum capacity400 Ah
Nominal voltage48
Round tip efficiency80%
The energy capacity of a battery1 kWh
FCSolid oxide (SOFC), stack size 2 MW, operating temperature 700–1000 °C/1202–1832 °F
WSRated power 1500 kW, PMSG
Inverter systemRated 100 kVA, input 800 V D C , 300 V A C , 50 Hz.
L 1 , L 2 , and L 3 120, 500, and 800 µH
C P V , C F C , and C W S 330, 750, and 900 µF
C D C 500 µF
Disclaimer/Publisher’s Note: The statements, opinions and data contained in all publications are solely those of the individual author(s) and contributor(s) and not of MDPI and/or the editor(s). MDPI and/or the editor(s) disclaim responsibility for any injury to people or property resulting from any ideas, methods, instructions or products referred to in the content.

