Article

Synergy between Electric Vehicle Manufacturers and Battery Recyclers through Technology and Innovation: A Game Theory Approach

1
College of Economics and Management, China Jiliang University, Hangzhou 310018, China
2
Institute of Digitalization and Data Intelligence, China Jiliang University, Hangzhou 310018, China
3
Department of Computer Science and Engineering, Shaoxing University, Shaoxing 312000, China
4
Institute of Artificial Intelligence, Shaoxing University, Shaoxing 312000, China
*
Author to whom correspondence should be addressed.
Sustainability 2023, 15(18), 13726; https://doi.org/10.3390/su151813726
Submission received: 9 August 2023 / Revised: 28 August 2023 / Accepted: 31 August 2023 / Published: 14 September 2023
(This article belongs to the Section Economic and Business Aspects of Sustainability)

Abstract

:
Power battery recycling (PBR) has triggered profound changes in the industrial chain of electric vehicles (EVs). The PBR innovation network provides information channels and resource conditions for enterprises, but the mechanism of its impact on the synergistic innovation benefits and sustainable development ability of EV and PBR enterprises still needs further exploration. In this paper, we collect patent data for PBR from 2012 to 2020, identify the structural characteristics of innovation networks, and construct a synergy game model for PBR technology, aiming to analyze the synergistic effect of network embedding and knowledge spillover in PBR enterprises on technological innovation. First, we find that the PBR innovation network exhibits the small-world effect, which has a double-edged sword effect on technological cooperation innovation. Second, structural holes benefits of the main body of PBR technological innovation have a significant impact on cooperation innovation behavior. Third, the enhancement of the relevance and deep complementarity of knowledge cooperation is sufficient to make up for the input cost of PBR technological cooperation innovation, with additional benefits created by the increase in the output of structural holes. However, companies tend to be more inclined toward non-cooperative innovation as the knowledge spillover effect of the innovation network increases.

1. Introduction

As the world’s largest green industry, the continuous development of the new energy automobile industry has led to profound changes in the industrial chain of vehicle assembly, battery development, and waste recycling [1]. The recycling market created by recovering metals such as cobalt, nickel, manganese, lithium, iron, and aluminum from waste power lithium batteries was expected to exceed RMB 5.3 billion in 2018 and exceed RMB 10 billion by 2020. However, as of January 2019, the planned production capacity of China power battery dismantling and regeneration projects had reached 1.2 million tons/year, whereas the actual processing capacity was less than 20,000 tons (statistics from the Institute of Process Engineering, Chinese Academy of Sciences). A considerable number of batteries will soon reach their end of life, which will complicate matters further. All materials used to make electric vehicle batteries are extremely hazardous to both the environment and human health and are able to permeate into soil and therefore water supplies when they are directly placed into landfills. For this reason, how to properly deal with so many used power batteries has become an urgent challenge [2]. Critically, a new recycling process must be commercialized that is capable of recovering valuable materials at a high efficiency. A new technology has been developed by the researchers at Worcester Polytechnic Institute that is capable of recovering LiNi x Mn y Co z O 2 cathode material from a hydrometallurgical process, making the recycling system, as a whole, more economically viable [3].
Driven by both policy and the market, the PBR market occupies considerable space, with a considerable value of the industrial chain. The PBR technological cooperation innovation network accelerates enterprise technology cooperation and sharing. Battery-operated electrical vehicles are gradually replacing combustion-engine-based vehicles. The materials used for electrodes play a vital role in deciding the battery performance, cost, and life [4,5]. However, as resources are expanding and disorderly and industrial agglomeration is decreasing, the construction of a standard and normative system is not perfect. Although the PBR market has considerable potential, optimism is lacking in terms of its “profitability”. Some illegal small businesses blindly invest to seek short-term benefits, use the limited knowledge spillover in the industry, and quickly deploy and recover production capacity. Companies with small workshops take advantage of the close distance, lower transportation and labor costs, and the lack of a need for supervision by an environmental protection department, as well as business qualifications. They can obtain greater benefits with low fixed costs and high profits, while compliance companies concerned with environmental protection make large investments in equipment, workshops, personnel, etc. Furthermore, the supply of decommissioned power batteries is scattered, and transportation and freight complexities are relatively high. Compliant companies have high fixed costs to a certain extent, including costs related to sorting, testing, coding, regrouping, and recycling, which sometimes do not justify the economic gain. Gresham’s law proves irregularities in the industry and unfair competition. The sustainable development of the economy, society, and environment of the PBR industry is particularly important to respond to the national “carbon neutrality and carbon up” policy requirements, reduce fossil fuel consumption, and improve power battery technology cooperation and innovation capabilities, as well as resource utilization efficiency. Therefore, limited research has been conducted on how knowledge spillovers between innovative entities affect the synergy benefits and how the embedding characteristics of PBR innovation networks affect the game equilibrium of PBR technological innovation.
In short, realizing the sustainable and innovative development of the PBR industry supports the explosive growth of electric vehicles. Supply–demand docking, technological cohesion, and value connection between industry and the market require diversified technical cooperation and technological layouts. The PBR technological cooperation innovation network is a systematic topology abstraction connected by many node enterprises and has typical complex network characteristics. Network effects directly affect cross-domain knowledge spillovers, technical cooperation, and technological innovation among the main players in the industrial chain. In the process of technological cooperation, enterprises further adjust their technological investment and cooperative innovation strategies through knowledge learning. Analysis of the evolution characteristics of the PBR industrial network becomes the top priority; the key is to identify the crucial influencing factors of the synergy benefit equilibrium mechanism of the complex network between the main network nodes at the enterprise level. Considering the complex network characteristics of the PBR industry diffusion network, in this paper, we build an evolutionary game model based on individual and group characteristics of an innovation network. The aim of this network is to analyze the innovation and cooperation behavior in the actual network to the greatest extent possible. By analyzing network embedding and knowledge spillover effects, the synergistic effect of industrial chain technological innovation can be enhanced.
The main contributions of this paper can be summarized as follows. First, we extend research on synergy innovation by responding to the call for adequate attention to the innovation network in the synergy literature. This article provides new insights into whether network structure affects the synergy benefits of innovation entities by identifying the positive effects of small-world networks and structural hole factors on synergy benefits of battery recyclers. Second, theoretical linkages are developed between technical cooperation and innovation network structure in the PBR technology innovation process. We identify the contextual variables that affect the efficacy of synergy innovation from the perspective of network embeddedness and knowledge spillover that have remained unexplained to date. Our findings of a complex moderating effect of the network structure indicate the important boundary conditions of synergy innovation, which may further resolve the more intriguing issue of when innovation network embedding is beneficial to synergy innovation. Finally, we complement the understanding of synergy innovation by focusing on the interacting role of innovation network structure and knowledge spillover of organizations in game activities.

2. Related Work

2.1. Innovation Network

Innovation networks can promote mutual exchanges between companies, as well as access to external technologies and resources [6]. EV manufacturers are under considerable pressure to reduce vehicle cost without compromising safety, performance, and driving range. EV companies are not able to reduce the vehicle price owing to the expense of batteries. Therefore, battery technology choices of EV manufacturers can help to optimize vehicle cost [7]. Zhang et al. [8] compared and analyzed the technology patents of PBR institutions at home and abroad. They reported that Chinese battery recyclers have more vitality in terms of technology research and development and that the development of PBR technology is in high demand. However, Chinese PBR technology is still in the stage of technology introduction, digestion, and reinnovation. The number and quality of patents of patent holders are not clear, advantageous technical fields are not concentrated, and the core technology layout is lacking [9]. Based on patent analysis of key components of new energy vehicles (power batteries and motors), Li [10] reported a long-term movement towards the development of pure electric vehicles in China. At present, the patent layout of new energy vehicles in China is decentralized, and the degree of industrial clustering is low. Zhang [11] studied the relevance of national policies and the technological innovation of power battery companies. Mu et al. [12] found that the higher the degree of cooperation between enterprises, the better the independent innovation capabilities and technological introduction effects of battery recyclers. The cooperation network of new-energy-vehicle-related patents, including its features and performance during different stages, has evolved smoothly, with a growing network density, stable structure, and cohesive subgroups [13].
The development mechanism of emerging industry networks has been confirmed by many innovation practices and related theoretical studies to be conducive to aggregating innovation resources, promoting the transformation of scientific and technological achievements, and improving innovation efficiency [14]. PBR technological cooperation and innovation continue to extend upstream and downstream. Chevrolet established an energy storage station using used EV batteries at a General Motors plant in Michigan. In Europe, Tesla has begun recycling in cooperation with Umicore. Coordinating an optimal pricing strategy between manufacturers and remanufacturers, as well as relationships between return yield, sorting rate, and recycling rate, may optimize total profit in different periods [14]. Besides the provision of renewable energy for vehicle charging, a circular use system of EV batteries that functions well and is efficient could also be a sustainable and circular economy solution for electromobility [15]. Kannan et al. [16] proposed a closed-loop supply chain network to recover valuable materials from used and decommissioned batteries to reduce the total cost of PBR. Li et al. [17] also proposed a network similar to remanufacturing, integrating batteries into the remanufacturing supply chain, which can increase profits. Liu and Gong [18] studied the matching behavior of vehicles and batteries under the retailer recycling mode and analyzed the factors that affect the recycling and the degree of influence. Li et al. [19] studied the impact of the deposit–refund system on the recovery rate of power batteries.
Existing research has analyzed the evolutionary characteristics of PBR recycling innovation networks, as well as the influencing factors of cooperation benefits and recycling efficiency. However, little research has been conducted on the knowledge spillover correlation of innovative entities’ synergistic cooperation and the equilibrium mechanism of synergistic innovation network games.

2.2. Complex Network Evolutionary Game

The role of innovation networks in the EV industry, from the perspective of evolution, is to integrate the overall network and the entities’ microscopic features and design relative variables. The overall strength of the relationship of the network modulates the inverted U-shaped relationship between the central location and the technological niche [20]. Tang et al. [21] investigated the social, economic, and environmental impacts of recycling retired electric vehicle batteries using reward–penalty mechanisms by developing a Stackelberg game theoretical model. They then proposed that compared with the subsidy mechanism, the reward–penalty mechanism exerts greater effects on the recycling rate and social welfare. Zhao et al. [22] explored the promotion impact of government subsidies on EV diffusion and established a three-stage evolutionary game model.
Based on the actual application, some scholars incorporated influencing factors into the modeling system to conduct game analysis of the relationship among stakeholders in a diffusion problem. For example, Zhu and Dou [23] established an evolutionary game model between the government and core enterprises and proposed that GSCM (green supply chain management) diffusion among core enterprises is affected by the costs and benefits of implementing GSCM. Another study addressed the problem of spent EV battery collection through multiple channels, i.e., an automobile manufacturer (AM), a 4S shop, and a third-party recycler (TPR). The results showed that the recycling rates of a 4S shop and a TPR are both higher than that of an AM. However, the profits of an AM and a 4S shop are higher than those of a TPR [24]. A game between the government and battery recyclers can be modeled with the aim of promoting innovation with respect to recycling technology to achieve sustainable development in terms of energy and the environment. The benefits of adopting green innovative technologies for power battery producers outweigh additional input costs. The evolutionary game system eventually converges, leading the government to impose strict regulations and the manufacturer to adopt the novel technology. At that time, battery recyclers have enhanced the recovery efficiency through the adoption of green innovation technology and have achieved competitive advantages in terms of recycling [25].
Previous studies have shown that the advantages of knowledge correlation and spillover directly affect the dynamic evolution patterns and laws of innovation networks. However, how the structural characteristics of innovation networks, represented by structural holes and small worlds, affect the synergy benefits of technological innovation entities and how the spillover effects of network knowledge affect the synergy revenue effects of PBR technology cooperation remain unknown.

3. Network Analysis of Technological Cooperation Innovation

Complex network analysis is an effective method to help reveal the inner relationship between different knowledge and technological cooperation innovation networks. Such an investigation involves the analysis of the evolution trend and evolution characteristics of the network through the overall network and individual network of the PBR industry. The patent cooperation network can reflect the characteristics of innovation cooperation and the agglomeration of the PBR industry and measure the evolution of the cooperation innovation network. According to the frequency of patent applicants’ cooperation on different IPCs, we can also speculate on interorganizational technology associations, future cooperation directions, and the potential for cooperation in other related fields.

3.1. Main Theoretical Foundations of Network Analysis

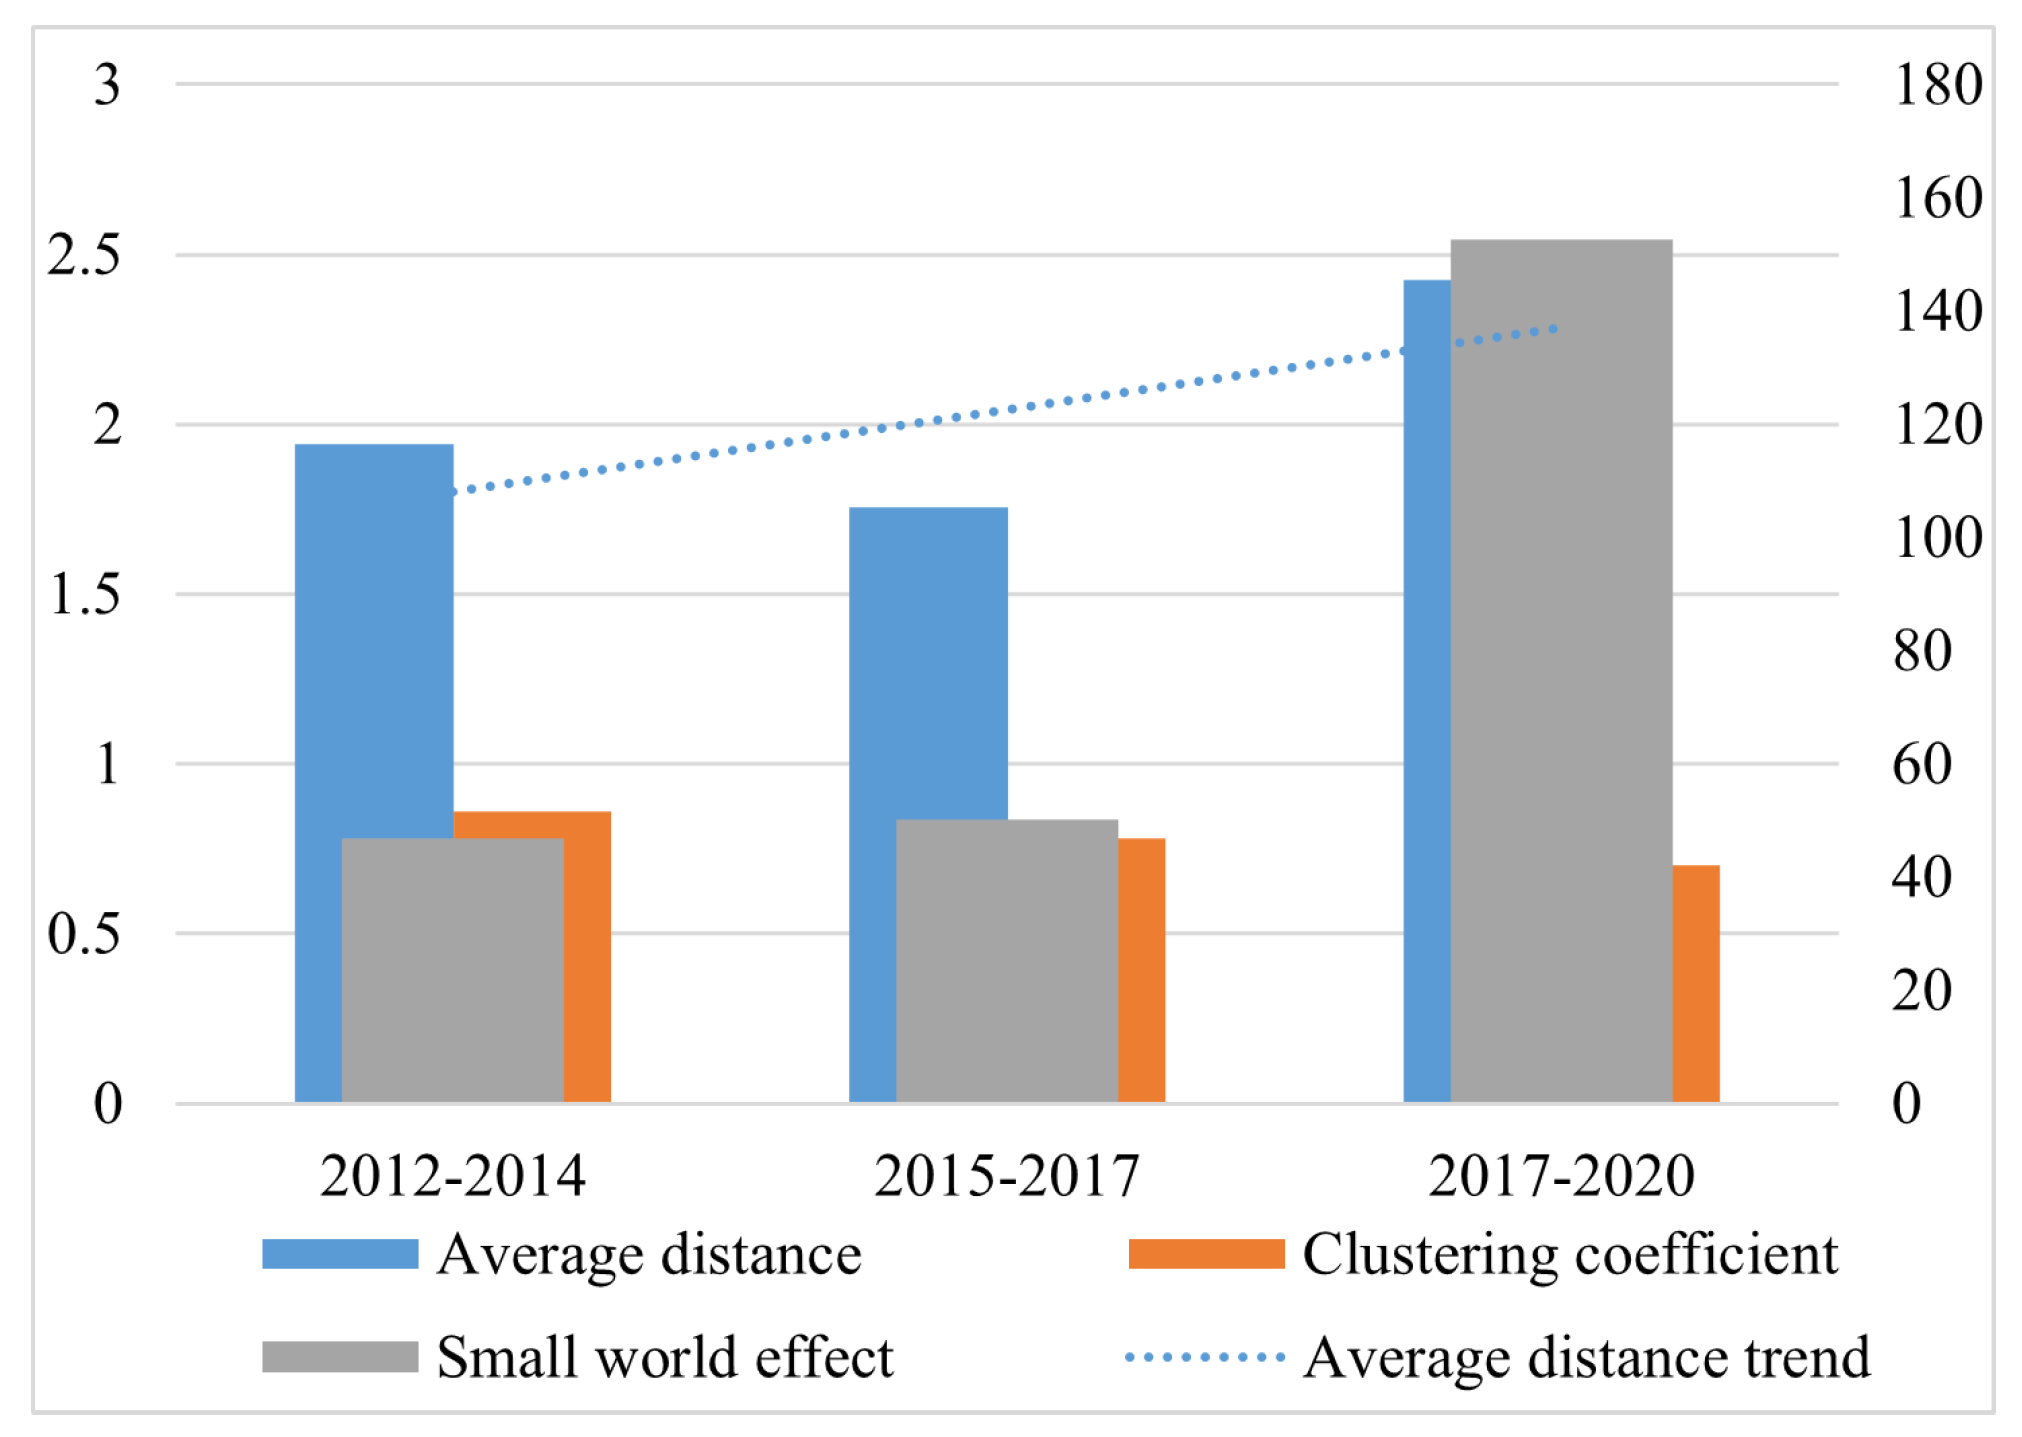
3.1.1. Small-World Effect

The formal and informal relationships established by the main body of the PBR technological innovation cooperation network promote the sharing and mutual benefit of resources. The positive topological properties of small-world networks have always been a hot spot in research on complex networks. The combination of characteristic path length and clustering coefficient is a key parameter of the small-world effect. When the clustering coefficient is larger and the characteristic path length is shorter, the network is called a small-world network. In this kind of network, the average path length between any two nodes is much smaller than the number of nodes. The clustering coefficient is an index concerning the local network structure, which can be measured by the clustering coefficient or the transfer coefficient, as well as (in most cases) the average local density. The local clustering coefficient ( C i ) of node v i is the ratio of the number of connections between adjacent nodes to the number of possible connections. According to Strogatz and Duncan [26], Equation (1) can be used to measure small-world networks:
G = ( V , E ) indicates that graph G contains innovation node V and the edge (E) connecting them; then, the origin of the undirected graph is defined as follows:
C i = 2 | { e j k } | k i ( k i 1 )
where v j , v k N i , e j k E , N i = { v : e i j E e j i E } is the i-th note adjacent to v i , and k i is the number of nodes adjacent to v i .

3.1.2. Network Structural Holes

Companies can gain resource advantages in the network not only from their own innovation capabilities but also from their network locations. Social network scholars pay attention to the nature and structure of the network, among which the strength of the relationship and structural holes cannot be ignored. The bonds established between groups and organizations can be strong or weak. Through the transmission of information, weak ties connect multiple groups together, and groups with different hierarchical structures present cohesive characteristics. In theory, only about five individuals can establish a connection between any two individuals, establishing the six degrees of segmentation theory [27]. If no direct relationship exists between two individuals or groups in the social network and there is no indirect redundant relationship between them, then the gap between the two is called a structural hole. The structural hole index of scholars such as Burt [28] combines the effective scale, restrictions, and indicators. The effective size of an actor is equal to the size of the actor’s individual network minus the redundancy of the network, which is the non-redundant factor in the network. Node q is the common adjacent point of v i and v j , p i j represents the weight ratio of v j among all adjacent points of v i , and the effective scale of actor v i and limitation by other nodes are respectively expressed as:
S i = j ( 1 q p q j m j q ) , q i , j
R i j = ( p i j + q p i q p q j ) 2

3.2. Innovation Network Data

PBR is an emerging technological industry and presents a high level of ambiguity and uncertainty. The main body of PBR shows a trend of diversification and large-scale development due to the potential value of the PBR market. The large-scale development of the Chinese PBR industry is relatively late. In 2012, the technical cooperation network of the PBR industry began to take shape. Therefore, in this paper, we consider patent data from 2012 to 2020 divided into three time windows (2012∼2014, 2015∼2017, 2018∼2020). The duration of each time window is 3 years. A search for “power battery recycling”, “battery gradient utilization”, “power battery secondary utilization”, “new energy vehicle battery recycling”, “waste power battery”, “power battery”, “recycling”, and “utilization of power battery” in the Chinese patent full-text database resulted in 7398 related patents. Because the focus of this research is the cooperative innovation behavior of enterprises, through data cleaning and sorting, applicants with two or more patents were included, and individual patents were excluded. As shown in Figure 1, before 2011, there were few patents for PBR technology. Starting in 2012, the number of PBR patents began to increase. With 150 as the demarcation point, the data from 2012 to 2020 were selected as the time window for the PBR cooperative innovation network. The total number of patents shows a rapid growth trend, whereas cooperation shows a gentle growth trend and the growth rate of cooperative patents shows large irregular fluctuations.

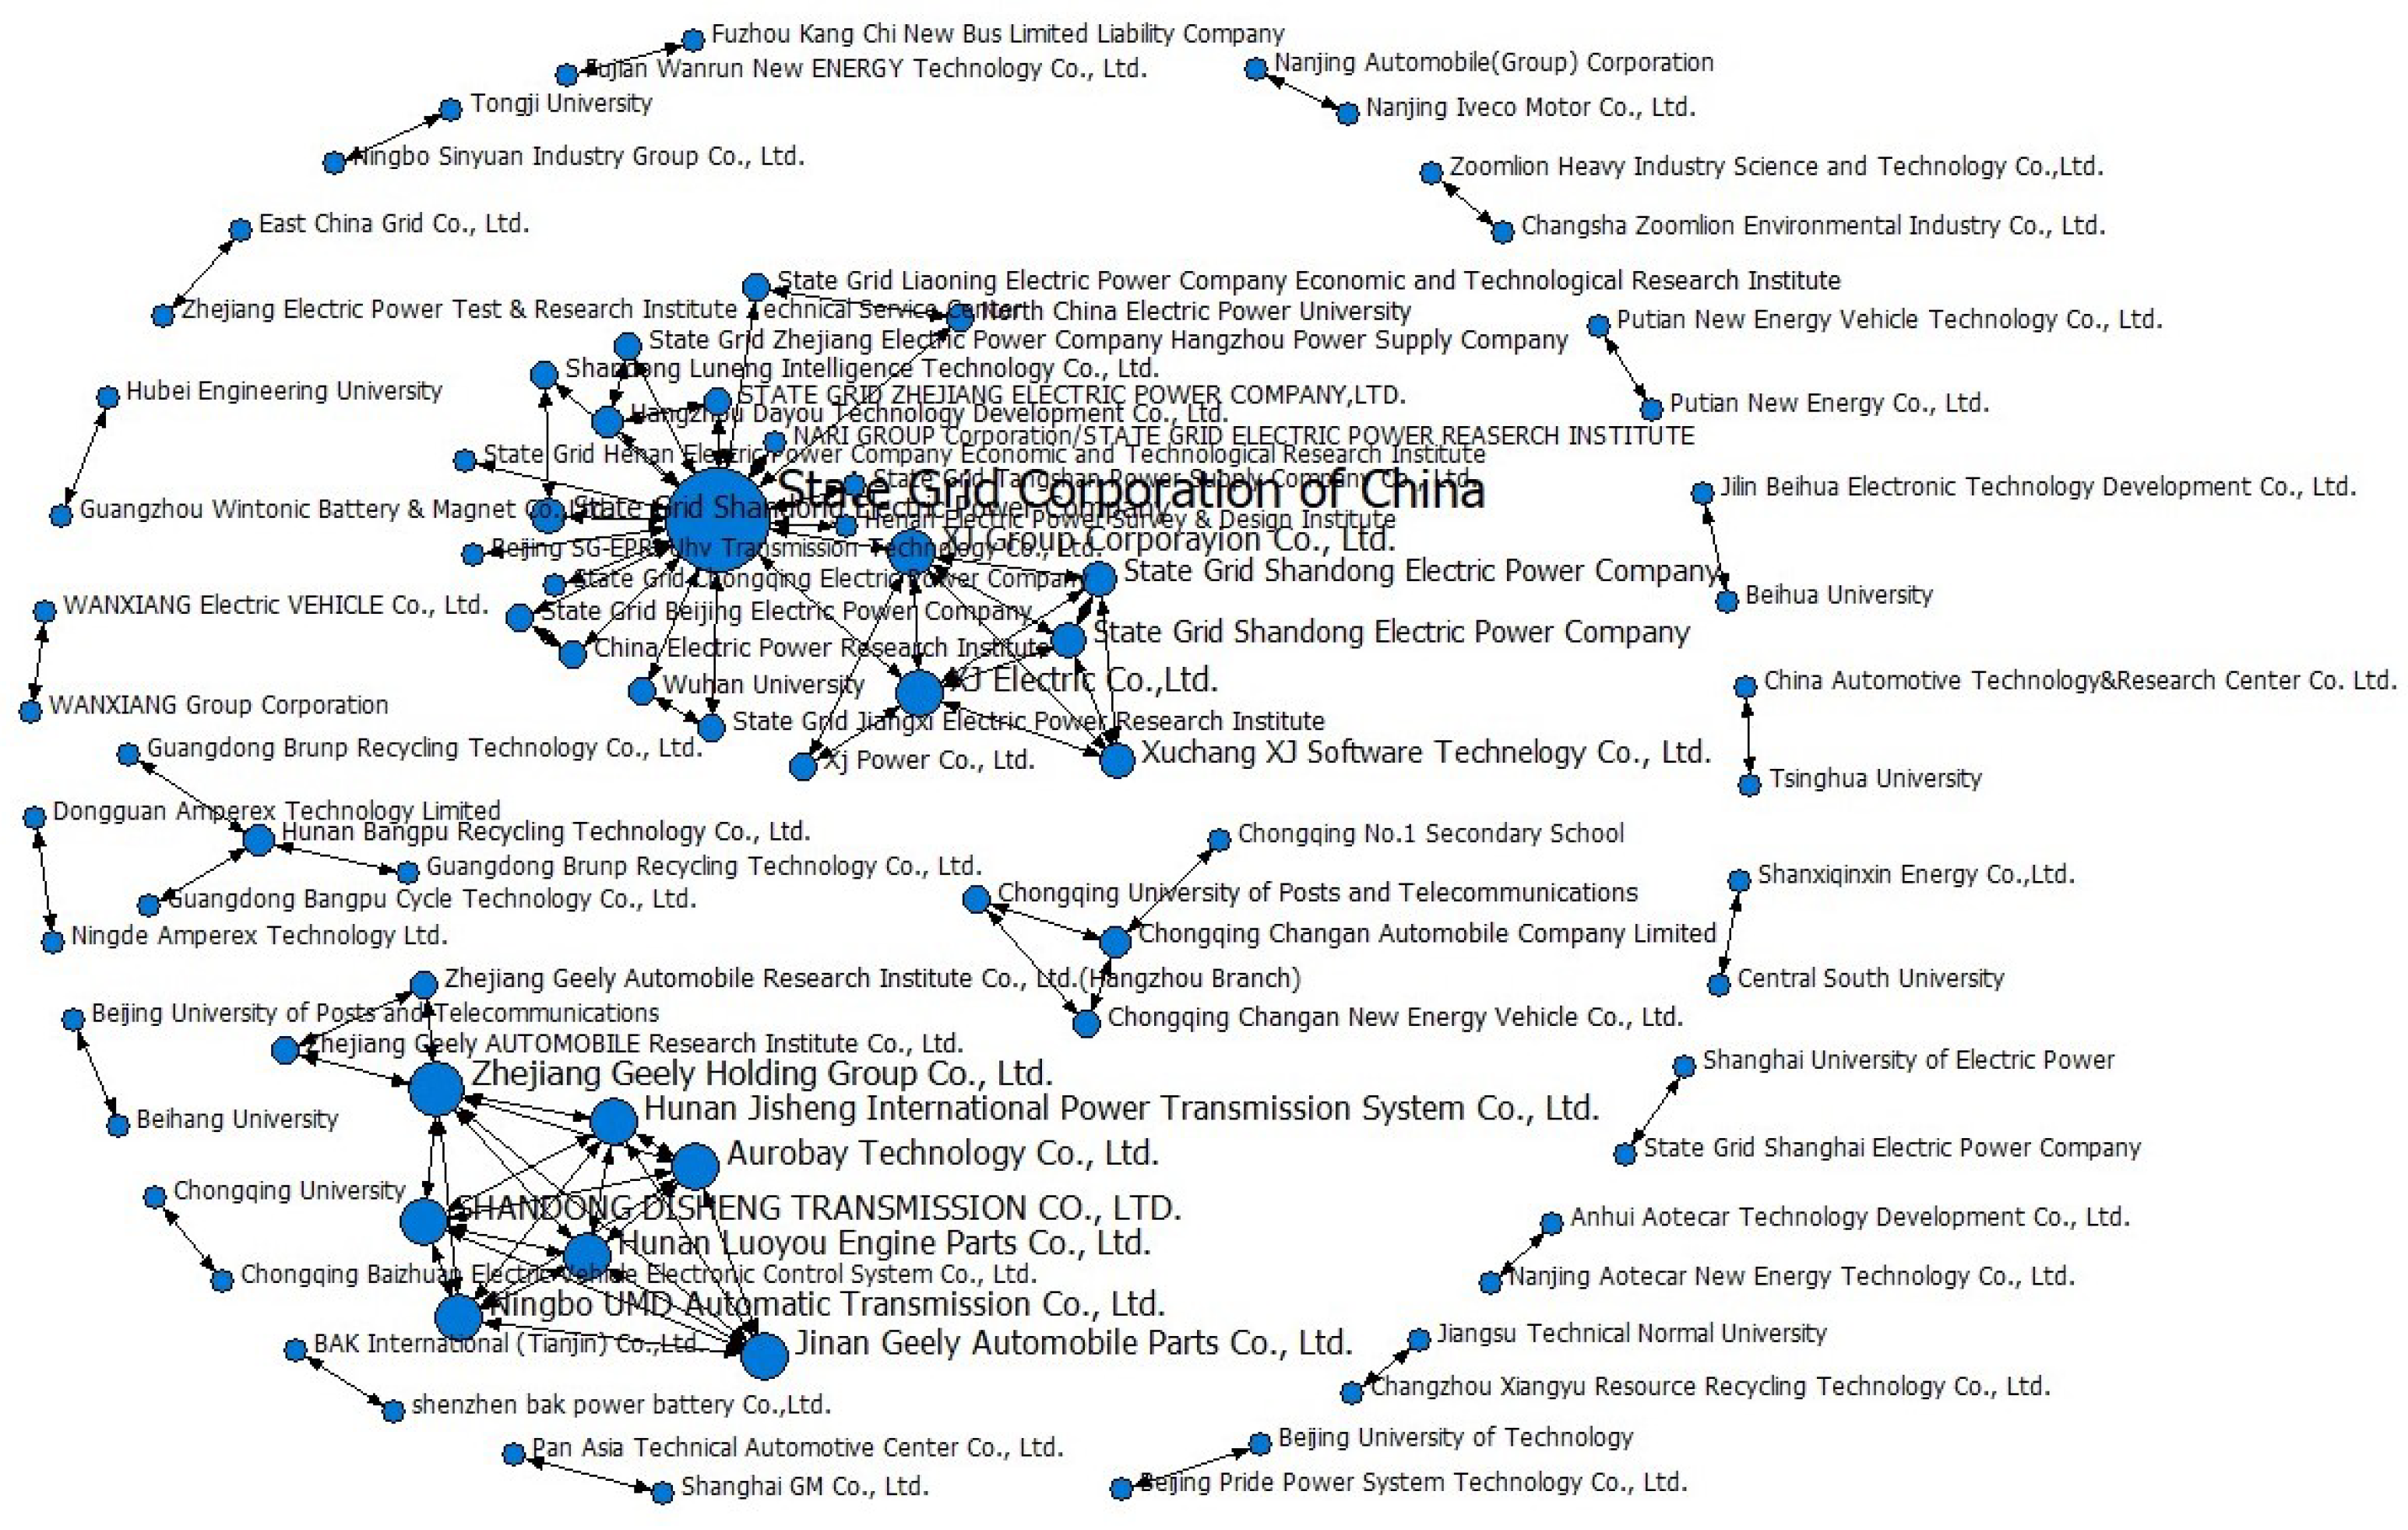
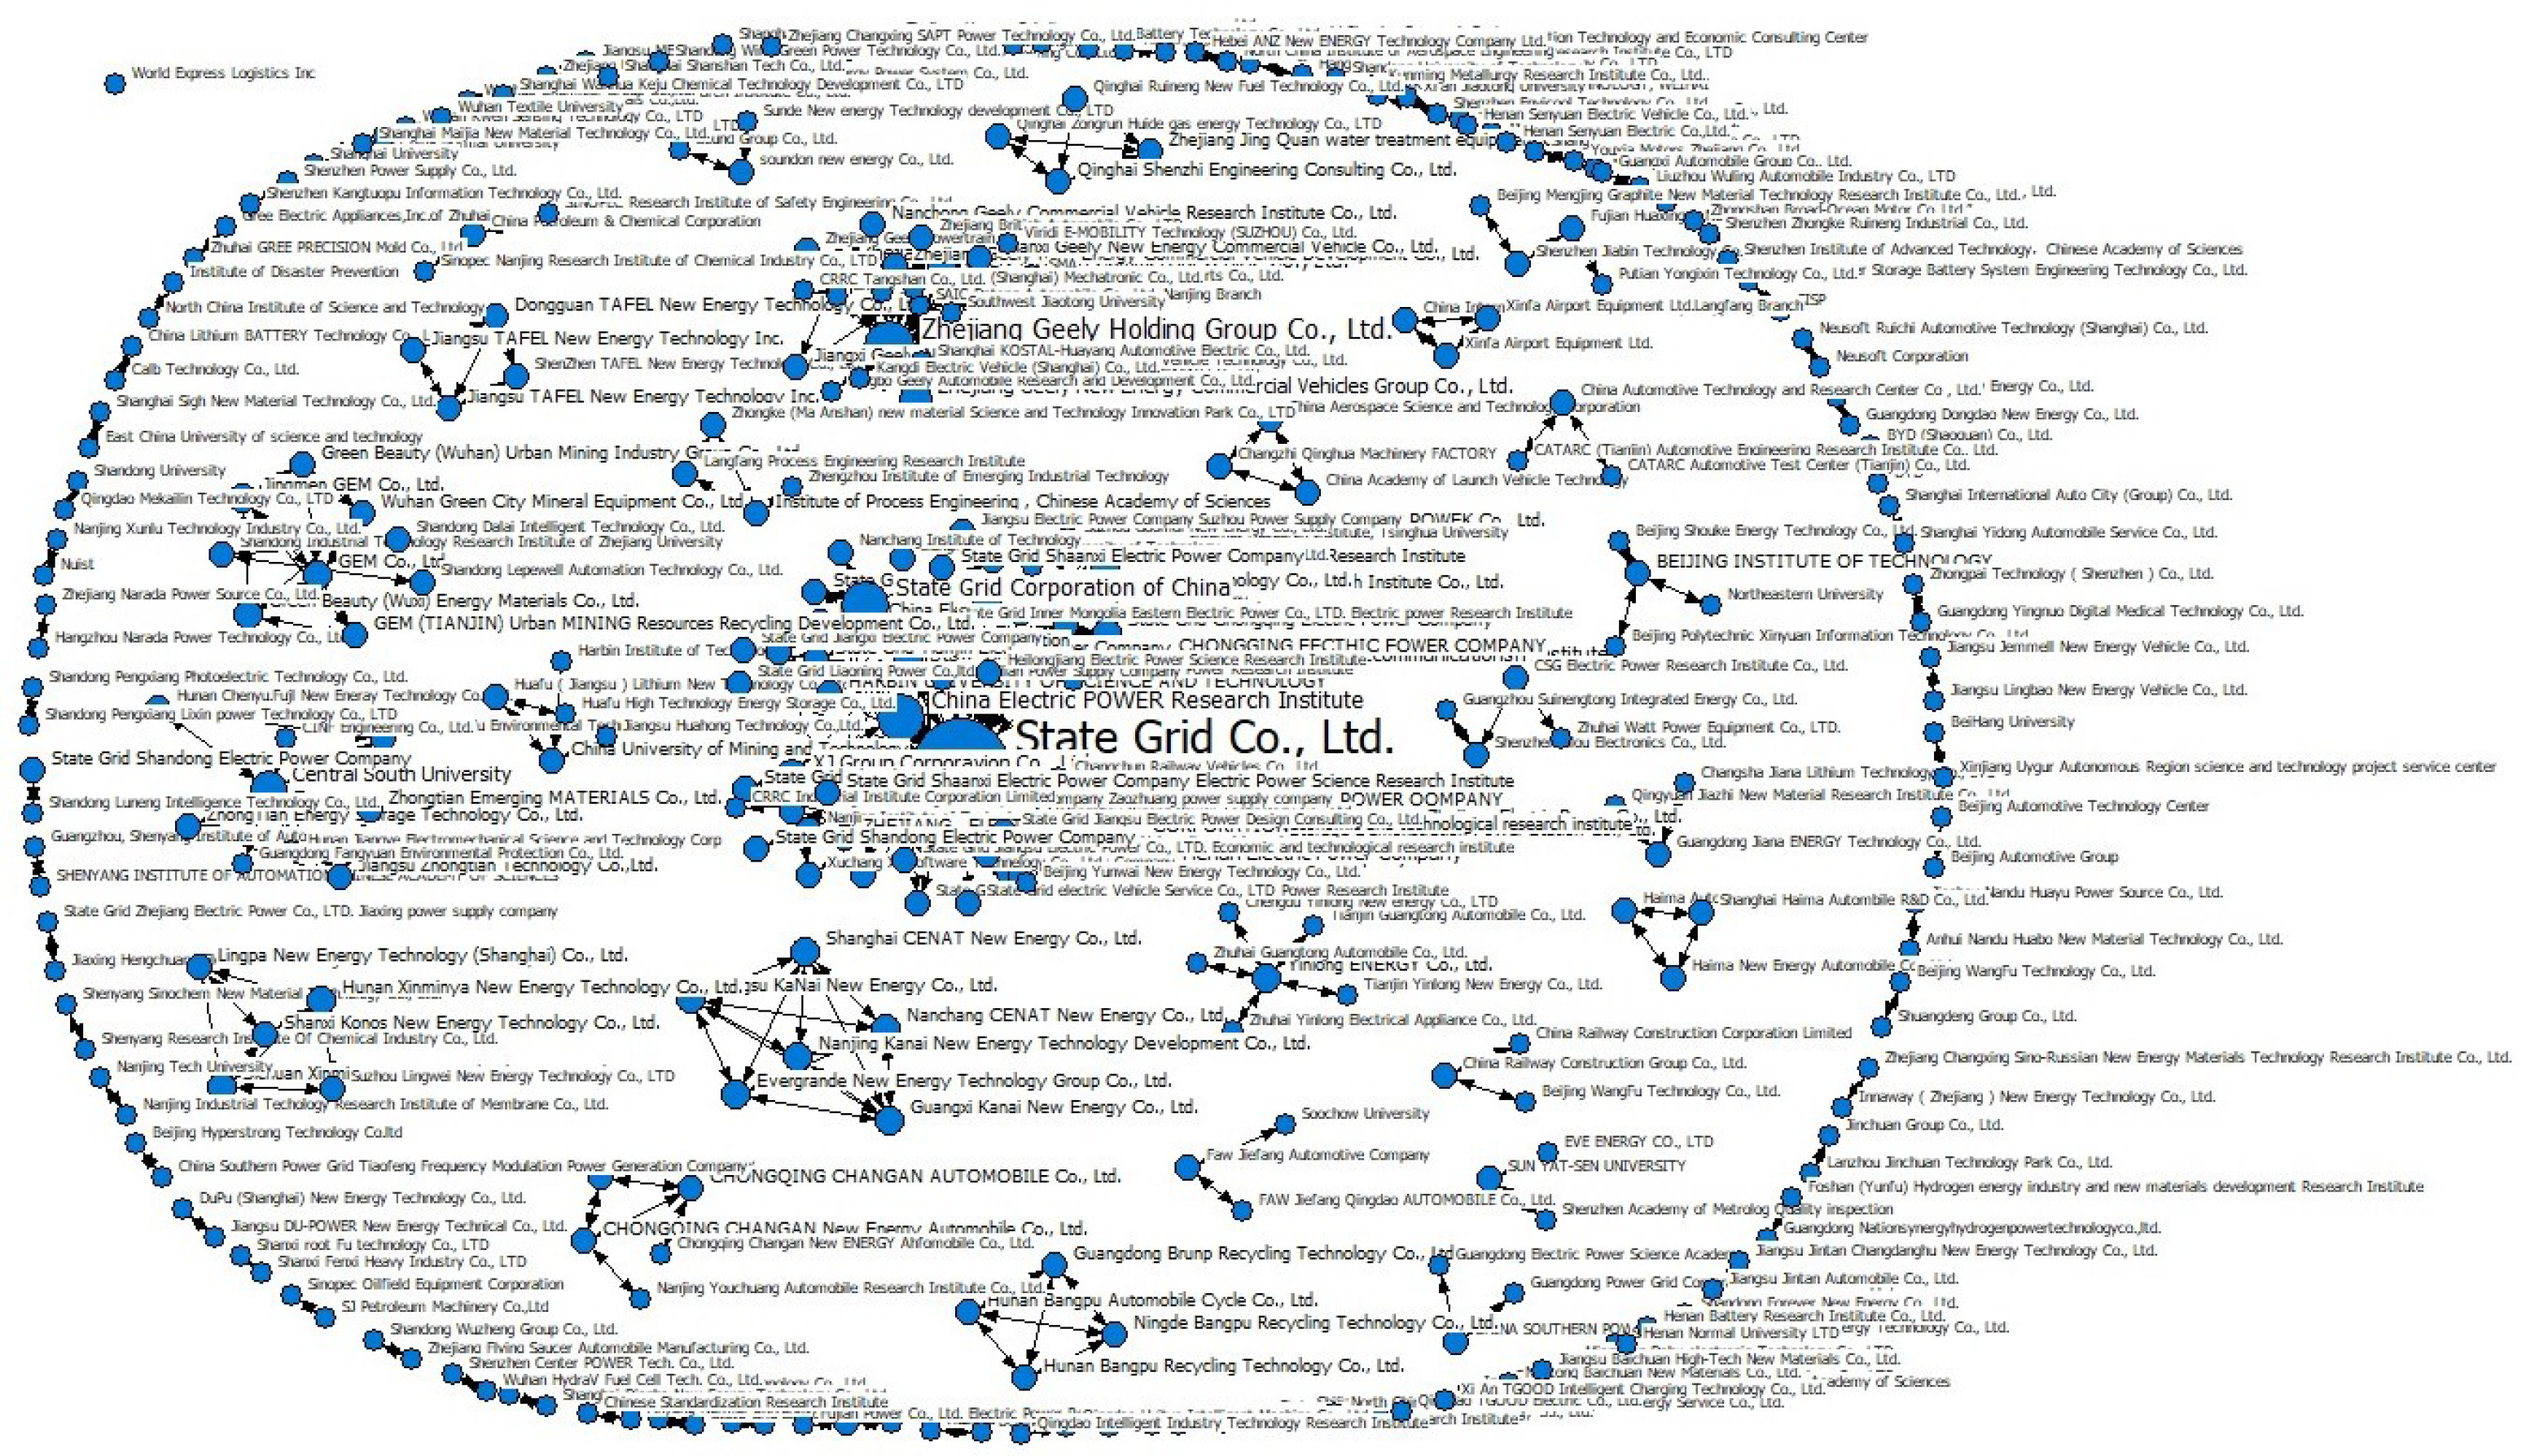
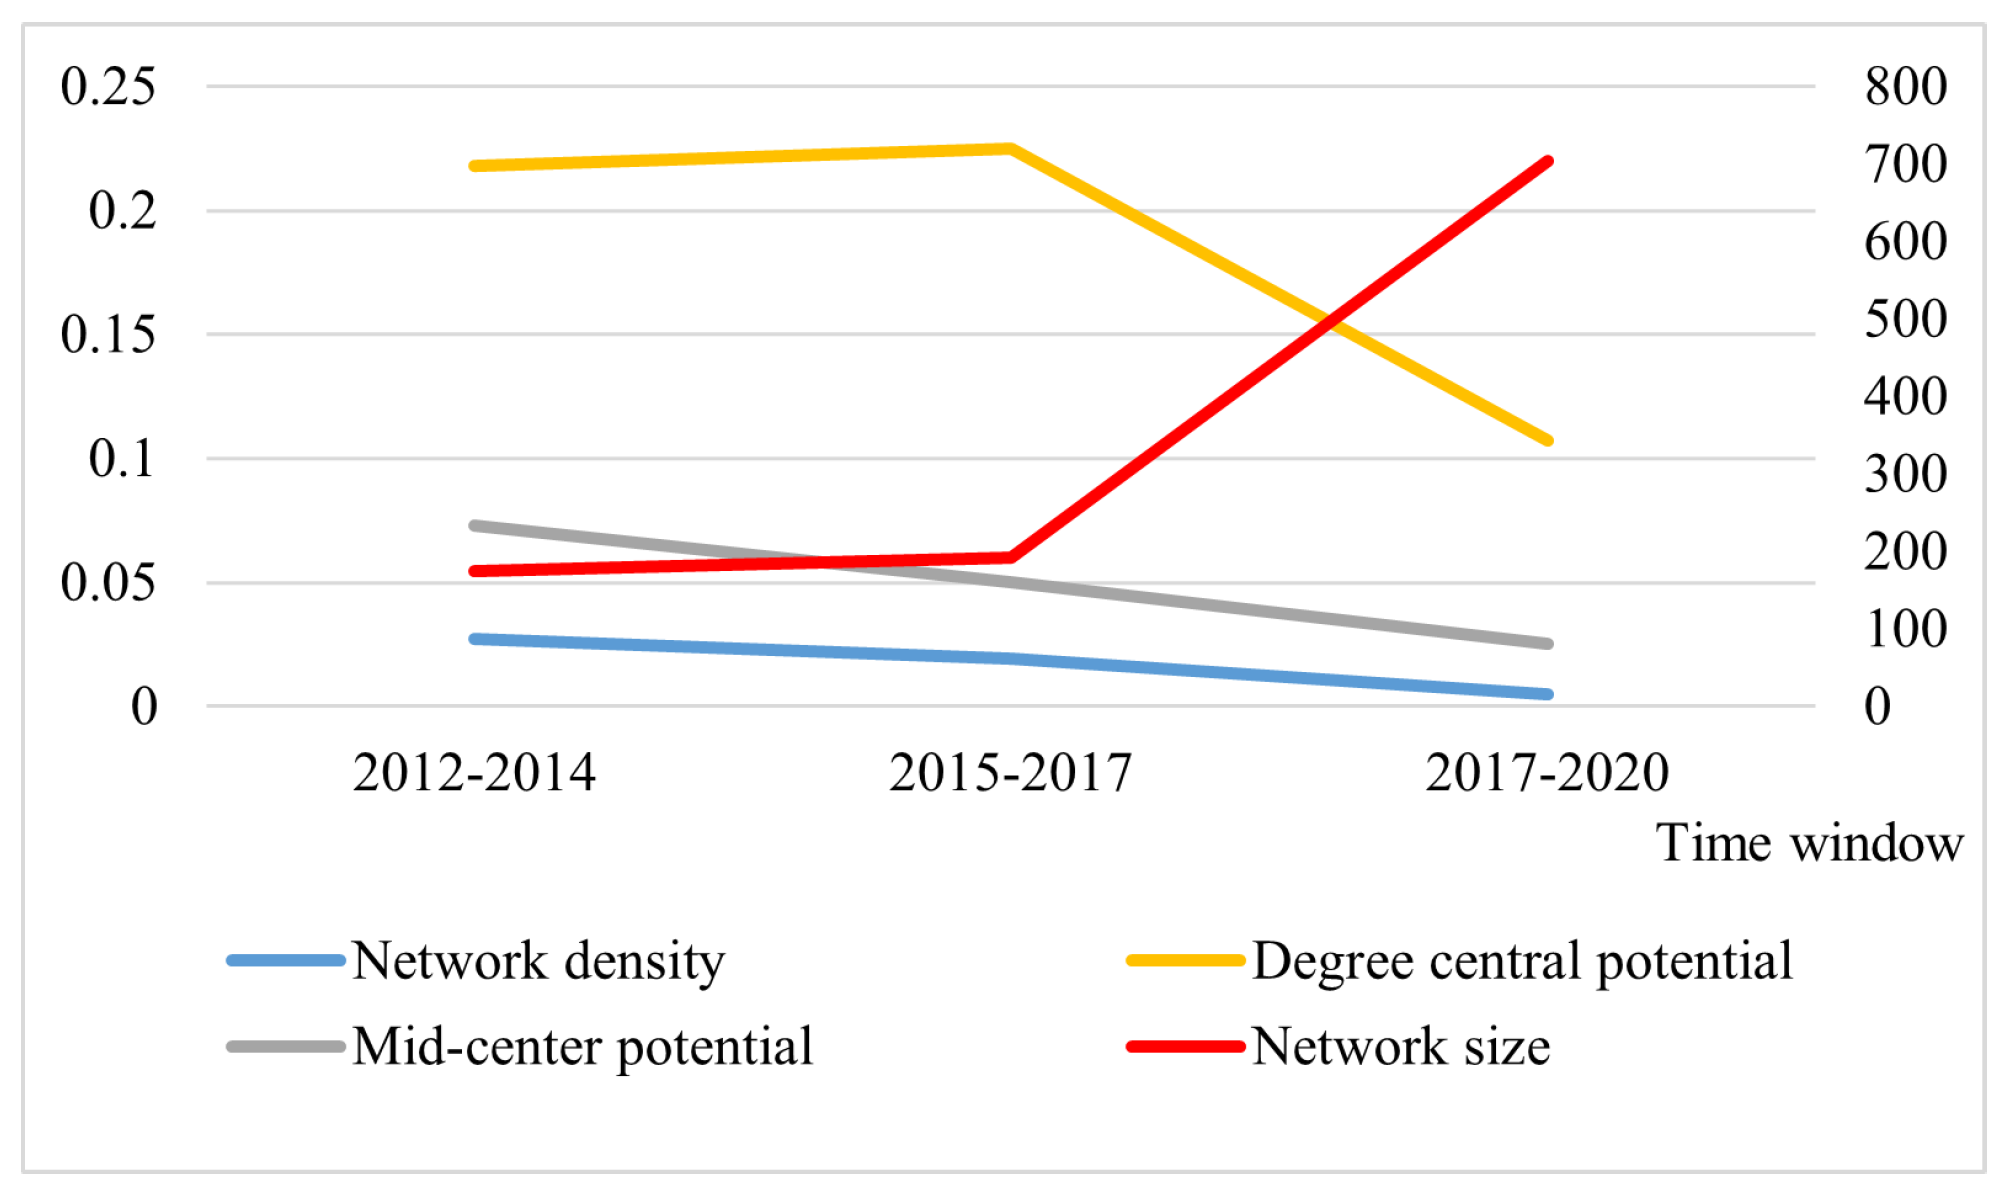
3.3. Overall Network Analysis

The innovation network can effectively reflect the continuity of innovation activities. Samples from 2012 to 2020 were considered, and three patent cooperation relationship matrices were formed. Calculations of the network structure indices were conducted. A network topology structural diagram was generated to obtain the network evolution map. The PBR network evolution maps of technological innovation networks are shown in Figure 2, Figure 3 and Figure 4. Originally, the PBR industry innovation network was small in scale; then, the network scale showed a growth trend that was slow at first, then increased in speed, with a growth rate of 266.67%.
As the size of the network increases, the scale effect becomes significant, and the opportunities for cooperation and communication among nodes within the network increase. Therefore, opportunities for the cooperative innovation of nodes in the network increase. The density of the PBR cooperation innovation network has changed from high to low. This shows that with an increase in the number of nodes in the network, the cooperation between subjects has not increased correspondingly, resulting in a decrease in network density, and the relationship between subjects tends to be decentralized in the network. According to the average distance and clustering coefficient shown in Figure 5, the PBR innovation network has a small-world effect as a whole. The average distance of the PBR network is less than 2.5, and the clustering coefficient is greater than 0.7. From 2012 to 2020, the small-world effect of the PBR network gradually increased. As the number of patent applications increases, the small-world network effect becomes more noticeable.
Network density is generally not the decisive factor, as the relationship model is more important. Although in the past three years (2017–2019), the relationship density of cooperation innovation networks has been decreasing (see Figure 6), the accessibility of relationships is different. The network has had the largest scale in the past three years, whereas the density and cohesion have been the smallest, and the average distance has been the largest, showing that in the past three years, PBR industry knowledge and rights with respect to technology innovation development have been relatively concentrated, the status of the main players in the industry has been uneven, rights and information centers have been present, most innovation subjects have been easily affected by individual subjects, and the network has exhibited a factional structure. The centrality degree shows that although the scale of the network is gradually expanding, the ability of nodes to cooperate with other nodes is reduced, with the network becoming decentralized. From the perspective of centrality degrees, all are above 0.1, indicating that the network maintains a certain concentration degree. The centrality of the network dropped from 0.0729 to 0.0249, indicating that the network’s tendency to concentrate on a certain node is decreasing. In addition, the cohesion index shows a downward trend, indicating that the PBR network information, knowledge, and rights are more concentrated, and the network is vulnerable to and controlled by individual nodes. The cohesion index of the overall network dropped from 0.063 to 0.019.

3.4. Analysis of Structural Holes

In order to further explore the individual characteristics of the nodes of the PBR innovation network, the individual network was applied to analyze the node status. Three time windows were separately intercepted to analyze the activeness, network influence, and resource control of the innovation subject. Judging from the technological cooperation innovation network from 2012 to 2014, State Grid Corporation (“State Grid” for short) and Zhejiang Geely Holding Group Co., Ltd., Hangzhou, China (“Zhejiang Geely”) are in the core position of the PBR technological cooperation innovation network in terms of centrality degree and structural hole indicators. In particular, the centrality degree and the effective scale of the network of the State Grid Corporation are higher than those of other institutions (see Table 1). This indicates that the two companies play a core bridging role in the overall network and that the information and resource control ability of the network is relatively high. However, some nodes in the network have a high degree of centrality, although the intermediate centrality is 0. Most such nodes support companies or subsidiaries with limited resources and an information advantage, becoming non-core nodes of the network.
However, during the 2015–2017 window (see Table A1 in Appendix A), although State Grid and Zhejiang Geely still occupied the core of the network, they exhibited high activity levels, network influence, and resource control. The centrality of Xu Ji Power Co., Ltd., Xuchang, China decreased, and the network restriction increased, indicating that the company’s ability to control resources and information in the network was reduced, gradually approaching the center right, in association with an increase in its ability to cooperate with more influential enterprises in the network. In the PBR technological cooperation innovation network, State Grid has a significant bridge position and influence. The distribution of technological cooperation innovation among enterprises is uneven, and most enterprises are indirectly affected, whereas less other enterprises directly affected.
From the perspective of the last three years (2018–2020), the individual characteristics of the PBR technological cooperation innovation network are determined by standardized processing according to the two types of individual structural hole attribute measurement indicators (see Figure 7). The ranking of State Grid and its subsidiaries is still reliable. Furthermore, the active ability and influence of research institutions and universities became apparent. As a knowledge-intensive industry, PBR technology research institutions and related universities have become active and have managed more resources and information in the innovation network. However, their own average control of resources needs to be strengthened, and such institutions need to become even more active in the industry. Enterprises and core enterprises have engaged in in-depth cooperation. However, a group of power battery production and recycling companies such as GEM Co., Ltd., Shenzhen, China and Yinlong New Energy Co., Ltd., Zhuhai, China have increased their influence on the network. This is an indication that PBR technology is developing rapidly according to the theory of technological innovation, and the corresponding technological achievements are beginning to be applied in enterprises.
In the last three years (see Figure 8), more and more companies have begun to strengthen PBR technical cooperation and technological innovation in their respective fields. The effective scale increase is limited, but they have high structural holes in limited fields. For example, although the effective scale of the State Grid Co., Ltd., Beijing, China is relatively high, the level of network constraint is very low. The fact that state-owned enterprises or state-controlled groups or companies are currently occupying the central position in the Chinese PBR technological cooperation innovation network is an indication of the state’s participation in and support for the construction of the PBR system. At the same time, the corresponding subsidiaries and their affiliated companies also obtain more information and resources through the knowledge and technology spillovers of the parent company, and their activity and influence in the industrial cooperation network continue to increase.

4. Evolutionary Game Analysis on Technological Cooperation Innovation

The technological cooperation innovation behavior of battery recyclers refers to the cooperation and innovation behavior of companies, universities, research institutions, etc., involved in battery dismantling, precious metal recycling, residual assessment, and cascading recycling technology research and development. From the perspective of technological innovation, technological cooperation innovation behavior refers to the realization of complementary advantages, knowledge and resource sharing, and risk sharing to maximize synergistic benefits. Battery and vehicle design strongly affect the technical feasibility of disassembly and optimal utilization at the component level [5]. Existing research shows that the value orientation of the enterprise, the penalty mechanism for breach of contract, cooperation benefits, cooperation cost, the degree of trust, and the level of communication all have a significant impact on the cooperative innovation behavior of an enterprise. These factors affect the stable state of the game of the innovation cooperation subjects but fail to show differences in the behavior of innovative subjects. Previous research has also ignored the influence of knowledge spillovers and small-world network effects on the initial state and evolution game. Research on the game strategy and evolutionary stable state of bounded rational entities in technological innovation cooperation is lacking.

4.1. Evolutionary Game Model and Its Assumptions

The innovative network structure and distribution affect the communication and exchange of the main body. The average distance between the subjects of the small-world network is short, and the clustering coefficient is considerable. Therefore, the efficiency of information transfer between subjects is high, and the efficiency of knowledge transfer and spillover increases. An increase in the degree of agglomeration also further enhances the willingness of the main body to cooperate, promotes technical exchanges and cooperation, and thus reduces the cost of cooperation. According to statistics on PBR technology patents, the main players influencing enterprise innovation cooperation are state-owned enterprises and battery manufacturers. In this paper, we consider two types of innovation cooperation entities for PBR technology cooperation, namely battery recyclers (D) and EV manufacturers (Z). Therefore, the following assumptions are made:
(1) Both enterprises (Z and D) are bounded rationality. Enterprises begin to gradually expand the scope of innovation cooperation and optimize the cooperation innovation network over time, and most enterprises begin to play important intermediary and bridge roles in the innovation cooperation network. When both enterprises (Z and D) choose not to carry out technological cooperation innovation, they can obtain an initial profit of R i ( i = Z ,   D ) > 0 .
(2) In addition to the technologies adopted to dispose of used batteries, the design of recycling networks also has a significant impact on costs and profits. Generally, a recycling technological innovation cooperation network contains a collection center, disassembly center, material recycling center, and waste disposal center. Because transportation between these centers involves costs and carbon emissions, profits can be increased by optimizing the design of the recycling supply chain network. Therefore, the assumption is that the input cost of the EV manufacturer (Z) and the battery recyclers (D) is C i ( i = Z ,   D ) > 0 , including technical input in materials, formulae, specifications, and structures. Due to the small-world network effect, the average distance between enterprises decreases, the degree of agglomeration increases, and the cost of cooperation decreases. Therefore, the small-world effect has a negative impact on the cooperation costs of innovative companies, assuming that both parties can save indirect costs ( b C i ( i = Z ,   D ) ) through cooperative innovation, where b is the small-world coefficient.
(3) When EV manufacturers (Z) and battery recyclers (D) choose technological innovation, both companies can obtain benefits, such as battery echelon utilization and precious metal extraction and recovery. The relevance and deep complementarity of knowledge cooperation are enhanced, and the output of structural holes increases. The enterprises can also obtain increased product sales and policy subsidies as a result of technological upgrades. Assuming that the two companies’ cooperative innovation can create additional benefits of Δ R , the revenue that can be allocated to the EV manufacturer is a Δ R , and the revenue that can be allocated to battery recyclers is ( 1 a ) Δ R .
(4) If EV manufacturers and battery recyclers withdraw halfway, for example, if a non-cooperative party pays the liquidated damages (F) but, due to the knowledge spillover effect, the company that defaults halfway can still obtain additional knowledge spillover income (E). Because the small-world effect affects the efficiency and quality of this knowledge spillover, it is assumed that the party who defaults halfway can harvest the knowledge spillover as b E .
(5) The probability that the EV manufacturer chooses cooperative innovation of PBR technology is x ( 0 x 1 ) , and the probability of not choosing cooperative innovation is ( 1 x ) ; the probability of the battery recyclers choosing cooperative innovation is y ( 0 y 1 ) , and the probability of not choosing cooperative innovation is ( 1 y ) .
Based on the above assumptions and definitions of variables, as well as references [29,30], the resulting game payment matrix of cooperative technology innovation between EV manufacturers and battery recyclers can be constructed (Table 2). The mathematical formulations for the income variables can be found in Appendix C.
The replication dynamic equations of EV manufacturers and battery recyclers are:
F ( x ) = d x d t = x ( U Z 1 U Z ) = x ( 1 x ) ( F C Z + y ( a Δ R + b C Z b E ) ) F ( y ) = d y d t = y ( U D 1 U D ) = y ( 1 y ) ( F C D + x ( ( 1 a ) Δ R + b C D b E ) )

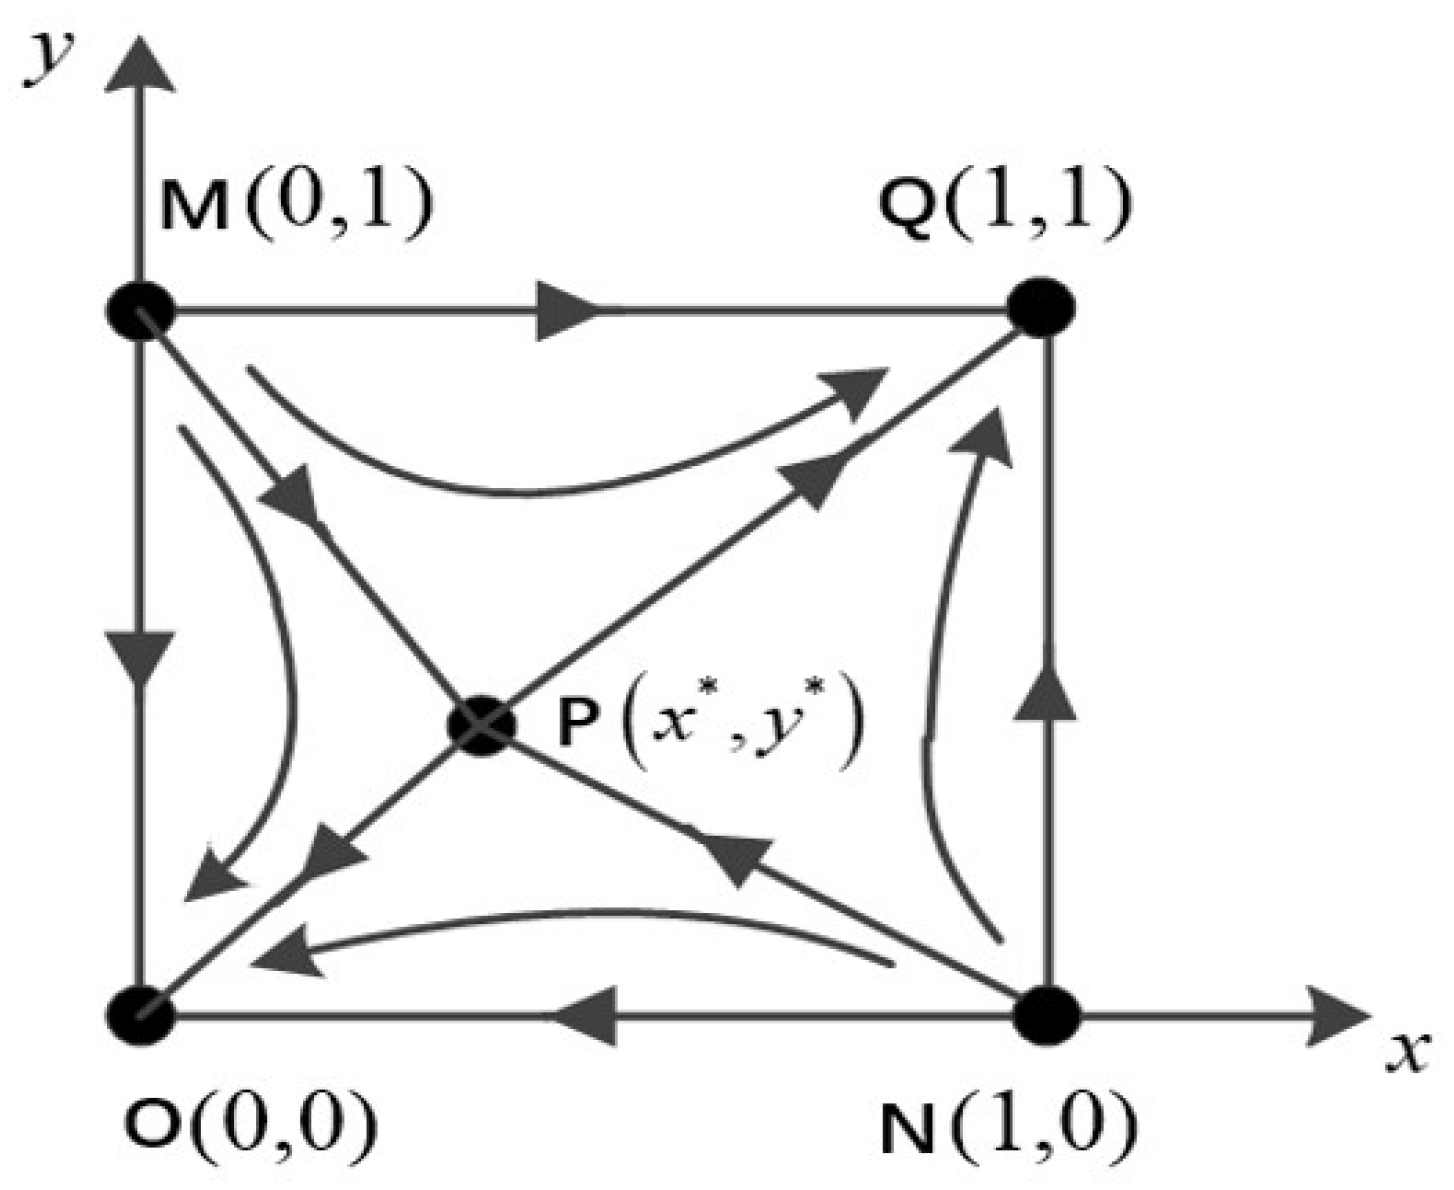
4.2. Evolutionary Game Stable State

After solving the stability point of the cooperative innovation decision results [31], the game equilibrium point is obtained according to the following Equation: ( 0 , 0 ) , ( 1 , 1 ) , ( x * , y * ) , where x * = C D F ( 1 a ) Δ R + b C D b E , y * = C Z F a Δ R + b C Z b E , and 0 x * 1 , 0 y * 1 .
The local stability of the Jacobian matrix is used to analyze the stability of the equilibrium point of the system. The Jacobian matrix of the system is:
J = ( 1 2 x ) ( F C Z + y ( a Δ R + b C Z b E ) ) x ( 1 x ) ( a Δ R + b C Z b E ) y ( 1 y ) ( ( 1 a ) Δ R + b C D b E ) ( 1 2 y ) ( F C D + x ( ( 1 a ) Δ R + b C D b E ) )
The determinant and trace of each equilibrium point are shown in Table 3.
According to the replicator dynamic equation, when x = ( 0 , 1 ) or y * = ( C z F ) / ( a Δ R + b C Z b E ) , the proportion of EV manufacturers choosing cooperative innovation is stable. When y = ( 0 , 1 ) or x * = ( C D F ) / ( ( 1 a ) Δ R + b C D b E ) , the proportion of battery recyclers choosing cooperative innovation is stable. In the plane of R = { ( x , y ) | 0 x 1 ,   0 y 1 } , in accordance with 0 x * = ( C D F ) / ( ( 1 a ) Δ R + b C D b E ) 1 and 0 y * = ( C Z F ) / ( ( 1 a ) Δ R + b C Z b E ) 1 , the available constraints are 0 C D F ( 1 a ) Δ R + b C D b E , and 0 C Z F a Δ R + b C Z b E . Five equilibrium points of the system are analyzed, and the results are shown below in Table 4.
According to the local stability analysis results listed in the table above, there are two stable equilibrium solutions (ESS, O ( 0 , 0 ) ): the EV manufacturer and battery recyclers choose not to cooperate in innovation, or they choose the reverse. Neither M ( 0 , 1 ) nor N ( 1 , 0 ) is a stationary point, and P ( x * , y * ) is a saddle point. The phase diagram of the evolutionary game presented in in Figure 9 shows that after multiple games, three possible results can occur: (1) both the power battery enterprise and the EV manufacturer choose non-cooperative innovation, and O ( 0 , 0 ) is the equilibrium point; (2) both sides choose cooperative innovation, and Q ( 1 , 1 ) is the equilibrium point; or (3) the saddle point is maintained as P ( x * , y * ) . In the regional OMPN, the equilibrium outcome return gradually approaches O ( 0 , 0 ) , that is, EV manufacturers and battery recyclers choose non-cooperative innovation. In the regional MPNQ, the equilibrium outcome gradually approaches Q ( 1 , 1 ) , that is, both sides choose cooperative innovation.

4.3. Evolutionary Game Results

(1) Under the premise of ( 1 a ) Δ R b E + b F > 0 and a Δ R b E + b F > 0 , the greater the cost of cooperative innovation of the EV manufacturer, the greater the possibility that both companies choose non-cooperative innovation. Considering the high cost of cooperation, the two companies tend toward non-cooperation in innovation, which is also confirmed by the small-world network effect. The small-world effect ( b > 0 ) reduces the investment cost ( C i ) of technological innovation between the Z and D; so, the probability of the enterprise choosing innovation cooperation increases. As the cost of cooperative innovation for battery recyclers increases as S O M P N grows, the equilibrium tends toward O ( 0 , 0 ) , with an increased probability that EV manufacturers and battery recyclers choose not to cooperate in innovation (see supplementary proof in Appendix B).
(2) With the increase in additional benefits ( Δ R ) from cooperative innovation, companies on both sides are increasingly inclined to choose cooperative innovation for PBR technology, showing that EV manufacturers and battery recyclers increasingly likely to choose cooperative innovation. Cooperative innovation can obtain higher profits. For example, upgrades in PBR technology increase the efficiency of power battery echelon utilization and the recovery of precious metals. Therefore, both companies tend to choose cooperative innovation.
(3) The characteristics of a small-world network have a double-edged sword effect on technological cooperation innovation. If C i E < 0 , as b increases, both enterprises tend to cooperatively innovate, and the small-world network effect is enhanced. In other words, the average path of cooperation subjects becomes shorter, but the agglomeration coefficient increases. From the perspective of the individual, the increased relevance and deep complementarity of knowledge cooperation are sufficient to make up for the input cost of technological cooperation innovation, and the additional benefits brought about by the output of structural holes increase. If C i E > 0 , that is, if the small-world network effect is enhanced, the input cost of cooperative innovation is greater than the knowledge spillover income, and EV manufacturers and battery recyclers tend to not cooperate in innovation.
(4) From the perspective of the evolution of the overall innovation network, with an increase in the small-world coefficient (b), as the area of S O M P N increases, the system tends toward O ( 0 , 0 ) , and the probability of EV manufacturers and battery recyclers choosing non-cooperative innovation increases. Because the cost of cooperative innovation is higher than that of the knowledge spillover effect, one party enterprise can obtain indirect profits through knowledge spillover effects without choosing cooperative innovation. Furthermore, the high costs of cooperative innovation do not need to be incurred, so they can obtain higher “information interests” and “control interests” in the PBR network, enabling parties to be more competitive than other members in the network and leading to an increased degree of structural holes. However, the stronger the small-world effect, the more profit the non-cooperative side generates. In this way, the system evolves to O ( 0 , 0 ) , and firms become more inclined to engage in non-cooperative innovation. When C i E < 0 , with the growth of small-world effect (b), the area of S O M P N decreases. The probability of EV manufacturers and battery recyclers choosing cooperative innovation increases. Because the cost input of cooperative innovation is less than that of the spillover effect, both enterprises tend to adopt cooperative innovation.
(5) With an increase in the knowledge spillover effect in the innovation network, enterprises are increasingly inclined to choose non-cooperative innovation PBR technology. The probability of EV manufacturers and battery recyclers choosing non-cooperative innovation increases. The enhancement of the knowledge spillover effect generates more indirect profit for the non-cooperative innovation side. Free rider problems and opportunism can boost the profits of the non-cooperative side, so the game evolution of the two enterprises tends to favor non-cooperative innovation.

5. Conclusions and Implications

In this paper, we extend the application of innovation network structure in evolutionary economics theory, emphasizing the moderating role of network embedding in organizational collaborative innovation and game activities. A novel evolutionary game model of technological cooperation innovation between EV manufacturers and battery recyclers is proposed. According to the technology cooperation innovation patent data of battery recyclers, the characteristics of network evolution were studied in stages from two perspectives: the small-world effect of the overall network and the individual structural attributes. The evolutionary game model of technological cooperation innovation was adopted to analyze the individual income characteristics and the technological cooperation mechanism of enterprises based on innovation input costs, opportunity benefits, and knowledge spillover effects. The analysis also considered the influence of these factors on the technological cooperation innovation of enterprises based on the network evolution characteristics of the PBR industry.
In this paper, we constructed a PBR technology cooperation innovation network to analyze its characteristics and used evolutionary game theory to construct an “EV manufacturers–battery recyclers” technology cooperation innovation game model. The objective was to promote the cooperation and innovation of recycling technology by battery recyclers. Our analysis yields the following four specific implications.
First, an increase in the special funds for joint research on major projects of PBR technology is recommended. Government departments can provide financial subsidies to encourage EV manufacturers and battery recyclers to cooperate and innovate on PBR technologies and ensure the smooth progress of the cooperative innovation process. In the evolutionary game model, increased R&D costs reduced the willingness of EV manufacturers and battery recyclers to cooperate and innovate. Considering the high complexity of PBR technology, human resources and a large amount of funds need to be invested in the early stage of R&D. R&D for power PBR technology is also associated with certain safety risks. The high R&D costs and safety risks imposed by technology are a burden on enterprises, making innovation difficult.
Second, a cooperation platform should be established between EV manufacturers and battery recyclers to promote the clustered development of battery recyclers, giving full play to the advantages of a waste battery recycling management center to increase the intensity of its regulation and improve the regulatory system. The small-world effect of the innovation network promotes the cooperation willingness of innovation entities ( b > 0 , and C i decreases). Due to the long average distance between enterprises and the low degree of aggregation, problems such as information asymmetry and low information circulation efficiency between EV manufacturers and battery recyclers are encountered. Resource sharing and complementary advantages can establish a cooperation platform between EV manufacturers and battery enterprises, promote the clustering of battery recyclers to shorten the average distance, enhance their aggregation, compensate for investment costs, optimize vehicle costs of enterprises through small-world networks and knowledge spillover effects, and promote synergistic benefits and cooperation willingness. Such advantages can be achieved through cooperation platforms of industrial clusters to improve the synergistic innovation and R&D capabilities of enterprises. The dynamic evolution of network embedding and the negative effects of knowledge spillover should also be considered in order to avoid potential evolutionary equilibrium strategies ( O ( 0 , 0 ) ).
Third, the patent technology protection system should be improved so that the R&D results can be effectively protected, with vigorous promotion to support popular awareness of intellectual property protection, in addition to encouraging battery recyclers to actively participate in market-downstream technological innovation. PBR is a knowledge-intensive industry with high technical barriers in which patent protection plays an important role. The results of the evolutionary game show that some enterprises can easily own the fruits of an innovative enterprise’s labor due to the negative impact of the knowledge spillover effect. Such behavior reduces the willingness of innovative entities to cooperate and innovate. Therefore, the patent protection system must be improved in order to reduce the negative impact of the knowledge spillover effect and protect the patent achievements of innovation entities. R&D entities would then be able to obtain appropriate returns to encourage enterprises to carry out the technological innovation of PBR. Such changes would also improve the structural hole level of some dominant nodes to prevent inbreeding and faction prosperity.
In addition to the issues already addressed in this paper, the following issues require further research. First, in this article, we only extracted the small-world effect and structural hole attributes of the PBR innovation network as the embedding features of a network structure and analyzed their moderating effects on the technological innovation game between vehicle manufacturers and battery recyclers. In the future, further analysis will be conducted on the effects of other features on the benefits of synergistic innovation among enterprises. Secondly, the PBR innovation network data used in this study were patent data from 2012 to 2020, with a lag in terms of technological innovation effects. Therefore, no dynamic change or real-time impact on the benefits of synergy cooperation among enterprises was observed. In this study, we only used theoretical analysis to analyze the game of enterprise synergy innovation and did not conduct a simulation. In the future, simulation verification will be conducted on the benefits of enterprise synergistic innovation to enhance the analysis effect.

Author Contributions

Conceptualization, S.Y. and D.Y.; methodology, L.W. and S.Y.; software, L.W. and D.Y.; validation, S.Y., L.W. and D.Y.; data curation, L.W.; writing—original draft preparation, S.Y., L.W. and D.Y.; visualization, L.W. and D.Y. All authors have read and agreed to the published version of the manuscript.

Funding

This research was funded by the Philosophy and Social Sciences Foundation of Zhejiang Province (grant number 20NDQN297YB), the Fundamental Research Funds for the Provincial Universities of Zhejiang (grant number 2021YW57), the Major Humanities and Social Sciences Research Projects in Zhejiang higher education institutions (grant number 2023QN120), and the Humanities and Social Sciences Youth Project of the Ministry of Education (grant number 22YJC630187).

Institutional Review Board Statement

Not applicable.

Informed Consent Statement

Not applicable.

Data Availability Statement

The data can be download from https://github.com/Yu123456/data_yao, accessed on 19 August 2022.

Conflicts of Interest

The authors declare no conflict of interest.

Appendix A

Table A1. Ranking of individual characteristics of the PBR technology innovation and cooperation network in 2015–2017.
RankInstitutionDegree CentralityMiddle CentralityNetwork SizeNetwork Restriction
1State Grid Corporation, Beijing, China2425022.3330.105
2Zhejiang Geely Holding Group Co., Ltd., Hangzhou, China51050.2
3China Electric Power Research Institute, Beijing, China522.60.594
4State Grid Jibei Electric Power Co., Ltd., Beijing, China52.530.588
Electric Power Research Institute, Beijing, China
5Wanxiang Group, Hangzhou, China43.530.535
6Shandong Luneng Intelligent41.52.50.684
Technology Co., Ltd., Jinan, China
7Xu Ji Electric Co., Ltd., Xuchang, China4010.766
8Economic and Technical Research Institute of State Grid Jiangsu Electric Power Company, Nanjing, China4010.766

Appendix B

(1) Under the premise of ( 1 a ) Δ R b E + b F > 0 , a Δ R b E + b F > 0 , the greater the input cost ( C i ), the greater the probability that the two companies choose not to cooperate in innovation. According to S O M P N Δ C D = ( 1 a ) Δ R b E + b F ( ( 1 a ) Δ R + b C D b E ) 2 , while ( 1 a ) Δ R b E + b F > 0 , then S O M P N Δ C D > 0 , and this function is a monotonically increasing function.
(2) According to the conditions 0 C D F ( 1 a ) Δ R + b C D b E , 0 C Z F a Δ R + b C Z b E , then S O M P N Δ R = ( C D F ) ( 1 a ) ( ( 1 a ) Δ R + b C D b E ) 2 + ( C Z F ) a ( a Δ R + b C Z b E ) 2 < 0 , which is monotonically decreasing. With the increase in Δ R , the area of S O M P N decreases, and the system evolves to Q ( 1 , 1 ) .
(3) The derivation of b is S O M P N b = ( C D F ) ( C D E ) ( ( 1 a ) Δ R + b C D b E ) 2 + ( C Z F ) ( C Z E ) ( a Δ R + b C Z b E ) 2 , as C i F 0 , if C i E > 0 , then S O M P N b > 0 , which is a monotonically increasing function. Otherwise, if C i E < 0 , then S O M P N b < 0 , which is a monotonically decreasing function. With the growth of the small-world effect (b), the area of S O M P N shrinks, and the system evolves towards M ( 1 , 1 ) .
(4) With a derivation of knowledge spillover effect (E), S O M P N E =   ( C D F ) b ( ( 1 a ) Δ R + b C D b E ) 2 + ( C Z F ) b ( a Δ R + b C z b E ) 2 , as C i F 0 , and b > 0 ; then, S O M P N E > 0 , which is monotonically increasing. As the knowledge spillover effect (E) in the innovation network increases, so does the area of S O M P N , and the system evolves toward O ( 0 , 0 ) .

Appendix C

The benefit for EV manufacturers that choose the cooperation strategy is:
U Z 1 = y ( R Z C Z + a Δ R + b C Z ) + ( 1 y ) ( R Z C Z + F ) = R Z C Z + F + y ( a Δ R + b C Z F ) .
The benefit for EV manufacturers that choose the non-cooperative strategy is:
U Z 2 = y ( R Z F + b E ) + ( 1 y ) R Z = R Z + y ( b E F ) .
The average income of an EV manufacturer is:
U Z = x U Z 1 + ( 1 x ) U Z 2 .
The benefit for battery recyclers that choose the cooperative strategy is:
U D 1 = x ( R D C D + ( 1 a ) Δ R + b C D ) + ( 1 x ) ( R D C D + F ) = R D C D + F + x ( ( 1 a ) Δ R + b C D F ) .
The income of battery recyclers that choose a non-cooperative strategy is:
U D 2 = x ( R D F + b E ) + ( 1 x ) R D = R D + x ( b E F ) .
The average income of battery recyclers is:
U D = y U D 1 + ( 1 y ) U D 2 .
The replication dynamic equations of EV manufacturers and battery recyclers are:
F ( x ) = d x d t = x ( U Z 1 U Z ) = x ( 1 x ) ( U Z 1 U Z 2 ) = x ( 1 x ) ( F C Z + y ( a Δ R + b C Z b E ) ) F ( y ) = d y d t = y ( U D 1 U D ) = y ( 1 y ) ( U D 1 U D 2 ) = y ( 1 y ) ( F C D + x ( ( 1 a ) Δ R + b C D b E ) ) .

References

  1. Loganathan, M.; Anandarajah, G.; Tan, C.; Msagati, T.A.; Das, B.; Hazarika, M. Review and selection of recycling technology for lithium-ion batteries made for EV application-A life cycle perspective. In Proceedings of the IOP Conference Series: Earth and Environmental Science, Osun State, Nigeria, 28 November–1 December 2022; IOP Publishing: Bristol, UK, 2022; Volume 1100, p. 012011. [Google Scholar]
  2. Wang, L.; Wang, X.; Yang, W. Optimal design of electric vehicle battery recycling network–From the perspective of electric vehicle manufacturers. Appl. Energy 2020, 275, 115328. [Google Scholar] [CrossRef]
  3. Heelan, J.; Gratz, E.; Zheng, Z.; Wang, Q.; Chen, M.; Apelian, D.; Wang, Y. Current and prospective Li-ion battery recycling and recovery processes. JOM 2016, 68, 2632–2638. [Google Scholar] [CrossRef]
  4. Loganathan, M.; Mishra, B.; Tan, C.M.; Kongsvik, T.; Rai, R. Multi-Criteria decision making (MCDM) for the selection of Li-Ion batteries used in electric vehicles (EVs). Mater. Today Proc. 2021, 41, 1073–1077. [Google Scholar] [CrossRef]
  5. Thompson, D.L.; Hartley, J.M.; Lambert, S.M.; Shiref, M.; Harper, G.D.; Kendrick, E.; Anderson, P.; Ryder, K.S.; Gaines, L.; Abbott, A.P. The importance of design in lithium ion battery recycling—A critical review. Green Chem. 2020, 22, 7585–7603. [Google Scholar] [CrossRef]
  6. Degbey, W.; Pelto, E. Cross-border M&A as a trigger for network change in the Russian bakery industry. J. Bus. Ind. Mark. 2013, 28, 178–189. [Google Scholar]
  7. Loganathan, M.; Tan, C.M.; Mishra, B.; Msagati, T.A.; Snyman, L.W. Review and selection of advanced battery technologies for post 2020 era electric vehicles. In Proceedings of the 2019 IEEE Transportation Electrification Conference (ITEC-India), Bengaluru, India, 17–19 December 2019; pp. 1–5. [Google Scholar]
  8. Zhang, C.; Liao, Q.; Lu, L.; Fei, P. Development Report of Lithium Battery Recycling Industry. High-Technol. Commer. 2019, 36–45. [Google Scholar]
  9. Wu, F.; Wang, H.; Lai, L. Research on Patent Competition Situation of New Energy Vehicle Power Battery Technology. Auto Ind. Res. 2020, 54–57. [Google Scholar]
  10. Li, S. Prosperity Crisis of China’s New Energy Automobile Industry-Based on Patent Analysis. Mark. Mod. 2014, 30, 256–259. [Google Scholar]
  11. Zhang, Y. Association Study on Policy and Technological Innovation—Take the Field of Electric Vehicle Power Battery as Example. China Invent. Pat. 2019, 16, 22–35. [Google Scholar]
  12. Mu, D.; Yang, J.; Li, X. The influence of enterprise cooperation within closed-loop supply chain on power battery recovery and recycling of new energy vehicles. Supply Chain. Manag. 2021, 1, 54–67. [Google Scholar]
  13. Sun, H.; Geng, Y.; Hu, L.; Shi, L.; Xu, T. Measuring China’s new energy vehicle patents: A social network analysis approach. Energy 2018, 153, 685–693. [Google Scholar] [CrossRef]
  14. Gu, X.; Ieromonachou, P.; Zhou, L.; Tseng, M.L. Developing pricing strategy to optimise total profits in an electric vehicle battery closed loop supply chain. J. Clean. Prod. 2018, 203, 376–385. [Google Scholar] [CrossRef]
  15. Glöser-Chahoud, S.; Huster, S.; Rosenberg, S.; Baazouzi, S.; Kiemel, S.; Singh, S.; Schneider, C.; Weeber, M.; Miehe, R.; Schultmann, F. Industrial disassembling as a key enabler of circular economy solutions for obsolete electric vehicle battery systems. Resour. Conserv. Recycl. 2021, 174, 105735. [Google Scholar] [CrossRef]
  16. Kannan, G.; Sasikumar, P.; Devika, K. A genetic algorithm approach for solving a closed loop supply chain model: A case of battery recycling. Appl. Math. Model. 2010, 34, 655–670. [Google Scholar] [CrossRef]
  17. Li, L.; Dababneh, F.; Zhao, J. Cost-effective supply chain for electric vehicle battery remanufacturing. Appl. Energy 2018, 226, 277–286. [Google Scholar] [CrossRef]
  18. Liu, S.; Gong, D. Modelling and simulation on recycling of electric vehicle batteries–using agent approach. Int. J. Simul. Model. 2014, 13, 79–92. [Google Scholar] [CrossRef]
  19. Li, X.; Mu, D.; Du, J.; Cao, J.; Zhao, F. Game-based system dynamics simulation of deposit-refund scheme for electric vehicle battery recycling in China. Resour. Conserv. Recycl. 2020, 157, 104788. [Google Scholar] [CrossRef]
  20. Shi, X.; Jing, R.; Hou, G.M.; Wang, J.P. Network position advantage and technological innovation of China’s new energy vehicle based on the perspective of network theory. Sustainability 2019, 11, 2098. [Google Scholar] [CrossRef]
  21. Tang, Y.; Zhang, Q.; Li, Y.; Li, H.; Pan, X.; Mclellan, B. The social-economic-environmental impacts of recycling retired EV batteries under reward-penalty mechanism. Appl. Energy 2019, 251, 113313. [Google Scholar] [CrossRef]
  22. Zhao, D.; Ji, S.F.; Wang, H.P.; Jiang, L.W. How do government subsidies promote new energy vehicle diffusion in the complex network context? A three-stage evolutionary game model. Energy 2021, 230, 120899. [Google Scholar] [CrossRef] [PubMed]
  23. Zhu, Q.H.; Dou, Y.J. Evolutionary game model between governments and core enterprises in greening supply chains. Syst. Eng.-Theory Pract. 2007, 27, 85–89. [Google Scholar] [CrossRef]
  24. Li, X.; Mu, D.; Du, J. Multi-channel recycling decisions of electric vehicle battery based on SD-dynamic game model. In Proceedings of the 2018 15th International Conference on Service Systems and Service Management (ICSSSM), Hangzhou, China, 21–22 July 2018; pp. 1–6. [Google Scholar]
  25. Wang, C.; Liu, J. Evolutionary game analysis of recycling management of waste power batteries of new energy vehicles. In Proceedings of the IOP Conference Series: Earth and Environmental Science, Chengdu, China, 23–25 April 2021; IOP Publishing: Bristol, UK, 2021; Volume 766, p. 012077. [Google Scholar]
  26. Watts, D.J.; Strogatz, S.H. Collective dynamics of ‘small-world’ networks. Nature 1998, 393, 440–442. [Google Scholar] [CrossRef] [PubMed]
  27. Watts, D.J. Networks, dynamics, and the small-world phenomenon. Am. J. Sociol. 1999, 105, 493–527. [Google Scholar] [CrossRef]
  28. Burt, R.S. Structural Holes: The Social Structure of Competition; Harvard University Press: Cambridge, MA, USA, 1995. [Google Scholar]
  29. Wang, R.; Lv, Y.; Duan, M. Evolutionary game of inter-firm knowledge sharing in innovation cluster. Evol. Syst. 2017, 8, 121–133. [Google Scholar] [CrossRef]
  30. Smith, J.M.; Price, G.R. The logic of animal conflict. Nature 1973, 246, 15–18. [Google Scholar] [CrossRef]
  31. Taylor, P.D.; Jonker, L.B. Evolutionary stable strategies and game dynamics. Math. Biosci. 1978, 40, 145–156. [Google Scholar] [CrossRef]
Figure 1. Trends in the number of patent applications for PBR technology.
Sustainability 15 13726 g001
Figure 2. Evolutionary map of the innovation network in for 2012–2014.
Sustainability 15 13726 g002
Figure 3. Evolutionary map of the innovation network for 2015–2017.
Sustainability 15 13726 g003
Figure 4. Evolutionary map of the innovation network for 2018–2020.
Sustainability 15 13726 g004
Figure 5. Overall attributes of the PBR network.
Sustainability 15 13726 g005
Figure 6. Individual attributes of the PBR network.
Sustainability 15 13726 g006
Figure 7. 2018–2020 individual characteristics ranking of the PBR technological cooperation innovation network.
Sustainability 15 13726 g007
Figure 8. Individual characteristics ranking of PBR technological cooperation innovation network in 2018–2020.
Sustainability 15 13726 g008
Figure 9. Evolutionary game phase diagram of technological cooperation innovation between ev manufacturers and battery recyclers.
Sustainability 15 13726 g009
Table 1. Ranking of Individual characteristics of PBR the technological cooperation innovation network in 2012–2014.
RankInstitutionDegree CentralityMiddle CentralityNetwork SizeNetwork Restriction
1State Grid Corporation, Beijing, China19231.518.2630.1
2Zhejiang Geely Holding Group Co., Ltd., Hangzhou, China81240.385
3Xu Ji Group Co., Ltd., Xuchang, China637.53.3330.517
4Zhejiang Geely Luoyou Engine Co., Ltd., Ningbo, China6010.56
5Jinan Geely Auto Parts Co., Ltd., Jinan, China6010.56
6Hunan Luoyou Engine Parts Co., Ltd., Xiangtan, China6010.56
7Shandong Geely Transmission Co., Ltd., Jining, China6010.56
8Ningbo Shangzhongxia Automatic Transmission Co., Ltd., Ningbo, China6010.56
9Hunan Jisheng International Power Transmission System Co., Ltd., Xiangtan, China6010.56
Table 2. Technological cooperative innovation game payment matrix between EV manufacturers and battery recyclers.
Battery Recyclers
CooperationNon-Cooperation
EVCooperation R Z C Z + a Δ R + b C Z R D C D + ( 1 a ) Δ R + b C D R Z C Z + F i R D F + b E
ManufacturerNon-Cooperation R Z F + b E R D C D + F R Z R D
Table 3. Determinant and trace of the equilibrium point of the technological cooperative innovation game between EV manufacturers and battery recyclers.
Equilibrium Point D e t ( J ) T r ( J )
(0,0) ( F C Z ) ( F C D ) ( F C Z ) + ( F C D )
(0,1) ( F C Z + a Δ R + b C Z b E ) ( F C D ) ( F C Z + a Δ R + b C Z b E ) ( F C D )
(1,0) ( F C Z ) ( F C D + ( F C Z ) + ( F C D +
( 1 a ) Δ R + b C D b E ) ( 1 a ) Δ R + b C D b E )
(1,1) ( F C Z + a Δ R + b C Z b E ) ( F ( F C Z + a Δ R + b C Z b E )
C D + ( 1 a ) Δ R + b C D b E ) ( F C D + ( 1 a ) Δ R + b C D b E )
Table 4. Local stability analysis of technological cooperative innovation system between EV manufacturers and battery recyclers.
Equilibrium Point D e t ( J ) T r ( J ) Local Stability
(0,0)+ESS
(0,1)++Unstable
(1,0)++Unstable
(1,1)+ESS
( x * , y * ) +0Saddle point
Disclaimer/Publisher’s Note: The statements, opinions and data contained in all publications are solely those of the individual author(s) and contributor(s) and not of MDPI and/or the editor(s). MDPI and/or the editor(s) disclaim responsibility for any injury to people or property resulting from any ideas, methods, instructions or products referred to in the content.

