Abstract
To address the topic of building age-friendly cities that better meet the needs of the elderly in a sustainable-city-oriented manner, this paper focuses on the interaction between the needs of the elderly and urban facilities in the urban built environment in order to propose a comprehensive evaluation method regarding the friendliness of urban facilities with respect to the elderly in large urban areas. The development of the proposed method was guided by the distribution characteristics of the elderly population and combines a spatial measurement evaluation, which is based on the spatial distribution characteristics of urban facilities for the elderly, and a post-use measurement evaluation, which is based on the characteristics of use by the elderly. Taipei City and New Taipei City are then taken as examples for evaluation. From the final evaluation results of the Boston four-quadrant analysis, the areas with higher spatial and post-use metric evaluation values were defined as areas of high concern, while those with lower spatial and higher post-use metric evaluation values were defined as advantage-maintained areas. These two types of areas accounted for about 58% of the total area, and are distributed in the Taipei urban area and northeast New Taipei City. The areas with higher spatial and lower post-use metric evaluation values were defined as priority improvement areas, while those with lower spatial and post-use metric evaluation values were defined as key complement areas. These two types of area accounted for about 42%, and are mainly distributed in the northwest part of Taipei City, as well as the western and southern mountainous areas of New Taipei City. Accordingly, region-specific planning policy recommendations were provided.
1. Introduction
1.1. Research Background
At present, with the rapid growth of the elderly population, aging has become a major challenge for countries worldwide to face in order to achieve sustainable development. In response to this major issue, the United Nations World Health Organization (WHO) put forward a plan for the creation of sustainable cities which are friendly to elderly people (i.e., over 65 years) [1] in 2005, aiming to achieve the goal of enabling the elderly to actively live their lives, integrate into society, participate in social development, and realize their own values by creating an inclusive, barrier-free urban environment that can promote active aging [2]. This requires taking the needs of the elderly into account at the core, and overall elderly-friendly city construction should consider the extent to which facilities provided within the sustainable urban built environment can meet the needs of the elderly. In recent years, theoretical research and practice regarding elderly-friendly cities, in terms of the scope of research, have been more focused on large-scale research within partial areas or even whole cities [3,4]. The research content generally focuses on the characteristics needs of the elderly, how the overall urban environment can better adapt to and accommodate the elderly and all other groups, and distinctive research on the regional characteristics. However, the concept of urban facility friendliness with respect to the elderly and the quantitative evaluation of urban facilities for the elderly in the overall sustainable urban built environment, in addition to the needs of the elderly, have scarcely been considered.
1.2. Literature Review
First, the concept of the friendliness of urban facilities for the elderly remains unclear. Global Age-friendly Cities: A Guide (hereinafter referred to as the Guide), issued by WHO in 2007, clearly put forward that cities which are friendly to the elderly include two levels: the physical built environment and the social environment. Among them, the physical built environment mainly includes outdoor activity spaces, buildings, transportation, housing, and medical and elderly care facilities, which may meet the daily needs of the elderly. Subsequently, in 2015, the WHO issued Measuring the Age-friendliness of Cities: A Guide to Using Core Indices (hereinafter referred to as the Guidelines for Use [5]). Although their proposed core indices could measure the benchmark friendliness level of cities with respect to the elderly, they did not clarify the specific meaning regarding the friendliness of a city to the elderly. The above two guidelines and related studies [2,6] have all emphasized the significance of providing a built environment suitable to the needs of the elderly in the city, in order to further ensure that the elderly can participate more actively in society.
Second, an evaluation index system for urban facilities’ friendliness to the elderly has not been unified. According to the Guidelines for Use, multiple indices in one aspect from its core index system can be selected—either vertically, horizontally, or freely across the entire index framework—to further form an entire evaluation index system [7]. Subsequent practical studies, carried out in many countries and regions [8,9,10,11,12], have shown that the focuses of the built environment for an elderly friendly city include the public environment, outdoor activity spaces, medical facilities, elderly care service facilities [13], public transport facilities [14,15], elderly housing, community elderly care service facilities [16], and the aging adaptation of related facilities.
Finally, the evaluation of urban facility friendliness for the elderly is still hardly quantitative and has not been grasped on the level of comprehensive evaluation, according to multiple aspects and indices in previous studies [17,18,19,20,21,22,23,24,25,26,27,28,29], which have mainly been based on the subjective satisfaction evaluation of indexes from different investigators (experts, officials, residents, etc.). The main focus of related research has been analyzing the differences between the ratings of residents with different socio-demographic characteristics as well as the impact of other factors (e.g., the health status, happiness, well-being, and quality of life) involving older residents on their perception of friendliness. This has led to a particular lack of direct quantitative evaluation of actual objective data aimed at the needs of the elderly, as well as the evaluation of comprehensive performance measures based on the interaction between subjective and objective evaluation. On the level of special evaluation, according to unilateral/multiple indices, the questionnaire is still the most important tool [30,31], and common methods include the evaluation of the spatial and temporal elements of public space; quantitative evaluation of the matching evaluation between the various pension resources and the space [32,33]; and spatial matching and policy-planning evaluation of urban elderly care facilities based on multi-agent simulation [4], which is conducive to a more deeply targeted evaluation of the indices associated with special facilities, but lacks a comprehensive and overall grasp.
1.3. Definition of Urban Facility Friendliness for the Elderly
In view of the above problems, such as unclear concepts, insufficient overall understanding, and lack of quantitative evaluation methods for the sustainable relationship between demand and facilities, this paper, referring to the guidance on the measuring the age-friendliness of cities from the WHO, defines urban facility friendliness for the elderly in terms of the ability of an aging city to provide outdoor activity spaces, transportation conditions, and medical and elderly care facilities to meet the needs of the elderly [34]. The comprehensive performance evaluation index system and evaluation method for urban facility friendliness for the elderly are introduced in detail in the following text in combination with a case study.
1.4. Main Research Content
The research presented in this paper is mainly divided into five parts:
Section 1 focuses on the research objective of urban facilities’ friendliness to the elderly, which is characterized by meeting the needs of the elderly, through the relevant research background and a research literature review.
Section 2 introduces the profile and aging situation of the subjects considered in this study—Taipei City and New Taipei City—as well as the main research methods and steps.
Section 3 introduces the analysis of the results of this study, including the evaluation index system, spatial measurement characteristics, post-use measurement characteristics, and comprehensive evaluation characteristics of urban facilities’ friendliness for the elderly in Taipei City and New Taipei City. Corresponding planning countermeasure suggestions are also given.
Section 4 introduces the contributions and limitations of this study, as well as future research directions.
Section 5 provides the conclusions of this research.
2. Materials and Methods
2.1. Urban Facilities for the Elderly in Taipei City and New Taipei City, Taiwan, China
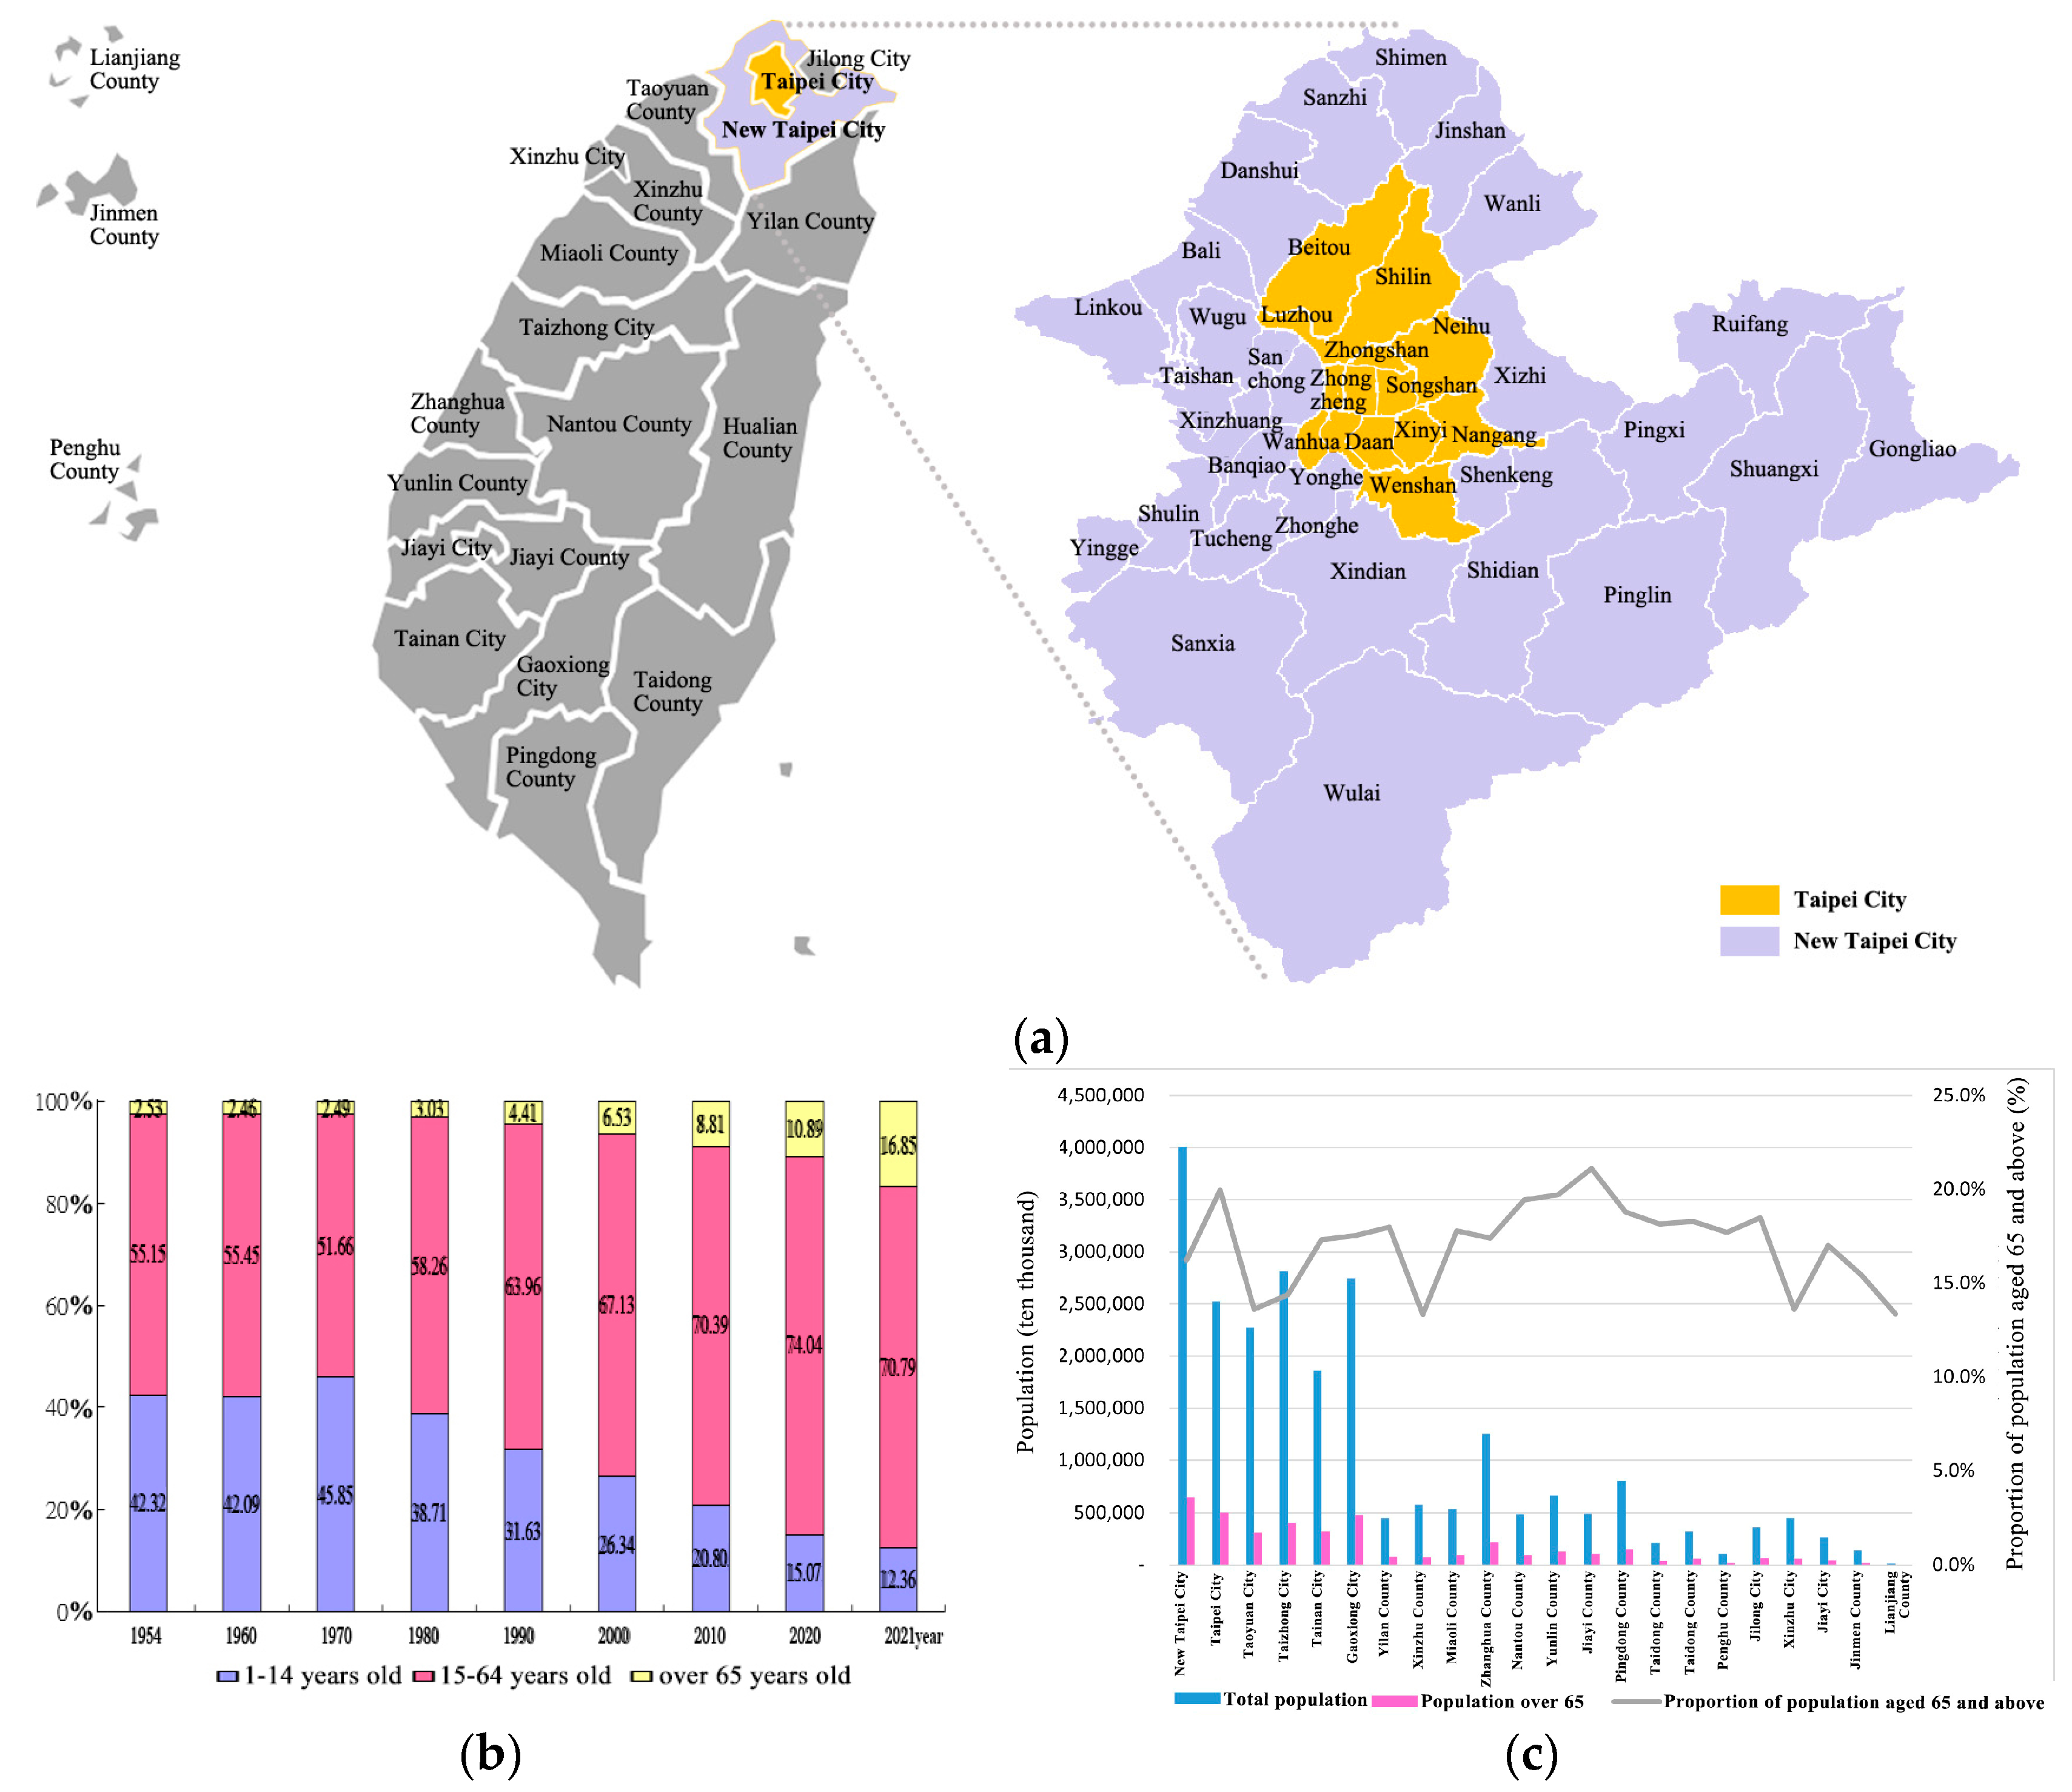
At present, Taiwan is facing severe, rapid development of aging and fewer children, as well as associated challenges in terms of finance, employment, and health. As early as 1993, the elderly population accounted for 7% of the total population in Taiwan, entering the aging portion of society as defined by the United Nations. The percentage of aging people began to accelerate from 2010 onward, and Taiwan became a deep aging society by 2018 [35]. Taipei City and New Taipei City, located in the north of Taiwan, China, are representative cities of the Taipei Metropolitan Area (see Figure 1a). By the end of 2021, the total population of these two cities was about 6.52 million, and there were about 1.14 million elderly people (i.e., over 65 years old). The proportion of elderly people over 65 years old was about 17.6%, which is higher than the average proportion (16.9%) in Taiwan. These two cities are the most serious areas in terms of aging, with the highest proportions of elderly people in Taiwan, and, thus, are the most challenging and representative regions (see Figure 1).

Figure 1.
(a) Location and administrative division map of Taipei City and New Taipei City; (b) the proportion of Taiwan’s population in three stages over the years; (c) total population, population over 65 years old, and the proportion of the population over 65 years old in the total population of Taiwan’s cities and counties in 2021.
2.2. Research Methods and Steps
This study is mainly divided into four parts.
In the first part, an evaluation index system for the urban facility friendliness with respect to the elderly is established. It includes a spatial measurement evaluation index system, based on the actual objective data of aging facilities, and a post-use measurement evaluation index system, based on the subjective evaluation data obtained from the elderly.
In the second part, the characteristics of the spatial measurement for the urban facilities’ friendliness for the elderly are analyzed and evaluated [34]. According to the spatial measurement evaluation index system, the administrative unit of the district was taken as the statistical unit (a total of 41 districts), and statistical data with high reliability were collected [36] for analysis. This specifically included (1) using standardization and statistical analysis methods to uniformly correct each of the sub-indices in the spatial measurement evaluation system, followed by conducting spatial classification feature analysis of the sub-indices. The specific standardized formula is as follows:
where Xn is the nth value, Xmin is the minimum value, and Xmax is the maximum value. (2) Using statistical analysis to analyze the aging degree for each district. (3) Using cluster analysis, combined with the aging degree in each district, the spatial measurement values of the urban facilities friendliness for the elderly could be clustered, resulting in classification evaluation values of 1–5, indicating the levels of spatial measurement of urban facility friendliness for the elderly in each district. (4) Using mean-valued analysis, the average values of the aging degree and other evaluation indices under the spatial classification of friendliness (i.e., at levels 1–5) could be cross-compared, such that relevant policy recommendations could be proposed.
Xns = (Xn − Xmin)/(Xmax − Xmin)
The third part involves the analysis and evaluation of post-use measurement characteristics of urban facility friendliness for the elderly. According to the post-use evaluation index system, the district (an administrative level) is also used as the statistical unit, and questionnaire survey data are analyzed, which are scored according to a unified 5-level scoring method using the Likert scale. Specifically, this part includes: (1) conducting descriptive statistical analysis to analyze the degree of satisfaction with the sub-indicators evaluated by the respondents from the post-measurement; (2) using T-test analysis to analyze the correlations between the characteristics of the respondents and the evaluation value of the sub-indices evaluated by the post-use measurement, as well as determining the influence of different demographic and socio-economic factors on the values of the sub-indices evaluated in the post-use measurement; and (3) using cluster analysis—combined with the aging degree in each district, the post-use measurement values of the urban senior facility friendliness could be clustered, resulting in classification evaluation values (i.e., levels 1–5) which reflected the post-use measurement of urban facilities’ friendliness for the elderly in each district.
The fourth part involves a comprehensive performance evaluation of the urban facility friendliness for the elderly. Adopting the four-quadrant Boston matrix analysis method and utilizing the level 1–5 friendliness evaluation values obtained in the spatial and the post-use measurement categorization, the results of the comprehensive performance evaluation of friendliness were classified into four categories in order to evaluate the comprehensive benefit posture such that relevant policy recommendations can be put forward.
3. Results
3.1. Evaluation Index System of Urban Facilities’ Friendliness for the Elderly
Based on previous relevant research [34], we followed the principles of the Taiwanese situation, including the operability of data acquisition and decomposition by age or regions, to construct the spatial measurement evaluation index regarding urban facility friendliness for the elderly in Taiwan, following the level of objectives-field-indices (see Table 1). Among them, data on the age-appropriate renovation rate of parks and green spaces, communities, and housing were temporarily unavailable, and were not considered in this evaluation. Furthermore, Taiwan has popularized bus/MRT (subway) fraternity seats for elderly, disabled, and pregnant people with high satisfaction regarding convenience of transportation [7]. Meanwhile, the principle of correspondence with the spatial measurement index system was adopted to design the post-use measurement index system (Table 2), which was the basis for the post-use measurement questionnaire on the friendliness of urban facilities for the elderly.

Table 1.
The spatial measurement index system of urban facilities’ friendliness for the elderly in Taiwan [34].
Table 2.
The post-use measurement index system of urban facility friendliness for the elderly in Taiwan.
3.2. Spaatial Measurement Characteristics of Urban Senior Facility Friendliness
3.2.1. Spatial Statistics of Sub-Indices in Spatial Measurement
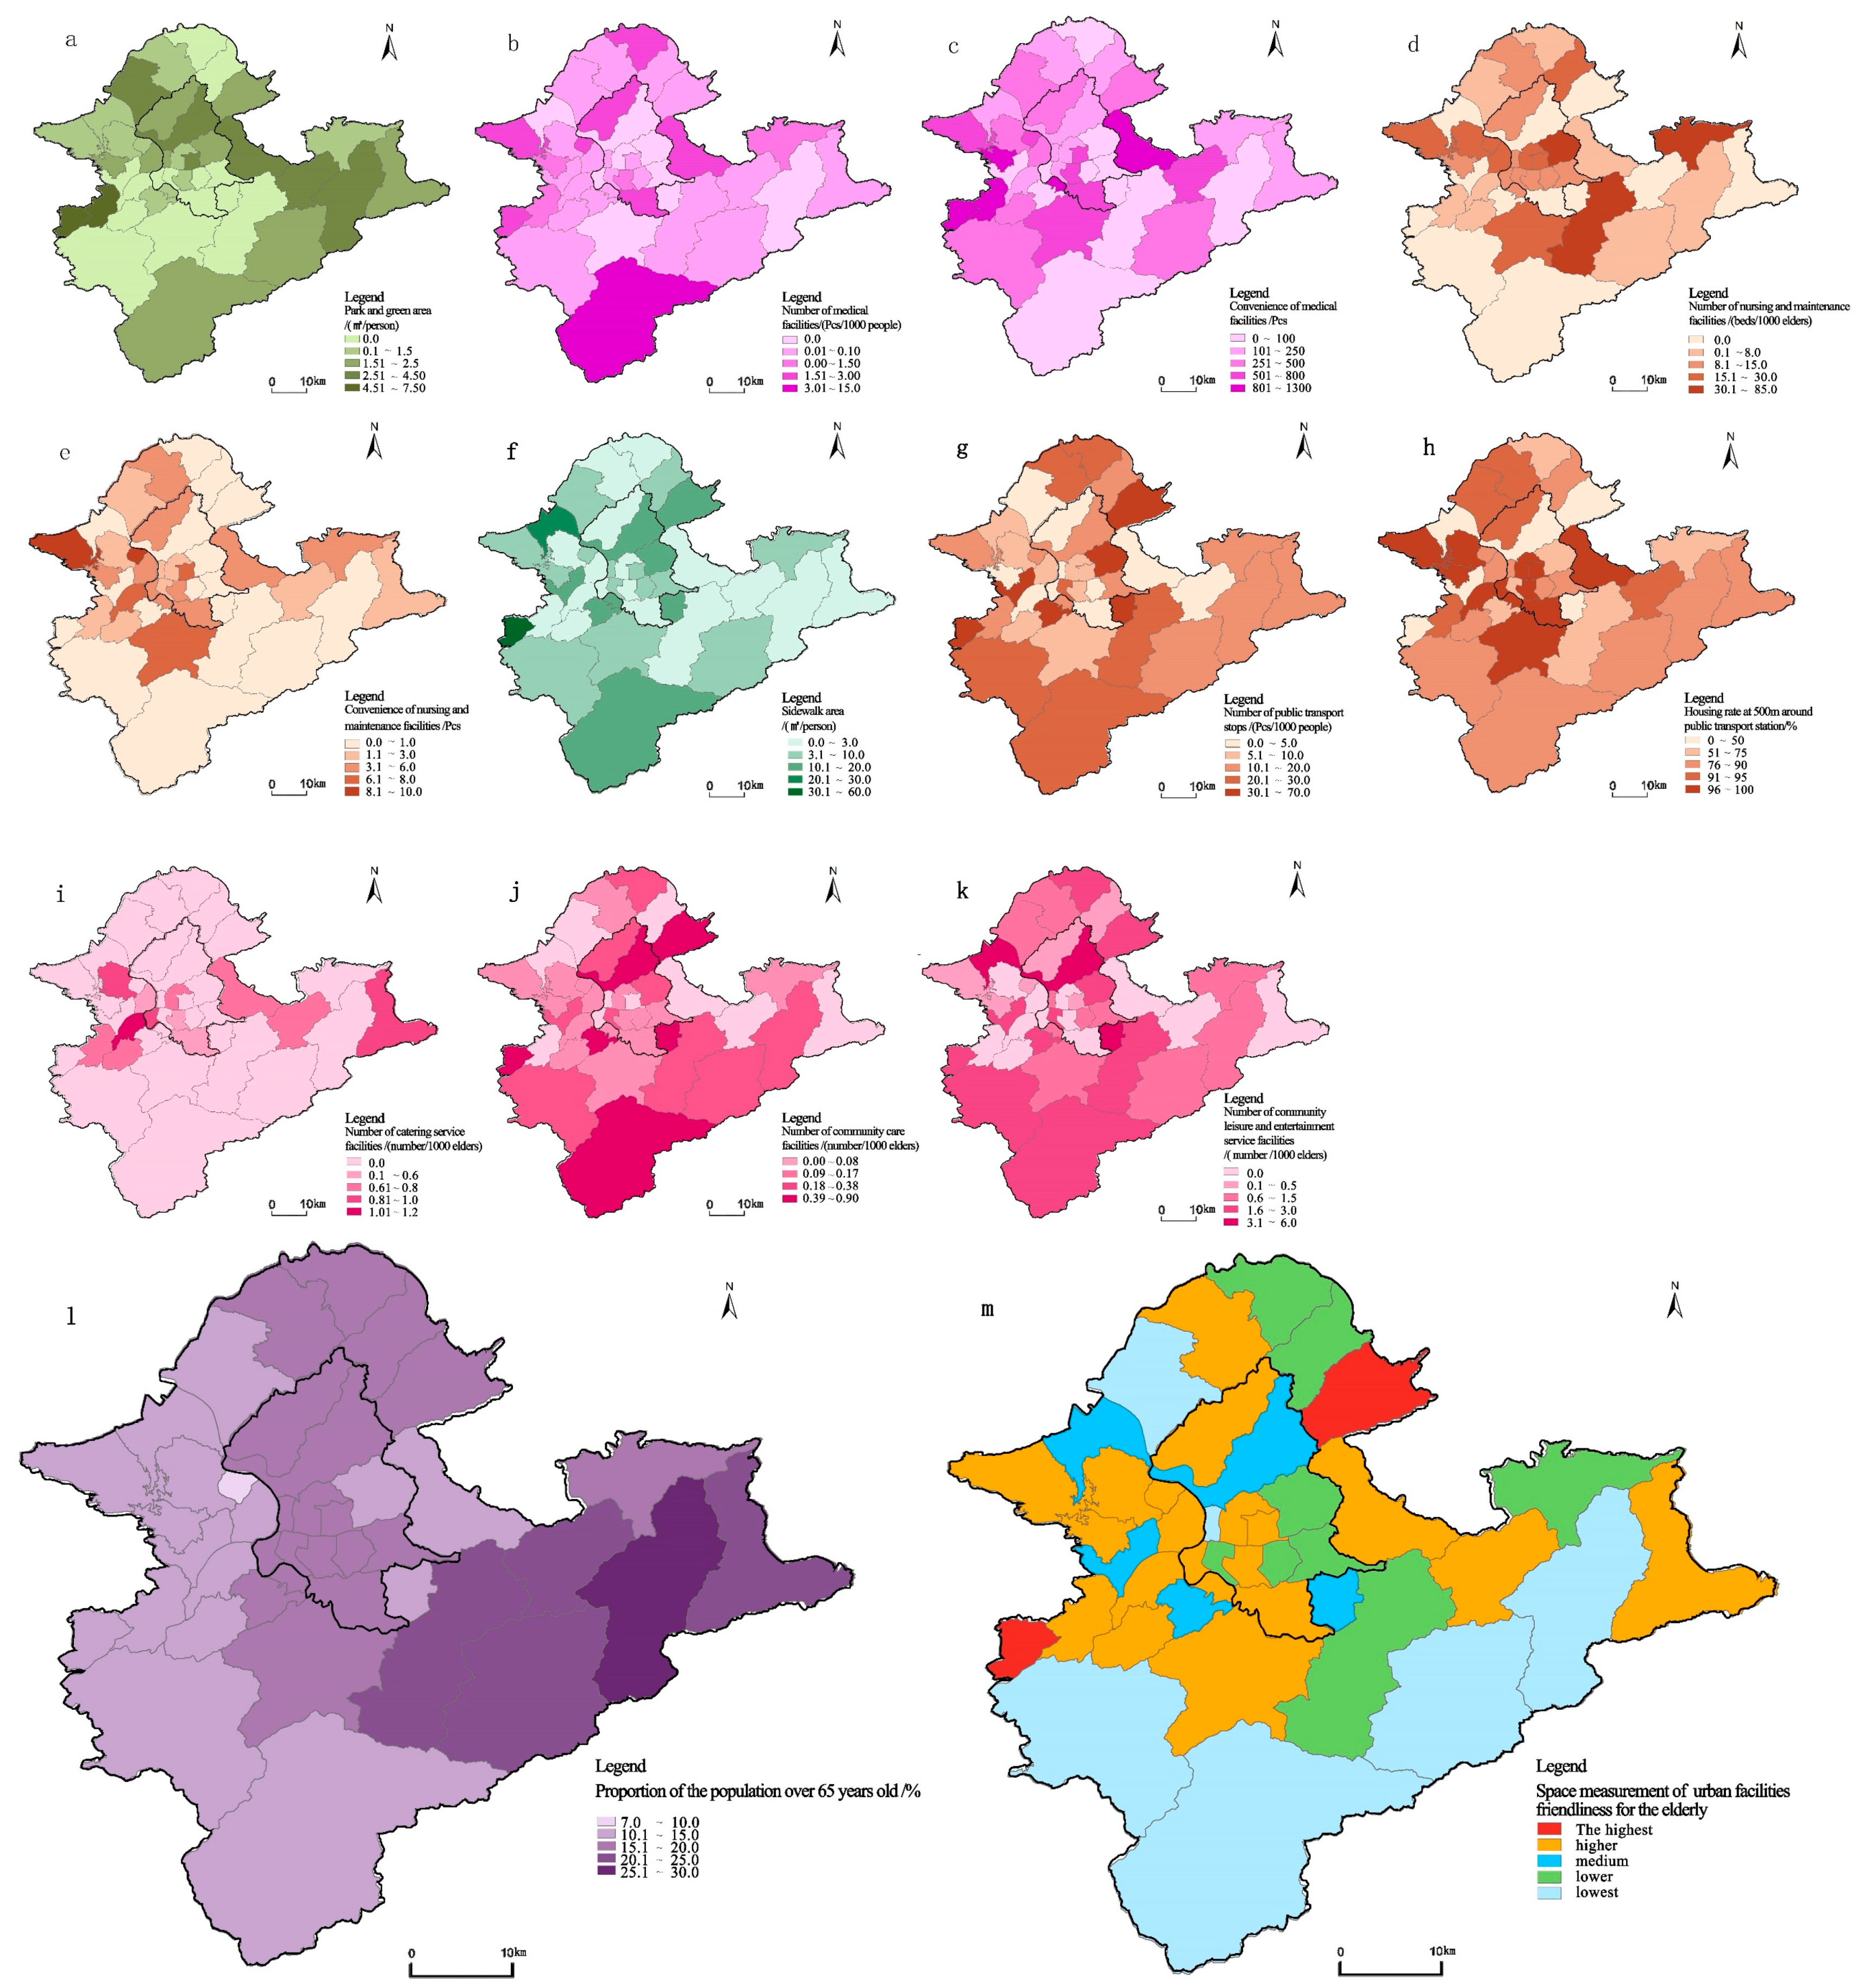
We conducted an analysis of the value and spatial distribution of objective spatial measurement indices of urban facility friendliness for the elderly in Taipei and New Taipei City. For example, the number of nursing and maintenance facilities in each district ranged from 0 to 84.45 beds per 1000 elderly people, with an average of 13.25 beds per 1000 elderly people and a median of 7.08 beds per 1000 elderly people, thus presenting a large difference and indicating that the layout of nursing and maintenance facilities in Taipei City and New Taipei City is seriously imbalanced (see Figure 2e).

Figure 2.
Spatial distribution of sub-indices and clustering groups regarding spatial measurement of urban facilities’ friendliness for the elderly in Taipei and New Taipei based on administrative district levels. This includes: area of parks and green spaces (a), number of medical facilities (b), convenience of medical facilities (c), number of nursing and maintenance facilities (d), convenience of nursing and maintenance facilities (e), sidewalk area (f), number of public transport stations (g), residence rate at 500 m around public transport stations (h), number of catering service facilities (i), number of community care facilities (j), number of leisure and entertainment service facilities (k), proportion of the population over 65 in total population (l), and space measures of urban facility friendliness for the elderly (m).
3.2.2. Analysis of Aging Degree
At the same time, the proportion of the elderly population (i.e., over 65 years old) in the total population was evaluated (see Figure 2l). It was found that the proportion of the elderly population in all districts exceeded 7% of the total population: that is, all districts had entered the stage of mild aging. Among them, those in the stage of moderate aging (with a proportion of 14–20%) accounted for 26.8% of the total number of districts, while those in the stage of severe aging (with a proportion of 21–30%) accounted for 36.6% of the total number of districts, and were mainly concentrated in the eastern peripheral areas of New Taipei City.
3.2.3. Cluster Analysis and Evaluation of Spatial Measurements of Urban Facility Friendliness for the Elderly
Third, combined with the degree of aging, the K-Means clustering method was utilized to evaluate the clustering of various spatial measurement indices, allowing them to be divided into five clusters. Through evaluation of the spatial distribution characteristics (see Figure 2m), it was found that about 34% of the districts with high spatial measures of friendliness were concentrated in the downtown area of Taipei City, as well as the western and eastern parts of New Taipei City, which are adjacent to Taipei; about 13% of the districts with medium spatial measures of friendliness were concentrated in the northwest part of Taipei City, and about 53% of the districts with low spatial measures of friendliness were concentrated in the southern mountains of New Taipei City.
3.2.4. Mean-Value Analysis under the Spatial Classification of Urban Facility Friendliness for the Elderly
Based on further statistics regarding the average level of each spatial measurement evaluation index of urban facility friendliness for the elderly in Taipei City and New Taipei City, as well as cross-comparison of the aging degree in each level with the average values of other evaluation indices (see Table 3), effective policy suggestions can be put forward:
Table 3.
The average values of evaluation indices at different levels regarding the spatial measurement of urban facilities’ friendliness for the elderly in Taipei and New Taipei.
Category 1: For the regions with the lowest spatial measure of friendliness, having a moderate average degree of aging, the construction of medical facilities, community catering service facilities, and community leisure and entertainment service facilities should be strengthened in the future. Due to the restrictions in mountainous areas, policies should be designed to improve aging facilities so that they may meet the actual conditions of mountainous areas, such as special free buses, walking paths with gentle slope, community clinics, etc.
Category 2: For regions with low spatial measures of friendliness, with a higher average degree of aging, the number of nursing and maintenance facilities was found to be satisfactory. In the future, the construction of community catering service facilities should be mainly strengthened in these areas.
Category 3: For regions with moderate spatial measures of friendliness, with low average degrees of aging, the construction of community leisure and entertainment service facilities was found to be satisfactory. In the future, the construction of park and green space areas, medical facilities with higher convenience, and nursing and maintenance facilities with higher convenience should be mainly strengthened in these regions.
Category 4: For areas with high spatial measures of friendliness, which had a higher average degree of aging, the construction of convenient nursing and maintenance facilities, housing within 500 m of public transportation stations, and community catering service facilities was found to be satisfactory. In the future, the construction of sidewalk areas, public transportation stations, and community care facilities should be strengthened in these areas.
Category 5: The regions with the highest spatial measures of friendliness presented the lowest average degrees of aging. The construction of parks and green spaces, as well as convenient medical facilities, was found to be satisfactory. In the future, the construction of nursing and maintenance facilities of greater convenience and community catering service facilities should be mainly strengthened in these regions.
3.3. Post-Use Measurement Characteristics Regarding Urban Facility Friendliness for the Elderly
3.3.1. Questionnaire Design and Testing
The content of the questionnaire regarding the post-use measurement of urban facility friendliness for the elderly was mainly divided into two parts, with a total of 25 questions. The first part collected the personal information of the respondents, including a total of 12 questions on their gender, age, marital status, education level, income, personal health status, housing type, living arrangements, employment status, whether they had specifically had the experience of caring for the elderly, whether they used nursing homes for the elderly, and length of residence. The second part was designed for the post-use evaluation of respondents based on the post-use evaluation index system of urban facilities for the elderly in Taiwan, including a total of 13 questions on the public environment, medical facilities, elderly care service facilities, transportation facilities, elderly community services, and suitability and satisfaction surveys.
A total of 272 questionnaires were collected through filling out questionnaires (both online and on-site), including 27 invalid and 245 valid questionnaires. An average of about six samples for each administrative district was obtained, and these were used in the analysis and statistical questionnaires for the post-use measurement of urban facility friendliness for the elderly. In the reliability analysis results, the Cronbach’s alpha value was 0.933, indicating that the reliability of the questionnaire was high. Among them, public environment (one item) had no alpha, and the alpha values were 0.843 for geriatric medical facilities (two items), 0.794 for elderly care service facilities (two items), 0.843 for elderly transportation facilities (three items), 0.909 for elderly community services (three items), and 0.875 for suitability and satisfaction (two items). From the validity assessment of the questionnaire, the Kaiser–Meyer–Olkin coefficient was 0.891, and the significance of the Bartlett spherical test was less than 0.05, indicating that the structure of the questionnaire was satisfactory.
3.3.2. Respondent and Post-Use Evaluation Characteristics
Regarding the personal characteristics of the respondents (see Table 4), more than half of the respondents were women (53.88%), and most of them were over 50 years old (79.18%) and married (80.00%), with a university education level or higher (76.73%) and having a personal monthly basic income of more than TWD 50,000 (40.82%). Most of the elderly rated their personal health statuses as normal (44.90%), with self-owned housing types (94.69%), and most had lived in their current residences for more than 8 years (77.96%). Most of the respondents lived with partners or children (82.44%), while few respondents lived in nursing homes for the elderly (6.12%). Most of them were retirees (73.47%), and a few had experience in learning to care for the elderly (11.84%).
Table 4.
Characteristics of respondents regarding post-use measurement of urban facility friendliness for the elderly in Taipei and New Taipei.
From the descriptive statistical results of the post-use measurement evaluation regarding urban facilities’ friendliness for the elderly (see Table 5), the evaluation results for the public environment, elderly medical facilities, and elderly transportation facilities were high, with the indication that sufficient medical facilities could be reached by walking or convenient public transportation near the places of residence of the elderly. There were enough bus stations and MRT stations, as well as enough medical facilities (including clinics) near their places of residence, which presented the highest evaluation values. The evaluation values regarding the community services for the elderly were lower.
Table 5.
Descriptive statistics of the post-measurement indices regarding urban facility friendliness for the elderly in Taipei and New Taipei City.
3.3.3. Correlation Analysis between the Characteristics of the Respondents and the Evaluation Values of the Sub-Indices Based on Post-Use Measurements
We conducted a T-test analysis to further analyze the correlations between the characteristics of the respondents and the post-use measurement evaluation values, with the aim of exploring the influences of different demographic and socioeconomic factors on the post-use measurement evaluation values. From the characteristics of the respondents and T-test analysis of the post-use evaluation values (see Table 6), the following indices had little effect on the post-use measurement results: whether they were married or not, whether they had a good self-evaluation of their health status, whether they lived alone, whether they had employment, whether they had previous experience in taking care of the elderly, whether they were using nursing homes for the elderly, and whether they had lived in their residences for more than 8 years. Meanwhile, the elderly respondents with good self-health evaluation and who did not live alone had higher scores in the post-use measurement. At the same time, female respondents scored higher in the fields of elderly medical facilities and elderly community services, while male respondents and those with education at the university level or above tended to think that the field of elderly transportation facilities was very good. Low- and middle-income respondents rated the community services for the elderly higher. Respondents who owned their own homes scored higher in the field of geriatric medical facilities.
Table 6.
The T-test analysis of the characteristics of respondents and the post-measure evaluation indices regarding urban facilities’ friendliness for the elderly in Taipei City and New Taipei City.
It is worth noting that, although nearly 50% of the respondents in this survey were under the age of 65 but lived with elderly people at home, the ratings of the respondents under and over the age of 65 were more or less the same for all indices, except for the index of whether there were enough parks, green spaces, and squares to meet the needs of the elderly, which respondents over 65 years of age rated significantly higher.
Therefore, in the field of medical facilities for the elderly, the demand for construction should be strengthened with regard to the needs of men and non-owner-occupied residents; the demand for the construction of elderly transportation facilities should be strengthened with regard to women and individuals with low and middle education levels; the demand for the construction of elderly community services should be strengthened with regard to men and higher-income people; and attention should be paid to residents without their own houses in various fields, in order to enhance their satisfaction and suitability.
3.3.4. Cluster Analysis Evaluation of Post-Use Measurement Regarding Urban Facility Friendliness for the Elderly
Spatial classification statistics were obtained for the subjective evaluation of post-use measurements of urban facility friendliness for the elderly in Taipei City and New Taipei City, in order to further understand their values and spatial distribution. For example, we considered whether there were enough medical facilities (including clinics) near the places of residence of the elderly (see Figure 3b), and there were a total of 10 districts characterized by a level of too many or many—mainly distributed in Taipei City and the western part of New Taipei City—while there were a total of 21 districts characterized by few or relatively few, including the northern, eastern, and southern areas of New Taipei City.
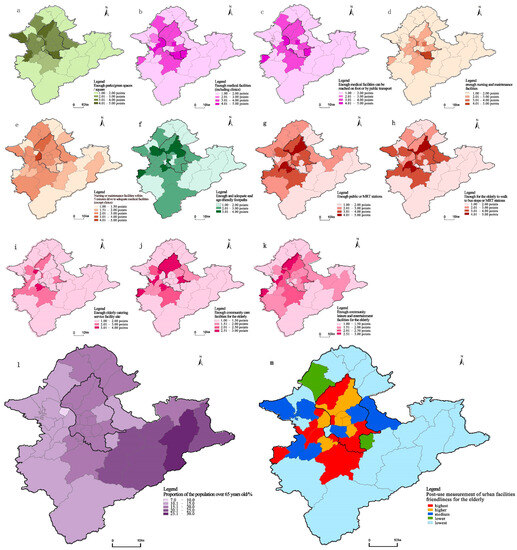
Figure 3.
Spatial distribution of sub-indices and clustering groups of the post-use measurement regarding urban facilities’ friendliness for the elderly in Taipei and New Taipei, based on administrative district levels. This included: enough parks/green spaces/squares (a), enough medical facilities (including clinics) (b), enough medical facilities that can be reached by walking or taking public transport (c), enough nursing and maintenance institutions (d), enough medical facilities (except clinics) within a 5-minute drive from a nursing home or care facility (e), enough suitable pedestrian paths for the elderly (f), enough bus stations and MRT stations (g), enough bus stations or MRT stations within 500 m (walking distance) (h), enough catering facilities (i), enough community care facilities (j), enough leisure and entertainment facilities (k), proportion of the population over 65 out of the total population (l), and post-use measurement of urban facilities’ friendliness for the elderly (m).
Second, the aging degree was evaluated based on the proportion of the population over 65 years old to the total population in each district.
Finally, the K-Means clustering method was used to classify and evaluate the post-use measurement indices of urban facilities’ friendliness for the elderly in Taipei City and New Taipei City, combined with the degree of aging, which was finally divided into five categories. About 39% of the districts had high post-use measurement friendliness levels, mainly distributed in Taipei City and the western part of New Taipei City; about 20% had a moderate level, mainly in the western and eastern suburbs of New Taipei City; and about 41% had low levels, mainly in the northern and southeastern parts, as well as the southern mountainous areas, of New Taipei City.
3.4. Comprehensive Performance Evaluation for Urban Facility Friendliness for the Elderly
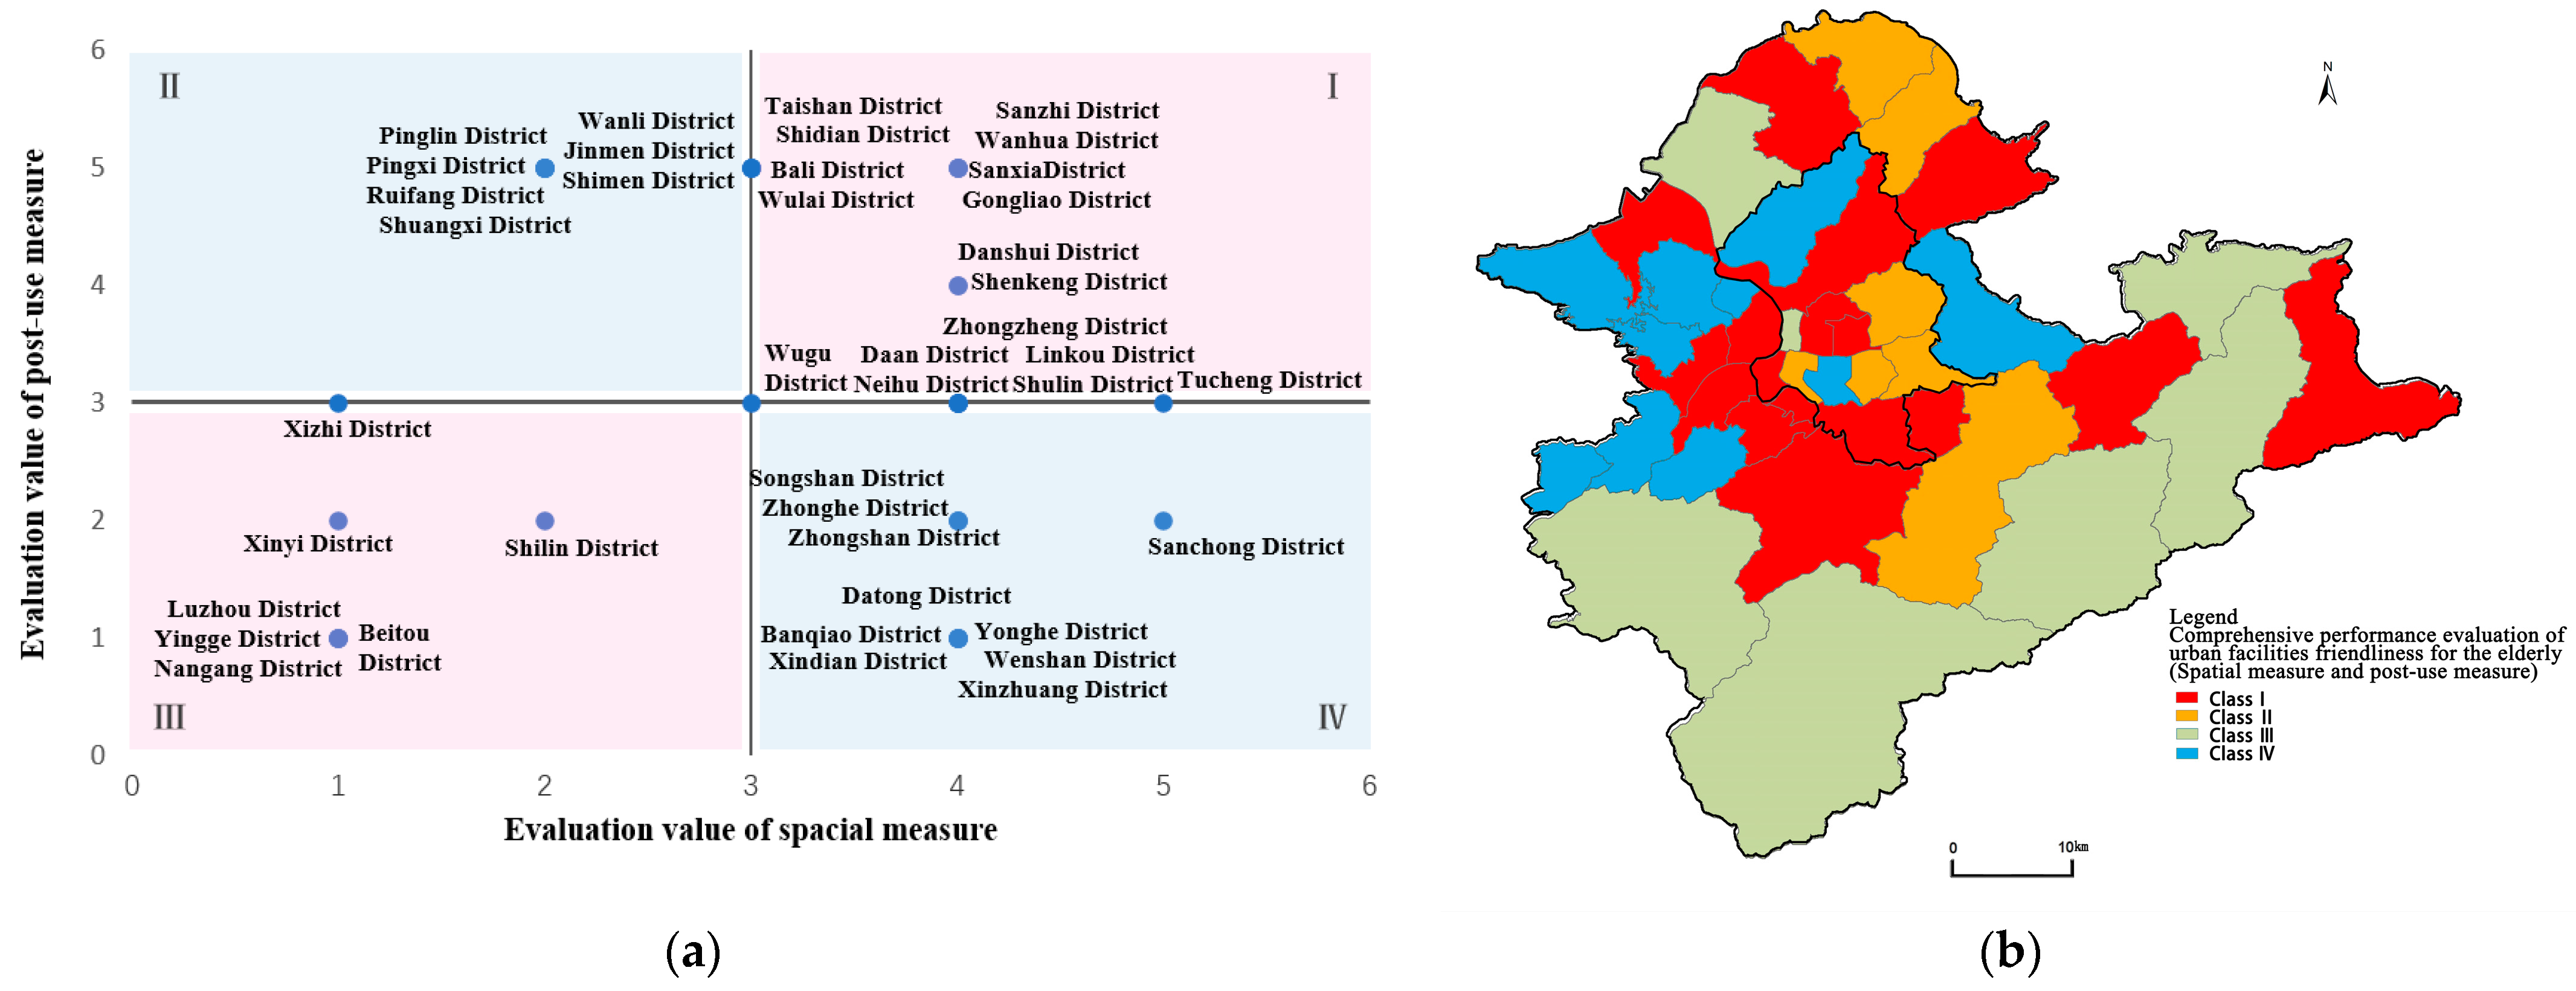
Using the four-quadrant analysis method based on the Boston Theory, the correlations between the spatial and post-use measurement evaluation approaches regarding urban facility friendliness for the elderly in Taipei City and New Taipei City were studied. Overall planning strategies for urban facilities for the elderly were formulated by considering the needs of the elderly; key urban areas were determined; and the main order of planning and construction was developed. In this case, the previous evaluation results regarding the spatial and post-use measurements were categorized on a 1–5 scale, corresponding to a score between 1 and 5. The spatial measurement evaluation scores were set as the horizontal axis, while the post-use measurement evaluation scores were set as the vertical axis, each with three points as the midpoint to distinguish high from low levels. The coordinate graph was divided into four quadrants, indicating the four classifications of the comprehensive performance evaluation regarding urban facility friendliness for the elderly: in order, these were “highly concerned area”, “advantage-maintained area”, “key complement area”, and “priority improvement area”.
Overall, the following categories were derived (see Figure 4a): Category I—high spatial measurement and high post-use measurement (i.e., highly concerned area). The satisfaction of the elderly is consistent with the construction of urban facilities for the elderly, which should continue to be maintained and supported. This category included 17 districts, including Da’an District of Taipei City; Linkou District of New Taipei City; and other districts, mainly distributed in Taipei City and northeast areas of New Taipei City. Category II—low spatial measurement and high post-use measurement (i.e., advantage-maintained area). A reason for the existence of this type of area is likely that the cities invested in the construction of urban facilities for the elderly that were beyond the actual needs of the elderly, and relevant follow-up research can be strengthened later. This category included a total of seven districts, including Pinglin District; Ruifang District of New Taipei City; and other districts, which were mainly distributed in the eastern part of New Taipei City, adjacent to Taipei and the northern areas. Category III—low spatial measurement and low post-use measurement (i.e., key complement area). This category comprised seven districts, including Shilin District of Taipei City; Luzhou District of New Taipei City; and other districts, which were mainly distributed in the northwest part of Taipei City and the mountainous area in the south of New Taipei City. Finally, there was Category IV—high spatial measurement and low post-use measurement (i.e., priority improvement area). For these areas, the types of urban facilities with which the elderly had problems (e.g., in terms of the products or services provided) should be carefully determined and relevant improvements should be made. This category included Songshan District of Taipei City and Xinzhuang District of New Taipei City, as well as 10 other districts mainly distributed in the northwest part of Taipei City and the western area of New Taipei City.

Figure 4.
Comprehensive performance evaluation of urban facilities’ friendliness for the elderly in Taipei City and New Taipei City. (a) Four-quadrant analysis; (b) spatial distribution.
4. Discussion
This paper provides a definition of urban facility friendliness for the elderly, taking the interaction between the needs of the elderly and urban facilities for the elderly as the core, and a comprehensive performance evaluation method was put forward based on the distribution characteristics of the elderly population in large cities. This comprehensive performance evaluation method regarding urban facilities’ friendliness for the elderly comprehensively integrates the evaluation of spatial measurements (based on spatial distribution characteristics of urban facilities for the elderly) and post-use measurements (based on the characteristics of elderly use). Taipei City and New Taipei City were taken as examples with which conduct the evaluation, and, finally, targeted suggestions focused on the construction of urban aging facilities in each district could be put forward.
The contributions and innovations related to the above comprehensive performance evaluation method regarding urban facilities’ friendliness for the elderly mainly include the following: The collected data were mainly derived from highly reliable statistical data, supplemented by subjective evaluation data obtained through a questionnaire survey, making them highly operable. This is suitable for the overall evaluation of urban facility friendliness for the elderly at a large scale; the evaluation process incorporated a spatial analysis of the degree of aging, thus making the evaluation results on urban facilities’ friendliness for the elderly—defined according to the spatial distributions of the elderly population and facilities—more reasonable. The comprehensive utilization of spatial and post-use measurements for the determination of urban facilities’ friendliness for the elderly was analyzed, allowing effective policy opinions to be put forward with respect to the interactions between the needs of the elderly and urban facilities for the elderly. Finally, the correlations between the characteristics of the respondents and the subjective evaluation values in the post-use measurement were compared in order to grasp the preferences of different population segments. This defined by economic and social attributes, with respect to the post-use evaluation indices, which could be used to put forward supplementary policy recommendations. Therefore, the proposed method is helpful for improving the overall planning of urban facility friendliness for the elderly in terms of construction strategy, as well as providing a significant reference for cities facing similar aging scenarios.
This paper also had its limitations. For example, considering to the limitations of the survey time and scale, the number of questionnaires used for post-measurement evaluation of urban facility friendliness for the elderly in Taipei City and New Taipei City should be further expanded. Meanwhile, this evaluation study was based on the urban administrative district’s hierarchical scale of Taipei City and New Taipei City. If the survey data allow it, the analysis could be deepened to the smallest administrative district level, i.e., the street-unit hierarchical scale, which may lead to more detailed and interesting research results.
Future directions of research similar to this article should focus on assessing the improvements made with respect to urban facilities’ friendliness for the elderly over time, as well as the creation of valid and reliable tools with which to assess urban facilities’ friendliness for the elderly across geographic regions.
5. Conclusions
There is an urgent need for better coordination between research and actual construction work being undertaken regarding the assessment of urban facilities’ friendliness for the elderly. At present, there is a lack of published peer-reviewed research on tools for the assessment of urban facilities’ friendliness for the elderly. In this study, it was found that the spatial and post-use measurement evaluations of urban facility friendliness regarding the elderly play complementary and corrective roles with respect to each other, which is of great practical significance in grasping the results when conducting comprehensive evaluations of urban facility friendliness for the elderly and in overall urban construction policy formulation. This paper detailed a targeted study focused on the evaluation of urban facility friendliness for the elderly in Taipei City and New Taipei City, which can be used meaningfully in the context of Taiwanese geography in China; however, this may not allow for the direct use of this evaluation tool in other regions. More research is needed in order to create valid and reliable tools for the assessment of urban facilities’ friendliness for the elderly across different geographic regions for subsequent evaluation.
Author Contributions
Conceptualization, L.Y. and H.-T.C.; methodology, L.Y. and H.-T.C.; software, L.Y. and Z.Q.; validation, Z.Q., X.J. and X.X.; formal analysis, L.Y. and Z.Q.; investigation, Z.Q.; resources, J.L. and X.J.; writing—original draft preparation, L.Y. and X.X.; writing—review and editing, H.-T.C. and J.L. All authors have read and agreed to the published version of the manuscript.
Funding
This research was funded by the Zhejiang Provincial Natural Science Foundation of China (No. LGF20E080015), National Social Science Foundation (Grant No. 22BRK020), Teaching Research and Reform Project of Zhejiang Institute of Science and Technology (No. 2023-jg40), and Project of Wenzhou Science and Technology Burea (No. R20220104).
Institutional Review Board Statement
Not applicable.
Informed Consent Statement
Not applicable.
Data Availability Statement
Data are unavailable due to privacy.
Conflicts of Interest
The authors declare no competing interests.
References
- Cox, P.R. The Aging of Populations and Its Economic and Social Implications. J. R. Stat. Soc. Ser. A 1958, 121, 253–254. [Google Scholar] [CrossRef]
- WHO. Global Age Friendly Cities: A Guide; World Health Organization: New York, NY, USA, 2007. [Google Scholar]
- Huang, X.; Gong, P.; White, M. Study on Spatial Distribution Equilibrium of Elderly Care Facilities in Downtown Shanghai. Int. J. Environ. Res. Public Health 2022, 19, 7929. [Google Scholar] [CrossRef] [PubMed]
- Zhu, H. Spatial Matching and Policy-Planning Evaluation of Urban Elderly Care Facilities Based on Multi-Agent Simulation: Evidence from Shanghai, China. Sustainability 2022, 14, 16183. [Google Scholar] [CrossRef]
- WHO. Measuring the Age-Friendliness of Cities: A Guide to Using Core Indicators; World Health Organization: New York, NY, USA, 2015. [Google Scholar]
- Alley, D.; Liebig, P.; Pynoos, J.; Banerjee, T.; Choi, I.H. Creating Elder-Friendly Communities: Preparations for an Aging Society. Gerontol. Soc. Work 2007, 49, 1–18. [Google Scholar] [CrossRef] [PubMed]
- Shiau, T.A.; Huang, W.K. User Perspective of Age-Friendly Transportation: A Case Study of Taipei City. Transp. Policy 2014, 36, 184–191. [Google Scholar] [CrossRef]
- Davern, M.; Winterton, R.; Brasher, K.; Woolcock, G. How Can the Lived Environment Support Healthy Ageing? A Spatial Indicators Framework for The Assessment of Age-Friendly Communities. Int. J. Environ. Res. Public Health 2020, 17, 7685. [Google Scholar] [CrossRef]
- Jia, W.Y.; Wang, X.R. Research Review on Evaluation Index for Age-friendly Community—A Case Study of Tianjin City. In Advances in Engineering Research; Kim, Y.H., Ed.; Atlantis Press: Amsterdam, The Netherlands, 2017; Volume 143, pp. 108–111. [Google Scholar]
- Orpana, H.; Chawla, M.; Gallagher, E.; Escaravage, E. Developing Indicators for Evaluation of Age-Friendly Communities in Canada: Process and Results. Health Promot. Chronic Dis. Prev. Can. 2016, 36, 214–223. [Google Scholar] [CrossRef]
- Wang, Y.; Gonzales, E.; Morrow-Howell, N. Applying WHO’s Age-Friendly Communities Framework to a National Survey in China. Gerontol. Soc. Work 2017, 60, 215–231. [Google Scholar] [CrossRef]
- Hu, S.Z.; Li, W.Y.; Huang, Y.R.; Huan, N.Q.; Wan, Y.W. Introduction to The Establishment of Taiwan’s “Elderly Friendly Environment—Town and Urban Level Location Database”. Health Technol. 2018, 4, 71–79. [Google Scholar]
- Kakegawa, S.; Yashiro, Y.; Ebihara, M.; Ohtsuki, A. Evaluation of Fire Safety Measures in Care Facilities for The Elderly by Simulating Evacuation Behavior. In Fire Safety Science—Proceedings of the Fourth International Symposium; International Association for Fire Safety Science: London, UK, 1994; pp. 645–656. [Google Scholar]
- Guangnian, X.; Qiongwen, L.; Anning, N.; Zhang, C. Research on Carbon Emissions of Public Bikes Based on The Life Cycle Theory. Transp. Lett. 2023, 15, 278–295. [Google Scholar] [CrossRef]
- Jiang, C.; He, J.; Zhu, S.; Zhang, W.; Li, G.; Xu, W. Injury-Based Surrogate Resilience Measure: Assessing the Post-Crash Traffic Resilience of the Urban Roadway Tunnels. Sustainability 2023, 15, 6615. [Google Scholar] [CrossRef]
- Wang, S.; Esther, H.K.Y.; Yu, Y.; Tsou, J.Y. Right to The City and Community Facility Planning for Elderly: The Case of Urban Renewal District in Hong Kong. Land Use Policy 2022, 114, 105978. [Google Scholar] [CrossRef]
- Carroll, S.; Jespersen, A.P.; Troelsen, J. Going Along with Older People: Exploring Age-Friendly Neighbourhood Design through Their Lens. J. Hous. Built Environ. 2020, 35, 555–572. [Google Scholar] [CrossRef]
- de Paiva, N.M.; Daniel, F.; da Silva, A.G.; Vicente, H.T. Age-friendly Coimbra city, Portugal, Perception and Quality of LIFE in A Sample of Elderly Persons. Cienc. Saude Coletiva 2019, 24, 1473–1482. [Google Scholar]
- Fatmah, F.; Dewi, V.P.; Priotomo, Y. Developing Age-Friendly City Readiness: A case study from Depok City, Indonesia. SAGE Open Med. 2019, 7, 2050312119852510. [Google Scholar] [CrossRef]
- John, D.H.; Gunter, K. engAGE in Community: Using Mixed Methods to Mobilize Older People to Elucidate the Age-Friendly Attributes of Urban and Rural Places. J. Appl. Gerontol. 2016, 35, 1095–1120. [Google Scholar] [CrossRef]
- Li, M.; Woolrych, R. Experiences of Older People and Social Inclusion in Relation to Smart “Age-Friendly” Cities: A Case Study of Chongqing, China. Front. Public Health 2021, 9, 779913. [Google Scholar] [CrossRef]
- Ng, S.-I.; Lim, X.-J.; Hsu, H.-C. The Importance of Age-Friendly City on Older People’S Continuity and Life Satisfaction. Int. J. Environ. Res. Public Health 2021, 18, 7252. [Google Scholar] [CrossRef]
- Ng, S.-I.; Lim, X.-J.; Hsu, H.-C.; Chou, C.-C. Age-friendliness of City, Loneliness and Depression Moderated by Internet Use during the COVID-19 Pandemic. Health Promot. Int. 2022, 38, daac040. [Google Scholar] [CrossRef]
- Nieboer, A.P.; Cramm, J.M. Age-Friendly Communities Matter for Older People’s Well-Being. Happiness Stud. 2018, 19, 2405–2420. [Google Scholar] [CrossRef]
- Segura Cardona, A.; Cardona Arango, D.; Segura Cardona, A.; Robledo Marín, C.; Muñoz Rodríguez, D. Friendly Residential Environments that Generate Autonomy in Older Persons. Int. J. Environ. Res. Public Health 2023, 20, 409. [Google Scholar] [CrossRef] [PubMed]
- Van Hoof, J.; Dikken, J.; Buttiġieġ, S.C.; van den Hoven, R.F.; Kroon, E.; Marston, H.R. Age-friendly Cities in the Netherlands: An Explorative Study of Facilitators and Hindrances in The Built Environment and Ageism in Design. Indoor Built Environ. 2020, 29, 417–437. [Google Scholar] [CrossRef]
- Wong, M.; Yu, R.; Woo, J. Effects of Perceived Neighbourhood Environments on Self-Rated Health among Community-Dwelling Older Chinese. Int. J. Environ. Res. Public Health 2017, 14, 614. [Google Scholar] [CrossRef] [PubMed]
- Wood, G.; Pykett, J.; Banchoff, A.; King, A.; Stathi, A.; Scientists. Employing Citizen Science to Enhance Active and Healthy Ageing in Urban Environments. Health Place 2023, 79, 102954. [Google Scholar] [CrossRef] [PubMed]
- Xie, L.L. Age-Friendly Communities and Life Satisfaction Among the Elderly in Urban China. Res. Aging 2018, 40, 883–905. [Google Scholar] [CrossRef]
- Zhai, Y.; Li, K.K.; Liu, J.J. A Conceptual Guideline to Age-Friendly Outdoor Space Development in China: How Do Chinese Seniors Use the Urban Comprehensive Park? A Focus on Time, Place, and Activities. Sustainability 2018, 10, 3678. [Google Scholar] [CrossRef]
- Zhang, F.; Li, D.; Ahrentzen, S.; Feng, H. Exploring the Inner Relationship among Neighborhood Environmental Factors Affecting Quality of Life of Older Adults Based on SLR–ISM Method. J. Hous. Built Environ. 2020, 35, 215–242. [Google Scholar] [CrossRef]
- Wang, F.; He, P.; Yuan, C.; Wang, S. Isolated or integrated? Evaluation of Ageing-Friendly Communities in Old Beijing City Based on Accessibility, Social Inclusion and Equity. Indoor Built Environ. 2020, 29, 465–479. [Google Scholar] [CrossRef]
- Zhao, D.X.; Han, Z.L.; Ren, Q.L.; Liu, W.B.; Pei, Q. Study on The Relationship between The Spatial Feature of Urban Population Aging and The Pension Resources Matching—Take the Three Provinces of The Northeast China as An Example. Resour. Sci. 2018, 40, 1773–1786. [Google Scholar]
- Yang, L.; Chang, H.T. Aged City Built Environment Friendliness: Taking Taipei and New Taipei Cities as Examples. Resour. Sci. 2021, 42, 2406–2418. [Google Scholar]
- TNDC. Population Estimates of the Republic of China (2020–2070); National Development Commission: Taipei, Taiwan, 2020. [Google Scholar]
- Kano, M.; Rosenberg, P.E.; Dalton, S.D. A Global Pilot Study of Age-Friendly City Indicators. Soc. Indic. Res. 2018, 138, 1205–1227. [Google Scholar] [CrossRef]

Disclaimer/Publisher’s Note: The statements, opinions and data contained in all publications are solely those of the individual author(s) and contributor(s) and not of MDPI and/or the editor(s). MDPI and/or the editor(s) disclaim responsibility for any injury to people or property resulting from any ideas, methods, instructions or products referred to in the content. |
© 2023 by the authors. Licensee MDPI, Basel, Switzerland. This article is an open access article distributed under the terms and conditions of the Creative Commons Attribution (CC BY) license (https://creativecommons.org/licenses/by/4.0/).