Article

Cyclic Loading and Unloading of Weakly Consolidated Sandstone with Various Water Contents

1
School of Mining and Geomatics Engineering, Hebei University of Engineering, Handan 056038, China
2
Collaborative Innovation Center of the Comprehensive Development and Utilization of Coal Resource, Handan 056038, China
3
Inner Mongolia Zoli Science and Technology Industry Development Company Limited, Ordos 017000, China
*
Author to whom correspondence should be addressed.
Sustainability 2023, 15(18), 13866; https://doi.org/10.3390/su151813866
Submission received: 31 July 2023 / Revised: 14 September 2023 / Accepted: 15 September 2023 / Published: 18 September 2023
(This article belongs to the Special Issue Geomechanics, Slope Stability and Sustainability)

Abstract

:
Weakly cemented rocks have a loose structure, poor mechanical properties, and soften and disintegrate upon contact with water. Mining operations cause damage and ruptures to rocks under cyclic loading and unloading, leading to serious disasters. This study investigated the effects of cyclic loading and unloading on the mechanical properties of weakly cemented sandstone (WCS) with various water contents (0–7.72%). A numerical model based on the particle flow theory simulated the behavior of WCS particles. The stress–strain relationships, damage and rupture patterns, energy evolution, and damage properties of WCS were examined using loading–unloading simulations. Water negatively affected the strength and elastic modulus of WCS. High water contents (>2.31%) increased the rupture probability and affected the rupture modes. Ruptures mainly occurred via the main fissure and caused cleavage damage; however, instances of tensile damage and shear slippage increased with an increasing water content. The elastic, dissipation, and total energies gradually increased with increasing cyclic loading and unloading. The damage factors of WCS with different water contents gradually increased with the growth rate. The mechanical properties of the sandstone were deteriorated by water, which increased the peak value of the damage factor from 0.77 for 0% moisture to 0.81 for 7.72% moisture.

1. Introduction

Coal mining has rapidly developed in Western China and many modern large-scale mines have been constructed to extract coal from Jurassic and Cretaceous coal seams. However, the strata in these regions primarily consist of weak water-rich rocks. These rocks exhibit characteristics such as low strength, poor cementation, susceptibility to softening and swelling when exposed to water, and vulnerability to weathering [1,2,3]. During high-intensity mining operations, the rock surrounding tunnels is subjected to repeated cyclic loading and unloading, which can cause significant deformation and even roof collapses. Therefore, it is necessary to study the effects of cyclic loading on weakly cemented sandstone (WCS) with various water contents to establish a theoretical foundation that can be used to prevent the catastrophic destabilization of the rock surrounding roadways.
Scholars from both domestic and international institutions have utilized various numerical simulation techniques such as the finite difference element method (FDEM), four-dimensional lattice spring model, and thermo-elastoplastic damage model to investigate the mechanical and fracture responses of different materials under different loading conditions. These studies focus on the failure characteristics of rock under cyclic loading and unloading [4,5]. For example, Li et al. [6] analyzed the damage evolution patterns of sandstone under different water-bearing conditions and showed that the moisture content affected the strength and toughness of the rock. Yang et al. [7] investigated the crack evolution and damage characteristics of water-bearing sandstone under cyclic loading and found that it was prone to microcracks. As the number of loading cycles increased, the cracks gradually expanded, which reduced the tensile strength and deformation capacity of the samples. Wu et al. [8] considered the energy-dissipation mechanisms and fatigue damage characteristics of rocks under cyclic loading by conducting cyclic loading tests under various loading modes. Ji et al. [9] conducted triaxial loading–unloading tests with granite and discovered that the rock exhibited a periodic energy evolution under different loading modes. Yang et al. [10] investigated the mechanical properties of sandstone under different states and analyzed the deformation behavior and fracture characteristics of WCS specimens with various water contents using uniaxial compression tests under different loading conditions. Numerical simulations and theoretical analyses have also been used to investigate the mechanical properties of weakly cemented rocks during cyclic loading and unloading [11,12,13].
Currently, there are some studies on the cyclic loading and unloading of weakly cemented rocks under different moisture contents. However, most of these studies are based on experiments or simulations using homogeneous materials, which differ from the actual geological conditions. In addition, there is a limited amount of in-depth research on the mechanism of cyclic loading and unloading of weakly cemented rocks, both domestically and internationally. Hence, we intended to analyze the mechanical response characteristics and establish fatigue damage laws. This work provides a theoretical basis to support weakly cemented roadways with different water contents. The specific workflow is illustrated in Figure 1.

2. Numerical Simulation of WCS with Various Water Contents under Cyclic Loading and Unloading

2.1. Numerical Modeling of Particle Flow

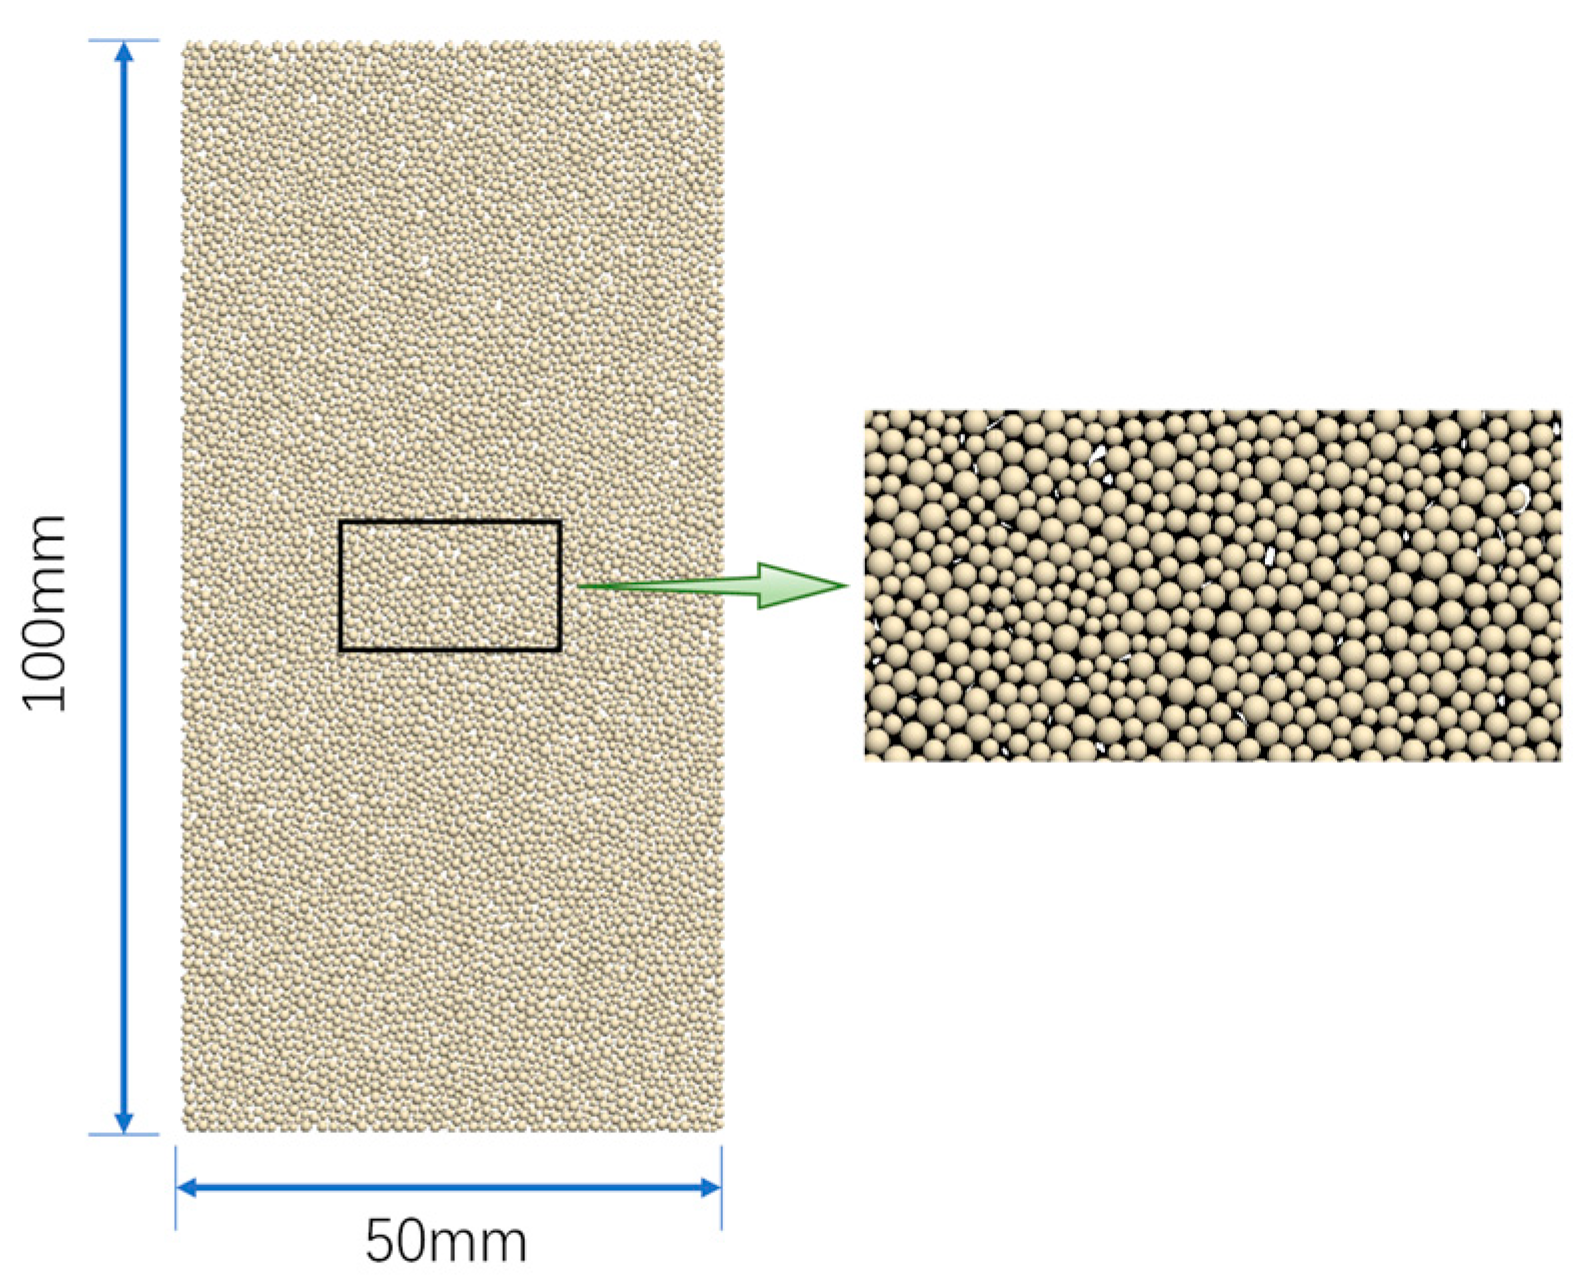
The particle flow code two dimensional (PFC2D) method is based on the distinct element method (DEM), which is a numerical technique to simulate the interactions between discrete particles. A numerical model of a WCS sample with dimensions of ϕ50 × 100 mm was established based on particle flow theory using the PFC2D program (Figure 2). The model consisted of 6339 particles connected by parallel bonds. The parallel-bonding intrinsic model was selected because it simulates weak cementation more realistically than the other available models. This model is based on independent fine-scale parameters such as the effective modulus and stiffness ratio, which can affect the macroscopic mechanical properties of a material. To ensure that the numerical model accurately reflected the stress performance of WCS, the trial-and-error and previous parameter calibration methods were used to select the fine-scale parameters of the rock [14], as shown in Table 1.

2.2. Verification of the Fine-View Parameters

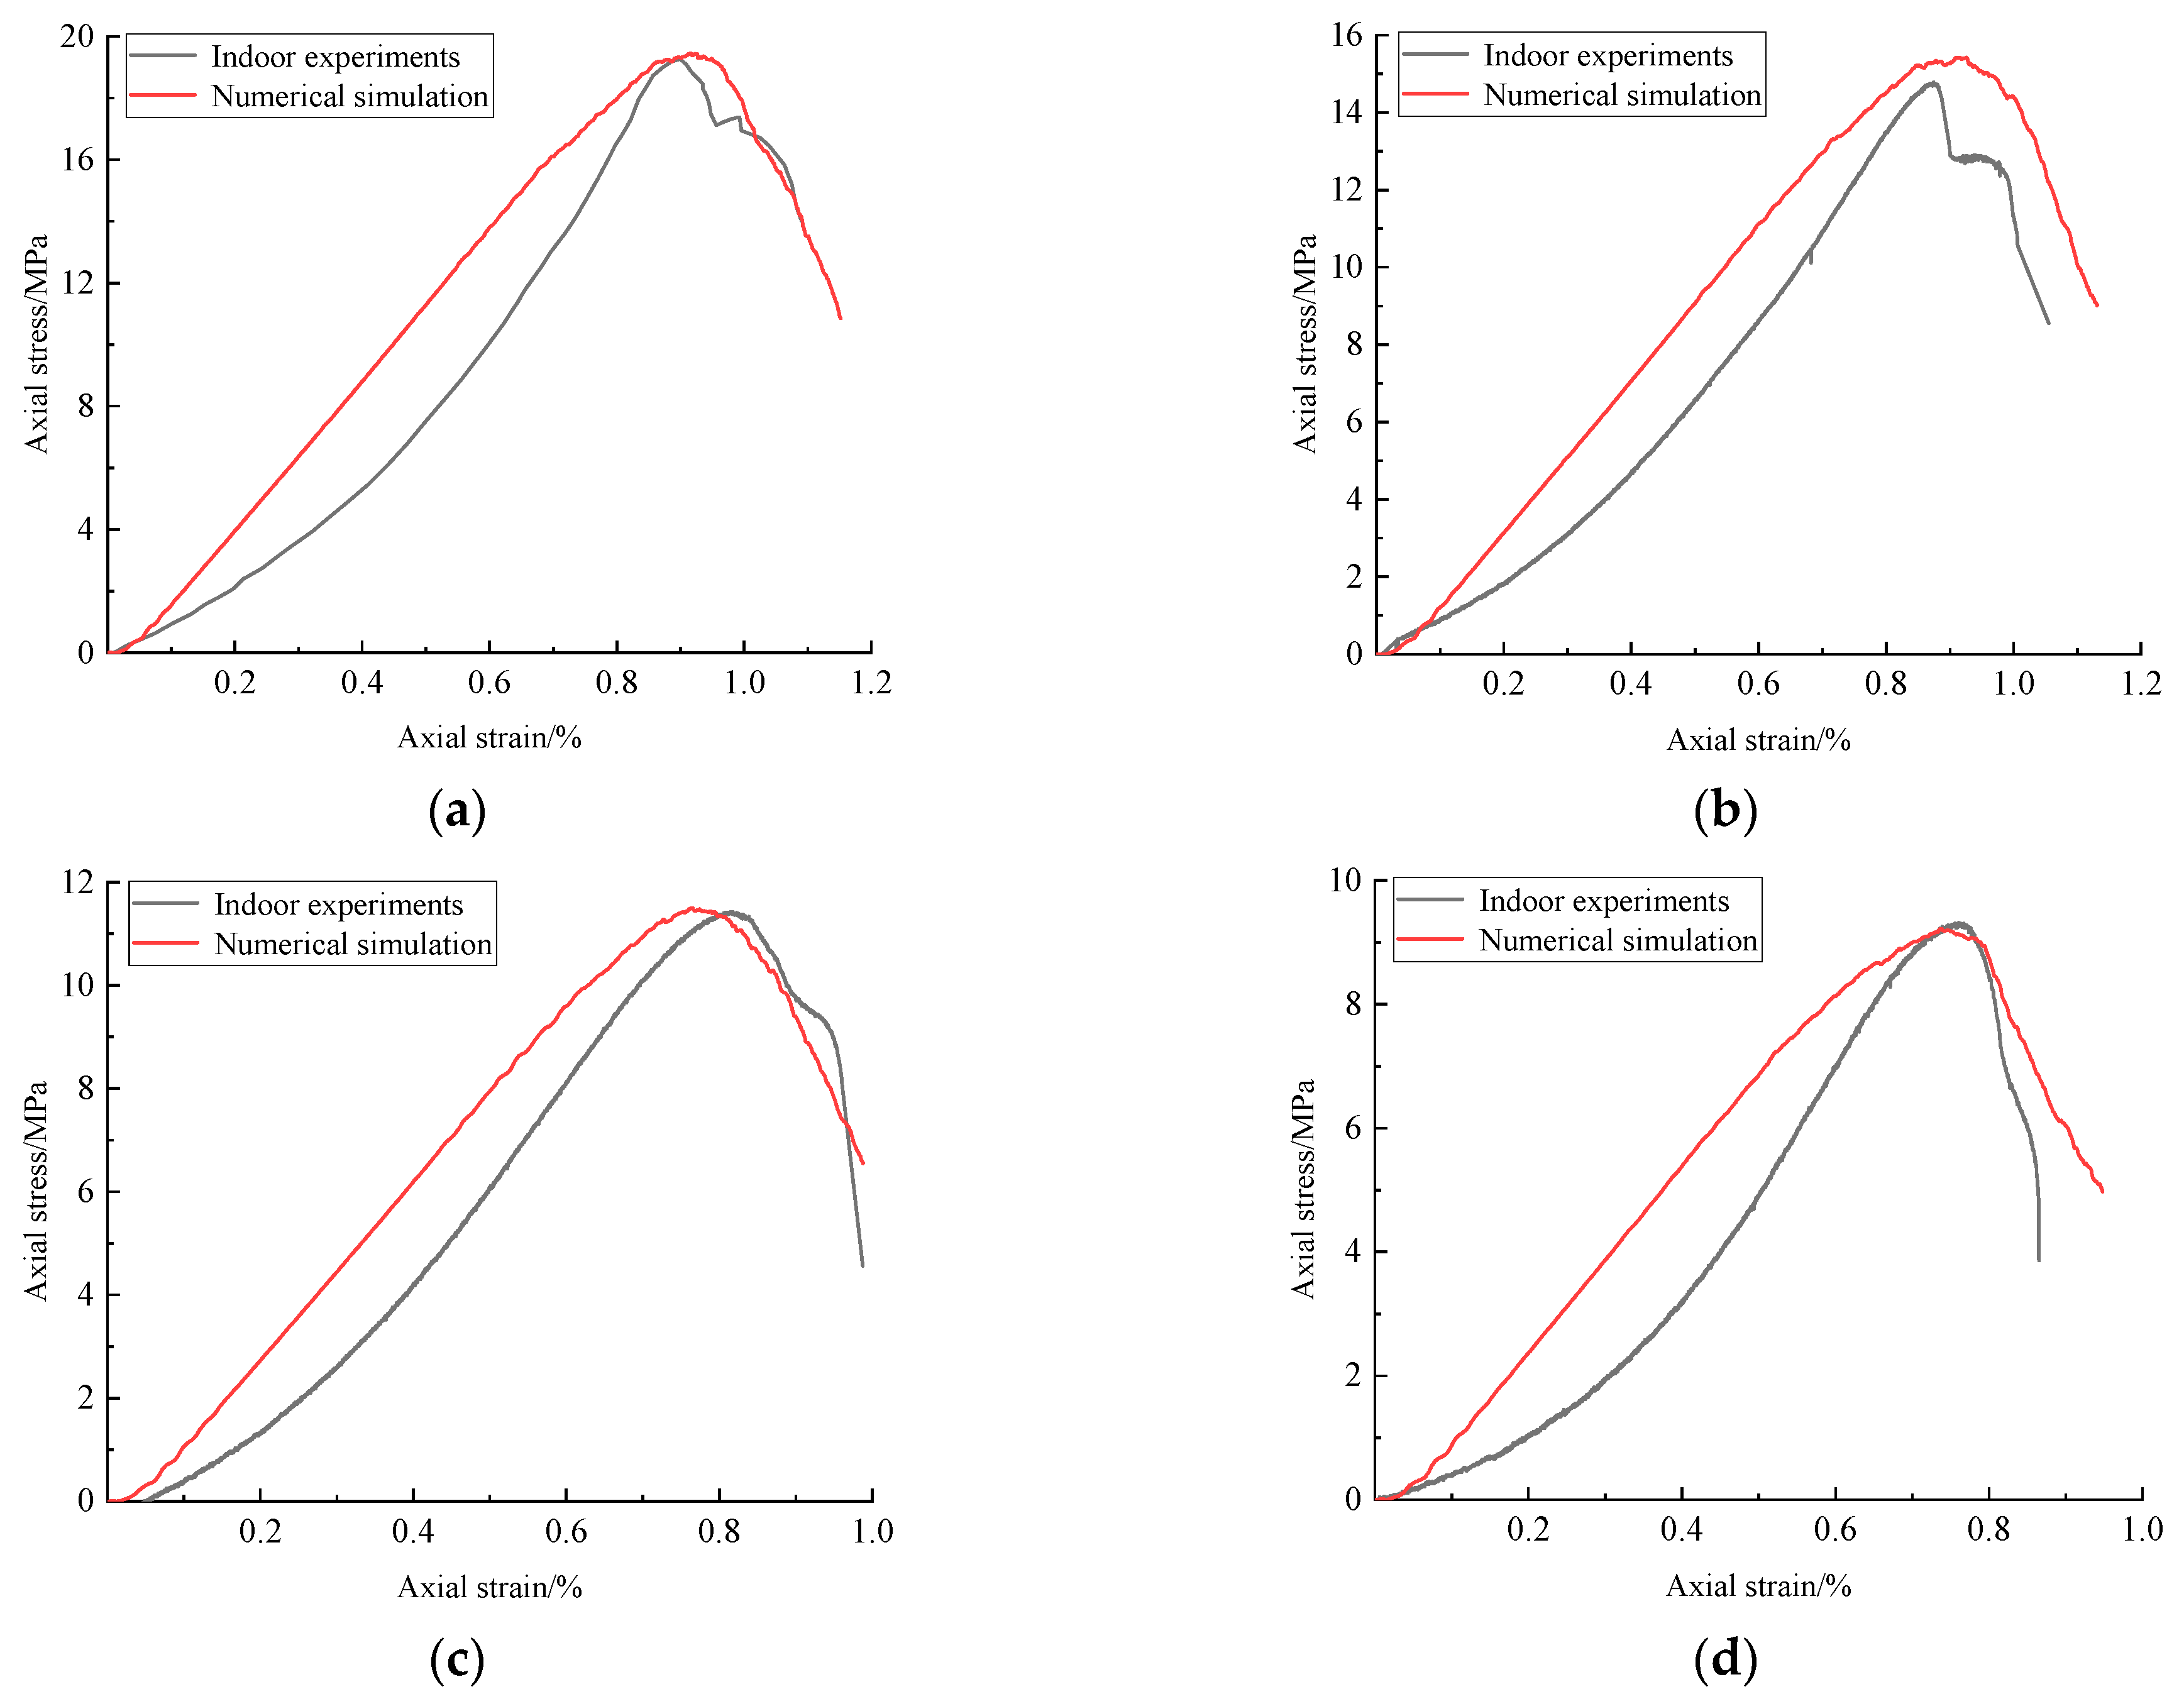
As PFC2D itself has no concept of water, to simulate WCS with different water contents, based on the uniaxial compression data for WCS with different water contents in the laboratory, the equivalent substitution method was adopted. It was considered that the strength and failure characteristics of the numerical model were in good agreement with the laboratory test, enabling the characterization of WCS with different water contents [15]. The fine-scale parameters were verified to ensure that the proposed particle flow model could be used to simulate the uniaxial cyclic loading and unloading of WCS. The basic mechanical parameters obtained from indoor uniaxial compression experiments are presented, along with those derived from the numerical simulations, in Table 2. The relative errors between the indoor experiments and numerical simulations for the peak strength of the rocks under uniaxial compression and the elastic modulus were less than 5% and 10%, respectively. These errors were relatively small and they were within an acceptable range for this study. The stress–strain curves obtained from the uniaxial compression experiments and numerical simulations for WCS with various water contents are shown in Figure 3. The two curves showed the same trends. Therefore, the proposed numerical model could accurately simulate the mechanical properties of WCS.

2.3. Simulation of WCS with Various Water Contents under Cyclic Loading and Unloading

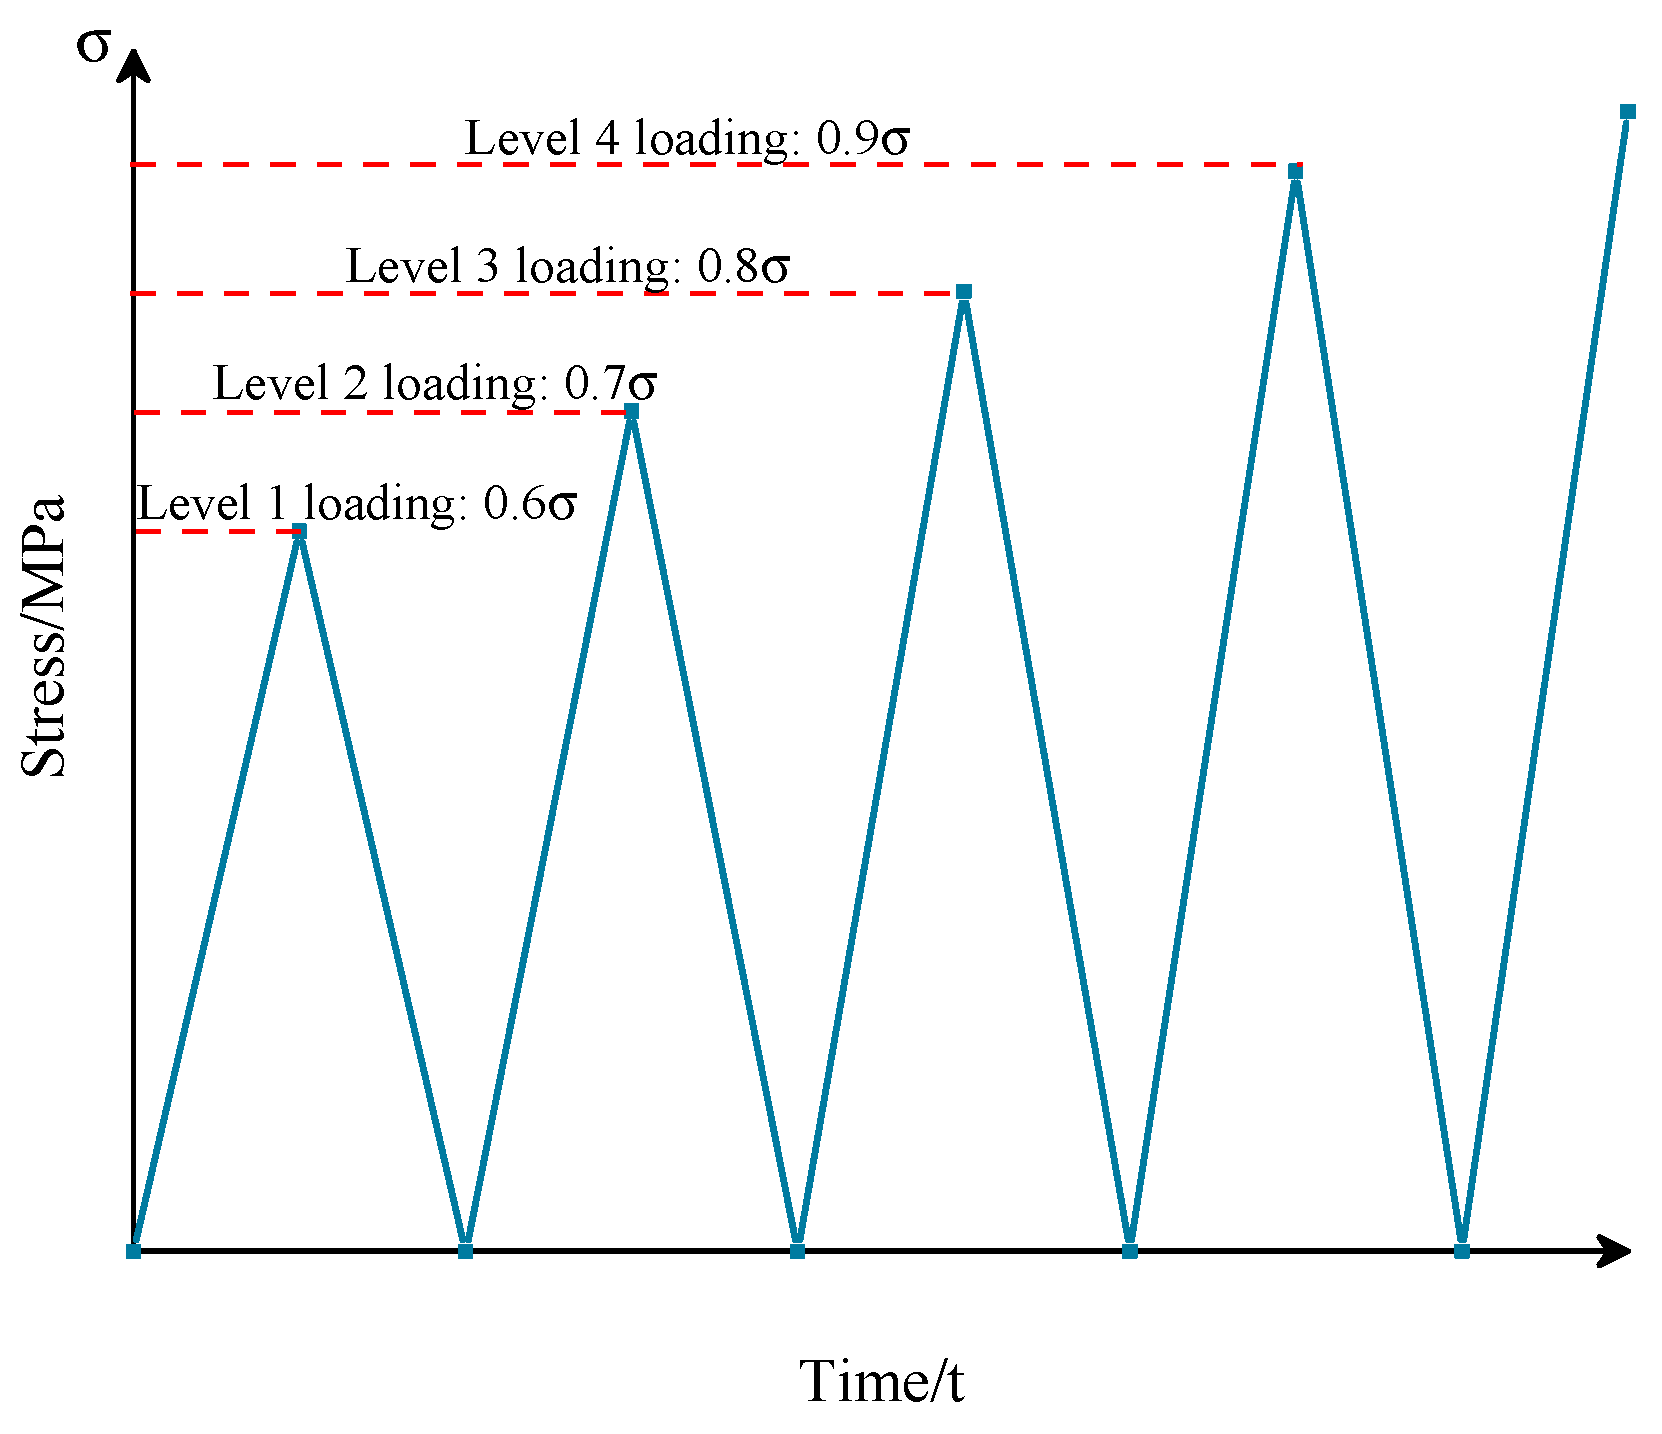
Uniaxial compression simulations of WCS with various water contents under cyclic loading and unloading were conducted. The peak strengths of the samples in the numerical simulation were defined based on laboratory uniaxial compression tests. The cyclic loading and unloading simulation used the stress control method. In the first cycle, the sample was loaded to 60% of the preset peak value, then unloaded to 0%. In subsequent cycles, the sample was loaded to 70%, 80%, and 90% of the preset peak value. The numerically simulated cyclic loading and unloading stress paths are shown in Figure 4.

3. Effects of Water Content on the Mechanical Properties of WCS under Cyclic Loading and Unloading

Data were extracted from the numerical simulation of WCS with various water contents under cyclic loading and unloading to study the stress–strain behavior, rupture morphology, energy evolution law, and damage characteristics of the rock. The effects of mining on the rock were considered.

3.1. Effects of Water Content on the Stress–Strain Behavior of WCS

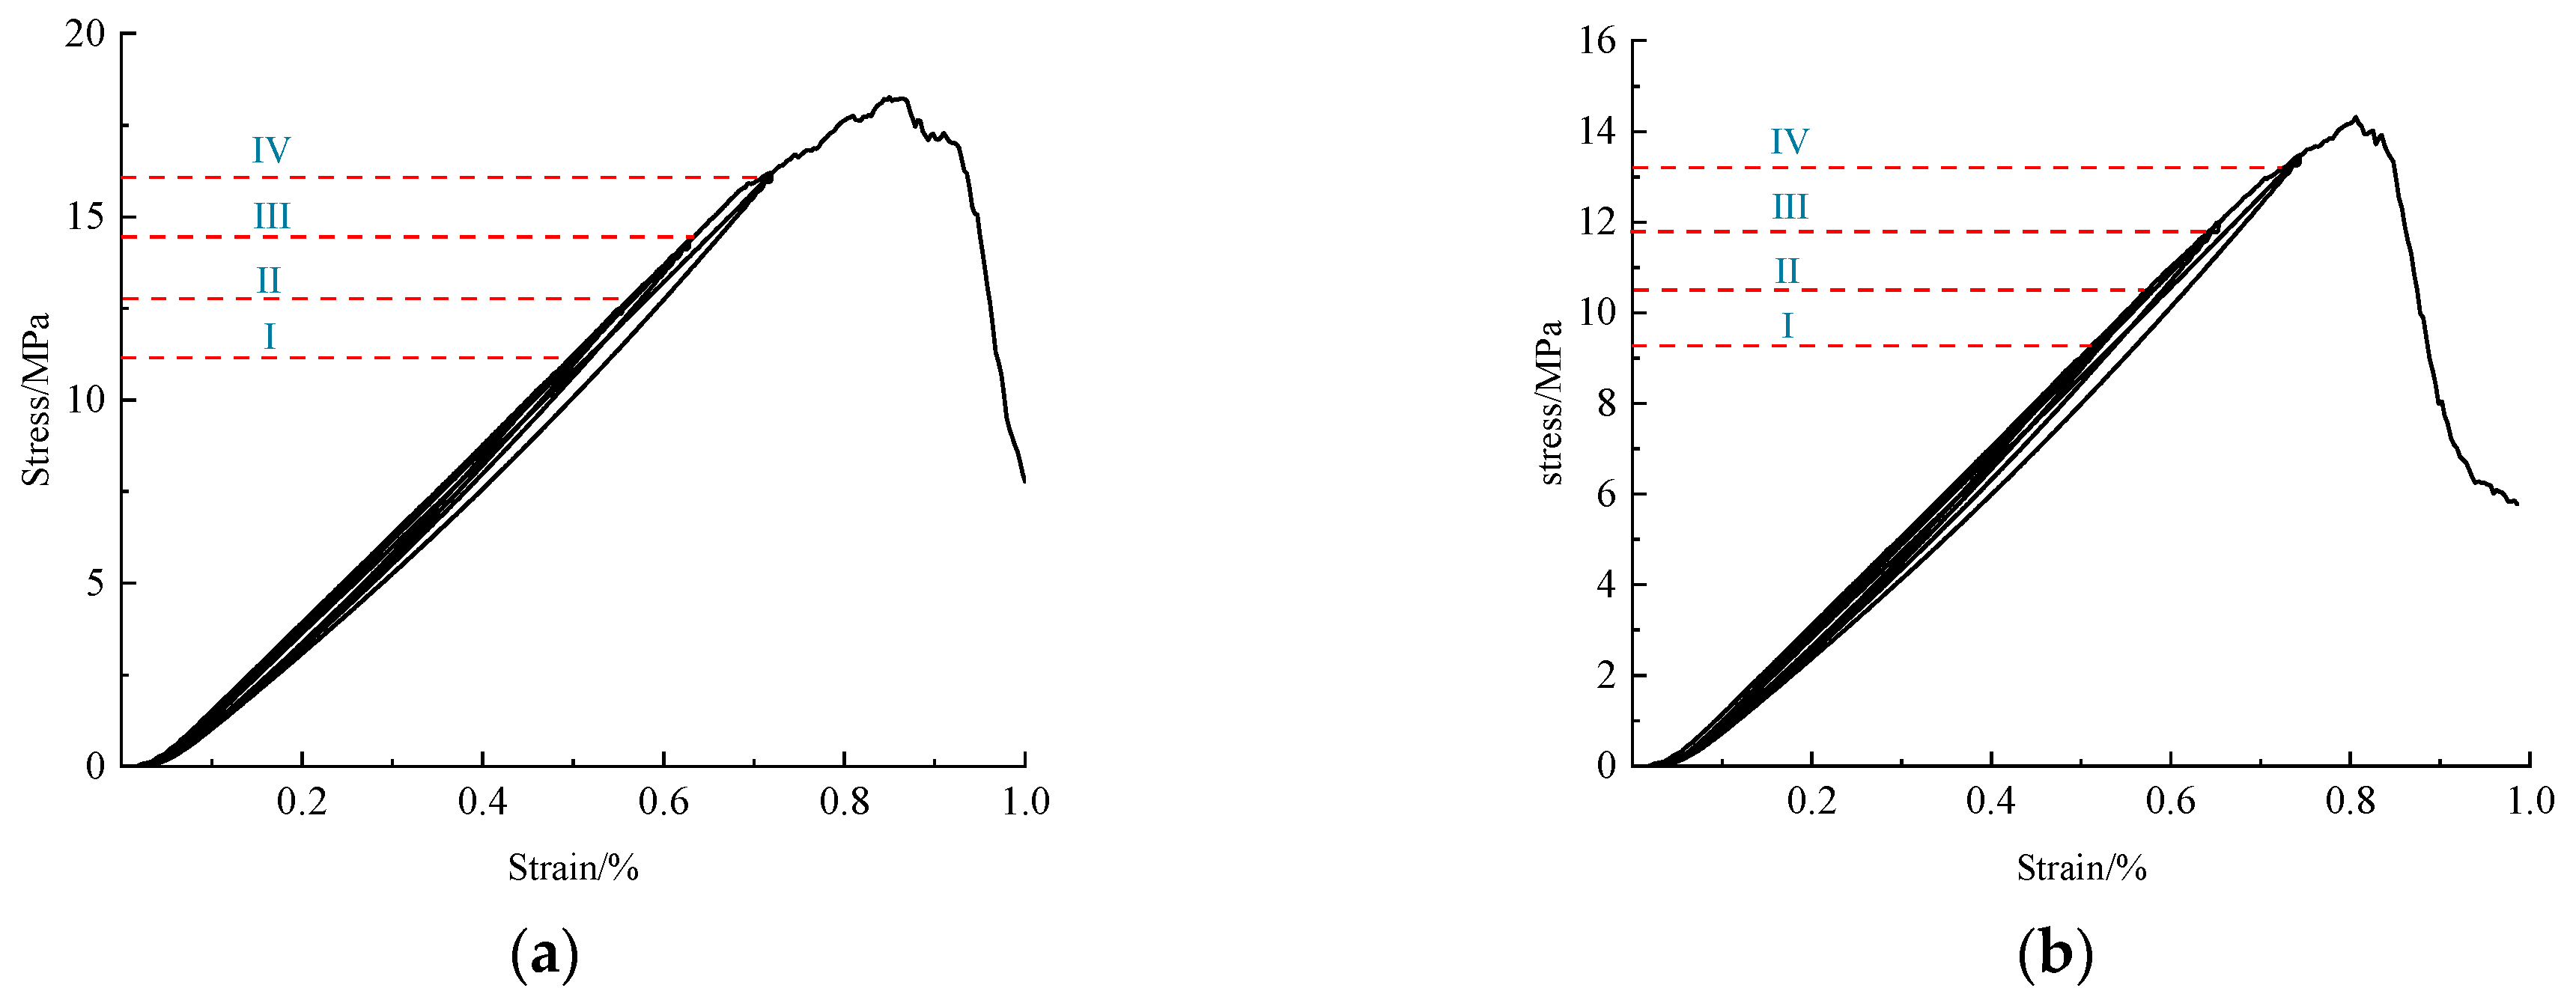
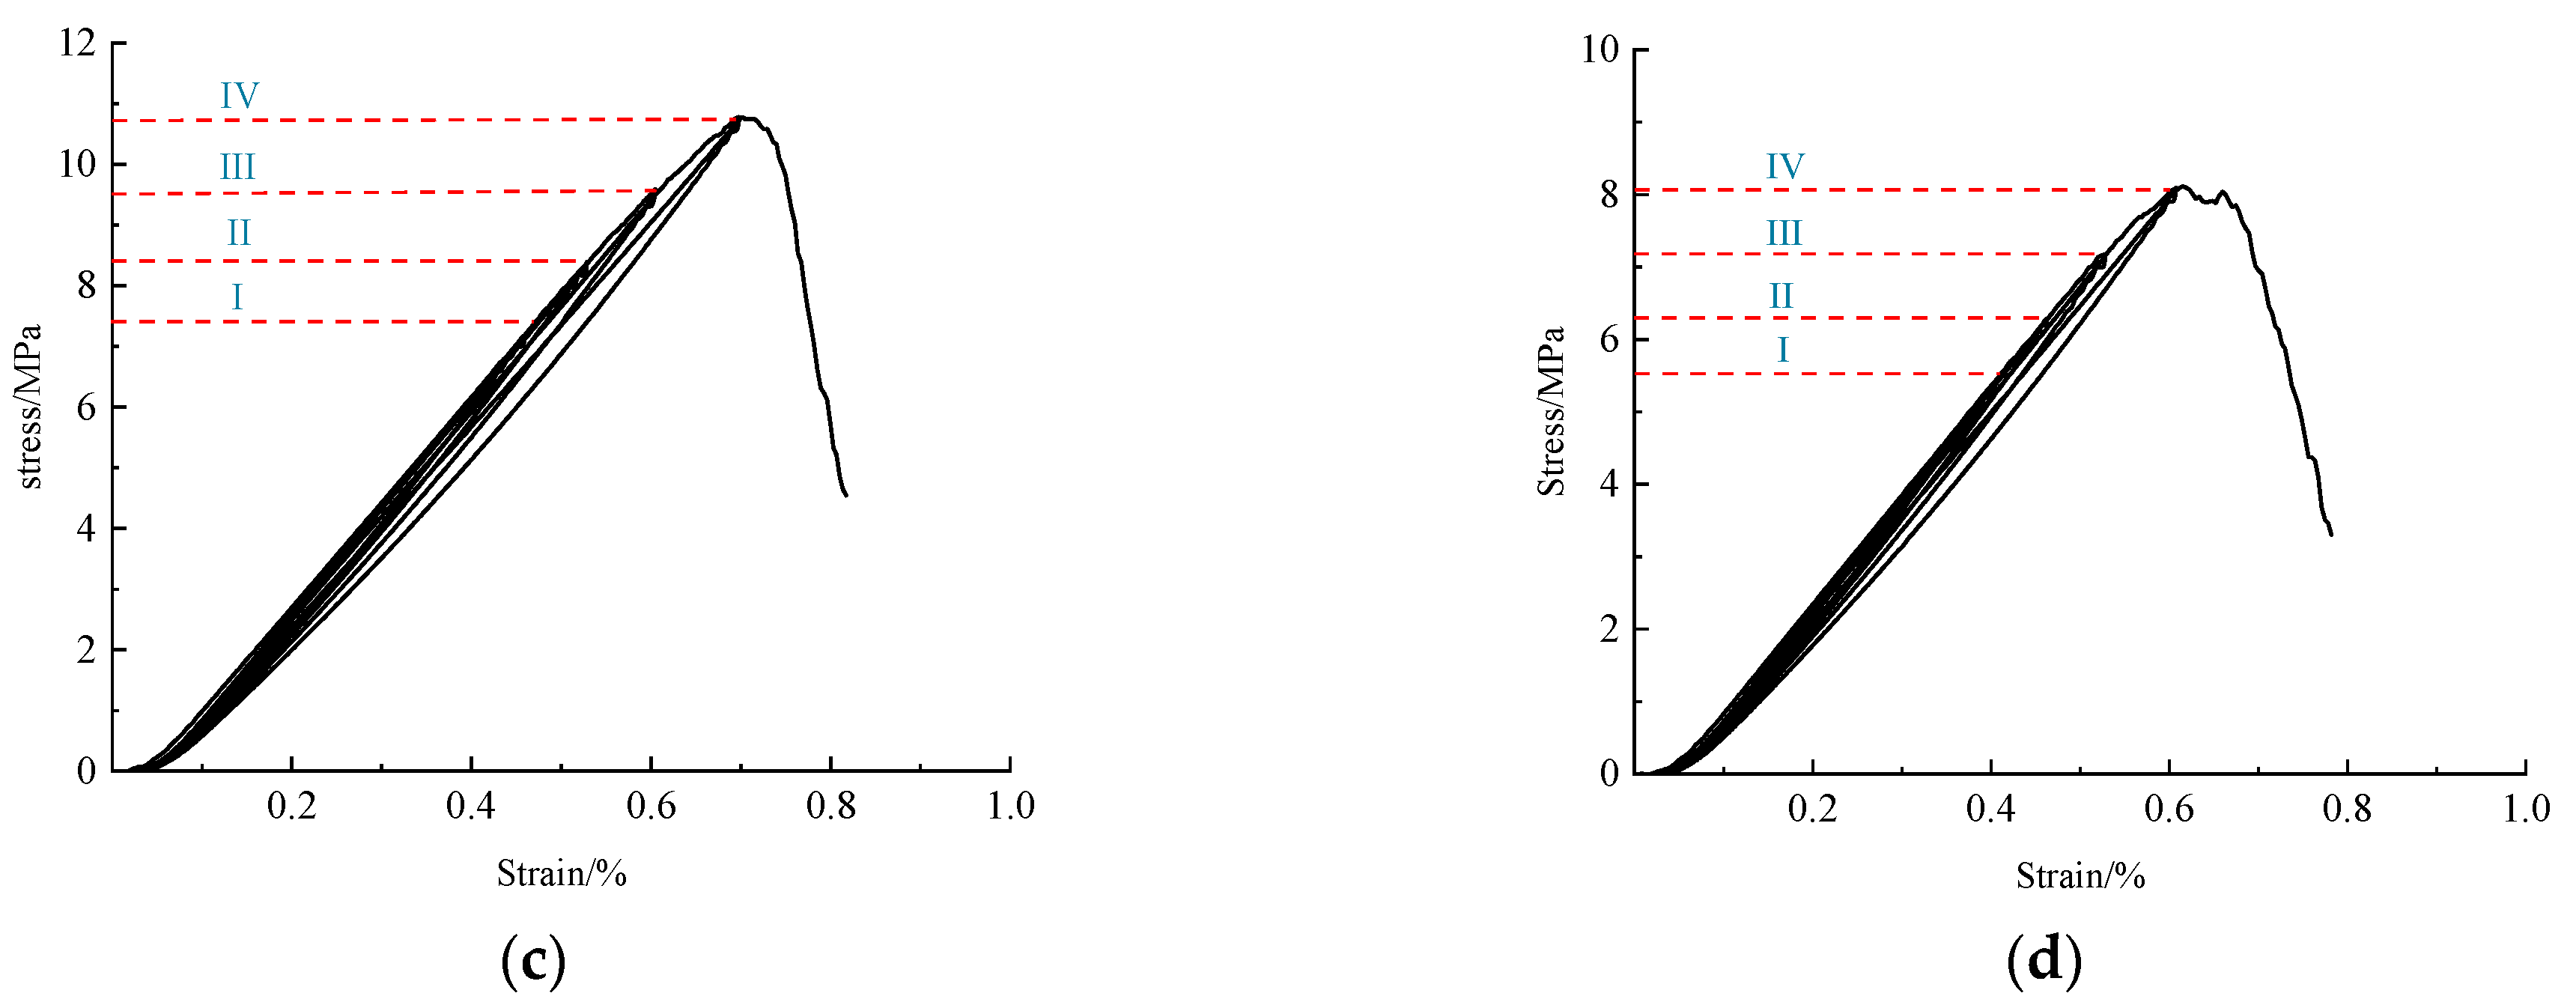
Figure 5 shows the variation in the mechanical parameters of WCS under cyclic loading and unloading at different water contents, I–IV indicates the level of cyclic loading and unloading. All the curves showed the same trends and rapidly dropped off above the peak strength, indicating transient brittle-type damage. When the water content was constant, the loading and unloading segments of the stress–strain curves did not overlap. Moreover, the loading curve for each cycle was higher than the unloading curve and a hysteresis loop was formed after each cycle owing to the unrecoverable plastic deformation of the rock. As the number of cycles increased, the area of the hysteresis loop gradually increased owing to the accumulation of plastic deformation in the rock.
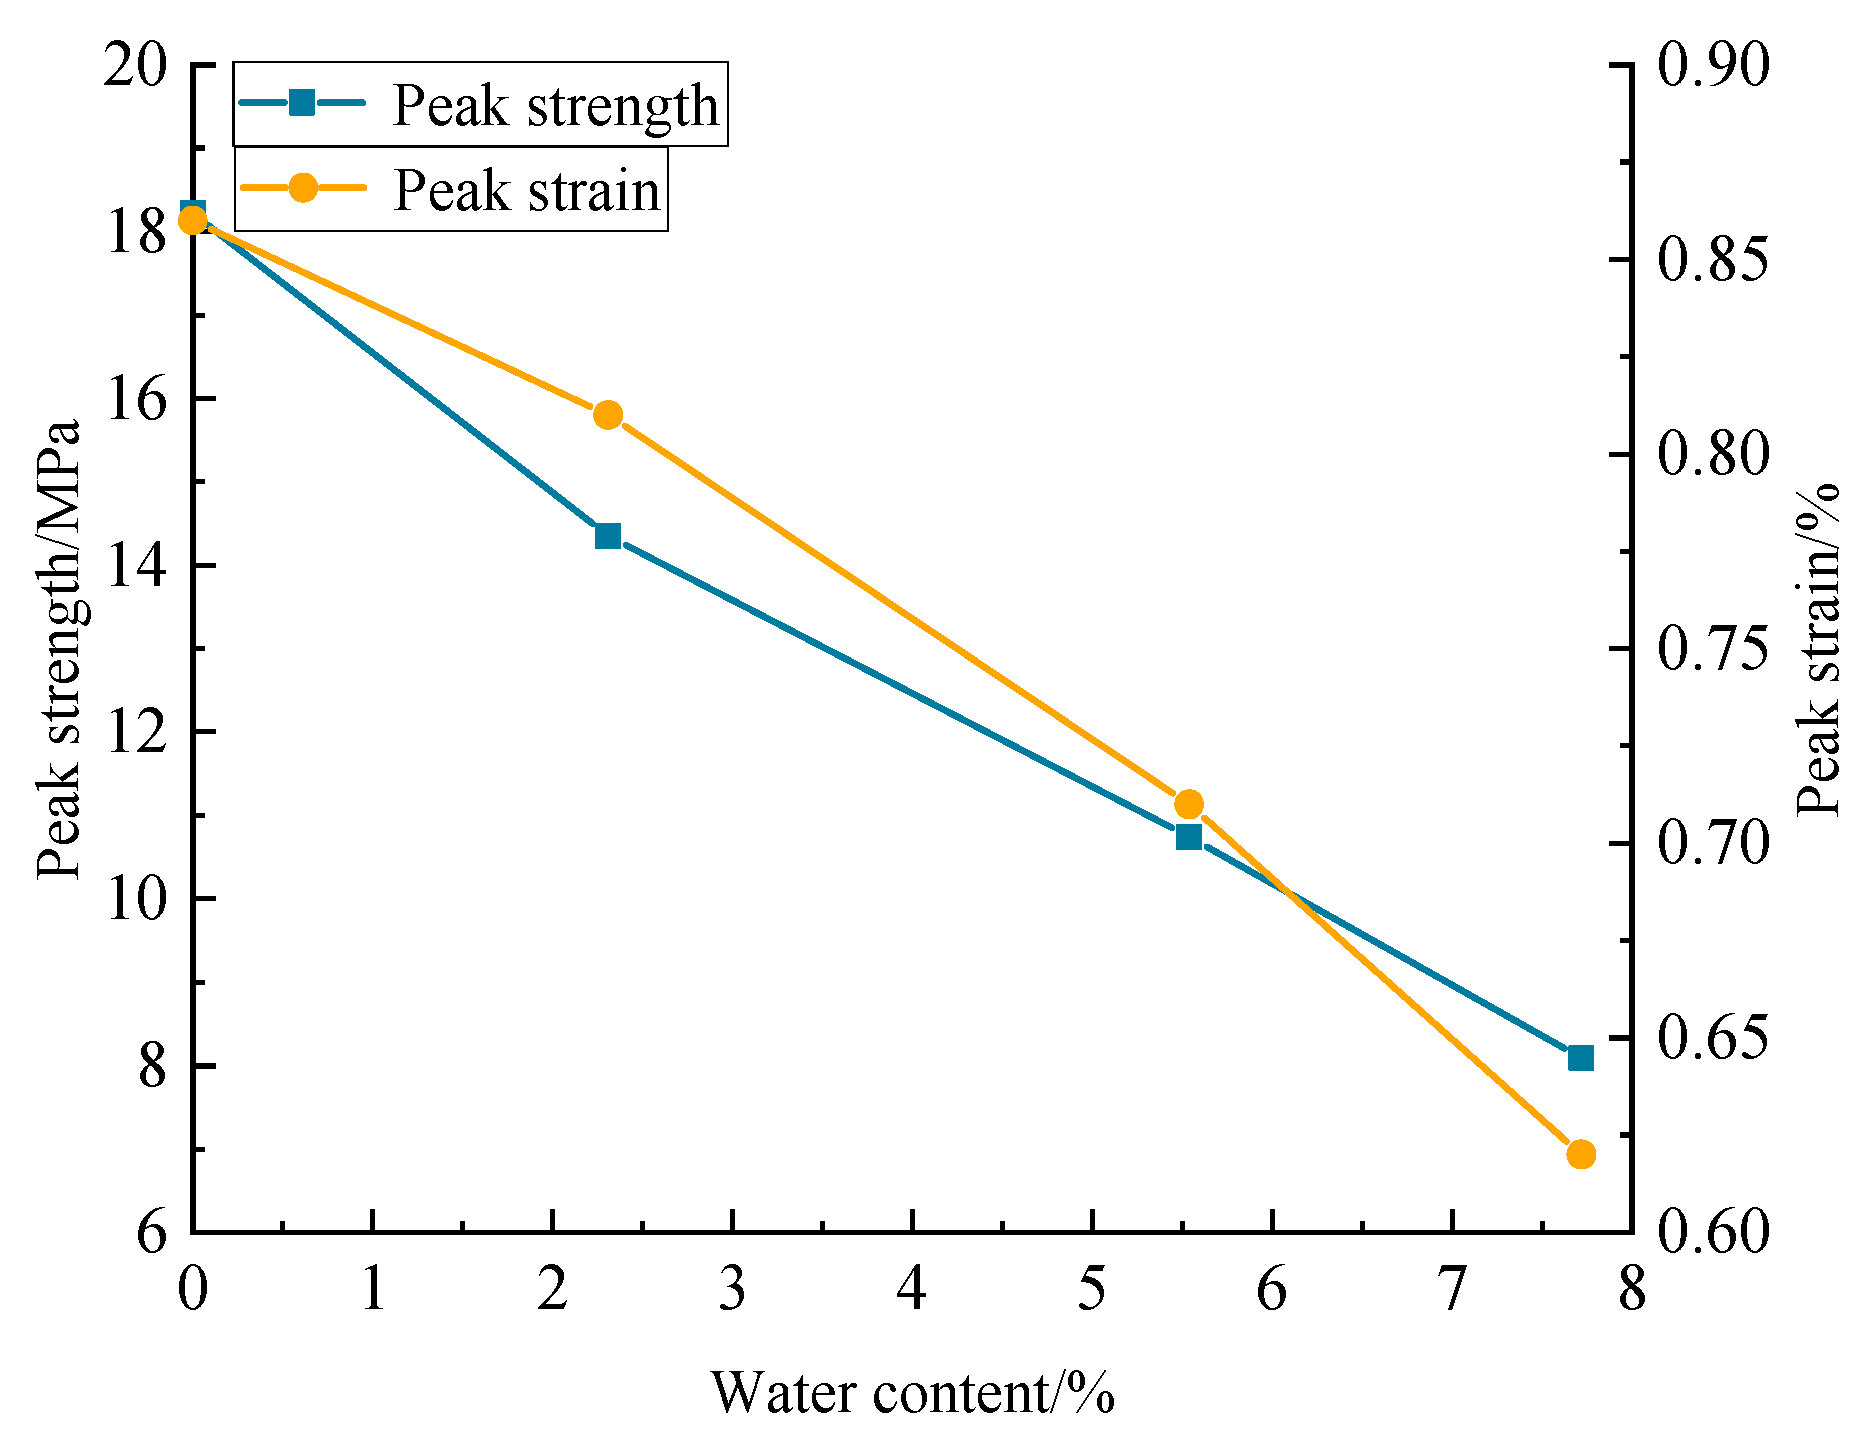
Figure 6 shows the variations in the mechanical parameters of WCS with various water contents under cyclic loading and unloading. The peak strength and peak strain decreased as the water content increased. Compared with those at a water content of 0%, the peak strengths decreased by 21.32%, 25.03%, and 24.64% and the peak strains decreased by 5.81%, 17.44%, and 27.91% when the water contents were 2.31%, 5.54%, and 7.72%, respectively. When the water content is relatively low, water usually exists as bound water, which causes wear of the rock skeleton, hydration, and a lubrication effect. This reduces the friction between the internal particles, which reduces the strength of the rock and the peak strain. As the water content approaches saturation, some water begins to exist inside the pores as free water. A water film is formed between the free water and the inner wall of the pore, generating a certain pore-water pressure. The linking effect between the free water and the water film results in a certain stiffness being maintained inside the rock, which macroscopically manifests as a slight decrease in the peak strength [16].
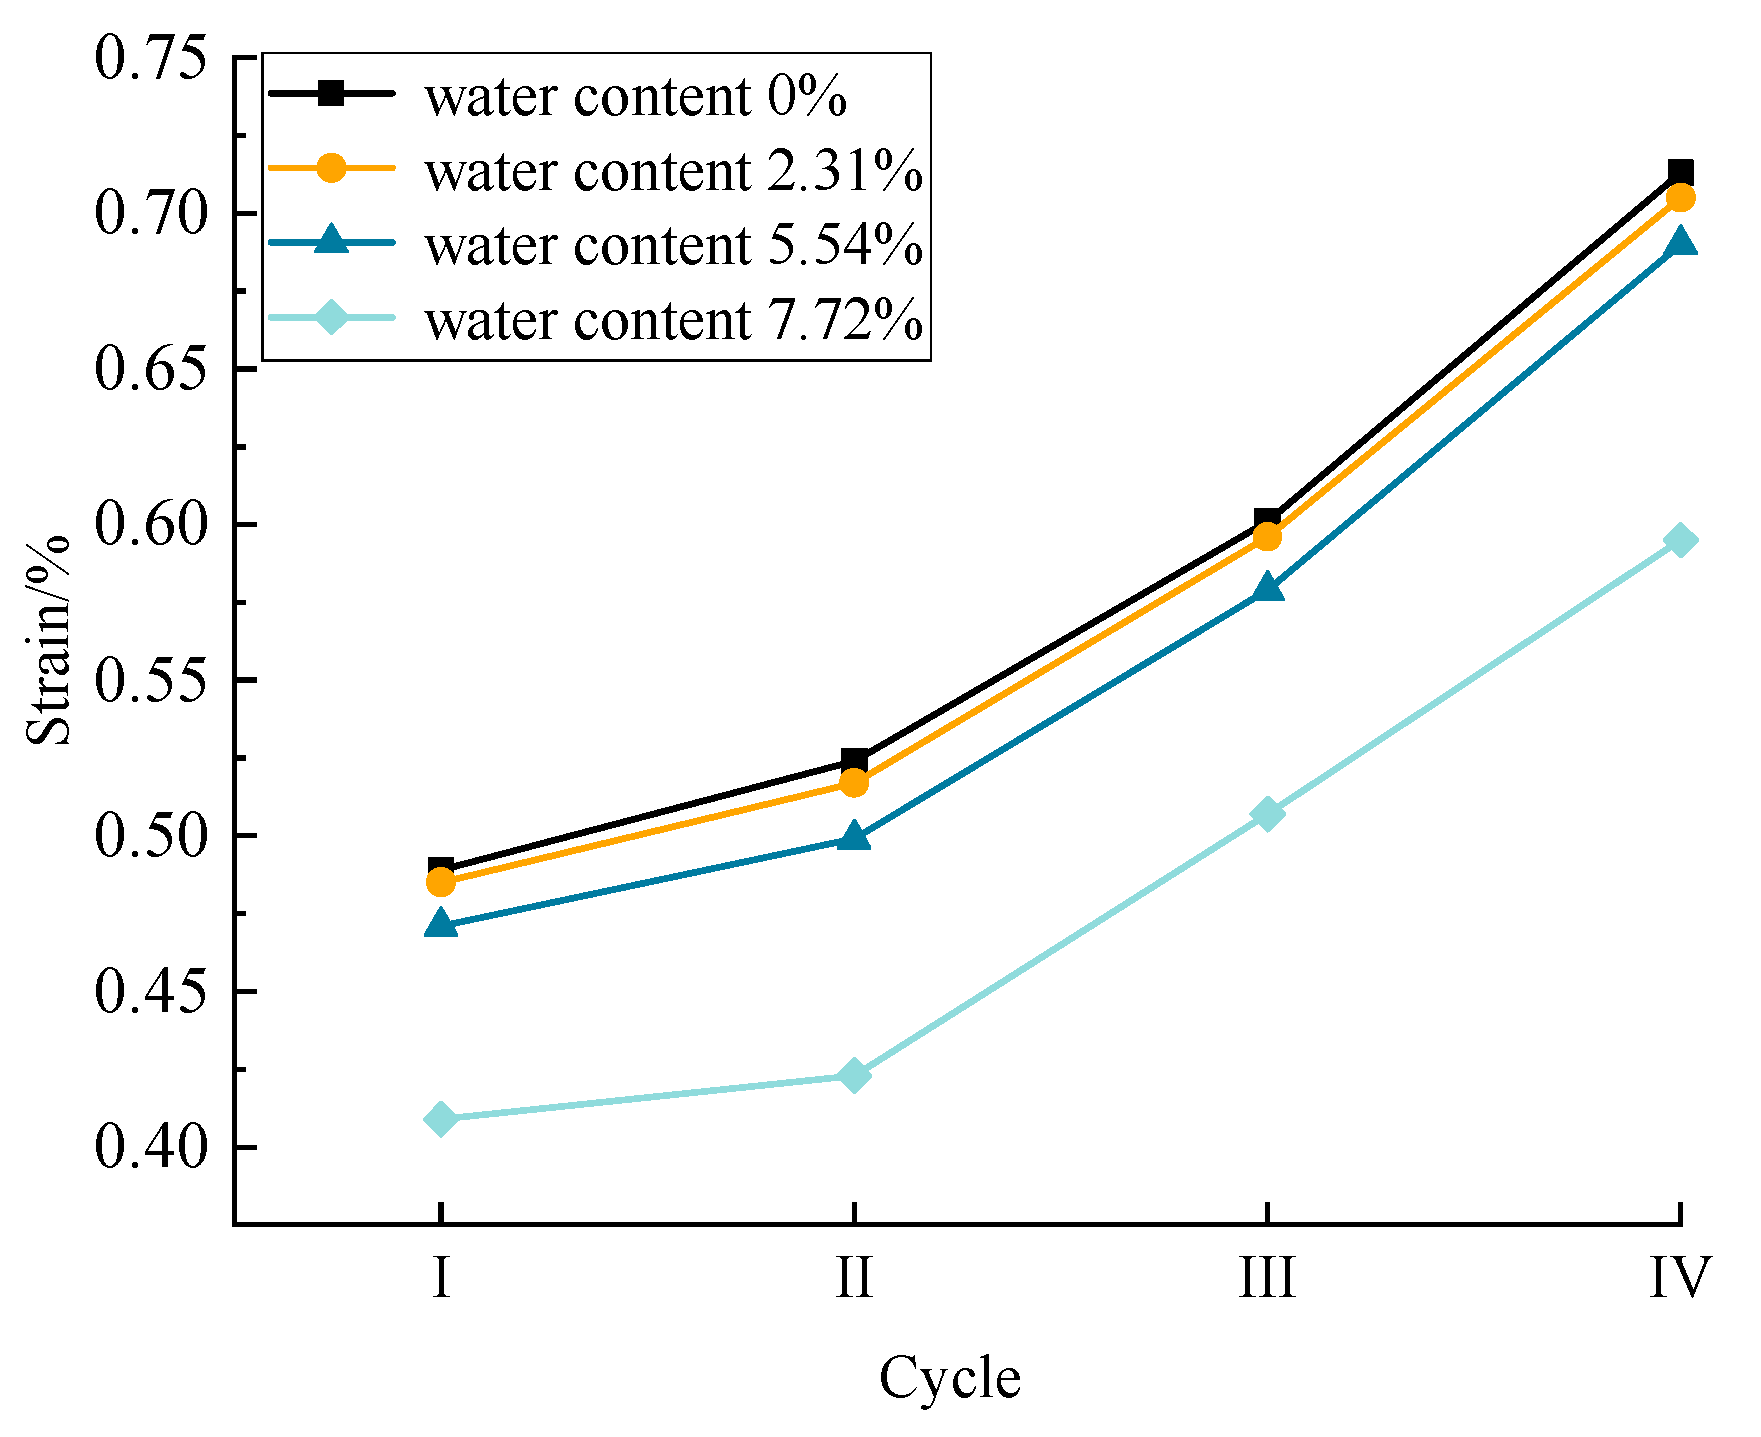
Figure 7 shows the relationship between the number of cyclic loadings and unloadings and the residual strain in WCS with various water contents. As the number of cyclic loadings and unloadings increased, the residual strain in the rock gradually increased, which indicated that the residual strain in the rock was cumulative. Moreover, the increase in the residual strain was nonlinear, based on an analysis of the change in the number of cracks in the rock during the simulation. The internal cracks of the rock may have been compacted and accompanied by the generation and expansion of new cracks during the cyclic loading and unloading process. The increase in the residual strain was the greatest when the loading and unloading stress was greater than 70% of the peak strength.
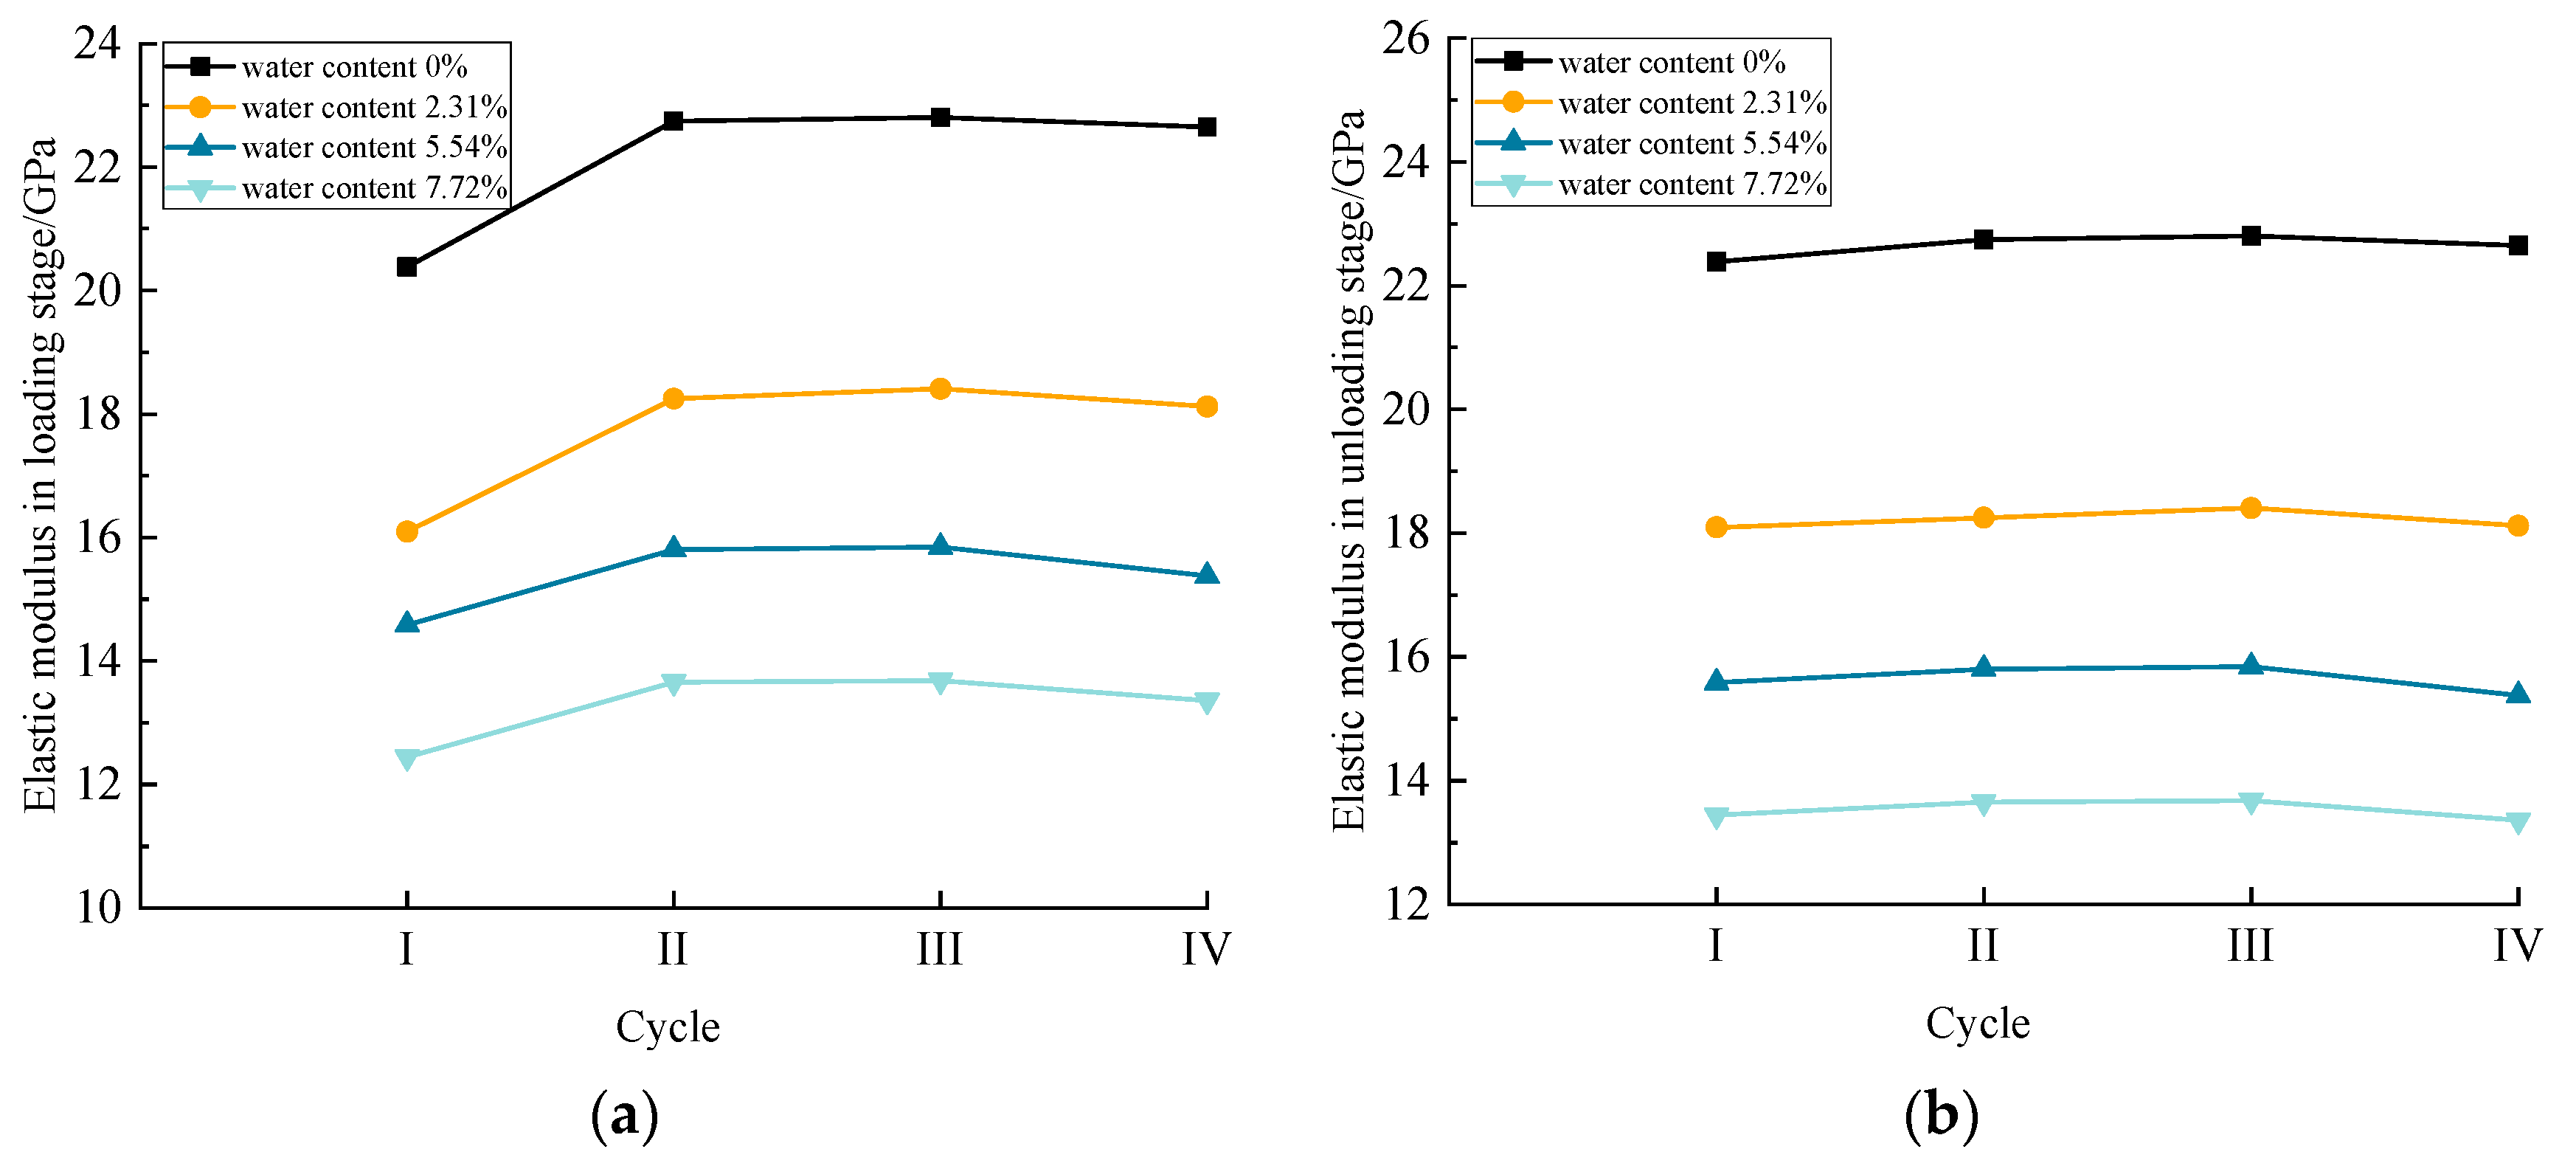
The modulus of elasticity is a crucial parameter to characterize rock deformation and reflects the behavior of the rock during the elastic deformation stage. The elastic modulus was calculated from the ratio between the difference in the maximum and minimum stresses during a single loading–unloading cycle and the corresponding axial strain [17]. Figure 8 shows the relationship between the elastic modulus of WCS and the cyclic loading and unloading. During the loading stage (Figure 8a), the elastic modulus initially rapidly increased and then stabilized as the number of cycles increased. However, under the same stress level, WCS with a higher water content exhibited a lower elastic modulus. This was because water filled the pore spaces and reduced the porosity of the rock. The reduced porosity altered the stress paths and produced an uneven stress distribution within the rock, which reduced its strength and elastic modulus. There was a sharp increase in the elastic modulus before the second loading cycle, which was caused by the compaction of the pores within the sandstone as it transitioned to the elastic phase.
During the unloading stage (Figure 8b), the elastic modulus showed minor changes as the number of cycles increased. This was because the primary pores in the rock were already compacted during the loading phase, which increased the elasticity of WCS and reduced the effect of unloading on the pore spaces. After the same number of cycles, higher water contents corresponded with a lower elastic modulus. In materials exhibiting inelastic deformation characteristics, the change in the unloading elastic modulus depends on the properties of the material and the loading conditions. Once the loading stress reaches a certain threshold, the unloading elastic modulus starts to decrease. During this process, the unloading modulus may be greater than or equal to the initial elastic modulus [18]. Therefore, the main reasons for the change in the unloading elastic modulus were the weakening of the interparticle connections, physicochemical interactions with certain substances that altered the mechanical properties, and a gradual decrease in the rock stiffness as the water content increased.

3.2. Effect of Water Content on the Fracture Morphology

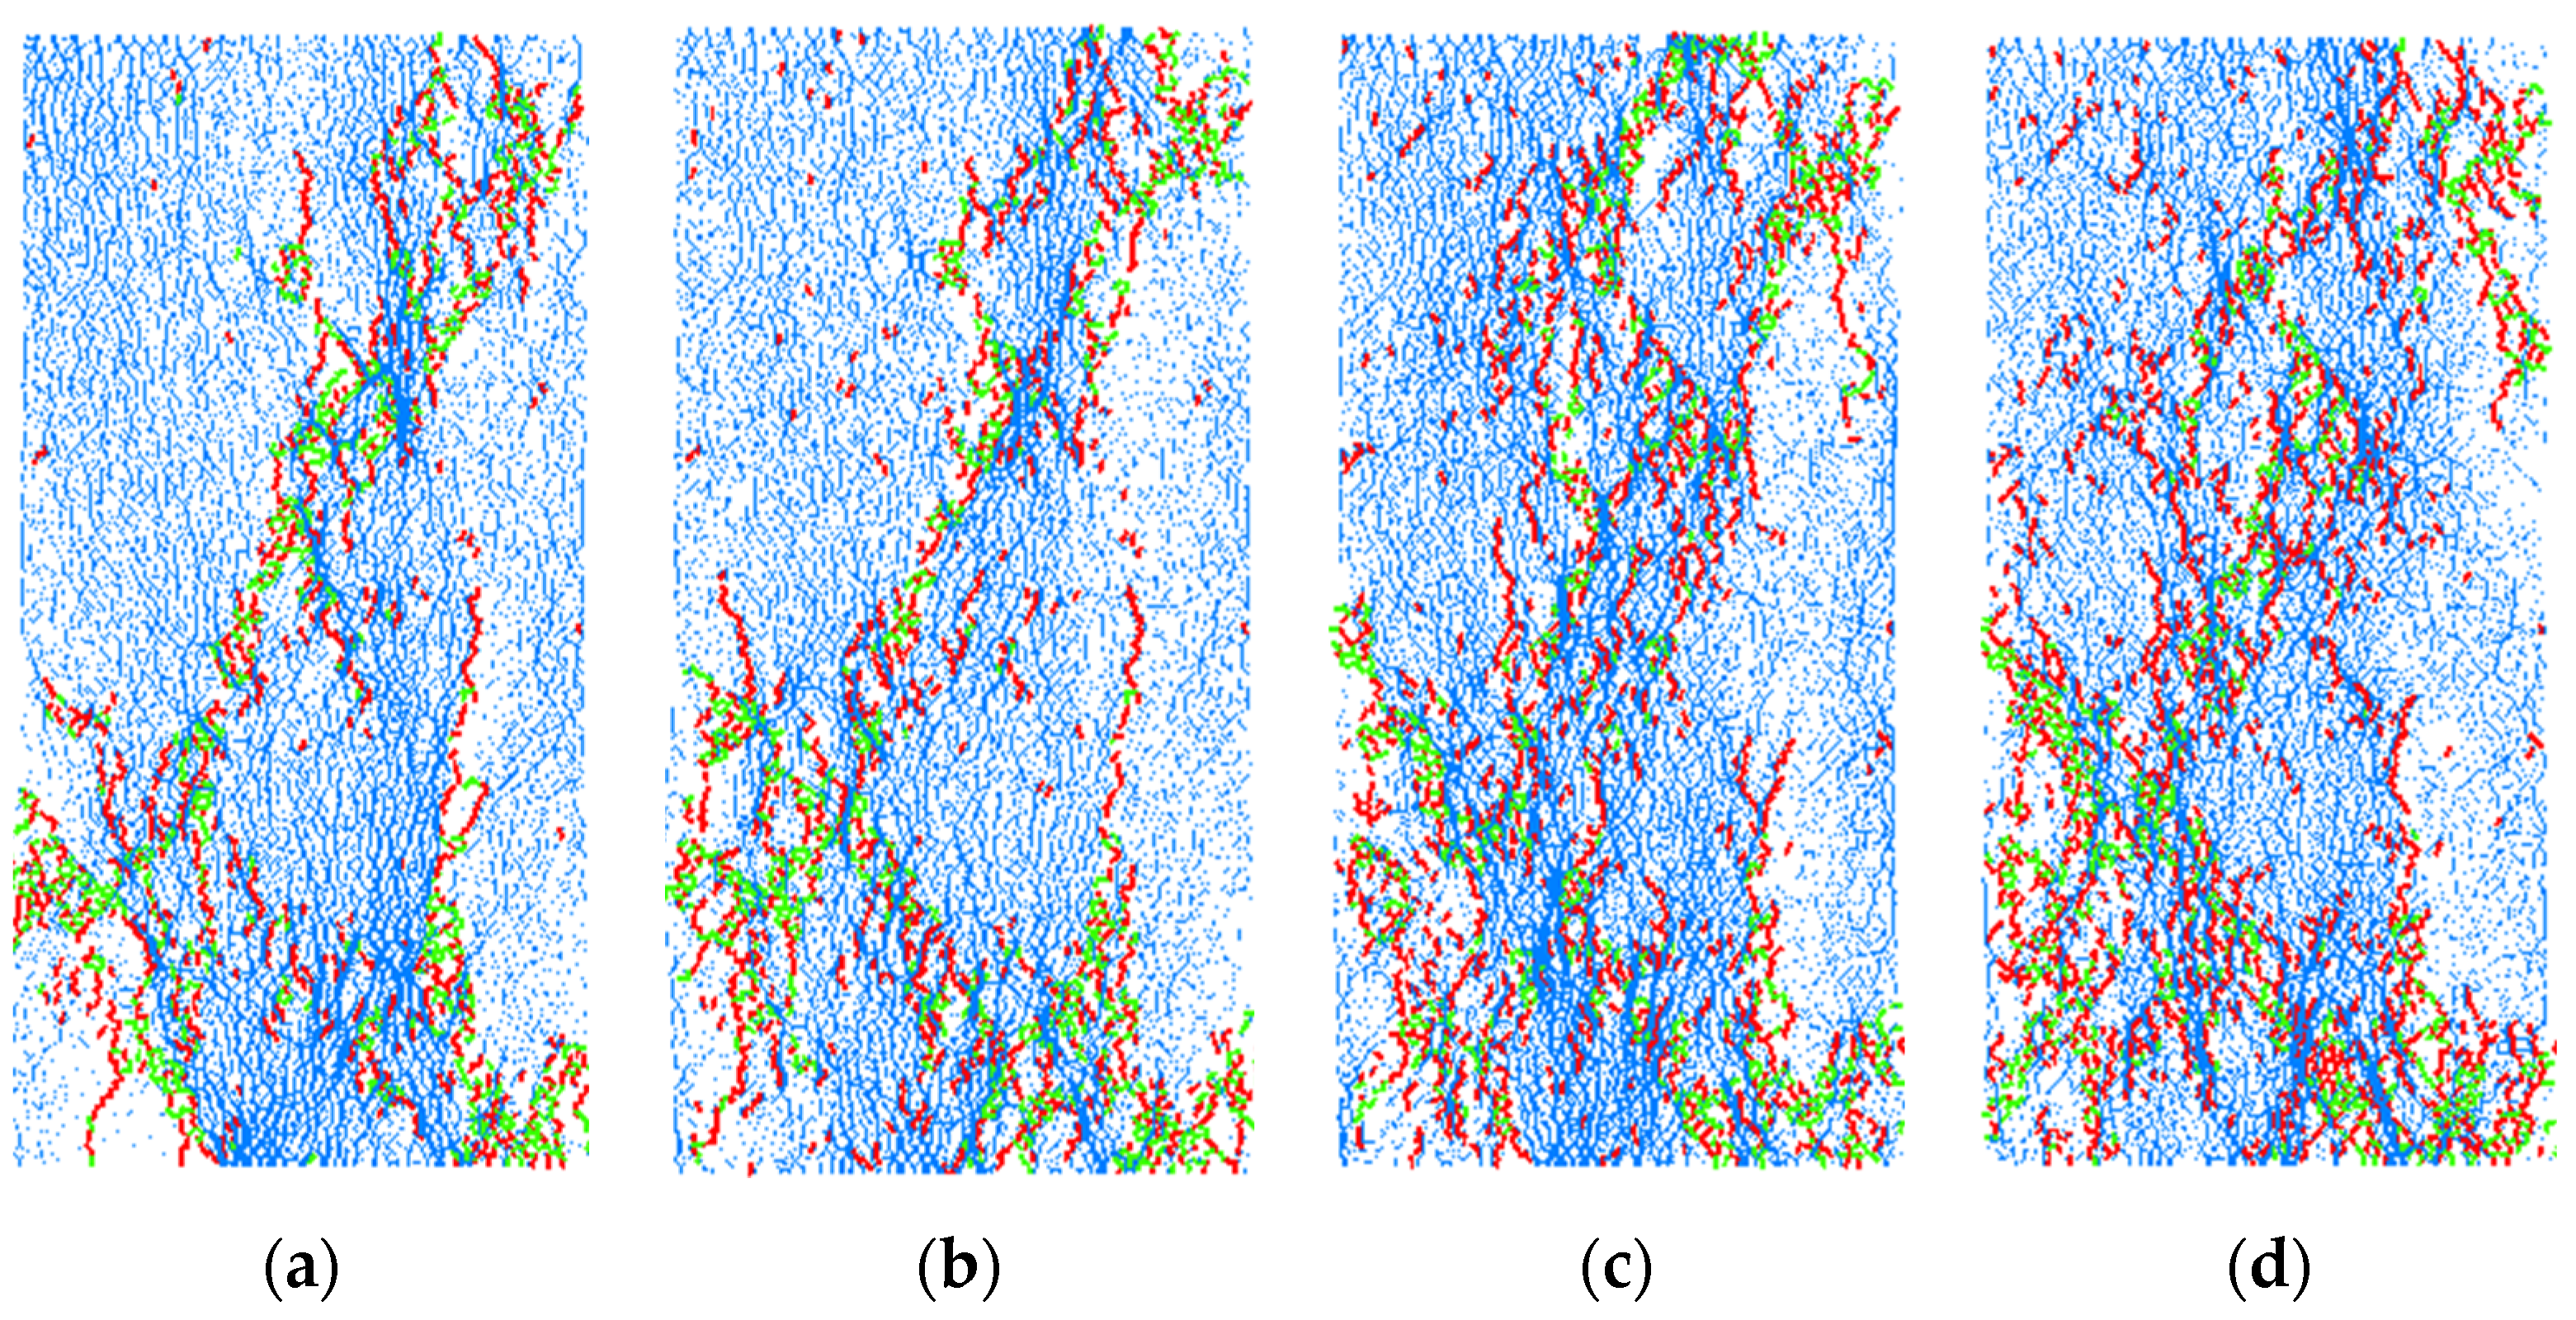
Figure 9 shows the internal force chain morphology and rupture modes of WCS with various water contents (shear cracks, tensile cracks, and force chains are denoted in red, green, and blue, respectively). At water contents of 0% and 2.31%, rock ruptures occurred as a single inclined crack was generated along the primary fissure, which resulted in overall cleavage damage. Some clear secondary fissures originated from the main fissure, which is a typical shear damage pattern. In this case, the internal force chain predominantly aligned with the direction of the main fissure.
At water contents of 5.54% and 7.72%, rock ruptures mainly occurred as a single inclined crack was generated along the primary fissure. The rupture morphology gradually transitioned from single-diagonal cross-sectional damage to a combination of tensile and shear slip damage characteristics. This change signified a transformation in the internal force chain within the rock, which resulted in a more complex distribution of the force chains. Consequently, the number of secondary fissures around the main fissure increased, which resulted in greater rock fragmentation. Furthermore, the fissure morphology became more intricate and diverse.
In summary, an increase in the water content significantly affected the damage pattern and internal force chain distribution within the rock. These alterations reflected the changes in the stress distribution and destabilization mechanism of the rocks when they were subjected to external forces.
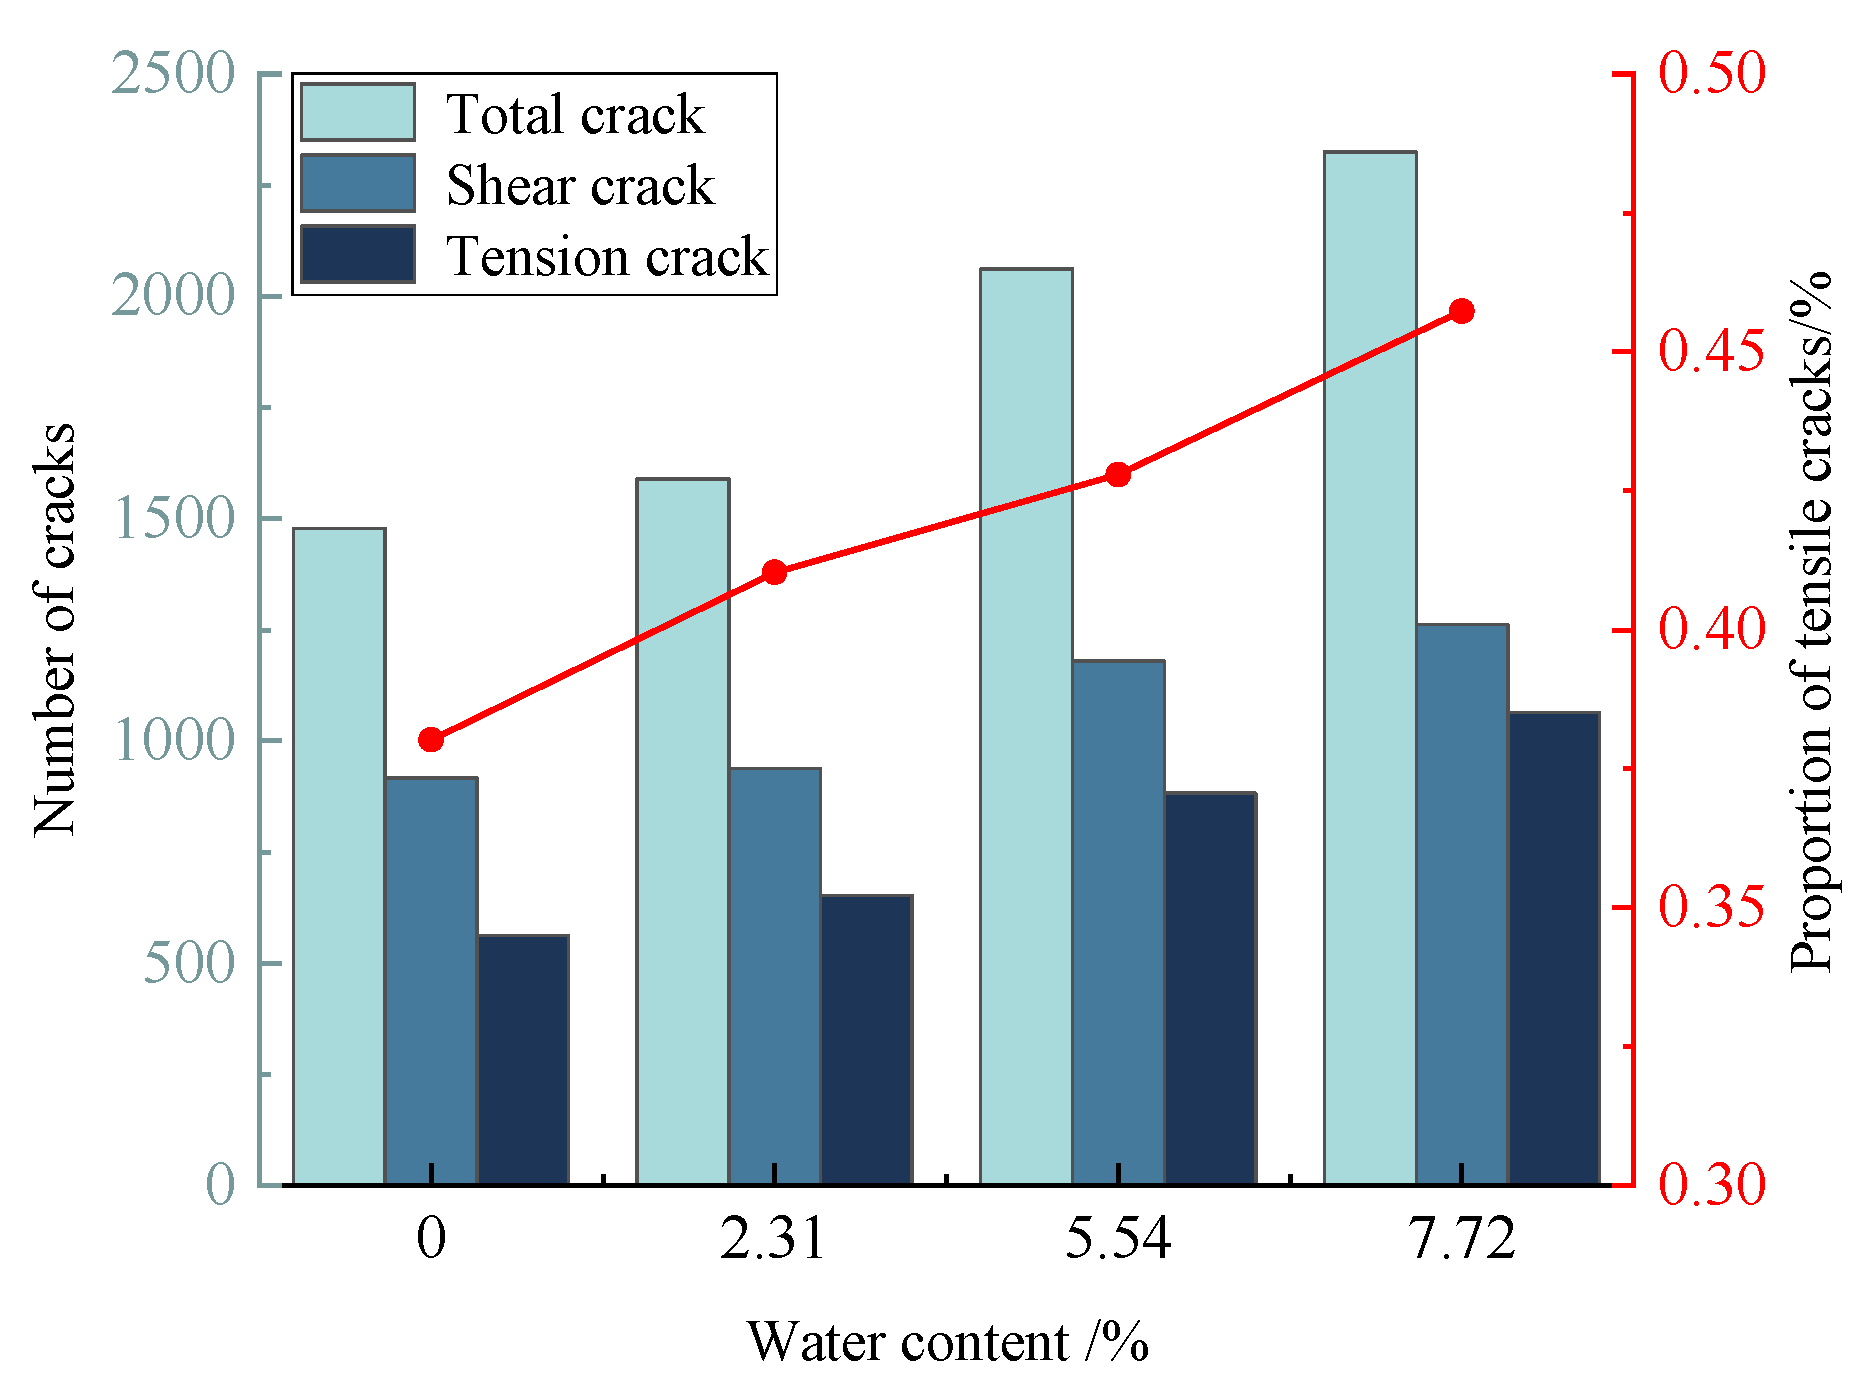
Figure 10 shows the variation in the number of cracks and the percentage of shear cracks in WCS with various water contents. The total number of cracks increased as the water content increased. At water contents of 0% and 2.31%, the total number of cracks was approximately 1500 and the tensile crack percentages were 38.1% and 41.1%, respectively. As the water content increased to 5.54%, the total number of cracks increased to 2061 and the tensile crack percentage was 42.8%. Finally, when the water content increased to 7.72%, the total number of cracks increased to 2325 and the tensile crack percentage was 45.7%. The gradual increase in the proportion of shear cracks was primarily attributed to an increase in the water content. Increasing the water content increased the pore pressure within the pores and cracks, which reduced the compressive stress between the particles, thereby reducing the shear strength of the rock. Consequently, the microfractures in the rock were subjected to a tensile stress, which culminated in the disruption of the cementation between the rock particles.

4. Energy Evolution Law for WCS with Various Water Contents

4.1. Energy Calculation Methods

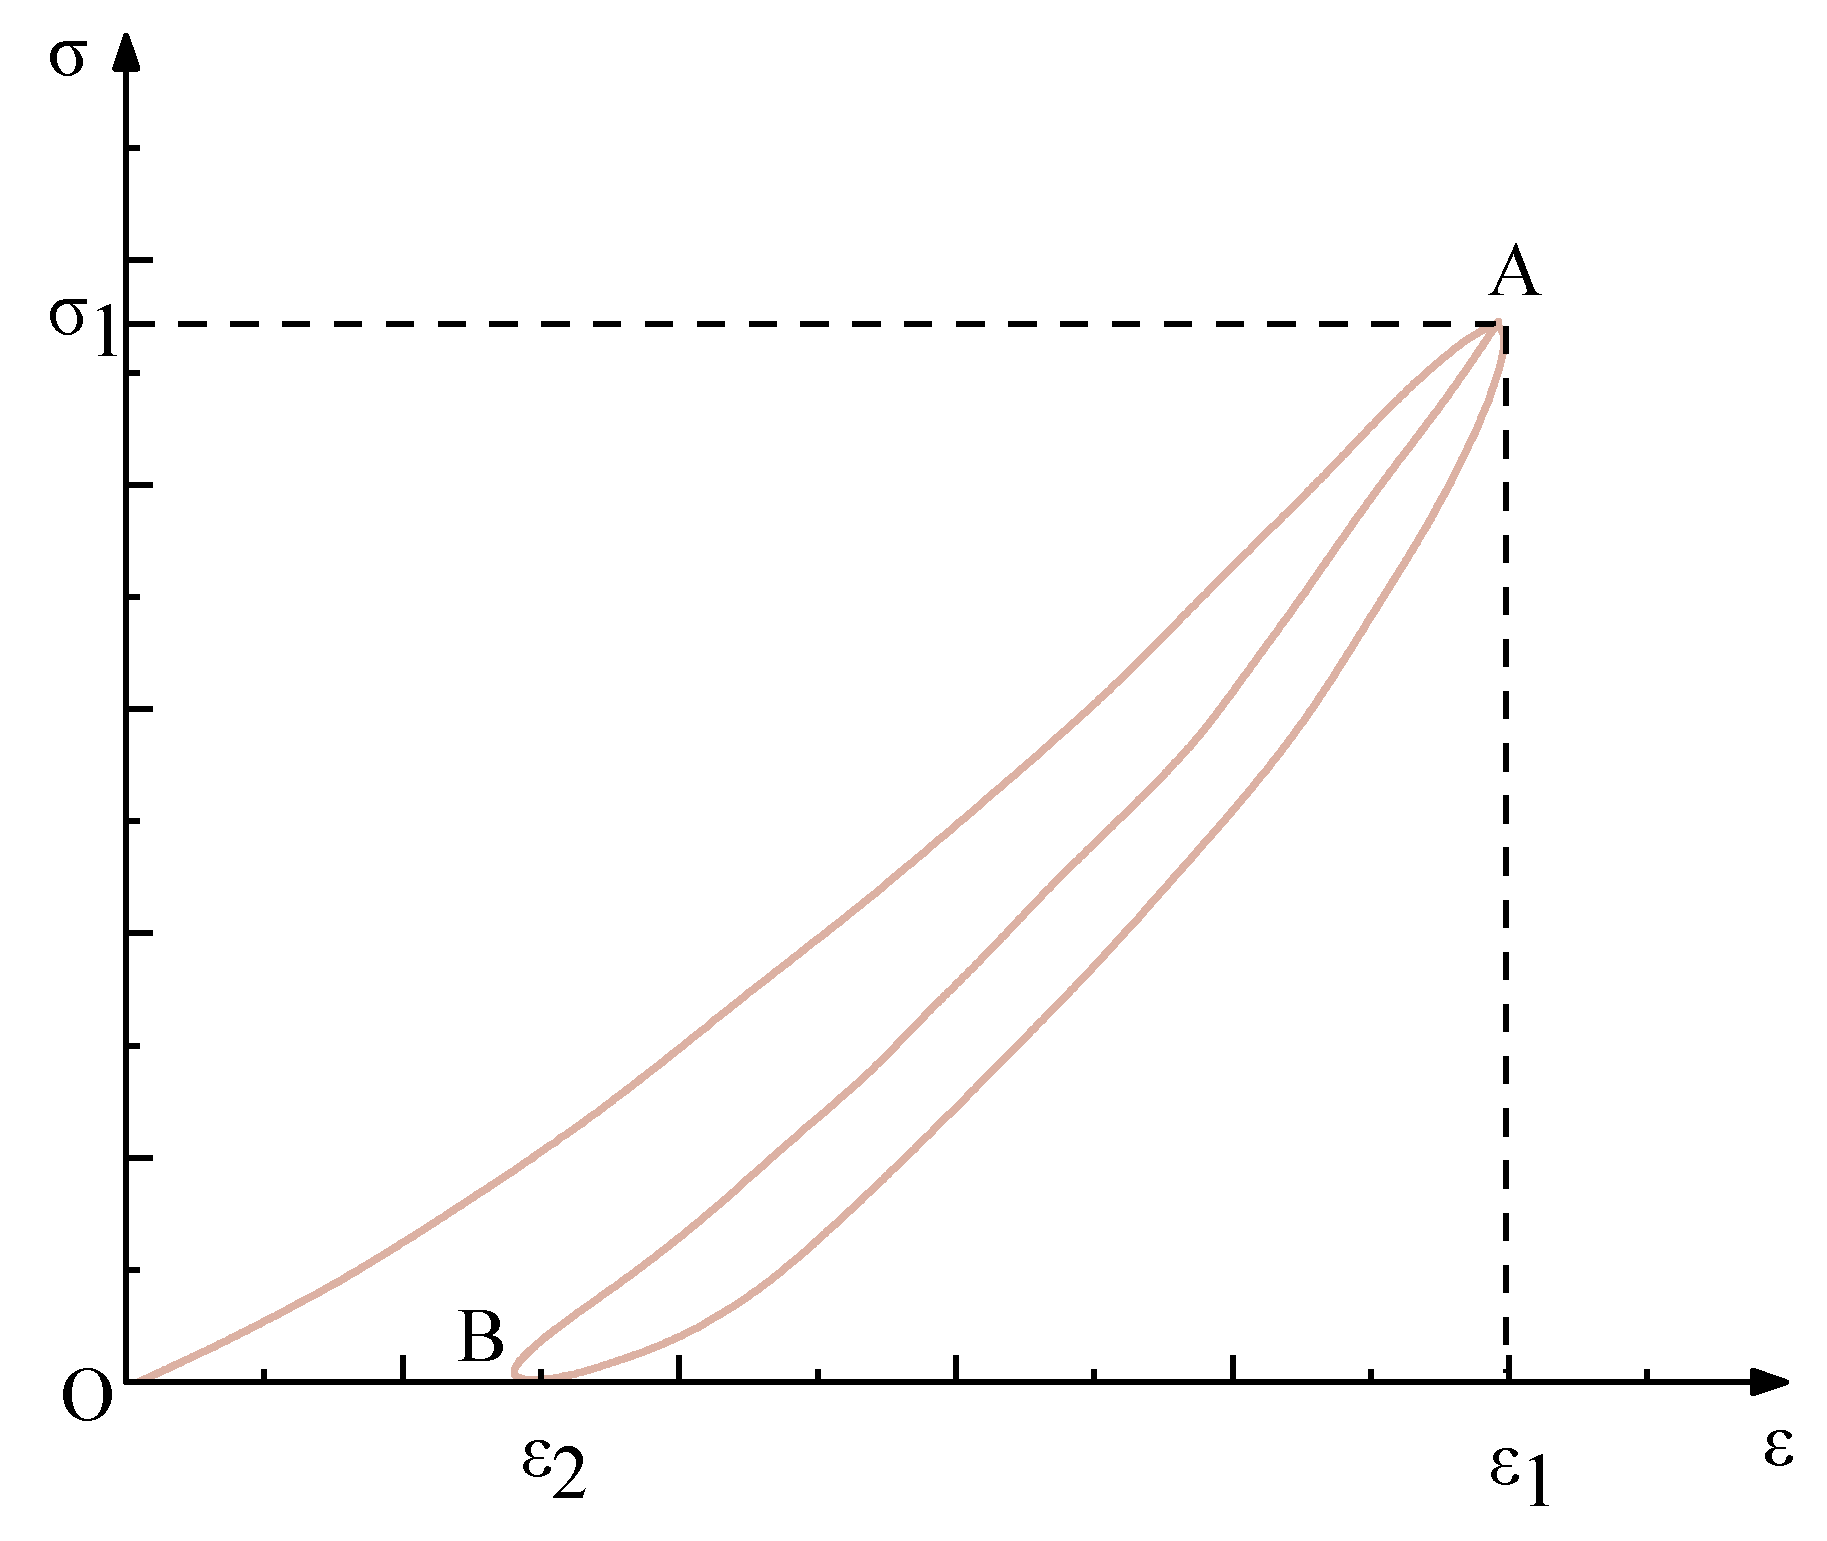
For experiments within a closed system, the work performed by the system on the rock can be divided into two distinct categories [19]. A portion of this work is transformed into elastic strain energy, which is stored in the rock. The remaining work is expanded during the compaction and extension processes as the connectivity between small and large pores in the rock changes. Figure 11 shows the cyclic loading and unloading stress–strain curve. The area enclosed by the loading curve OA and strain ε1 represents the total work executed by the system on the rock. The total energy is denoted by the energy density U absorbed by the rock. The area enclosed by the unloading curve and strain ε1 represents the accumulated elastic energy density Ue within the rock. Moreover, the area between the loading and unloading curves represents the dissipated energy density Ud. This dissipated energy was consumed by various effects such as initial microcrack closure, subsequent crack propagation, and macroscopic rupture [20,21,22].

4.2. Energy Evolution Process

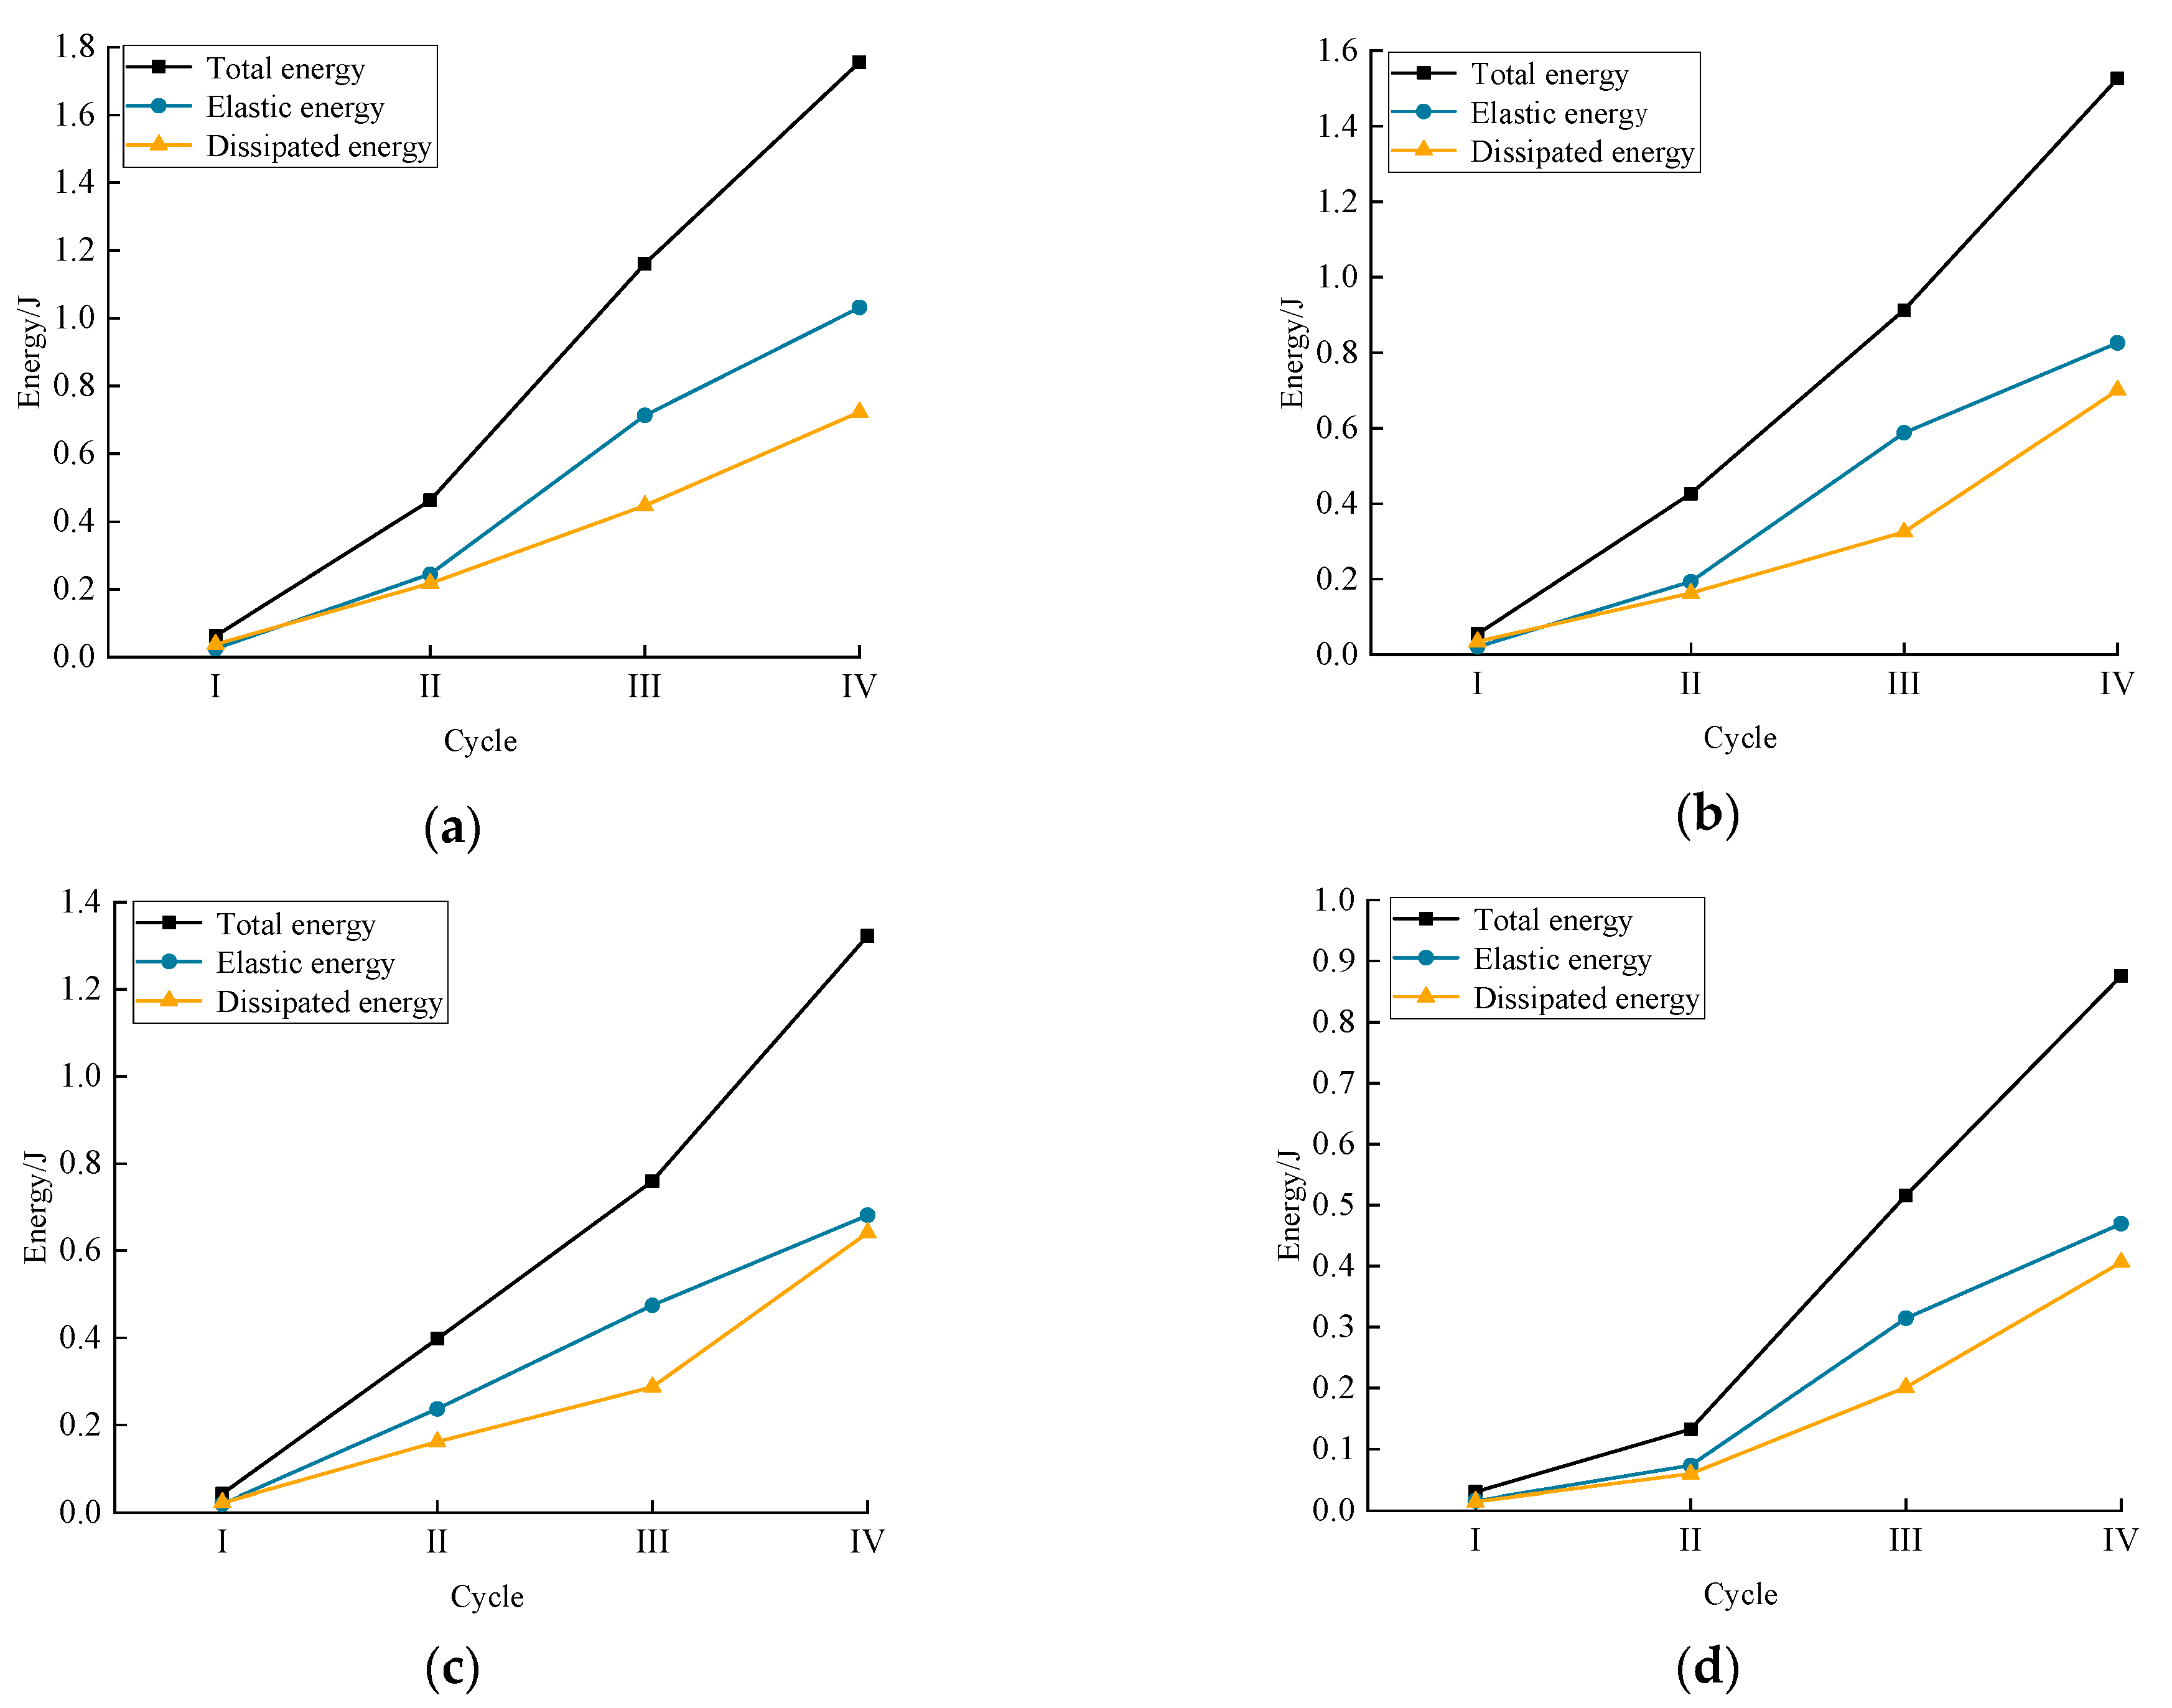
Energy evolution during the loading and unloading of WCS with various water contents is an important and complex process. Figure 12 shows the relationship between the energy change and loading times. The experimental data analysis showed that as the cyclic loading and unloading times increased, the elastic energy, dissipated energy, and total energy gradually increased, which proved that energy evolution is a process of continuous accumulation.
During the initial loading phase, the dissipated energy was dominant; the variations in the total strain, elastic, and dissipated energies were relatively small; and the dissipated energy was slightly greater than the elastic energy. This was because the closure of the microcracks and compaction of small pores resulted in small deformations in the rock, whereas the dissipated energy mainly originated from localized damage caused by the deformation of cracks and pores.
As the number of cyclic loadings and unloadings increased, the material entered the elastoplastic phase. Owing to energy accumulation, the elastic energy gradually surpassed the dissipated energy and its growth rate increased. “Elastic energy” refers to the ability of an object to rapidly restore to its original state during deformation owing to the presence of restoring forces. As the deformation increases, the elastic potential energy of the object gradually increases. By contrast, “dissipated energy” refers to the energy lost owing to friction and viscous forces. As the number of loading cycles increased, the dissipated energy gradually increased.
Near the peak stress, elastic energy was rapidly released and there was a significant increase in the dissipated energy owing to the extension and formation of microcracks and macroscopic fracture surfaces. Consequently, the growth rate of the elastic energy decrease before the peak strain was reached. Therefore, there was a noticeable difference in the variations in the elastic and dissipated energies near the peak stress.
During loading and unloading, there was a positive correlation between the stress and the total strain, elastic, and dissipated energies. However, owing to the increase in the water content, the strength of the WCS decreased. This indicated that in addition to reducing the peak strength, water also reduced the energy required for pore compaction, crack propagation, and fracture surface formation under high-saturation conditions compared with low-saturation conditions. This was because the water loosened the internal structure of the WCS, which reduced its strength. The high water content also affected the permeability of the WCS, which caused friction between the water molecules and interactions with solid particles, thereby increasing the dissipated energy.
In summary, the energy evolution in WCS with various water contents during loading and unloading is a complex and nonlinear phenomenon. As the number of cyclic loadings and unloadings increased, the elastic, dissipated, and total strain energies gradually increased. During the initial loading phase, the dissipated energy was dominant, the variations in the total strain, elastic, and dissipated energies were relatively small, and the dissipated energy was slightly greater than the elastic energy. As the number of cyclic loadings and unloadings increased, the material entered the elastoplastic phase and the growth rate of the elastic energy gradually increased and surpassed the dissipated energy. Near the peak stress, there was a noticeable difference in the variations in the elastic and dissipated energies. Moreover, owing to the permeability of highly saturated sandstone, the relationship between the stress and the total strain, elastic, and dissipated energies changed.

4.3. Damage Characterization

Based on the analysis of the energy evolution in WCS during cyclic loading and unloading, it was evident that the deformation and damage of the sandstone were primarily driven by the accumulation of dissipated energy. Furthermore, the accumulated dissipated energy profoundly affected the subsequent damage deformation in each cycle. Therefore, the damage progression during cyclic loading and unloading was characterized as a cumulative dissipated energy process. This could be quantified using the following equation:
E d m = n = 1 m E d n
where E d m and E d n denote the dissipated energy up to loading–unloading cycle m and at loading–unloading cycle n, respectively. Moreover,
E m = E c m + E d m
where E m denotes the total strain energy accumulated and E c m denotes the elastic strain energy at loading–unloading cycle m. Finally,
D m = E d m E h
where D m denotes the damage to the sample at loading–unloading cycle m and E h denotes the total strain energy accumulated in the sample at the last loading cycle. Thus, the correlation between the damage factor and the number of cyclic loadings and unloadings for WCS with various water contents was determined using Equations (1)–(3).
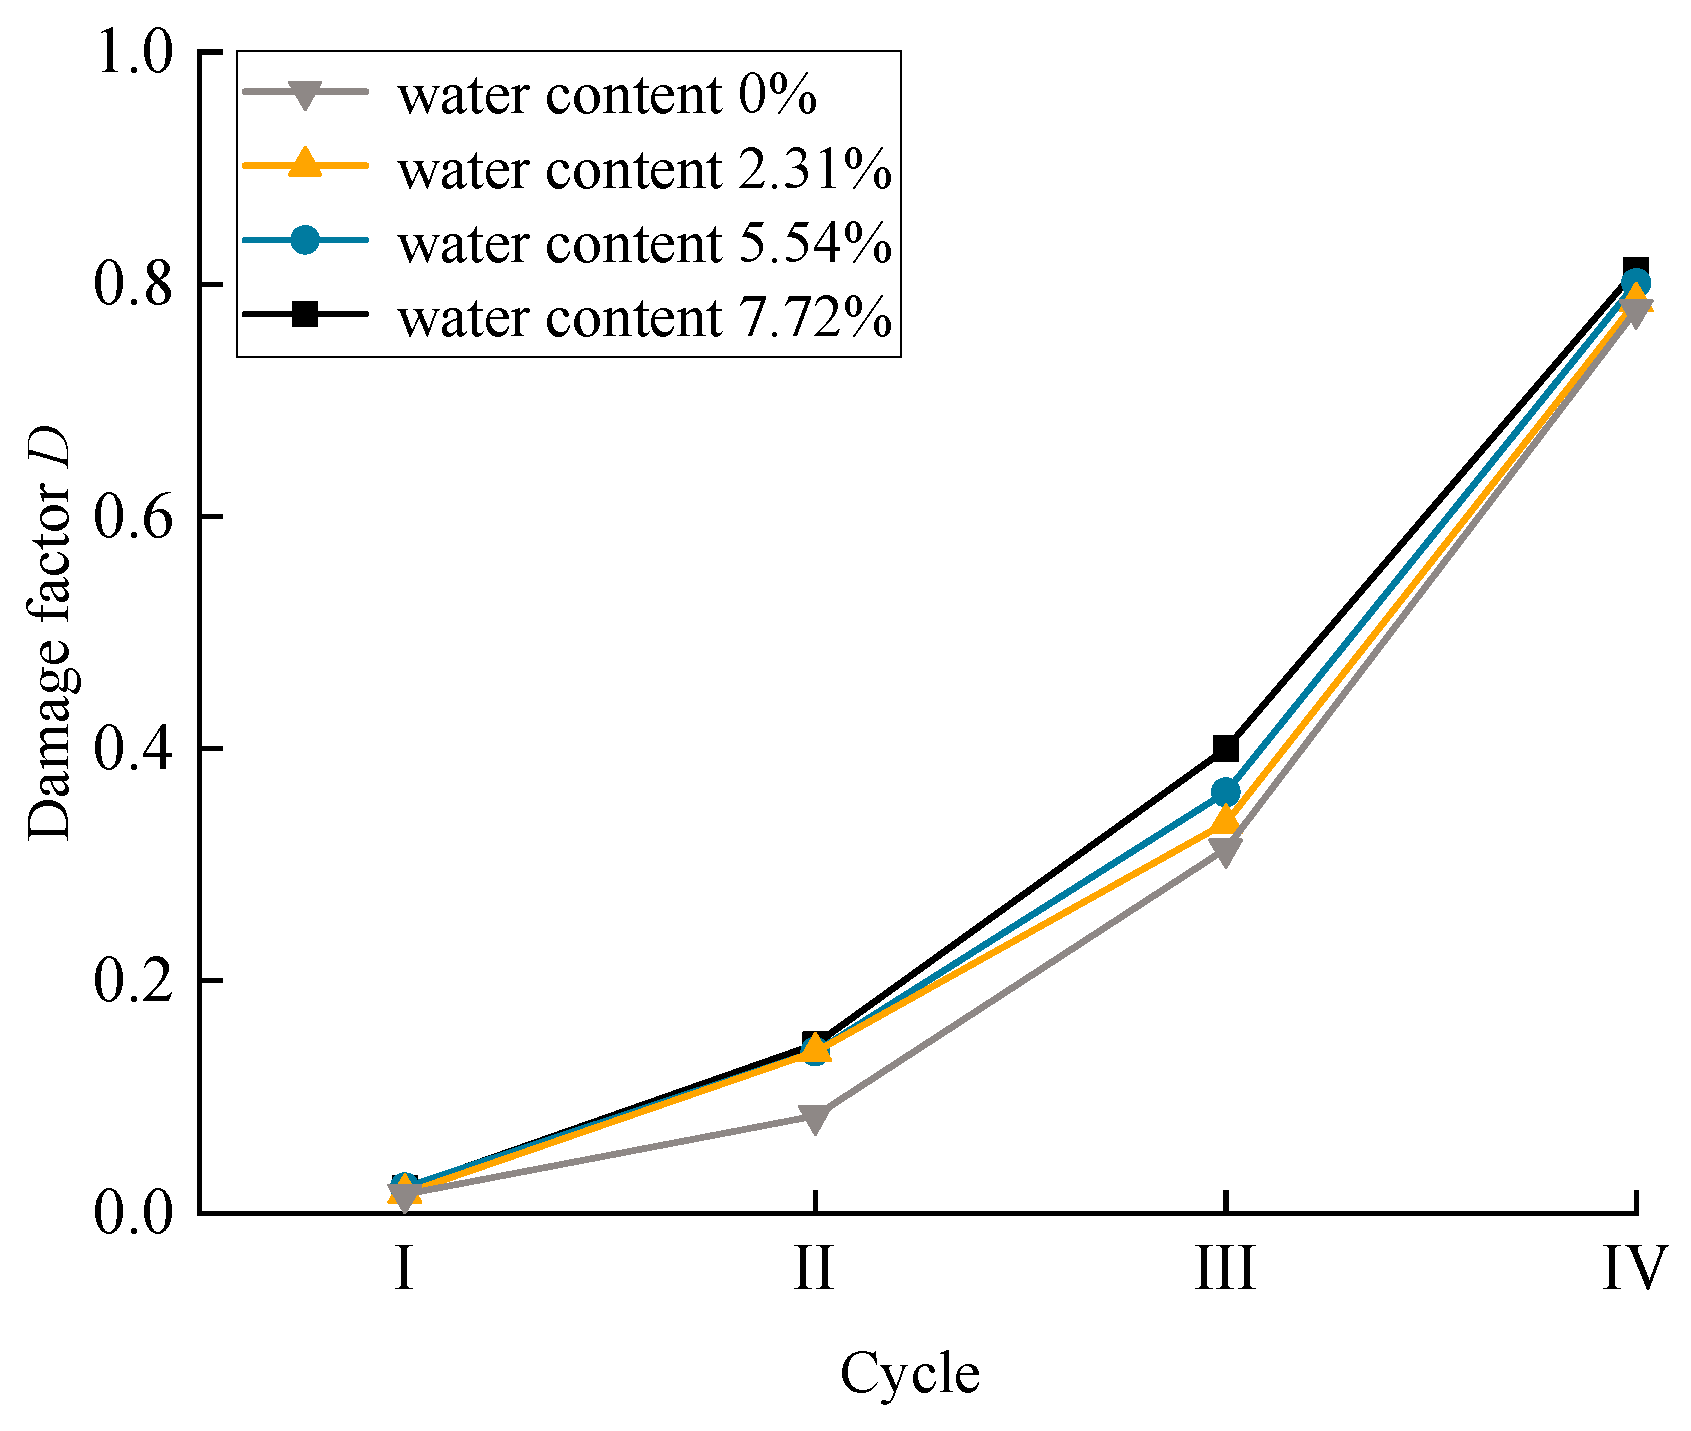
As the number of cyclic loadings and unloadings increased, the damage factors of WCS with various water contents gradually increased at an increasing rate (Figure 13). This could be attributed to the progressive rupture and instability of the rock, which increased the proportion of dissipative energy. During the first loading–unloading cycle, the WCS underwent a consolidation phase, in which the absorbed energy mainly served to close pre-existing cracks and compact small pores. This resulted in a relatively low damage factor. In subsequent cycles, there was a more significant increase in the damage factor, which corresponded with the elastoplastic development and post-peak failure stages. The trends in the damage factor were relatively consistent regardless of the water content.
When the water content was 0%, the damage factor ranged from 0.01 to 0.77. When the water content was 2.31%, the damage factor ranged from 0.01 to 0.78. At a water content of 5.54%, the damage factor ranged from 0.02 to 0.80. Finally, when the water content was 7.72%, the damage factor ranged from 0.02 to 0.81. These results indicated that an increasing water content increased the peak value of the damage factor, which occurred because water degraded the mechanical properties of WCS.

5. Conclusions

In this study, a numerical simulation of the cyclic loading and unloading of WCS with various water contents was conducted to analyze the corresponding mechanical response characteristics and to establish fatigue damage laws. The main conclusions were as follows:
  • With an increase in the water content, the peak strength of the cyclic loading and unloading of WCS gradually decreased. Compared with the dry state (0%), the peak strengths decreased by 21.32%, 25.03%, and 24.64% for water contents of 2.31%, 5.54%, and 7.72%, respectively. The elastic modulus of the cyclic loading stage increased with the increase in the number of cycles; this increase was the largest before the second cycle, while the overall change in the elastic modulus in the unloading stage was small.
  • When the water content was low (≤2.31%), rock fractures were caused by the generation of a single inclined main crack, which resulted in overall splitting failures. Clear secondary cracks developed around the main crack, which was typical of the shear failure mode. As the water content increased (>2.31%), the fracture pattern gradually changed from single inclined surface failure to a combination of tensile and shear slip failures.
  • As the number of cyclic loadings and unloadings increased, the elastic, dissipated, and total energies of WCS with various water contents gradually increased. During the initial loading phase, the dissipated energy was dominant; variations in the total strain, elastic, and dissipated energies were relatively small; and the dissipated energy was slightly greater than the elastic energy. As the number of cycles increased, the rock entered the elastoplastic stage; the growth rate of the elastic energy increased and it gradually exceeded the dissipated energy. Near the peak stress, there was a noticeable difference in the variations in the elastic and dissipated energies.
  • With an increase in the cyclic loading and unloading times, the damage factors of WCS with different water contents gradually increased with a gradual increase in the growth rate. However, due to deteriorations in the mechanical properties of sandstone from water, the water content continued to increase and the peak value of the damage factor tended to increase, from 0.77 for a low water content to 0.81 for a high water content.
We conducted numerical simulation experiments on weakly cemented sandstone with different water contents to analyze the decrease in rock strength and the intensification of damage as the water content increased under complex stress paths. During tunnel excavations, frequent mining activities can easily lead to the instability and failure of the surrounding rock, thereby causing underground engineering accidents. Our results provide a theoretical basis for the prevention of the catastrophic instability of weakly cemented roadways and surrounding rock. This conform to the purpose of journal Sustainability to promote sustainable and resilient infrastructure development and natural disaster management. However, this paper mainly evaluates the damage degree of weakly cemented rock under cyclic loading and unloading, and the interpretation of these results may have a certain subjectivity. Different researchers may have different interpretations, which may affect the comparability and repeatability of the experimental results.

Author Contributions

Conceptualization, L.S. and Y.L.; methodology, Y.L.; software, Y.L.; validation, Z.C., Z.J. and Z.W.; formal analysis, Q.H. and Z.B.; investigation, Z.J.; resources, L.S.; data curation, Z.C., Q.H. and Z.W.; writing—original draft preparation, Y.L.; writing—review and editing, L.S.; visualization, Y.L.; supervision, Z.B. All authors have read and agreed to the published version of the manuscript.

Funding

This research was funded by the National Natural Science Foundation of China (grant no. 52074100 and grant no. 51874113), the Inner Mongolia “Science and Technology to Enhance Mongolia” action key project (grant no. 2022EEDSKJXM009-2), and the Key Research and Development Program of Hebei Province (grant no. 19275508D).

Data Availability Statement

The data used to support the findings of this study are available from the corresponding author and senior author upon request.

Conflicts of Interest

The authors declare no conflict of interest.

References

  1. Yang, J.H.; Zhao, X.D.; Zhou, G.Q.; Zhou, Y.X.; Jiao, W. Study in Physical and Mechanical Characteristics of Cretaceous System Weakly Cemented Sandstone in Erdos Basin. J. Mine Constr. Technol. 2021, 42, 22–28. [Google Scholar]
  2. Li, H.G.; Li, H.M.; Xu, G.S. Influence of water content on mechanical characteristics of weakly cemented sandstone. J. Min. Strat. Control Eng. 2021, 3, 60–66. [Google Scholar]
  3. Zhao, Y.C.; Yang, T.H.; Xiao, F.K.; Wang, H.; Liu, G.; Zheng, X.; Zhou, J.R.; Shen, Z.L. The variation law of plastic strain energy of western weak cemented sandstone during cyclic loading experiment. J. China Coal Soc. 2015, 40, 1813–1819. [Google Scholar]
  4. Ma, J.; Guan, J.; Duan, J.; Huang, L.; Liang, Y. Stability analysis on tunnels with karst caves using the distinct lattice spring model. J. Undergr. Space 2021, 6, 469–481. [Google Scholar] [CrossRef]
  5. Ma, J.; Zhao, J.; Lin, Y.; Liang, J.; Chen, J.; Chen, W.; Huang, L. Study on Tamped Spherical Detonation-Induced Dynamic Responses of Rock and PMMA Through Mini-chemical Explosion Tests and a Four-Dimensional Lattice Spring Model. J. Rock Mech. Rock Eng. 2023, 56, 1–19. [Google Scholar] [CrossRef]
  6. Li, H.Y.; Meng, L.B.; Li, T.B.; Li, P. Study on microscopic damage mechanism of sandstone under uniaxial cyclic loading in different water-bearing states. J. China Test 2023, 1–8. Available online: http://kns.cnki.net/kcms/detail/51.1714.TB.20221027.1726.002.html (accessed on 30 July 2023).
  7. Yang, K.; Zhang, Z.N.; Chi, X.L.; Lyu, X.; Wei, Z.; Liu, W.J. Experimental study on crack evolution and damage characteristics of water bearing sandstone under cyclic loading. J. Rock Soil Mech. 2022, 43, 1791–1802. [Google Scholar]
  8. Wu, Z.H.; Song, C.Y.; Tan, J.; Zhang, Y.Z.; Qi, Z.J. The evolution law of rock energy under different graded cyclic loading and unloading modes. J. Min. Saf. Eng. 2020, 37, 836–844 + 851. [Google Scholar]
  9. Ji, H.G.; Chen, D.S.; Su, X.B.; Quan, D.L. Analysis of elastic modulus variation and energy evolution of Granite based on triaxial loading and unloading test. J. Northeast. Univ. 2023, 44, 415–423. [Google Scholar]
  10. Yang, Y.; Lin, J.; Chen, X.; Yin, J.C. Mechanical characteristics analysis of weakly consolidated sandstone under dry, wet and cyclic loading and unloading conditions. J. Lanzhou Inst. Technol. 2022, 29, 7–12. [Google Scholar]
  11. Liu, J.; Li, J.T. Analysis on meso-damage characteristics of marble under triaxial cyclic loading and unloading based on particle flow simulation. J. Central South Univ. 2018, 49, 2797–2803. [Google Scholar]
  12. Tian, W.L.; Yang, S.Q.; Huang, Y.H. Particle flow analysis of mechanical behavior and meso-mechanism of sandstone under unloading confining pressure. J. Rock Soil Mech. 2016, 37, 775–782. [Google Scholar]
  13. Sun, L.H.; Long, Y.X.; Li, X.; Jiang, Z.; Fan, Y.; Wang, Z.; Han, X. Effect of loading rate on the mechanical properties of weakly cemented sandstone. Sustainability 2023, 15, 2750. [Google Scholar] [CrossRef]
  14. Sun, L.H.; Jiang, Z.X.; Long, Y.X.; Ji, Q.; Wang, Z.; Fan, Y.; Hao, Y. Influence of mesoscopic parameters of weakly cemented rocks on macroscopic mechanical properties. Sustainability 2022, 14, 13308. [Google Scholar] [CrossRef]
  15. Onyelowe, K.C.; Ebid, A.M.; Hanandeh, S. The influence of fines on the hydro-mechanical behavior of sand for sustainable compacted liner and sub-base construction applications. Asian J. Civ. Eng. 2023, 24, 1–13. [Google Scholar] [CrossRef]
  16. Jia, H.L.; Wang, T.; Xiang, W.; Tan, L. Influence of water content on the physical and mechanical behaviour of argillaceous siltstone and some microscopic explanations. Chin. J. Rock Mech. Eng. 2018, 37, 1618–1628. [Google Scholar]
  17. Feng, X.D.; Liu, G. An experimental study of cyclic loading of sandstone under different water contents. Hydrogeol. Eng. Geol. 2017, 44, 110–115. [Google Scholar]
  18. Xu, M.; Zhang, X.Y.; Luo, L.; Zhao, X.Y. Study on mechanical properties and energy evolution of sandstone under cyclic loading mode. Min. Res. Dev. 2021, 41, 123–128. [Google Scholar]
  19. Li, L.Y.; Xie, H.P.; Ju, Y. Experimental investigations of releasable energy and dissipative energy within rocks. Eng. Mech. 2011, 28, 35–40. [Google Scholar]
  20. Chen, X.; Lin, J.; Cao, G.Y.; Yang, Y.; Yin, J.C.; Fan, H. Energy evolution and damage characterization of sandstone under cyclic loading and unloading. Sci. Technol. Eng. 2022, 22, 5792–5799. [Google Scholar]
  21. Fang, K.; Zhang, J.; Tang, H.; Hu, X.; Yuan, H.; Wang, X.; An, P.; Ding, B. A quick and low-cost smartphone photogrammetry method for obtaining 3D particle size and shape. J. Eng. Geol. 2023, 322, 107170. [Google Scholar] [CrossRef]
  22. Wu, Q.; Liu, Y.; Tang, H.; Kang, J.; Wang, L.; Li, C.; Wang, D.; Liu, Z. Experimental study of the influence of wetting and drying cycles on the strength of intact rock samples from a red stratum in the Three Gorges Reservoir area. J. Eng. Geol. 2023, 314, 107013. [Google Scholar] [CrossRef]
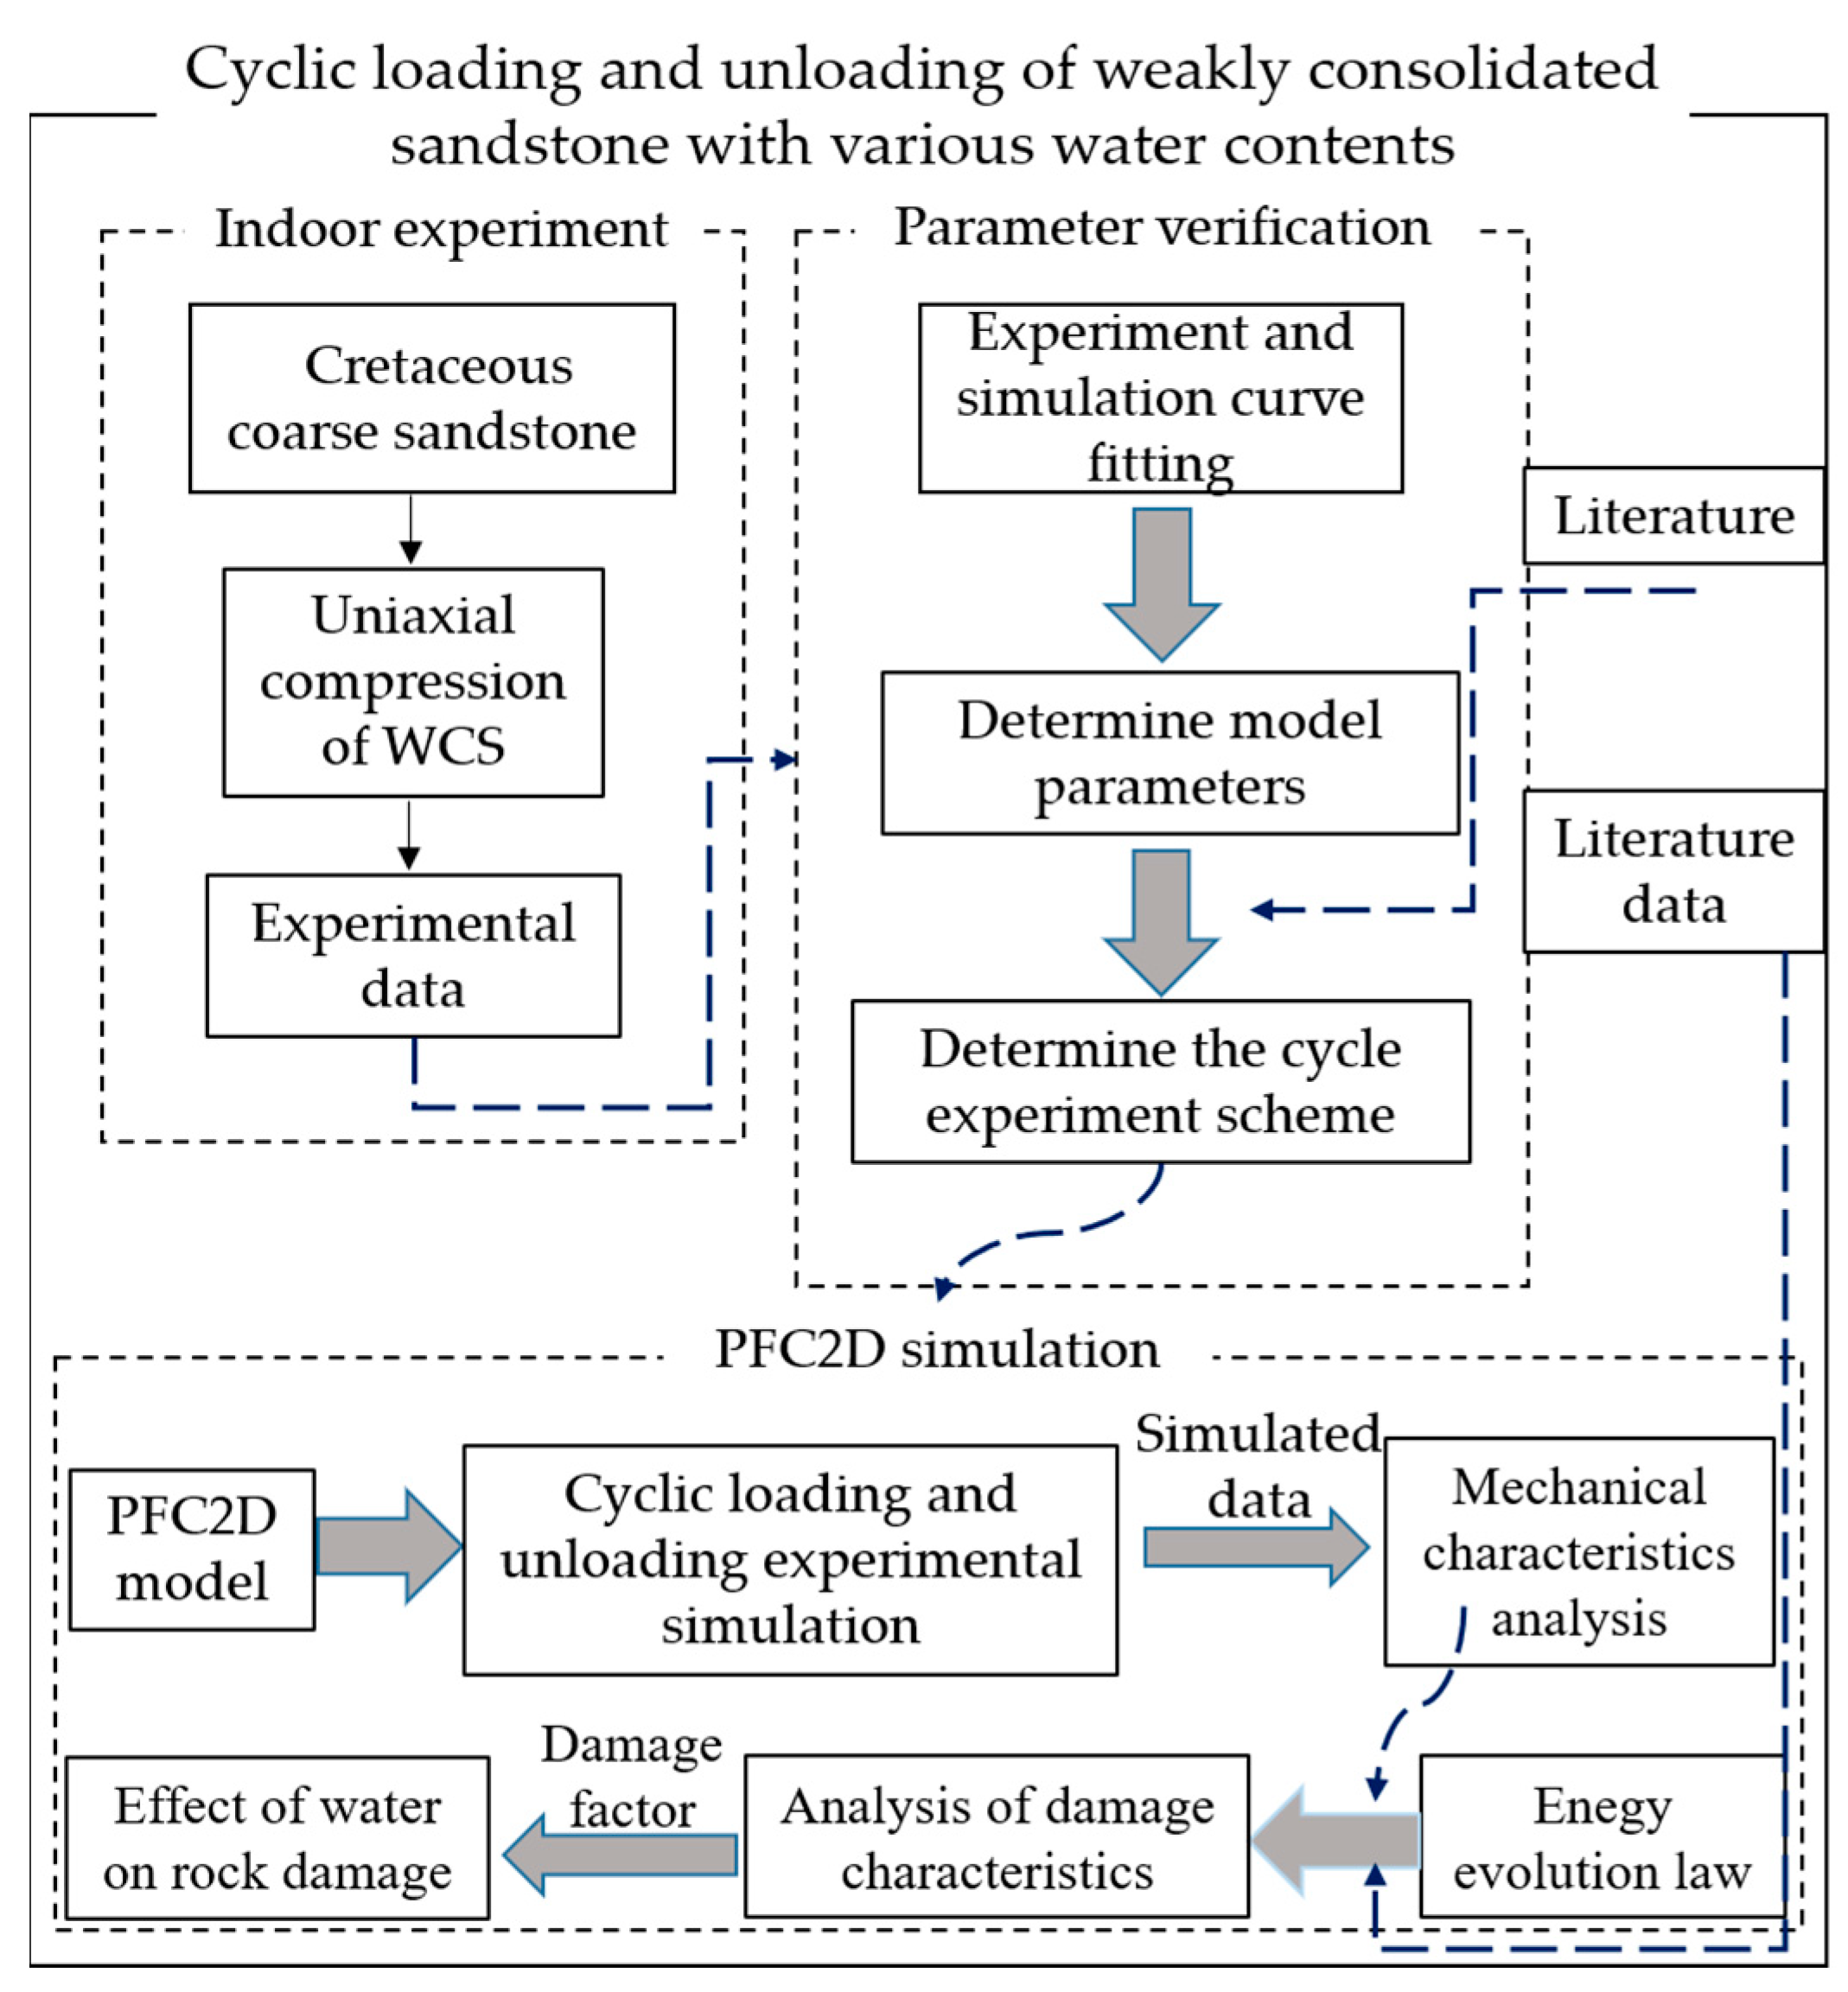
Figure 1. Process workflow.
Sustainability 15 13866 g001
Figure 2. PFC2D numerical model.
Sustainability 15 13866 g002
Figure 3. Stress–strain curves obtained experimentally and using the numerical model for WCS with water contents of (a) 0%, (b) 2.31%, (c) 5.54%, and (d) 7.72%.
Sustainability 15 13866 g003
Figure 4. Schematic showing the cyclic loading and unloading stress paths.
Sustainability 15 13866 g004
Figure 5. Cyclic loading and unloading stress–strain results for WCS with water contents of (a) 0%, (b) 2.31%, (c) 5.54%, and (d) 7.72%.
Sustainability 15 13866 g005aSustainability 15 13866 g005b
Figure 6. Change in the mechanical parameters of WCS with various water contents under cyclic loading and unloading.
Sustainability 15 13866 g006
Figure 7. Relationship between the number of cyclic loadings and unloadings and the residual strain.
Sustainability 15 13866 g007
Figure 8. Relationship between the elastic modulus and the number of cyclic loadings and unloadings during the (a) loading and (b) unloading stages.
Sustainability 15 13866 g008
Figure 9. Morphological characteristics of the force chains in WCS with water contents of (a) 0%, (b) 2.31%, (c) 5.54%, and (d) 7.72%.
Sustainability 15 13866 g009
Figure 10. Changes in the number of cracks and the percentage of shear cracks in WCS with various water contents.
Sustainability 15 13866 g010
Figure 11. Cyclic loading and unloading stress–strain curve.
Sustainability 15 13866 g011
Figure 12. Energy versus the number of cyclic loadings and unloadings for WCS with water contents of (a) 0%, (b) 2.31%, (c) 5.54%, and (d) 7.72%.
Sustainability 15 13866 g012
Figure 13. Relationship between the damage factor and the number of cyclic loadings and unloadings.
Sustainability 15 13866 g013
Table 1. Mesoscopic parameters for the particles in the PFC2D model.
Moisture Content [%]Particle Size RatioMinimum Particle Radius [mm]Friction FactorNormal Tangential Stiffness RatioParallel Bond Tensile Strength [MPa]Parallel Bond Cohesive Force [MPa]Parallel Bond Friction Angle [°]Parallel Bond Elastic Modulus [GPa]Parallel Bond Stiffness Ratio
01.660.350.51.5189401.61.5
2.31147401.41.5
5.54105401.01.5
7.7284400.91.5
Table 2. Comparison of the basic mechanical parameters determined experimentally and using the numerical simulation.
Moisture Content [%]Peak Strength [MPa]Elastic Modulus [GPa]
Indoor ExperimentNumerical SimulationRelative Error [%]Indoor ExperimentNumerical SimulationRelative Error [%]
019.2719.430.833.183.044.4
2.3114.7815.424.332.232.153.5
5.5411.4211.510.791.611.488.1
7.729.299.181.181.491.359.4
Disclaimer/Publisher’s Note: The statements, opinions and data contained in all publications are solely those of the individual author(s) and contributor(s) and not of MDPI and/or the editor(s). MDPI and/or the editor(s) disclaim responsibility for any injury to people or property resulting from any ideas, methods, instructions or products referred to in the content.