Abstract
Featuring phase-change energy storage, a mobile thermal energy supply system (M-TES) demonstrates remarkable waste heat transfer capabilities across various spatial scales and temporal durations, thereby effectively optimizing the localized energy distribution structure—a pivotal contribution to the attainment of objectives such as “carbon peak” and “carbon neutral”. To heighten the efficiency of energy transfer for mobile heating, this research introduces the innovative concept of modular storage and transportation. This concept is brought to life through the development of a meticulously designed modular mobile phase-change energy storage compartment system. Employing computational fluid dynamics (CFD), an in-depth exploration into the performance of the modular M-TES container and the adapted phase-change material (PCM) is conducted. By implementing fin arrangements on the inner wall of the heat storage module, a remarkable upsurge in the liquid phase-transition rate of the phase-change material is achieved in comparison to the design lacking fins—this improvement approximating around 30%. However, it is essential to acknowledge that the augmentation in heat transfer gradually recedes with the proliferation of fins or an escalation in their height. Moreover, the integration of expanded graphite into erythritol emerges as profoundly effective in amplifying the thermal conductivity of the PCM. Notably, with the addition of a 15.2% volume fraction of expanded graphite to erythritol, the duration of heat storage experiences a drastic reduction to nearly 10% of its original duration, thereby signifying a momentous advancement in thermal performance.
1. Introduction
With the continuous advancement of the national economy, there has been a notable increase in residents’ aspirations for an enhanced quality of life. Consequently, the demand for heating in living spaces has been steadily rising year by year. Reducing energy consumption in this aspect can significantly contribute to both energy conservation and emission reduction. The flue gas and exhaust emissions discharged by industrial enterprises carry a substantial amount of heat at an appropriate temperature, making them a viable heat source for replacing traditional energy sources. However, in modern urban planning, most industrial enterprises are situated far from residential and recreational areas. Even with tubeline transportation, the heat tends to dissipate during transit, resulting in high investment costs.
In order to effectively harness the waste heat from these industrial enterprises while minimizing initial investments and preserving the heat resources, researchers from various countries have undertaken comprehensive investigations and explorations. M-TES presents a promising waste heat recovery technology capable of transferring heat across different spaces and timeframes. By optimizing the local energy distribution structure, this system holds the potential to achieve the ambitious goal of a decarbonized society. M-TES technology, although studied for decades, still faces challenges concerning materials, containers, and economic viability [1]. To meet the requirements of M-TES systems, specific properties are demanded from PCMs, such as cost-effectiveness, appropriate melting points, and minimal subcooling tendencies. As a result, some researchers have delved into the blending of multiple PCMs [2,3,4], while others have explored CoO-ZnO-based [5] and MnO2 nanocomposite-based [6] energy storage materials. In M-TES systems, two types of heat storage vessels are commonly used, each catering to distinct heat transfer mechanisms. The first type involves the direct contact vessel [7], wherein the PCM is directly mixed with the heat transfer medium, typically heat transfer oil (HTO). Since PCMs and HTO are immiscible and possess different densities (usually with PCM being denser than HTO), they can be easily separated after mixing. The other container type is the indirect contact vessel, which utilizes a built-in heat exchanger [8,9] to facilitate heat transfer between the PCM and the heat transfer medium. Notably, the indirect contact container allows for enhanced heat transfer, as demonstrated by Kang et al. [10], who proposed the vertical mounting of Y-shaped fins to improve the heat charging efficiency of the M-TES container. On the other hand, the direct-contact structure reduces container weight and lowers transportation costs. Economic evaluations of M-TES primarily focus on various factors, such as the type of heat source, the distance from the heat source, the heat-carrying medium, the heat storage capacity, the number of daily cycles, and the charging and discharging time. Enhancing the thermal charging and discharging processes is crucial to achieving a low operating cost for M-TES, as highlighted by research studies [11]. For instance, Krönauer et al. [12] designed, proposed, and experimentally validated an M-TES system using a tubular heat exchanger in a filled tank with sodium acetate trihydrate as the PCM, aimed at recovering industrial waste heat. Similarly, Kuta et al. [13] constructed an experimental platform to verify the utilization of geothermal energy as a power source for M-TES. Nekoonam et al. [14] performed numerical simulations on a system comprising a solar collector and a PCM co-storage unit, showcasing stable system performance and improved heat storage efficiency between 15 °C and 90 °C. In another study, Elfeky et al. [15] conducted simulations with different phase-change materials and spherical capsules to optimize the performance of multilayer phase-change materials in the thermocline tank of a concentrating solar power plant. Additionally, Han et al. [16] prepared and validated the stability of chloride salt/nanoparticle composite phase-change materials (CPCMs) for high-temperature thermal energy storage. Fragnito et al. [17] explored the performance of heat exchangers with biological phase-change materials in chilled thermal energy systems through research experiments and numerical modelling, revealing that the design limits the thermal storage potential of the phase-change materials. Bianco et al. [18] conducted a numerical analysis of latent heat thermal energy storage based on microencapsulated phase-change materials (MEPCM) to enhance the efficiency of a chilled water system. They employed cylindrical MEPCM modules within a commercial water tank to cool a 150-square-meter residential space. Pourhemmati et al. [19] improved heat transfer efficiency and prevented boundary layer merging by adjusting the thickness of vertical finned heat sinks. COMSOL simulations indicated that increasing the number of fins could reduce thermal resistance by up to 45.5%.
Through analyzing research conducted by scholars from various countries, it becomes evident that the current utilization of waste heat predominantly focuses on the middle- and high-temperature range. Unfortunately, waste heat resources in the low-temperature range remain underutilized and are not efficiently harnessed. Moreover, certain locations face challenges related to high costs, low utilization efficiency, pollution, and poor economic viability concerning heat energy utilization. The present research on mobile heat supply vehicles is primarily limited to the theoretical validation of heat storage materials and programs, and there is a lacking of practical application studies. For instance, there is a dearth of investigations into the actual scenarios of heat storage and release, and how to design structures that maximize flexibility, efficiency, and economy under such conditions. To address these issues, this paper proposes a novel approach—designing a modular mobile heating system equipped with fins. By modularizing the phase-change accumulator, the system’s flexibility is significantly improved, and it mitigates uneven changes in the phase-change material along the length direction during heat storage and release processes. Additionally, to enhance the heat storage and exothermic efficiency of the modular phase-change heat storage box, the study focuses on optimizing the heat accumulator structure and verifying and optimizing the performance of the phase-change material. In order to ascertain the preservation of the latent heat of phase transition whilst surmounting the inherent limitations pertaining to the suboptimal thermal conductivity of the heat storage medium, steps are undertaken to augment the thermal conductivity efficacy of said heat storage material, thus resulting in a commensurate reduction in the duration of heat retention within the confines of the heat storage unit, thereby concomitantly amplifying the operational efficacy of the heat accumulator. By incorporating improved heat storage materials, the thermal conductivity efficiency is augmented, enabling enhanced thermal performance of the heat storage material.
2. Validation of Model Validity
2.1. Physical Model
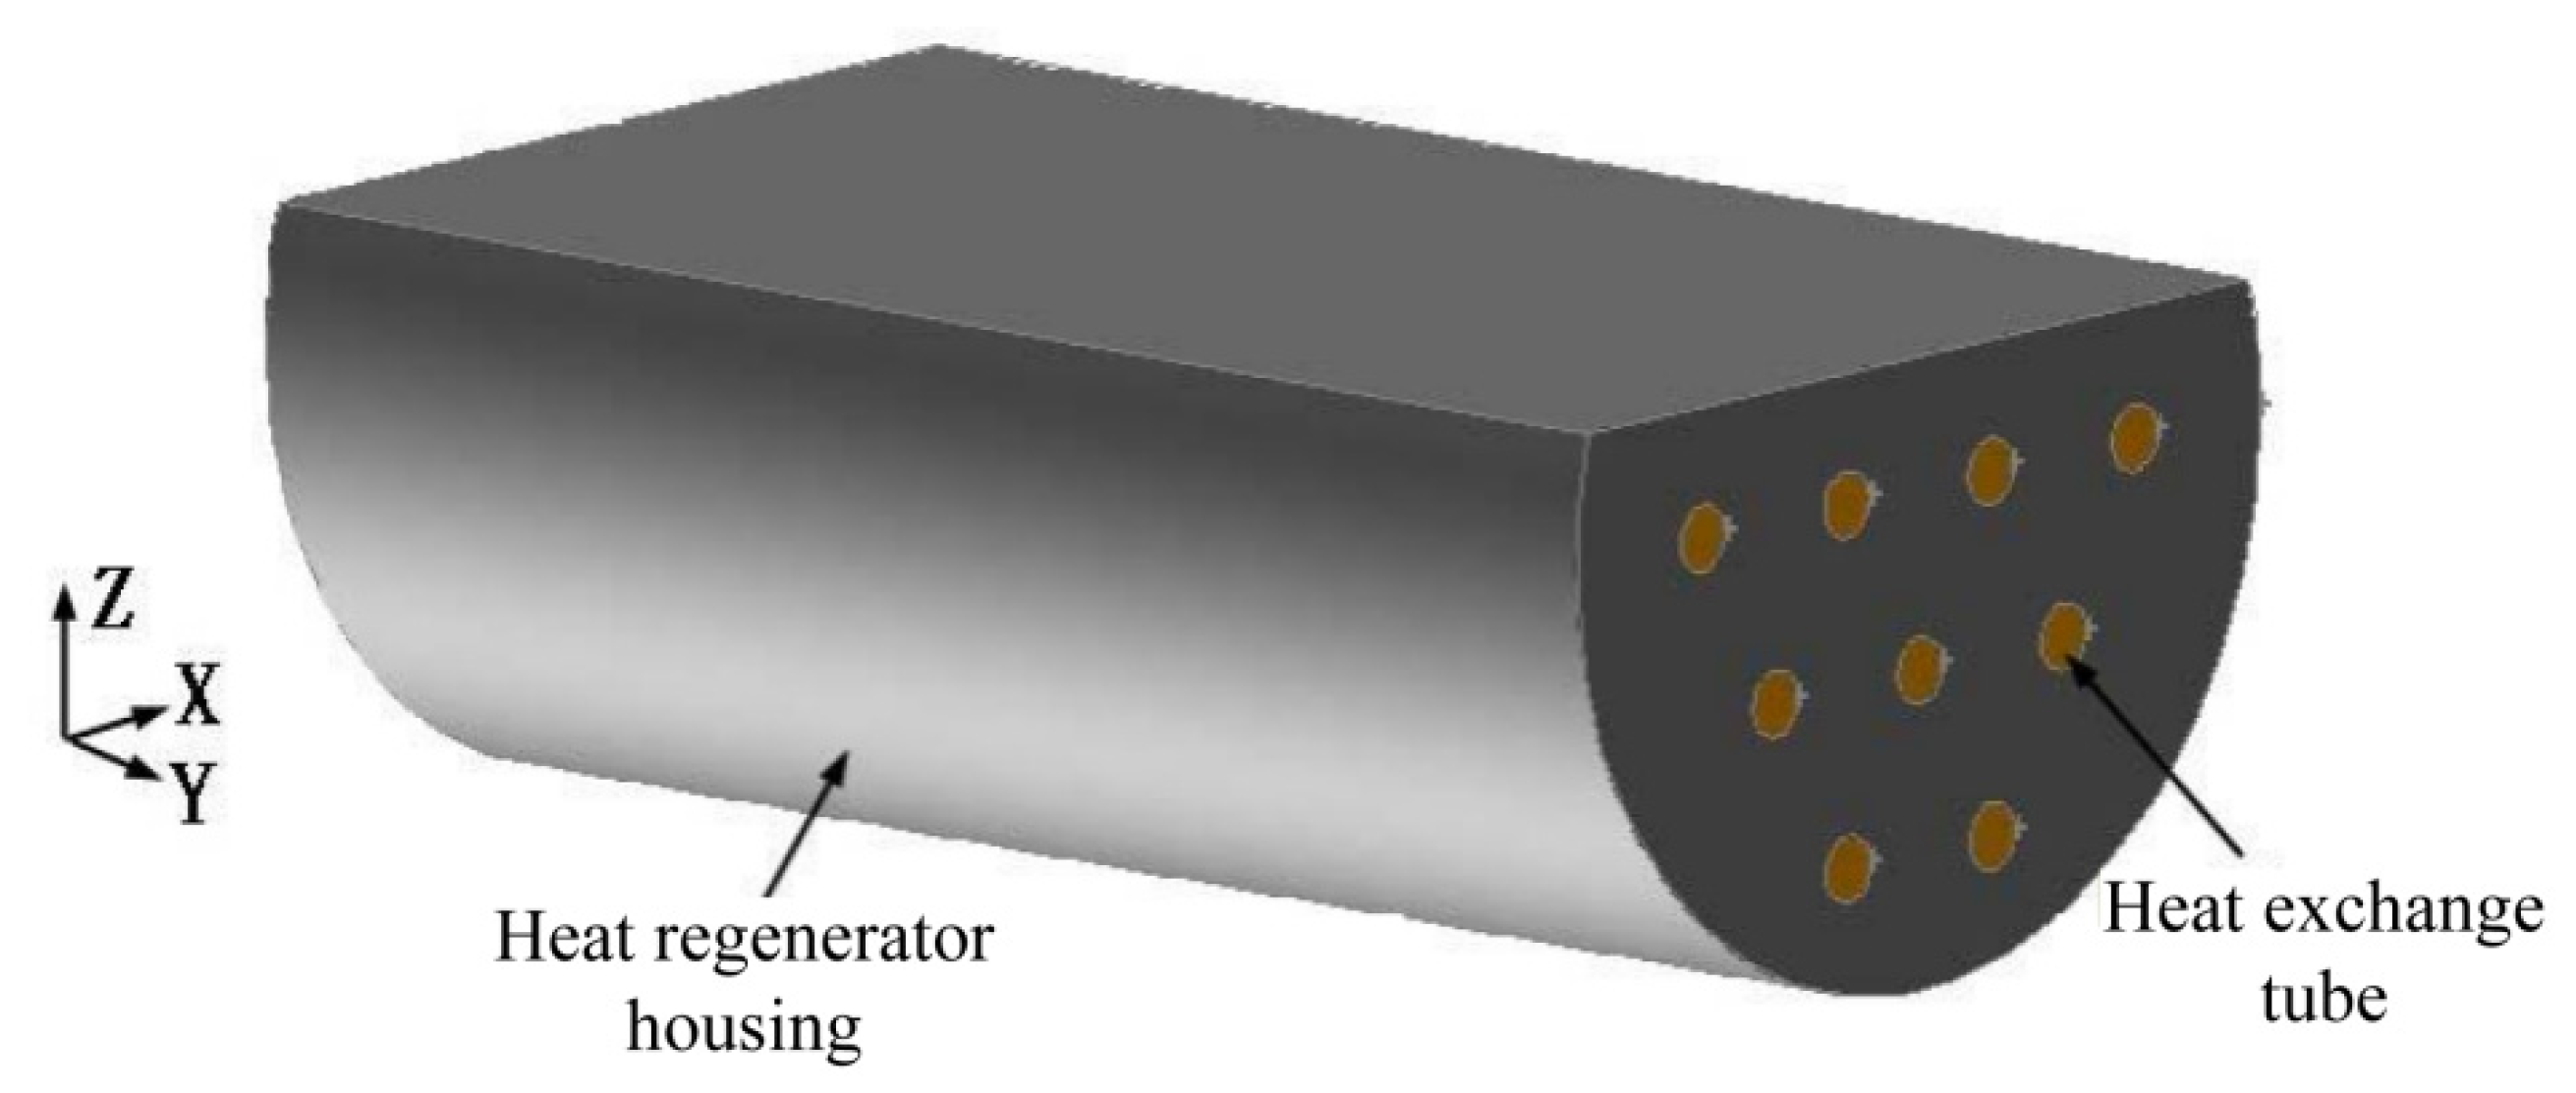
This paper exclusively focuses on the numerical simulation of the mobile heat supply system during the heat release process, omitting the heat storage device transfer and transportation steps. The research concentrates on the verification of existing data and the selection of an indirect casing accumulator to construct an experimental system for validating the charging and exothermic numerical simulations. The accumulator box chosen for this purpose is constructed using of 3 mm thick steel plates, and its outer layer is filled with thermal insulation materials. Within the box, a 9 mm outer diameter copper tube runs along the length direction, facilitating the circulation of high-temperature mass. The heat accumulator and heat exchanger are equipped with heat transfer tubes containing the phase-change material for heat storage, as depicted in Figure 1.

Figure 1.
The physical model used for validation.
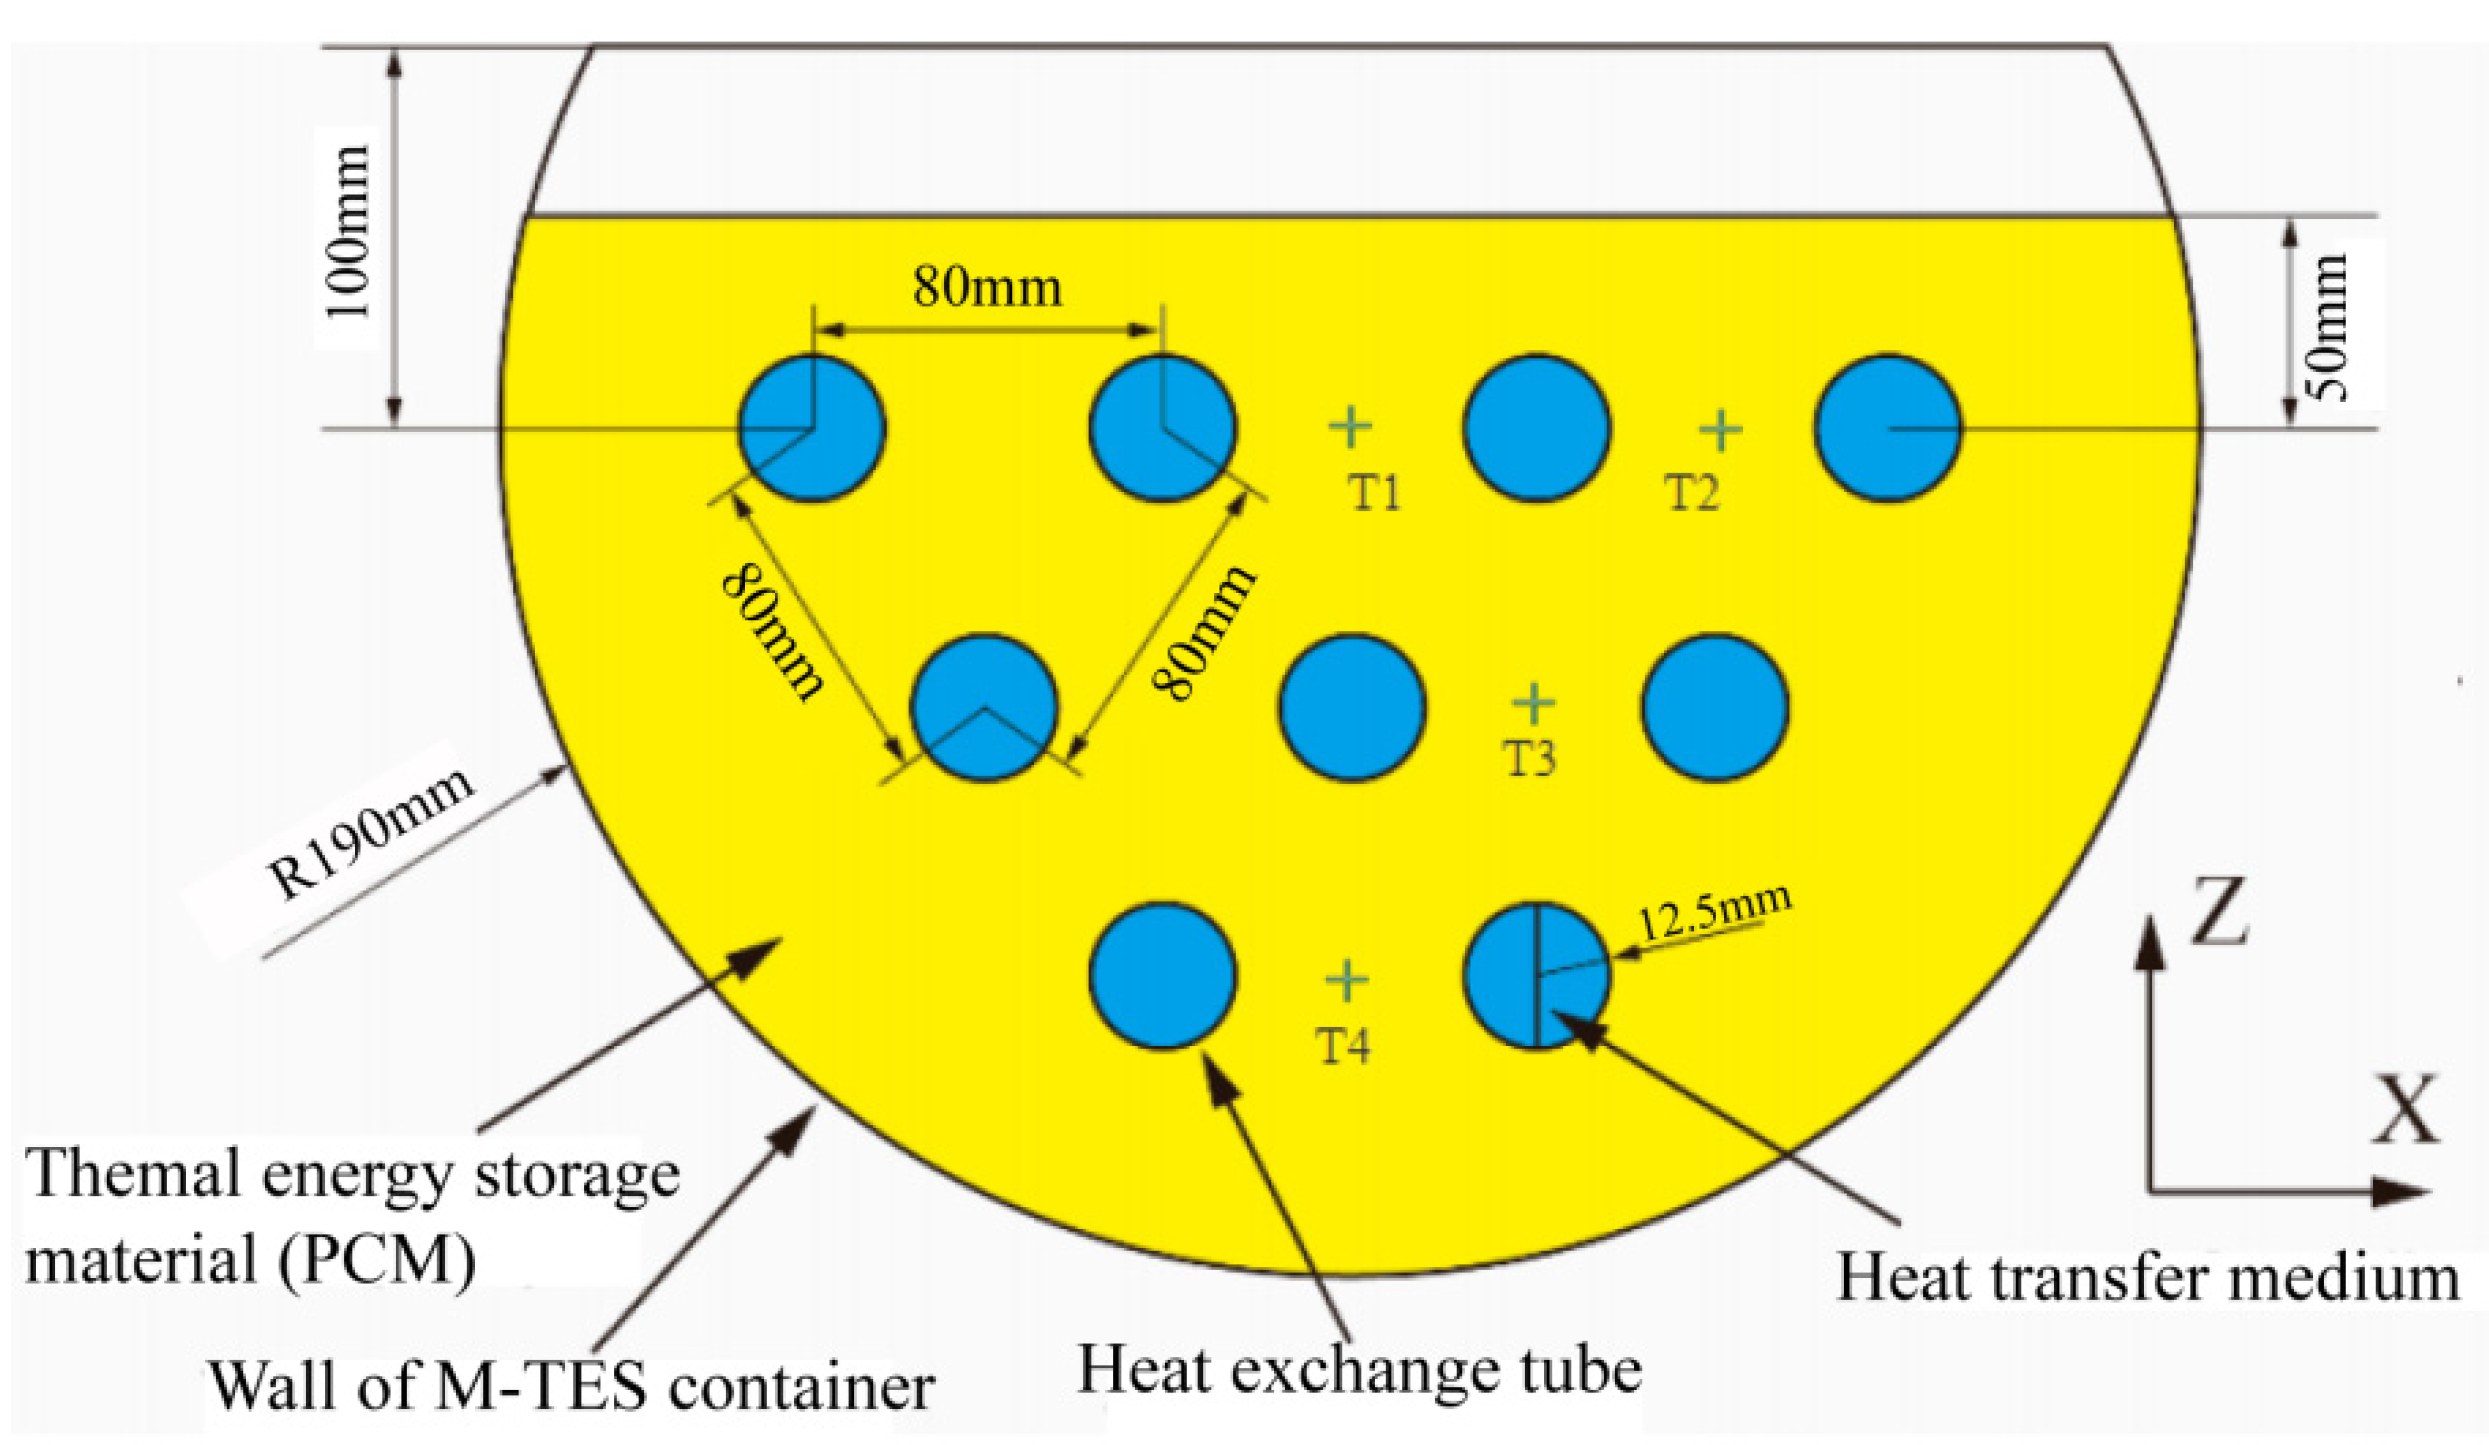
As depicted in Figure 2, the heat accumulator takes the form of a flat-topped cylinder with a radius of 380 mm and a length of 650 mm. The heat exchanger tubes are strategically spaced at intervals of 80 mm, forming an arrangement in the shape of equilateral triangles. The heat storage material is filled up to a height of 50 mm directly above the highest row of the heat exchanger tubes. Due to the symmetrical structure of the heat accumulator, four temperature measurement points, namely, T1, T2, T3, and T4, have been strategically positioned inside the heat accumulator to monitor the heat storage conditions.

Figure 2.
Heat accumulator main view [10].
2.2. Phase-Change Heat Transfer Mathematical Model
The research scope of this paper involves the solid–liquid phase-change phenomena of melting and solidification. At the confluence of the dual phases, the phenomenon of phase change is analyzed using both the enthalpy method [20] and the temperature method. In particular, the temperature-based technique is harnessed for the discrete computation of temperature values, elucidating the solid–liquid phase-transition boundary independently within the solid–liquid phase zones, liquid-phase zones, as well as the dual solid–liquid phase regions, wherein the corresponding energy equations governing these three distinct spatial domains are duly and meticulously resolved.
Shamsundar et al. [21] have proposed an enthalpy model for solving multidimensional phase-transition problems, and the mathematical expression of the model is equivalent to the conventional conservation equation. The enthalpy approach model has two dependent variables, enthalpy and temperature. The model establishes energy equations based on these two to-be-determined functions common to the solid-phase, liquid phase, and two-phase regions, and uses numerical solutions for the enthalpy–thermodynamic distributions to compute the positions of the two-phase interfaces. The enthalpy approach model is suitable for multidimensional phase-change problems because the unified energy equation does not require separate treatment of the solid and liquid phases. It is compatible with the present study and therefore the enthalpy method is used to solve it in this study.
The governing equations for the enthalpy method model are shown in Equation (1).
The relationship between temperature and enthalpy is shown in Equation (2), with both cs and cl being constants.
where Hs and Hl are the saturation enthalpies in the solid and liquid phase regions and Tm is the phase-transition temperature of the PCM.
If we consider the absence of an internal heat source in the PCM and assume only conductive heat exchange inside the collector, we can substitute Equation (2) into Equations (1) and (2) to derive Equations (3) and (4), respectively.
The focus of this paper is on the phase-transition process of the PCM. The advantage of using the enthalpy method lies in its ease of calculation for the solid–liquid phase-transition process, while also offering high accuracy in numerical simulations. Therefore, this paper adopts the enthalpy method model to accurately calculate the solid phase-transition process of the PCM.
2.3. Governing Equation
In this paper, the numerical simulation of the charging and exothermic process of the mobile heating vehicle system must adhere to the principles of the conservation of mass, the conservation of energy, and the conservation of momentum. Given the weak flow of the phase-change material erythritol within the heat storage vessel, the calculation assumes laminar flow conditions. The corresponding control equations are represented in Equations (5)–(8):
Energy equation:
Momentum equation:
Continuity equation:
where ρ is the density of the phase-change material; t is the temperature of the phase-change material; τ is the time; u and w are the flow velocities of the liquid heat storage material in the x-direction and z-direction, respectively; λ is the thermal conductivity of the phase-change material; Cp is the constant-pressure specific heat capacity of the material; S is the source term of the energy equation; μ is the kinetic viscosity of the material; P is the pressure; and Su and Sw are the x-direction momentum source term and z-direction momentum source term, respectively. The source term is actually a damping term, which will have a large value as the melt fraction tends to 0, and disappears from the momentum equation as the melt fraction tends to 1.
The heat stored in the phase-change material is calculated using Equation (9):
where ti, tm, and tf are the initial, final, and melting temperatures, respectively; m is the mass of the PCM; Cps and Cpl are the specific heats of the solid and liquid phases; and ∆q is the latent heat of phase transition.
2.4. Melting/Solidification Modelling
The melting process of the PCM in the heat storage module was simulated with Fluent 2022 software using the “enthalpy-porosity” equation. The solid phase, liquid phase, and solid–liquid zone are the main internal divisions of a material during melting and solidification, and the enthalpy–porosity technique calculates the porosity by defining the proportion of the liquid phase in a grid cell, while the solid–liquid zone is regarded as a porous medium. From the beginning to the end of the melting process, the porosity gradually increases from 0 to 1, and, on the contrary, from the solidification process to the end of the process, the porosity decreases from 1 to 0. The enthalpy–porosity technique introduces into the momentum equation a negative source term, the pressure drop due to the presence of the solid phase. For the problem under consideration, the energy equation takes the following form:
Fluent defines “enthalpy-porosity” in the melting/solidification model as the liquid-phase rate of a phase-change workpiece, which represents the degree of thermal melting of the workpiece, and the liquid-phase rate, fl, is shown in Equation (11) [22].
The PCM is in a solid–liquid two-phase domain when 0 < fl < 1, at this time, the PCM can be regarded as a porous medium, and the porous part is the percentage of the total volume accounted for by the liquid phase. Hs and Hl: are the enthalpies of the solid and liquid phases of the PCM, respectively, where the viscous zone constant is taken to be 1 × 10⁵. For sufficiently fine grids, the numerical prediction of the isothermal phase-transition problem is independent of the permeability coefficient [23].
2.5. Model-Related Assumptions
In order to streamline the analytical process, the ensuing assumptions are posited within the framework of this scholarly exposition:
- (1)
- The heat storage material is isotropic;
- (2)
- The heat loss of the heat storage box is neglected;
- (3)
- Compared with the model size, the thickness of the copper tubes inside the heat accumulator is negligible and has little effect on heat transfer, so the tube wall thickness is ignored in the calculations;
- (4)
- The density of the heat storage material is considered to vary with temperature only in the buoyancy force, while the other parameters are used to vary linearly, i.e., the Boussinesq assumption is used;
- (5)
- The radiative heat exchange of the heat storage material is ignored and only the heat exchange due to convection and conduction is calculated.
The flow is assumed to be two-dimensional, i.e., the temperature change in the Y-direction is neglected, and the temperature drop is considered to be negligible with the flow of the thermal fluid.
2.6. Calculation Conditions and Calculation Methods
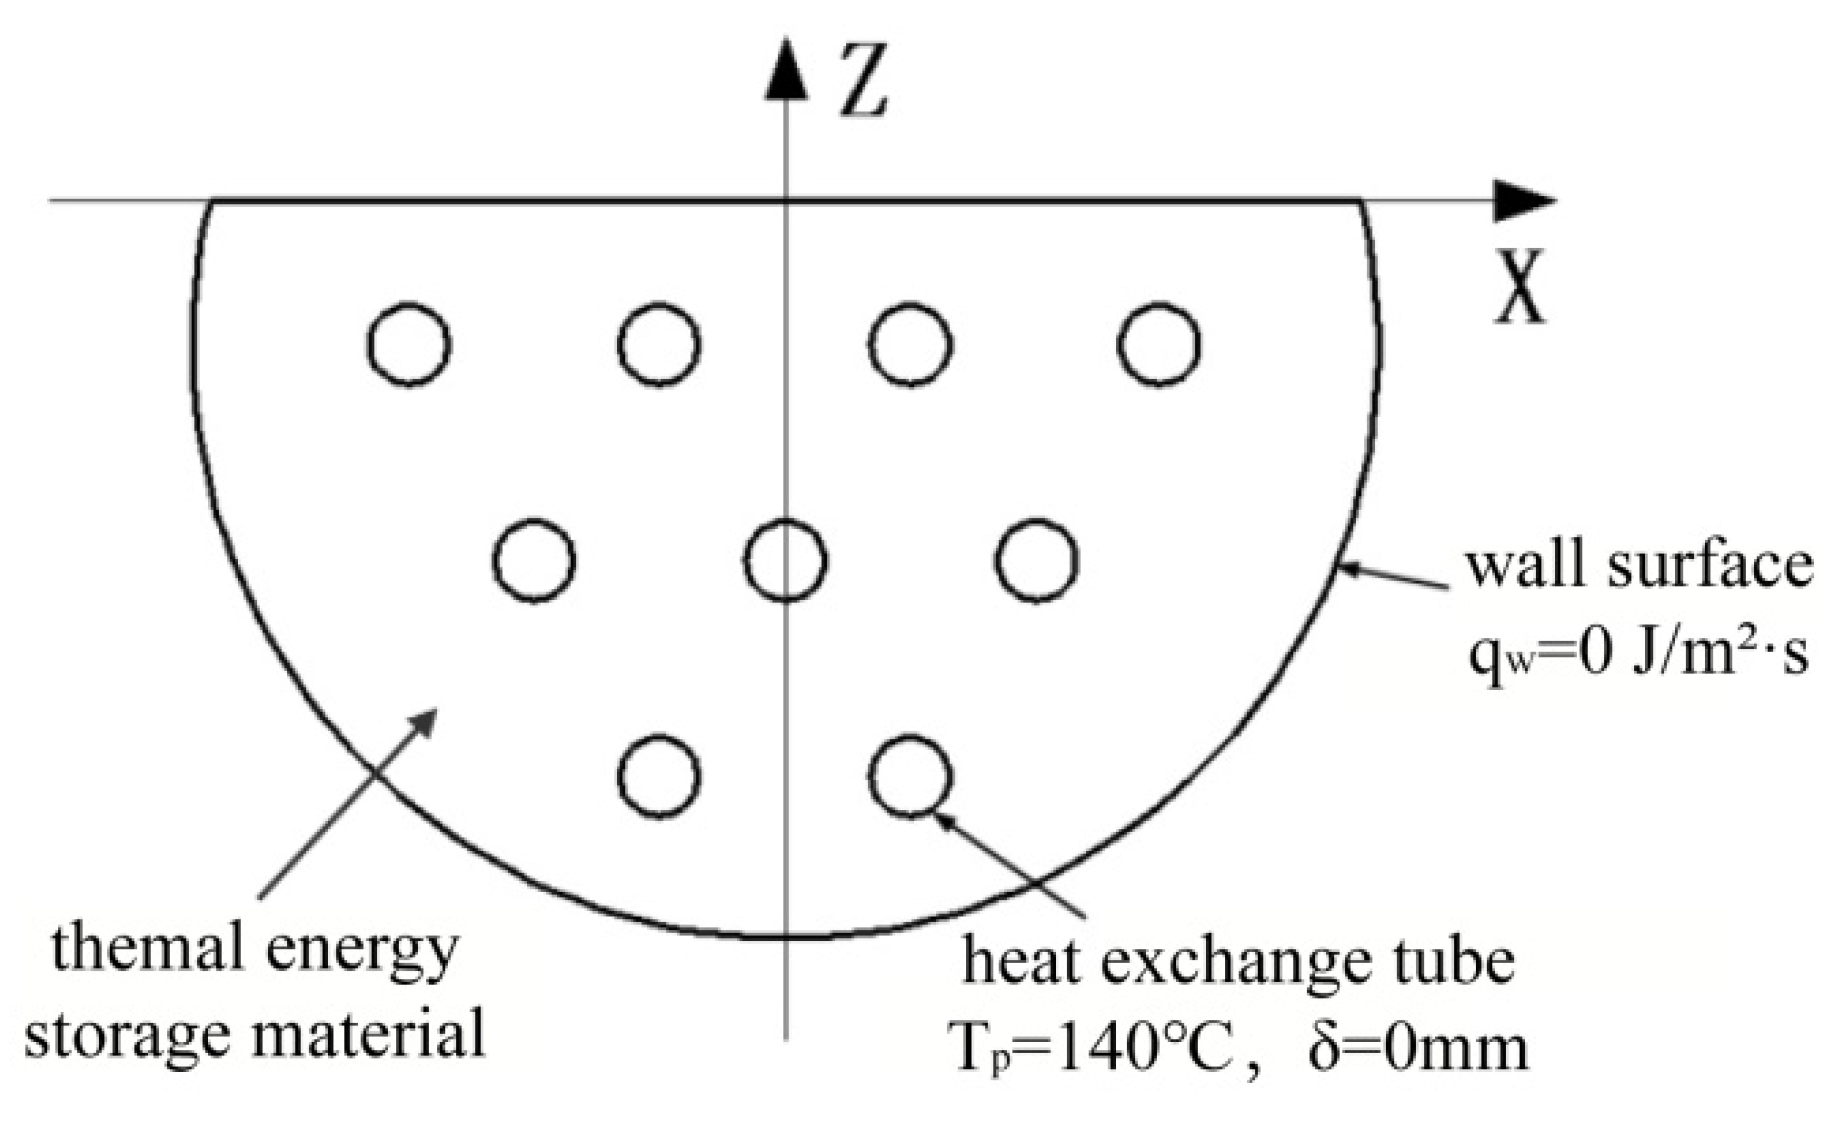
In the numerical calculations of this paper, certain boundary conditions are considered. The thermal insulation layer outside the heat accumulator is assumed to be well adiabatic, meaning that no heat transfer occurs across this layer. The wall of the heat accumulator is treated as an adiabatic boundary condition, implying no heat exchange with the surrounding environment. On the other hand, the wall of the heat exchanger is assigned a constant wall temperature boundary condition of 140 °C, indicating that the heat exchanger maintains a constant temperature at this value. It is recognized that the heat accumulator material will not release heat to the ambient temperature in the actual usage scenario. As a result, the initial temperature of the heat accumulator material within the heat accumulator is set to 65 °C, as depicted in Figure 3. To perform the calculations, the physical properties of the selected phase-change material erythritol must be determined. Table 1 provides a comprehensive overview of the thermal and physical attributes associated with the utilization of erythritol, which serve as the foundational basis for the computational assessments conducted herein [22,24,25,26].

Figure 3.
Schematic diagram of the internal boundary conditions of the heat accumulator.

Table 1.
Erythritol Partial Properties.
In this paper, the calculations are performed using ANSYS Fluent 2022 software, applying the aforementioned mathematical model and boundary conditions. The computational setup includes the use of a pressure-based solver and the unsteady state method. Additionally, the Y-direction gravity is taken into account. The computational approach chosen for this study is the PISO algorithm, complemented by the utilization of the PRESTO method for the discretization of the governing equations. In the context of the numerical scheme, the momentum equations and energy equations are prescribed in the format of second-order windward differences. While the majority of parameters adhere to their default configurations, one noteworthy exception lies in the subrelaxation factor applied to the momentum term, thoughtfully set at a value of 0.5. It is imperative to acknowledge that the temporal accuracy of the numerical predictions is inextricably tied to the size of the selected time step. Smaller time steps allow for more precise tracking of time-dependent processes, resulting in more accurate results. Larger time steps can lead to significant errors, especially when capturing rapid changes. Time step size also affects the computational cost of the simulation. Smaller time steps require more computational resources and time to complete the simulation. Finding a balance between accuracy and computational efficiency is critical. The choice of time step size also affects the convergence of the numerical solution. As the time step decreases, the solution may converge to more accurate results. However, too small a time step may result in slower convergence or an increased computational burden. After comparing our multiple simulations, the numerical solution converges better and within a tolerable computational burden for a time step of 0.1 s.
2.7. Mesh Segmentation and Irrelevance Verification
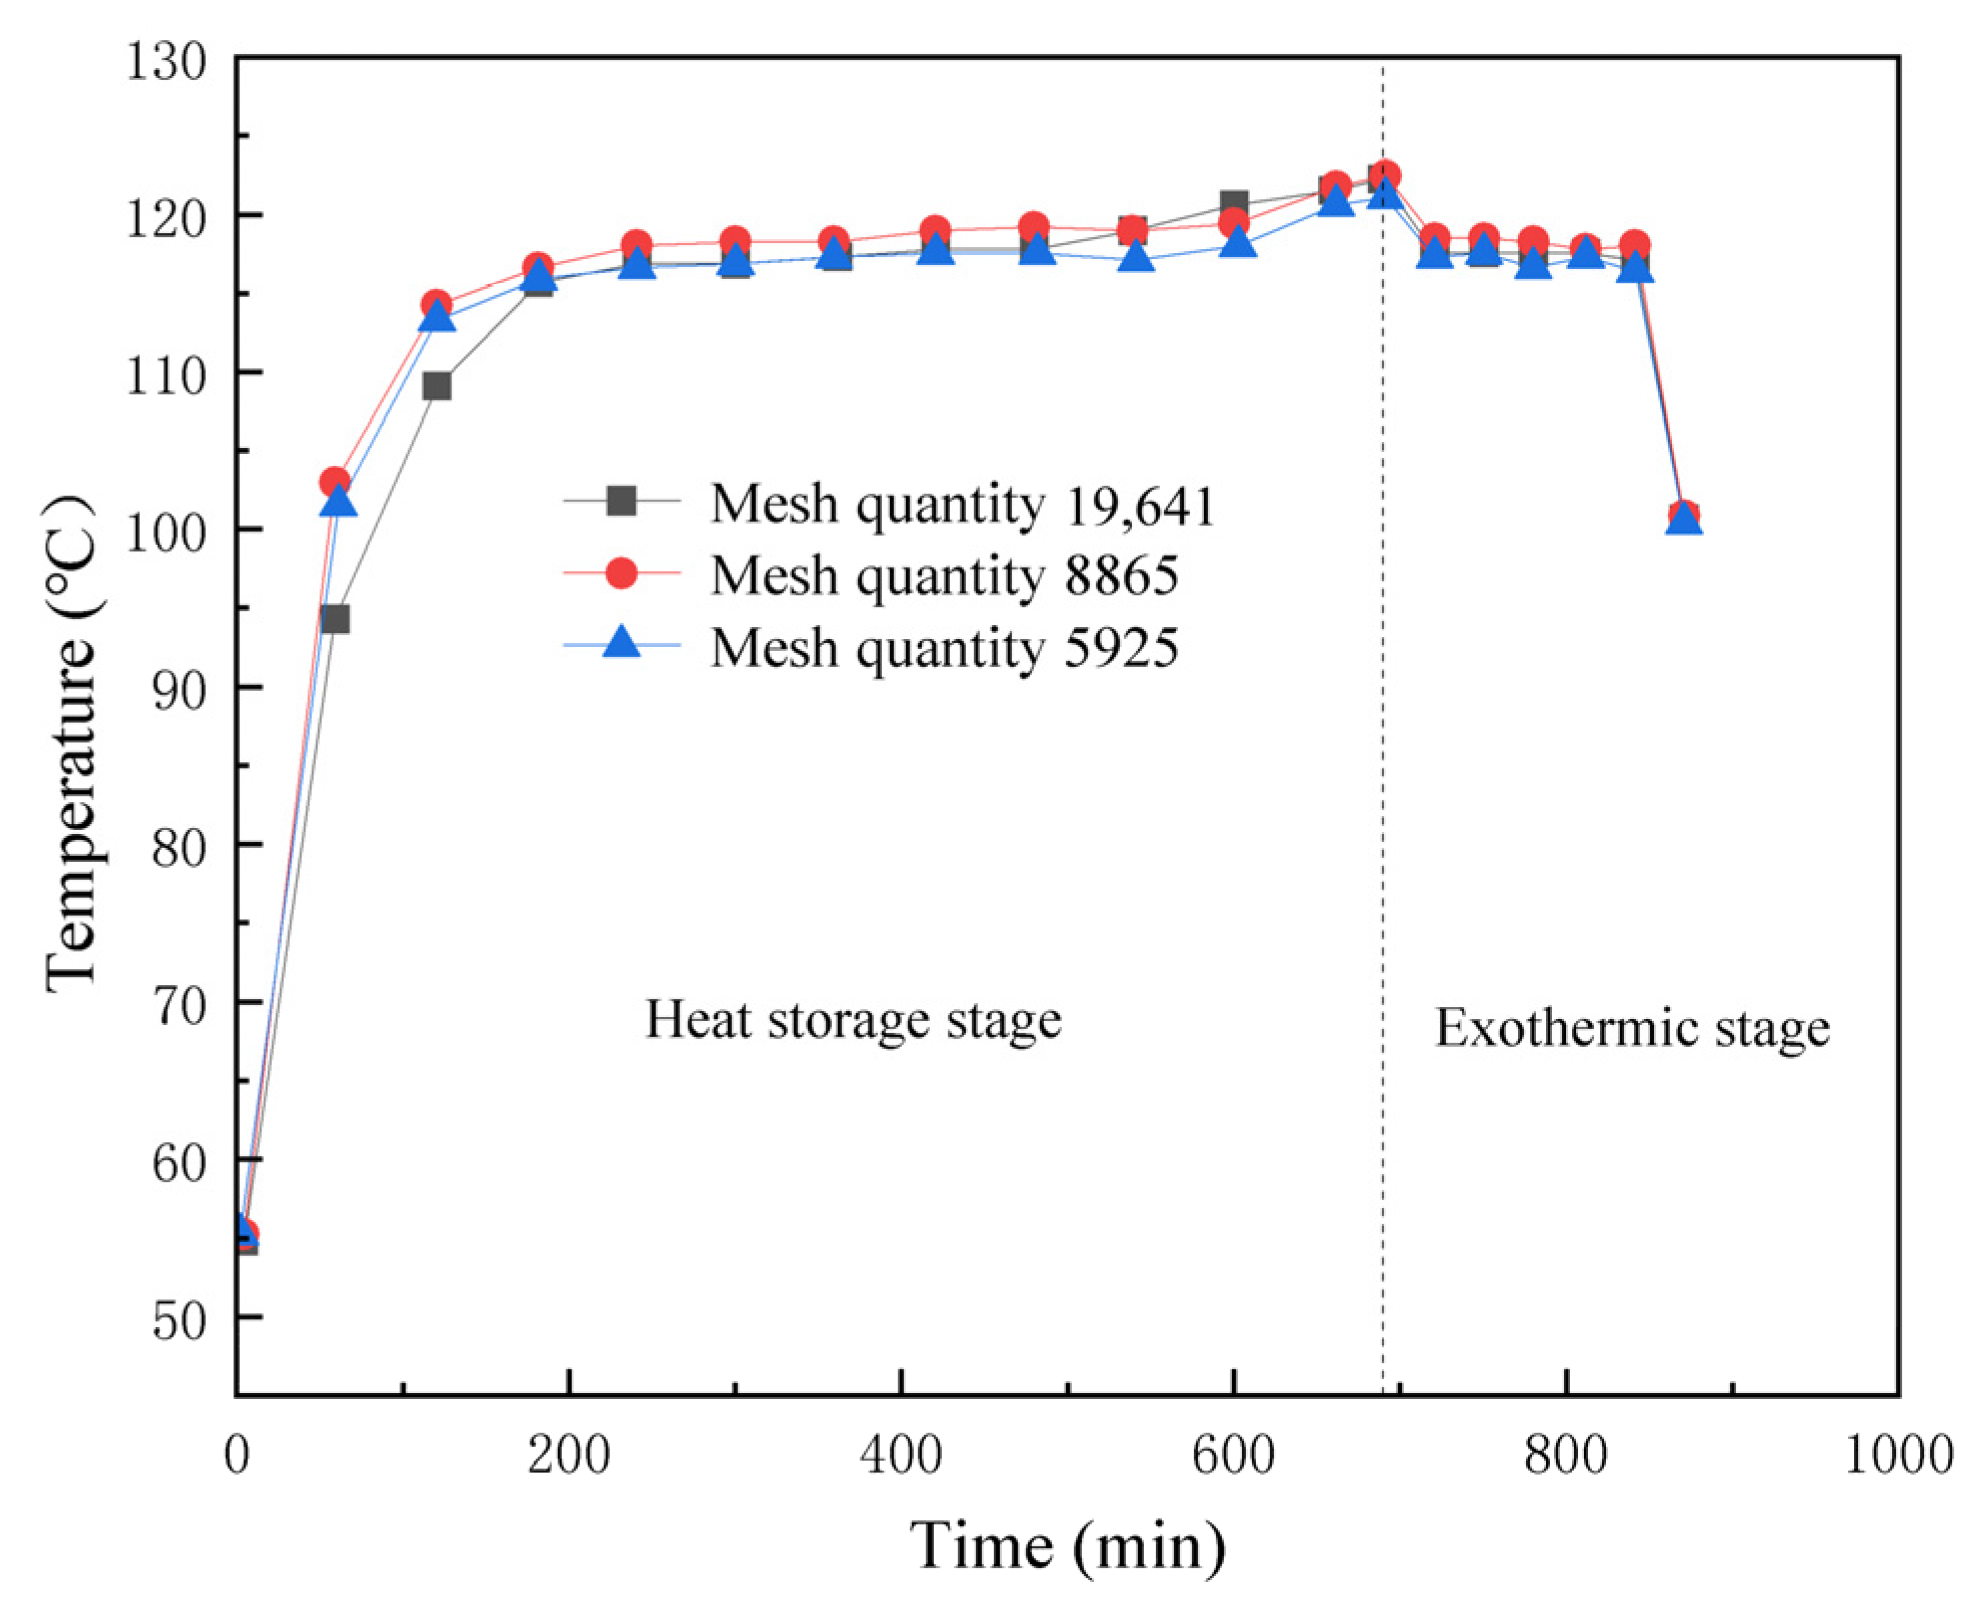
In this paper, a triangular mesh is chosen for the heat transfer model to validate mesh independence. Three different mesh divisions are employed with cell sizes of 3 mm, 5 mm, and 7 mm, resulting in mesh cell numbers of 19,641, 8865, and 5925, respectively. Figure 4 displays the temperature results of T1 monitoring points under various grid divisions. By comparing and analyzing the temperature curves, it is evident that the temperature calculation results for the three cases exhibit minimal differences. Thus, it can be assumed that when the number of grid cells is equal to or greater than 5925, the calculation results’ accuracy is independent of the grid division. Considering the allocation of computational resources and the desired accuracy of the calculation results, this paper opts to use a mesh number of 8865 for further model development and validation.

Figure 4.
Temperature results of T1 monitoring points under different grid divisions.
2.8. Model Validation
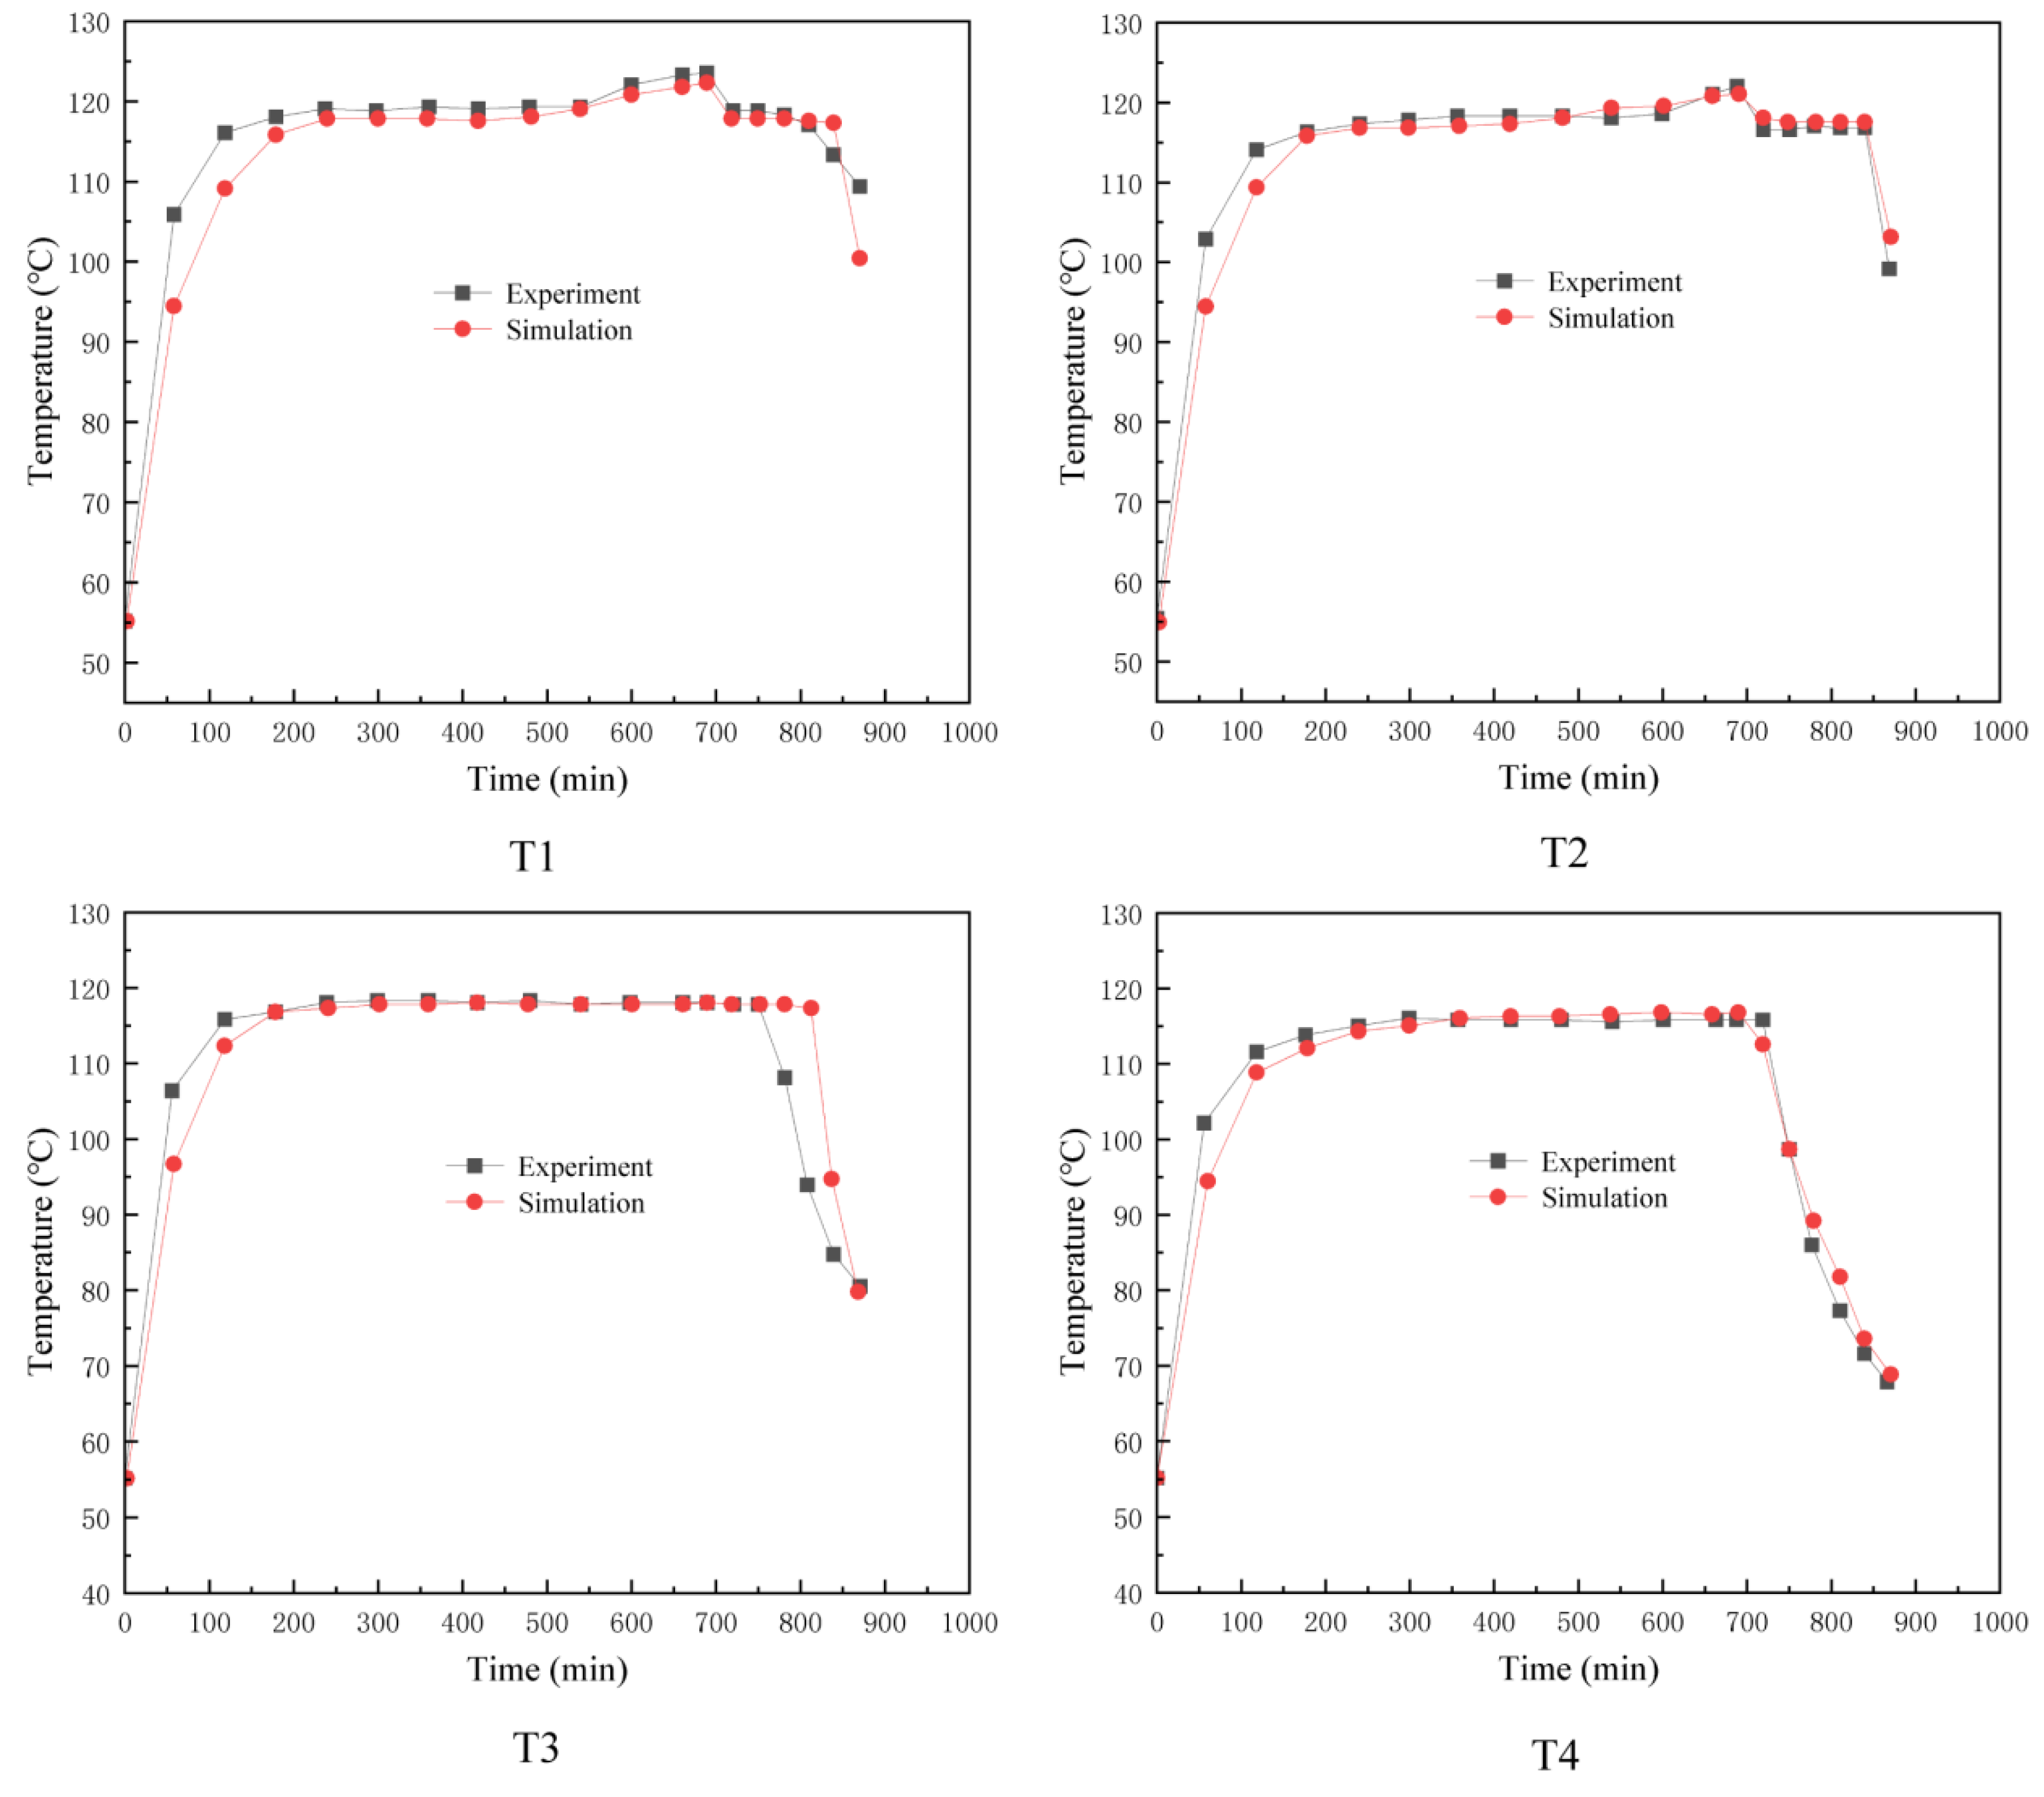
Based on the experimental data provided in [2], a comparison and analysis of the numerical simulation results and the corresponding experimental data are conducted for the four monitoring points, namely, T1, T2, T3, and T4, situated above the heat accumulator in the experiments. The purpose is to verify the accuracy of the model used in this paper. Figure 5 depict the comparison between the simulation results and the experimental data at the four temperature detection points. Upon observation of these figures, it becomes evident that the overall trend of the simulation results aligns well with the experimental results concerning the temperature data over time. Additionally, the simulated temperature data at the corresponding points shows only minor deviations from the experimental data. As a result, it can be concluded that the modeling assumptions and computational setups mentioned in the previous section are deemed reasonable and effective for this study.

Figure 5.
Comparison of test points.
2.9. Analysis of Phase-Transition Processes
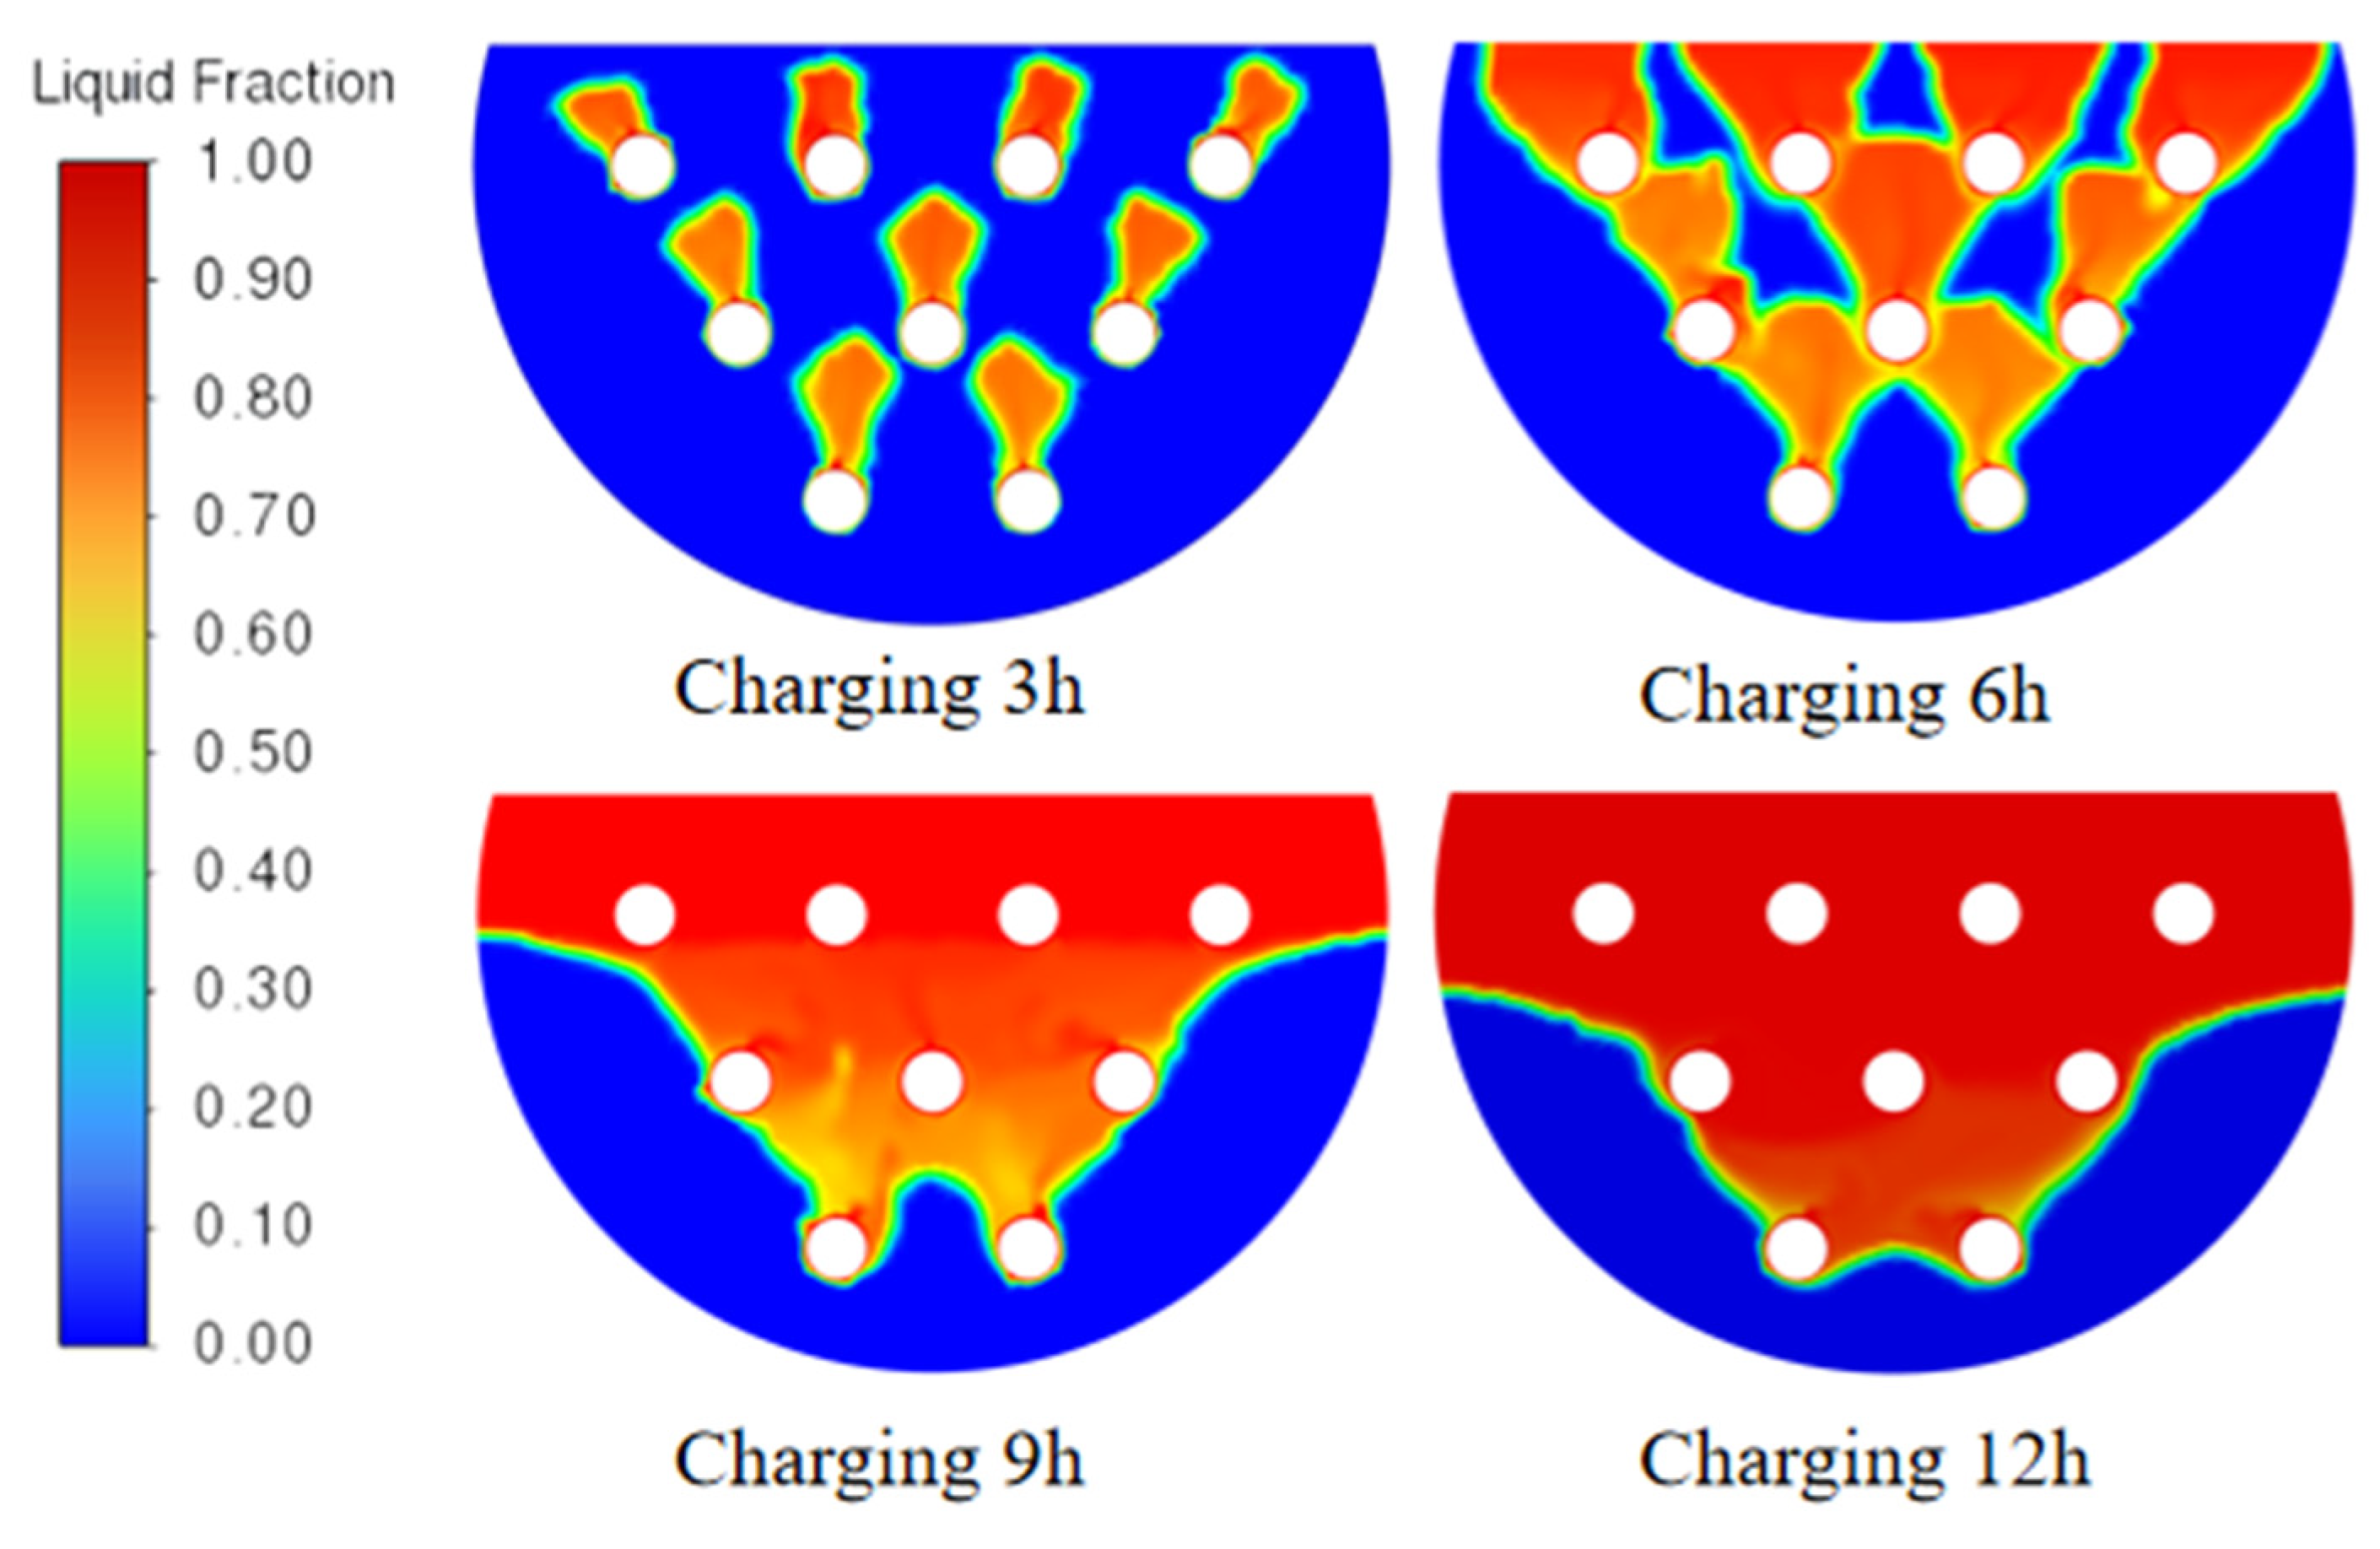
Erythritol, functioning as an organic phase-change thermal storage material, exhibits commendable attributes, including a noteworthy high latent heat of phase transition and a correspondingly low melting temperature, rendering it exceptionally well-suited for applications within the domain of phase-change energy storage. However, due to constraints in the number of temperature measurement points within the accumulator, the existing four points (T1, T2, T3, and T4) are insufficient to fully capture the overall temperature changes and melting process of the material inside the accumulator. In order to attain a more profound comprehension of the phase-transition dynamics inherent to erythritol within the accumulator, and to facilitate the seamless adaptation of the accumulator vessel’s structural framework for modular design considerations, it is imperative to harness the simulation outcomes encompassing the entirety of the accumulator, thus affording a holistic evaluation of the phase-transition phenomena therein. Accordingly, this paper presents the phase-transition diagrams for the process of heat storage over 12 h, followed by the exothermic process for 4 h, as illustrated in Figure 6 and Figure 7. These diagrams provide a comprehensive overview of the phase change throughout the entire heat storage vessel, offering valuable insights into the behavior of erythritol during the storage and release of thermal energy.

Figure 6.
Variation of liquid fraction during heating.

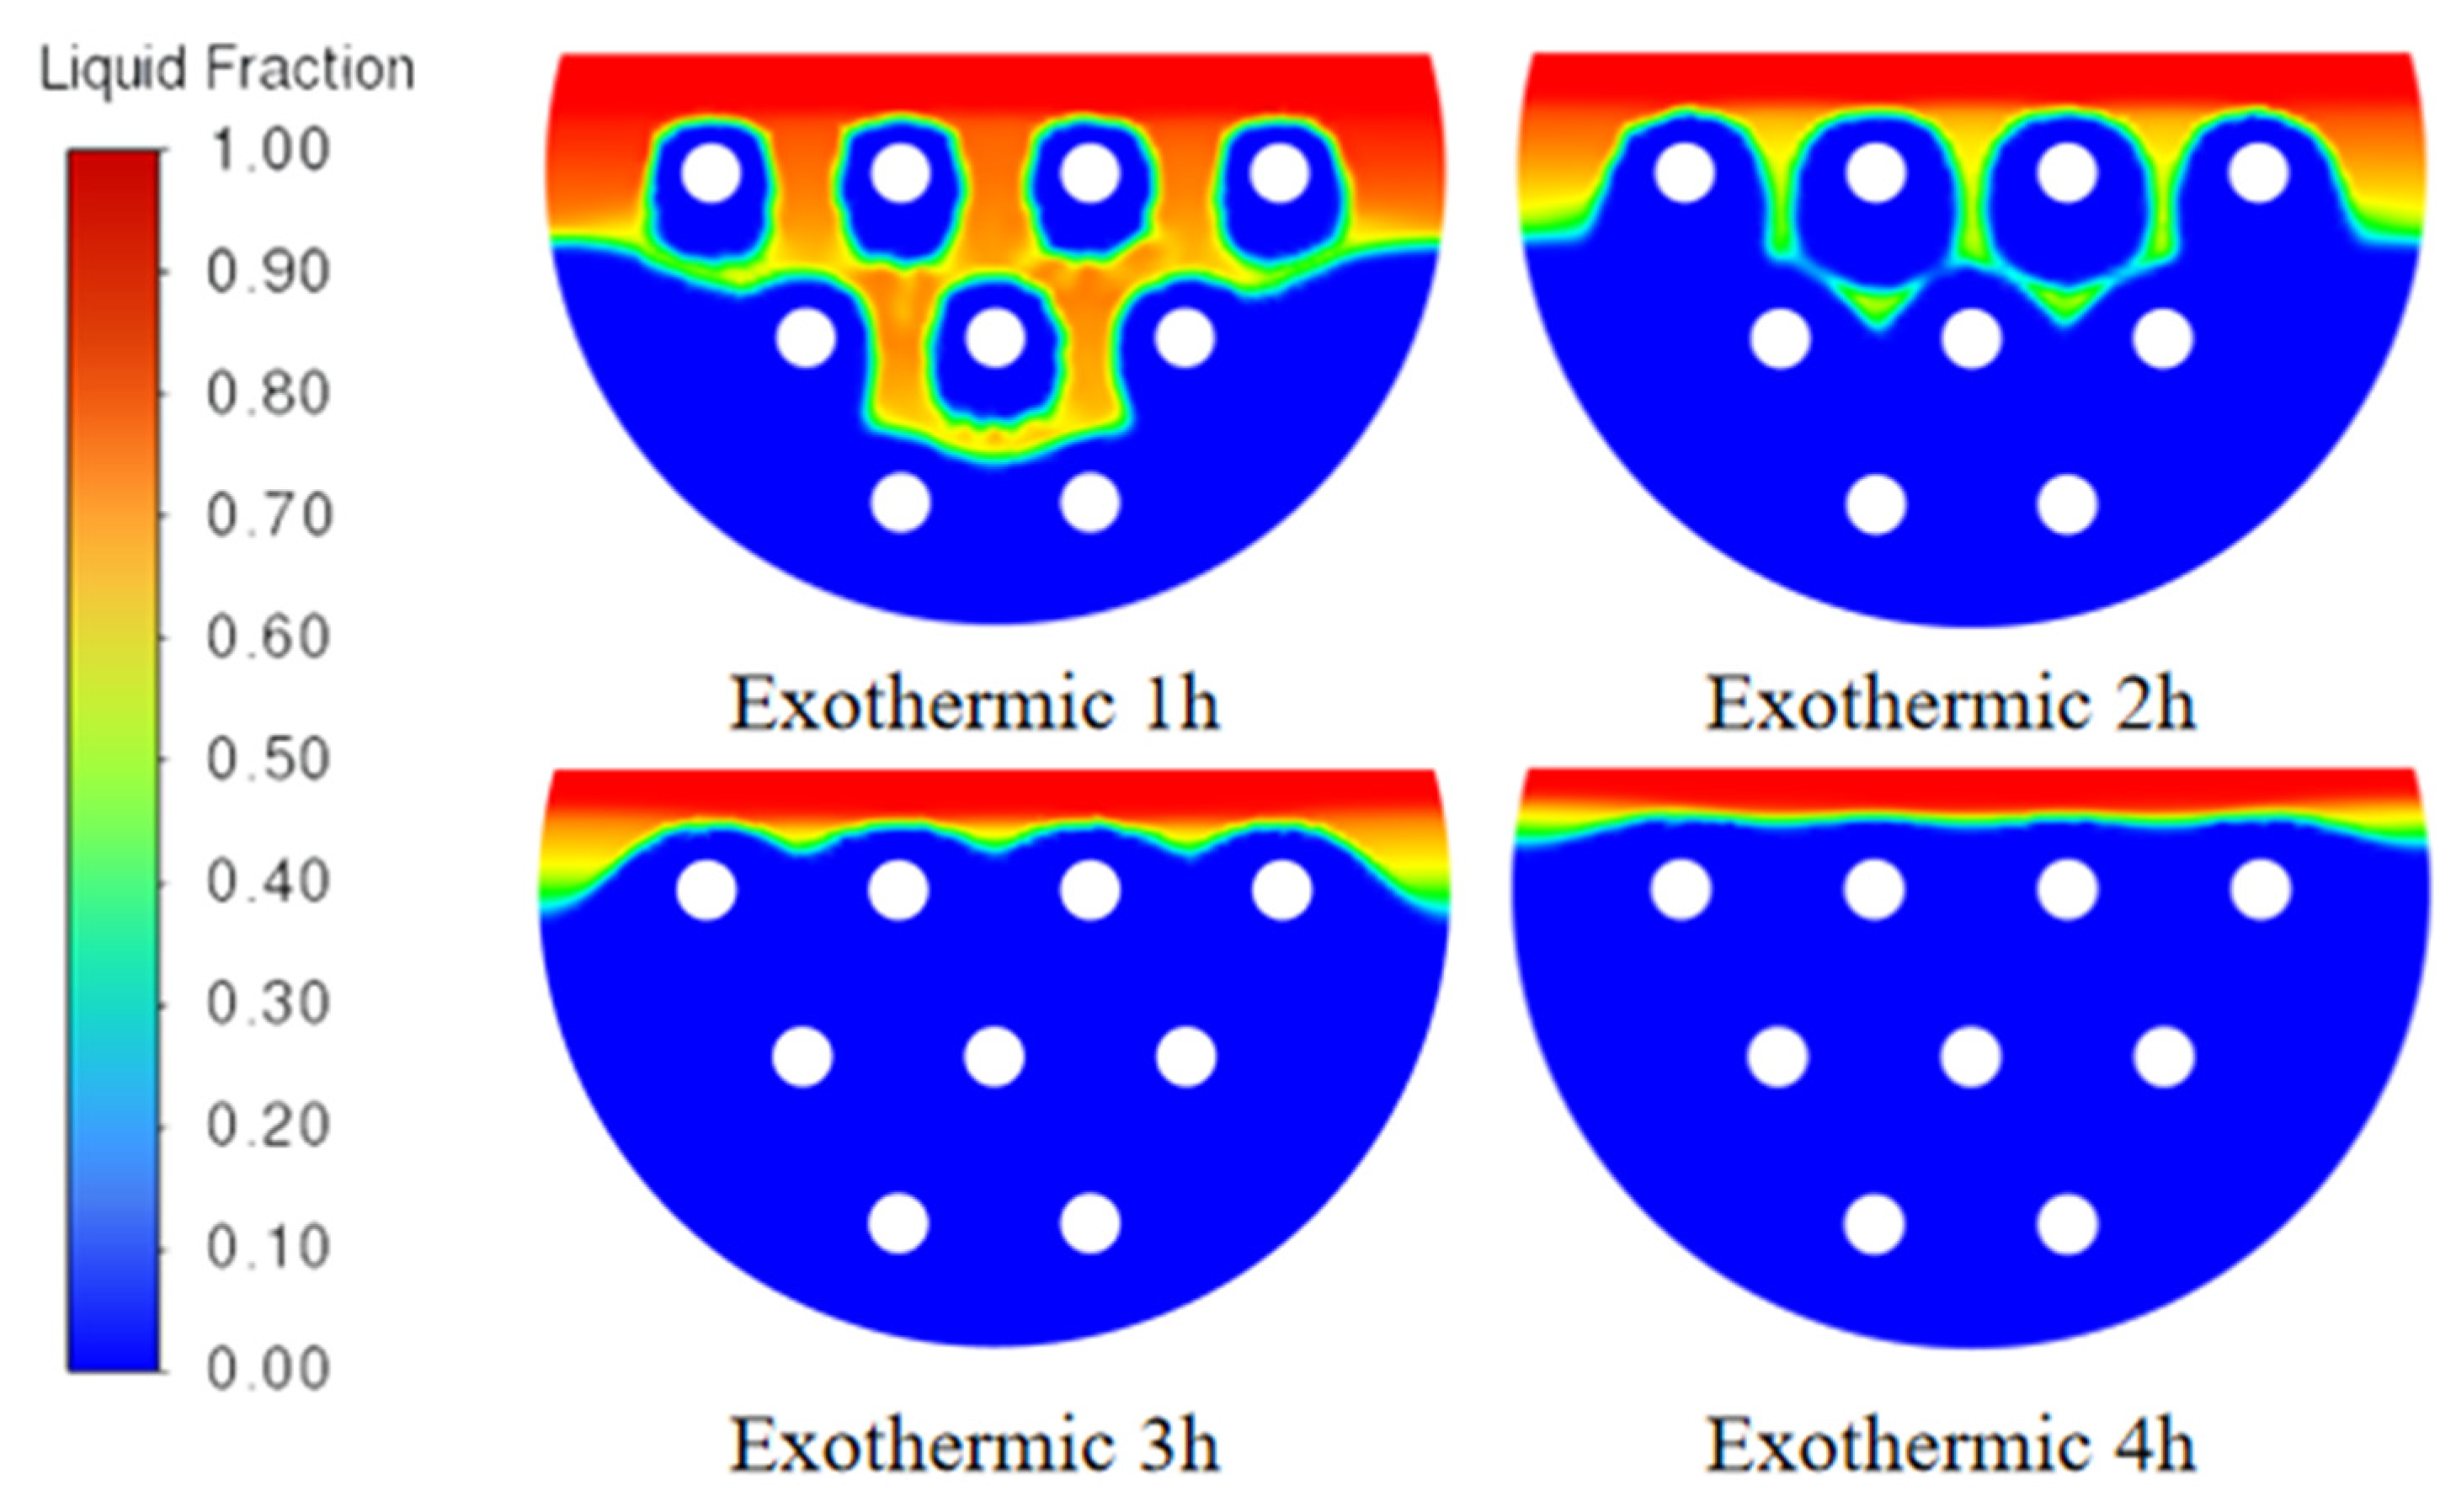
Figure 7.
Variation of liquid fraction during exothermic processes.
As observed from the figures, the region around the heat tube experiences the highest temperature, surpassing the melting temperature of erythritol. Consequently, the heat tube surrounding the heat storage material is the first to melt, resulting in a decrease in density and the formation of natural convection. Under the influence of natural convection, the melted portion of erythritol accelerates the heat transfer to the unmelted portion of erythritol in the upper part of the heat tube. Consequently, the rate of melting exhibited by erythritol within the upper segment of the heat tube substantially surpasses that observed within the lower portion. This restricted heat transfer and spread of heat affect the diffusion of heat. This phenomenon persists for about 6 h, during which the top of the heat exchanger tube has mostly melted sugar alcohol, and heat is primarily absorbed by the solid portions of erythritol along the sides of the heat exchanger tube. However, the diffusion of melting remains slower than ideal.
In contrast, the exothermic process is much shorter than the heat storage process. At the beginning of the exothermic process, heat is drawn from the low-temperature wall of the heat exchanger tube, leading to a decrease in temperature around the sugar alcohols in the vicinity of the heat exchanger tube. This causes the first solidification to occur in this area. However, the upward flow of the unfrozen portion is aided by natural convection, gathering heat towards the top of the heat accumulator during the initial three hours of the exothermic process. Consequently, after three hours, only the liquid sugar alcohols remain within the heat exchanger’s upper section, and the exothermic heat transfer largely relies on heat conduction from that point onwards. As the exothermic process continues, the rate of exothermic heat release gradually diminishes over the next 3 to 4 h.
3. Modular Design
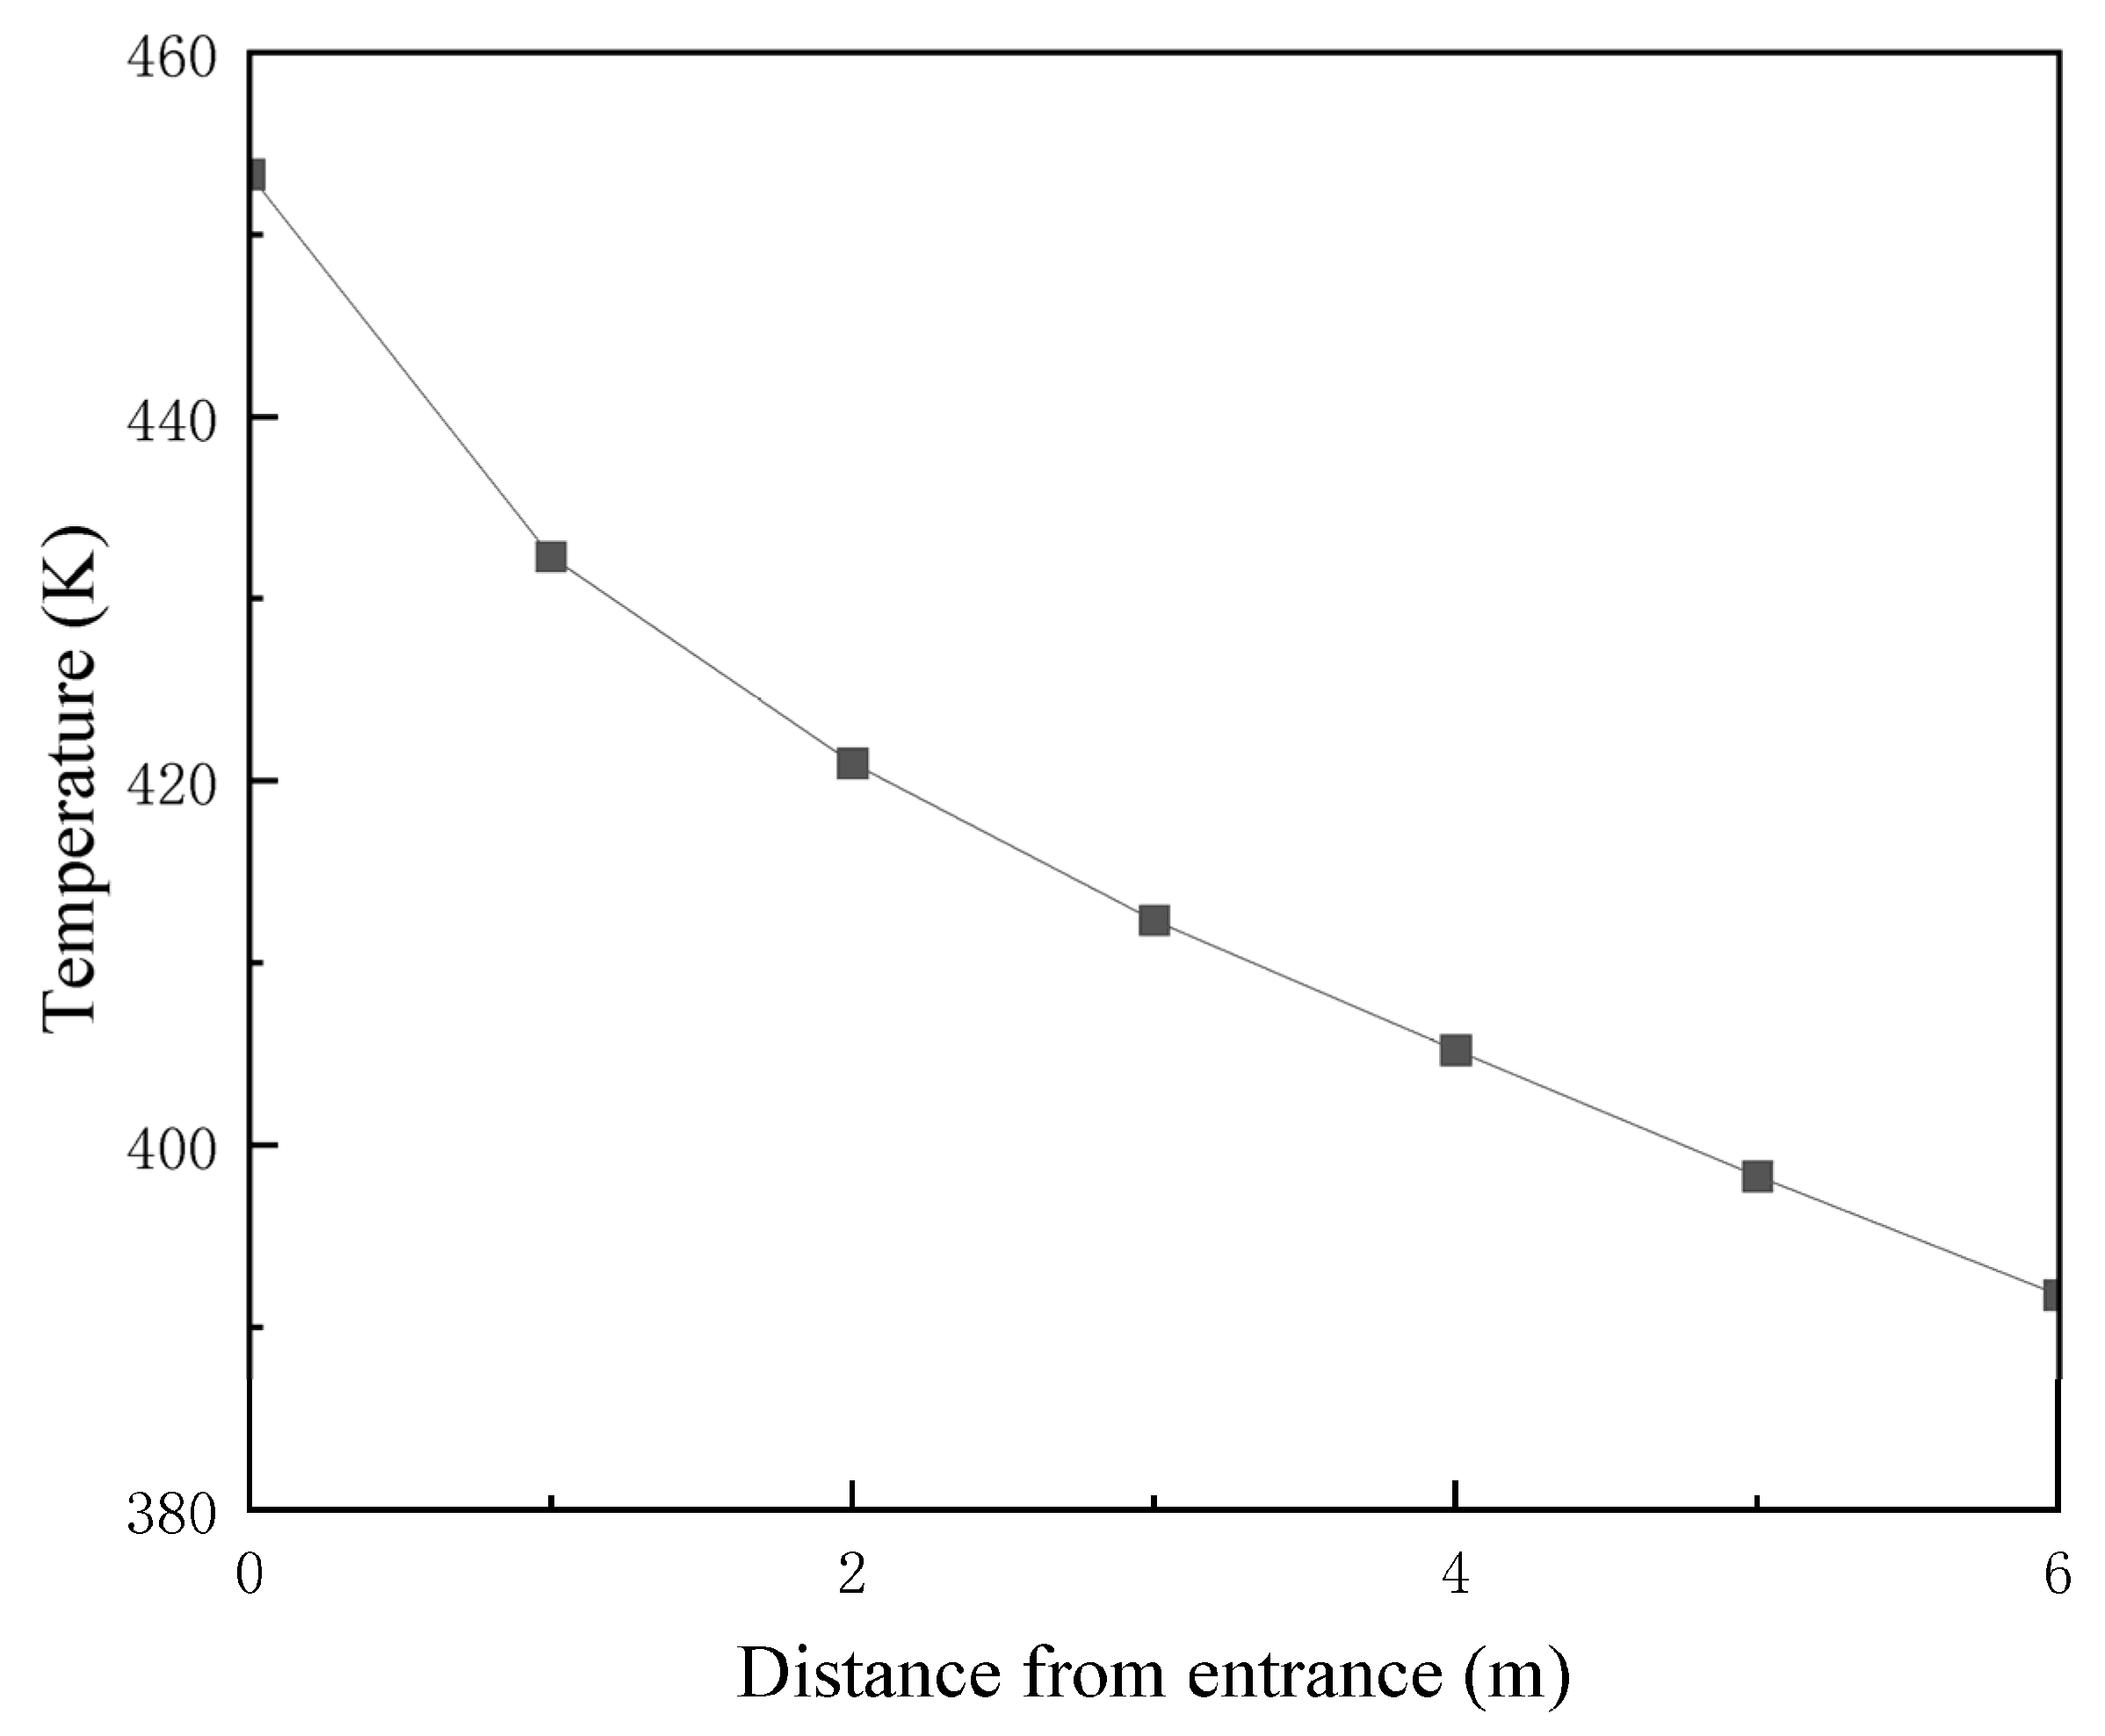
During the heat storage progression, the thermal fluid’s temperature progressively diminishes as it traverses through the heat transfer conduit. The efficacy of heat transfer is intrinsically intertwined with the temperature differential existing between the thermal fluid’s ingress and egress points. The judicious optimization of the length of the heat transfer tube serves as a pivotal strategy in mitigating this temperature differential, thereby bolstering the overall efficiency of the heat storage operations. To comprehend the temperature drop inside the heat transfer tube and determine the appropriate tube length, the paper conducts calculations on the average temperature of a cross-section within a long straight tube measuring 6000 mm in length and 160 mm in diameter. The tube is supplied with water vapor at a flow rate of 1 m/s, and the temperature of the tube wall is kept constant at 338 K. Figure 8 provides insight into the average temperature of the cross-section. While the temperature difference per unit distance is decreasing along the tube, there is a noticeable minimum temperature difference of 6.46 K occurring at the 5th–6th meters. At this point, the exit temperature is 391.70 K, which is significantly reduced by 61.3 K compared to the inlet temperature of 453 K. Such a substantial temperature drop has a significant impact on the heat transfer process during heat storage.

Figure 8.
Temperature drop in the tube.
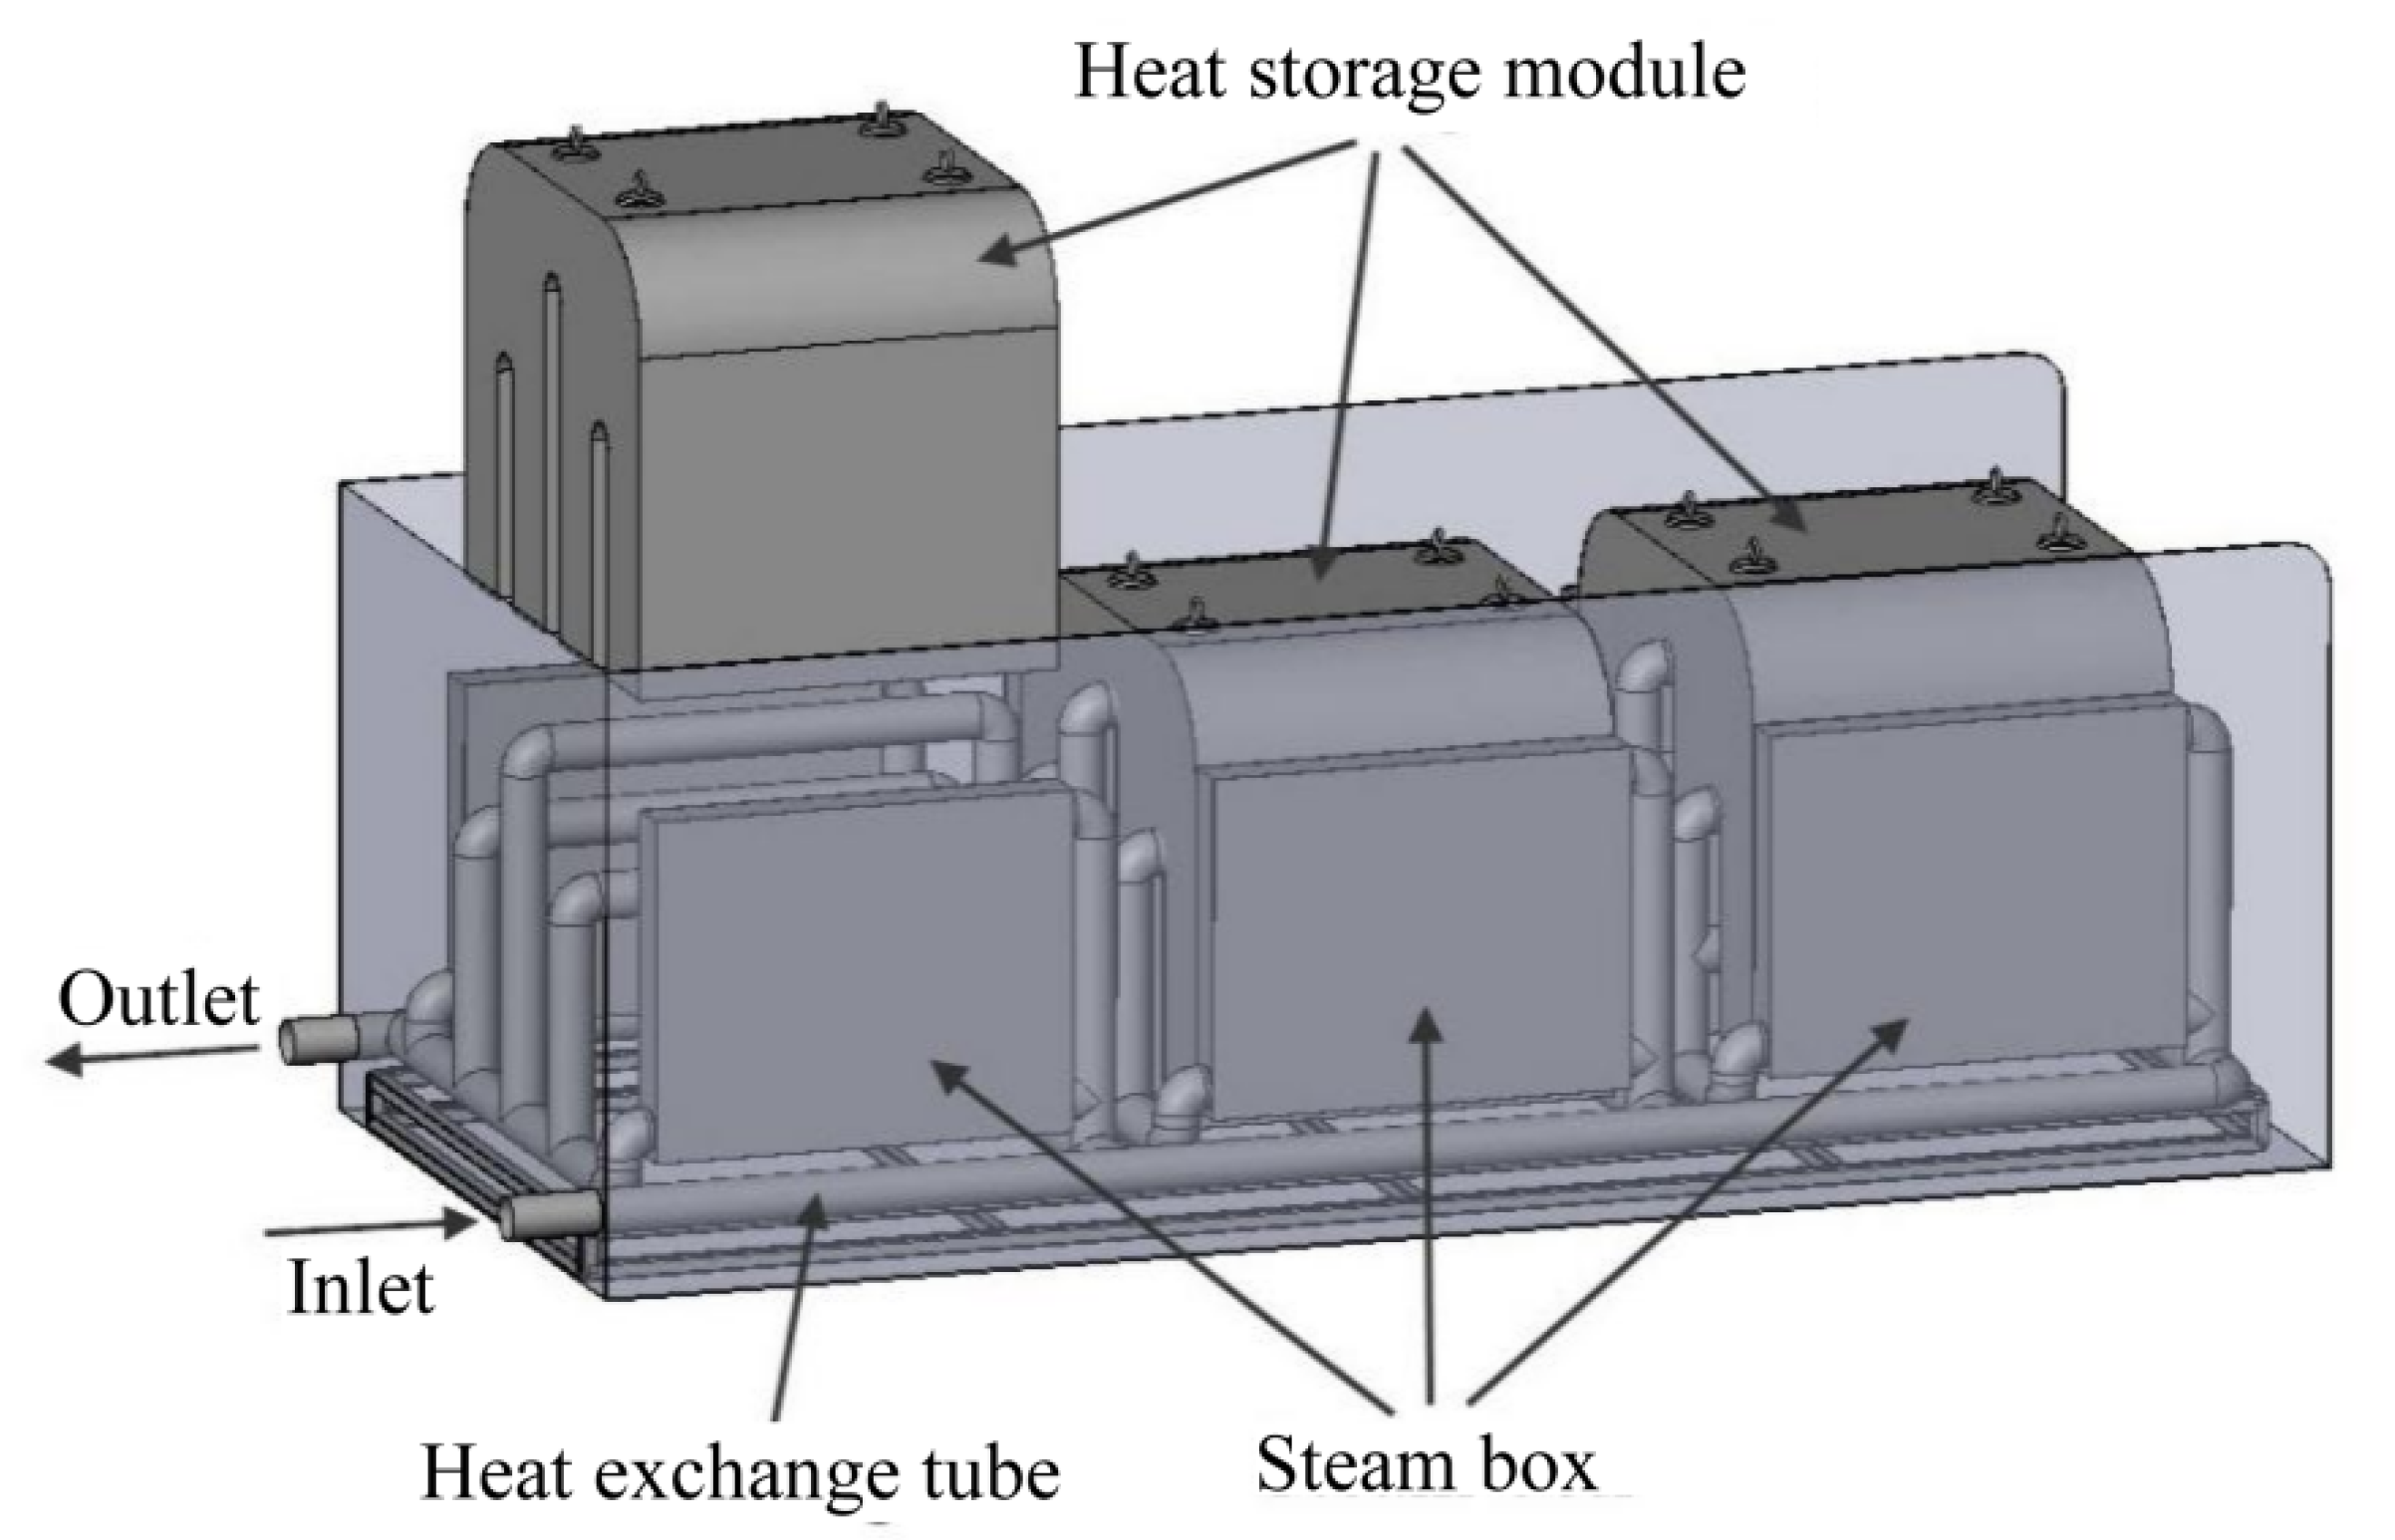
To reduce the temperature difference attenuation during the heat storage process and enhance the flexibility of the heat configuration, this paper proposes a mobile heating program. The thickness of the mobile heating box body is shortened to approximately 2 m, as depicted in Figure 9. The mobile heating system is divided into three modules. During the exothermic stage, the low-temperature workpiece remains unchanged, and liquid water is used. However, in the heating stage, the high-temperature workpiece replaces the YD-320 heat conduction oil with high-temperature water vapor. This substitution aims to minimize the degree of temperature attenuation, thereby improving the overall efficiency and performance of the mobile heating system.

Figure 9.
Mobile heating system box design.
4. Modeling and Calculation Methods
4.1. Model Building
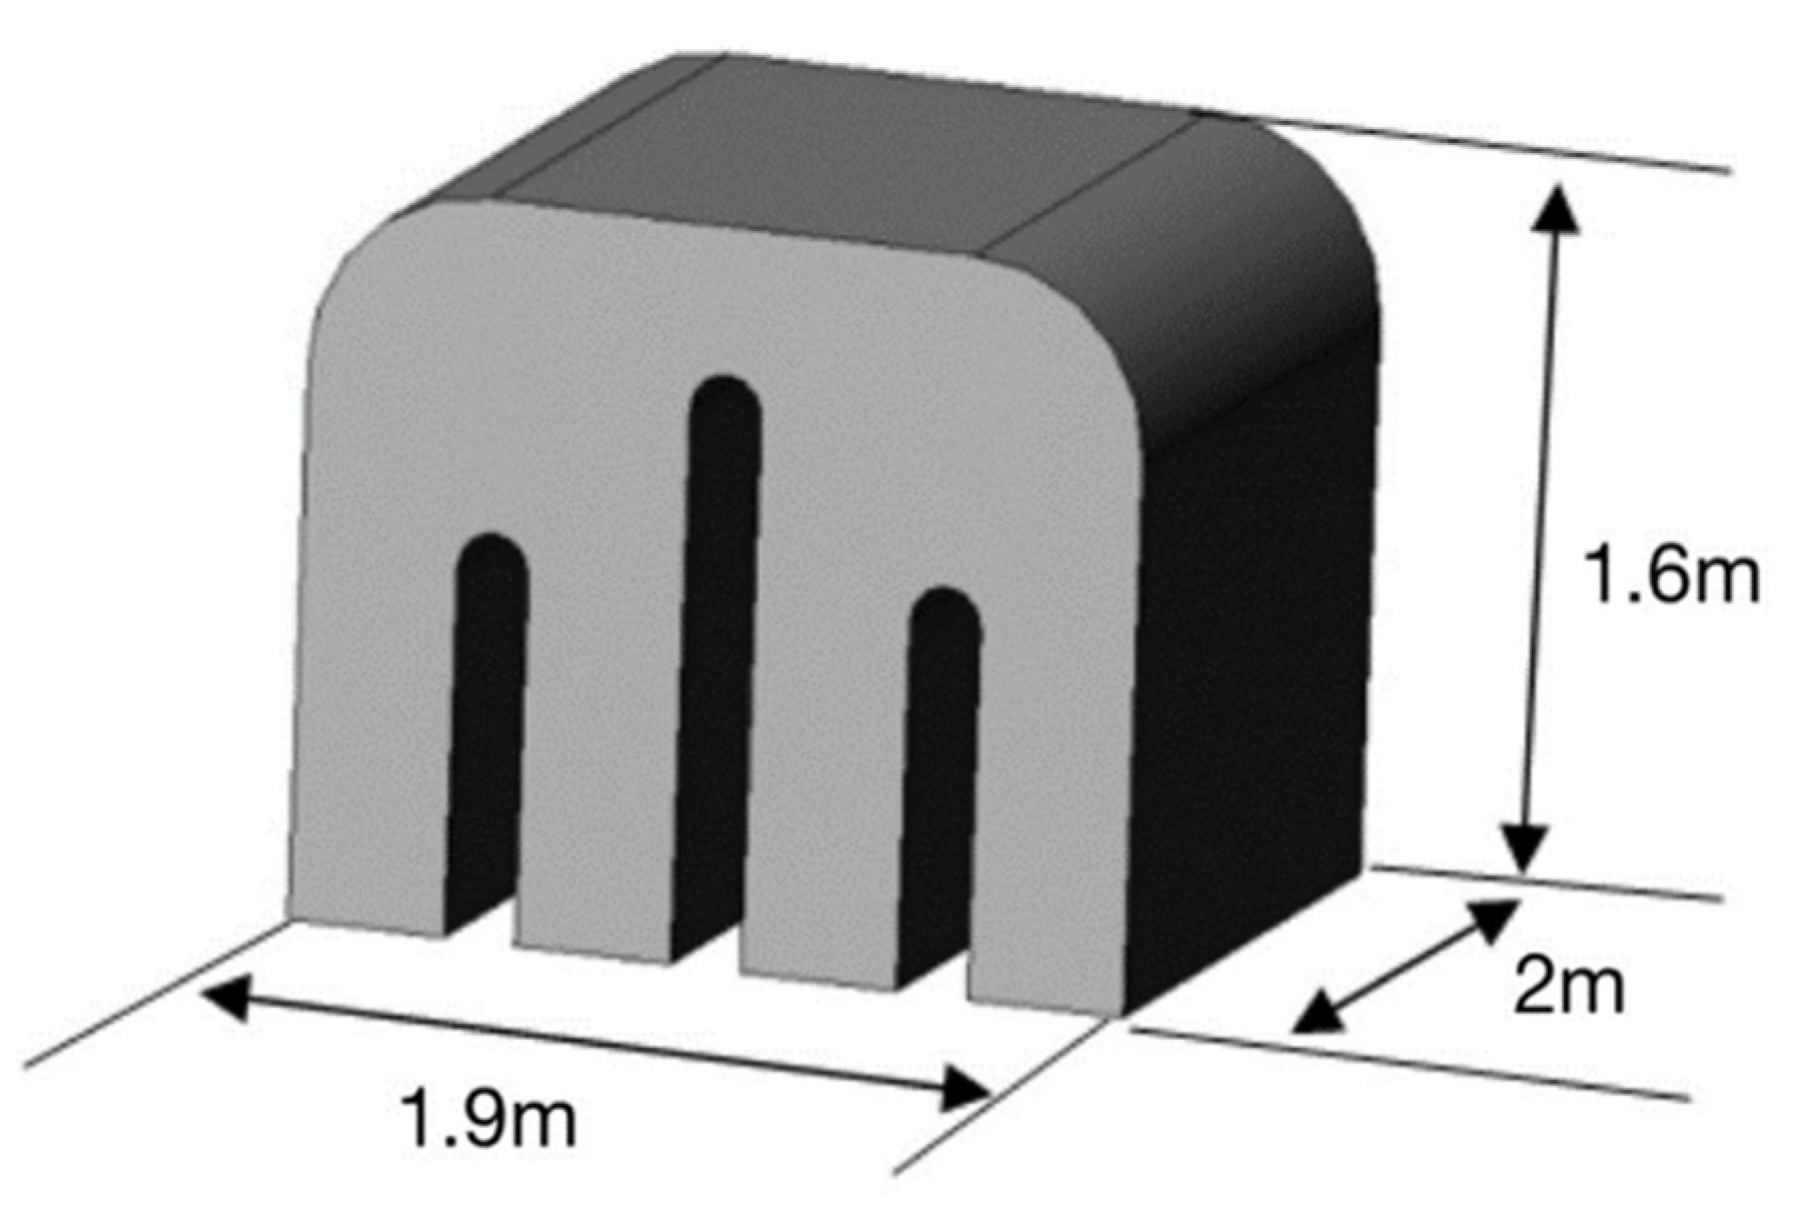
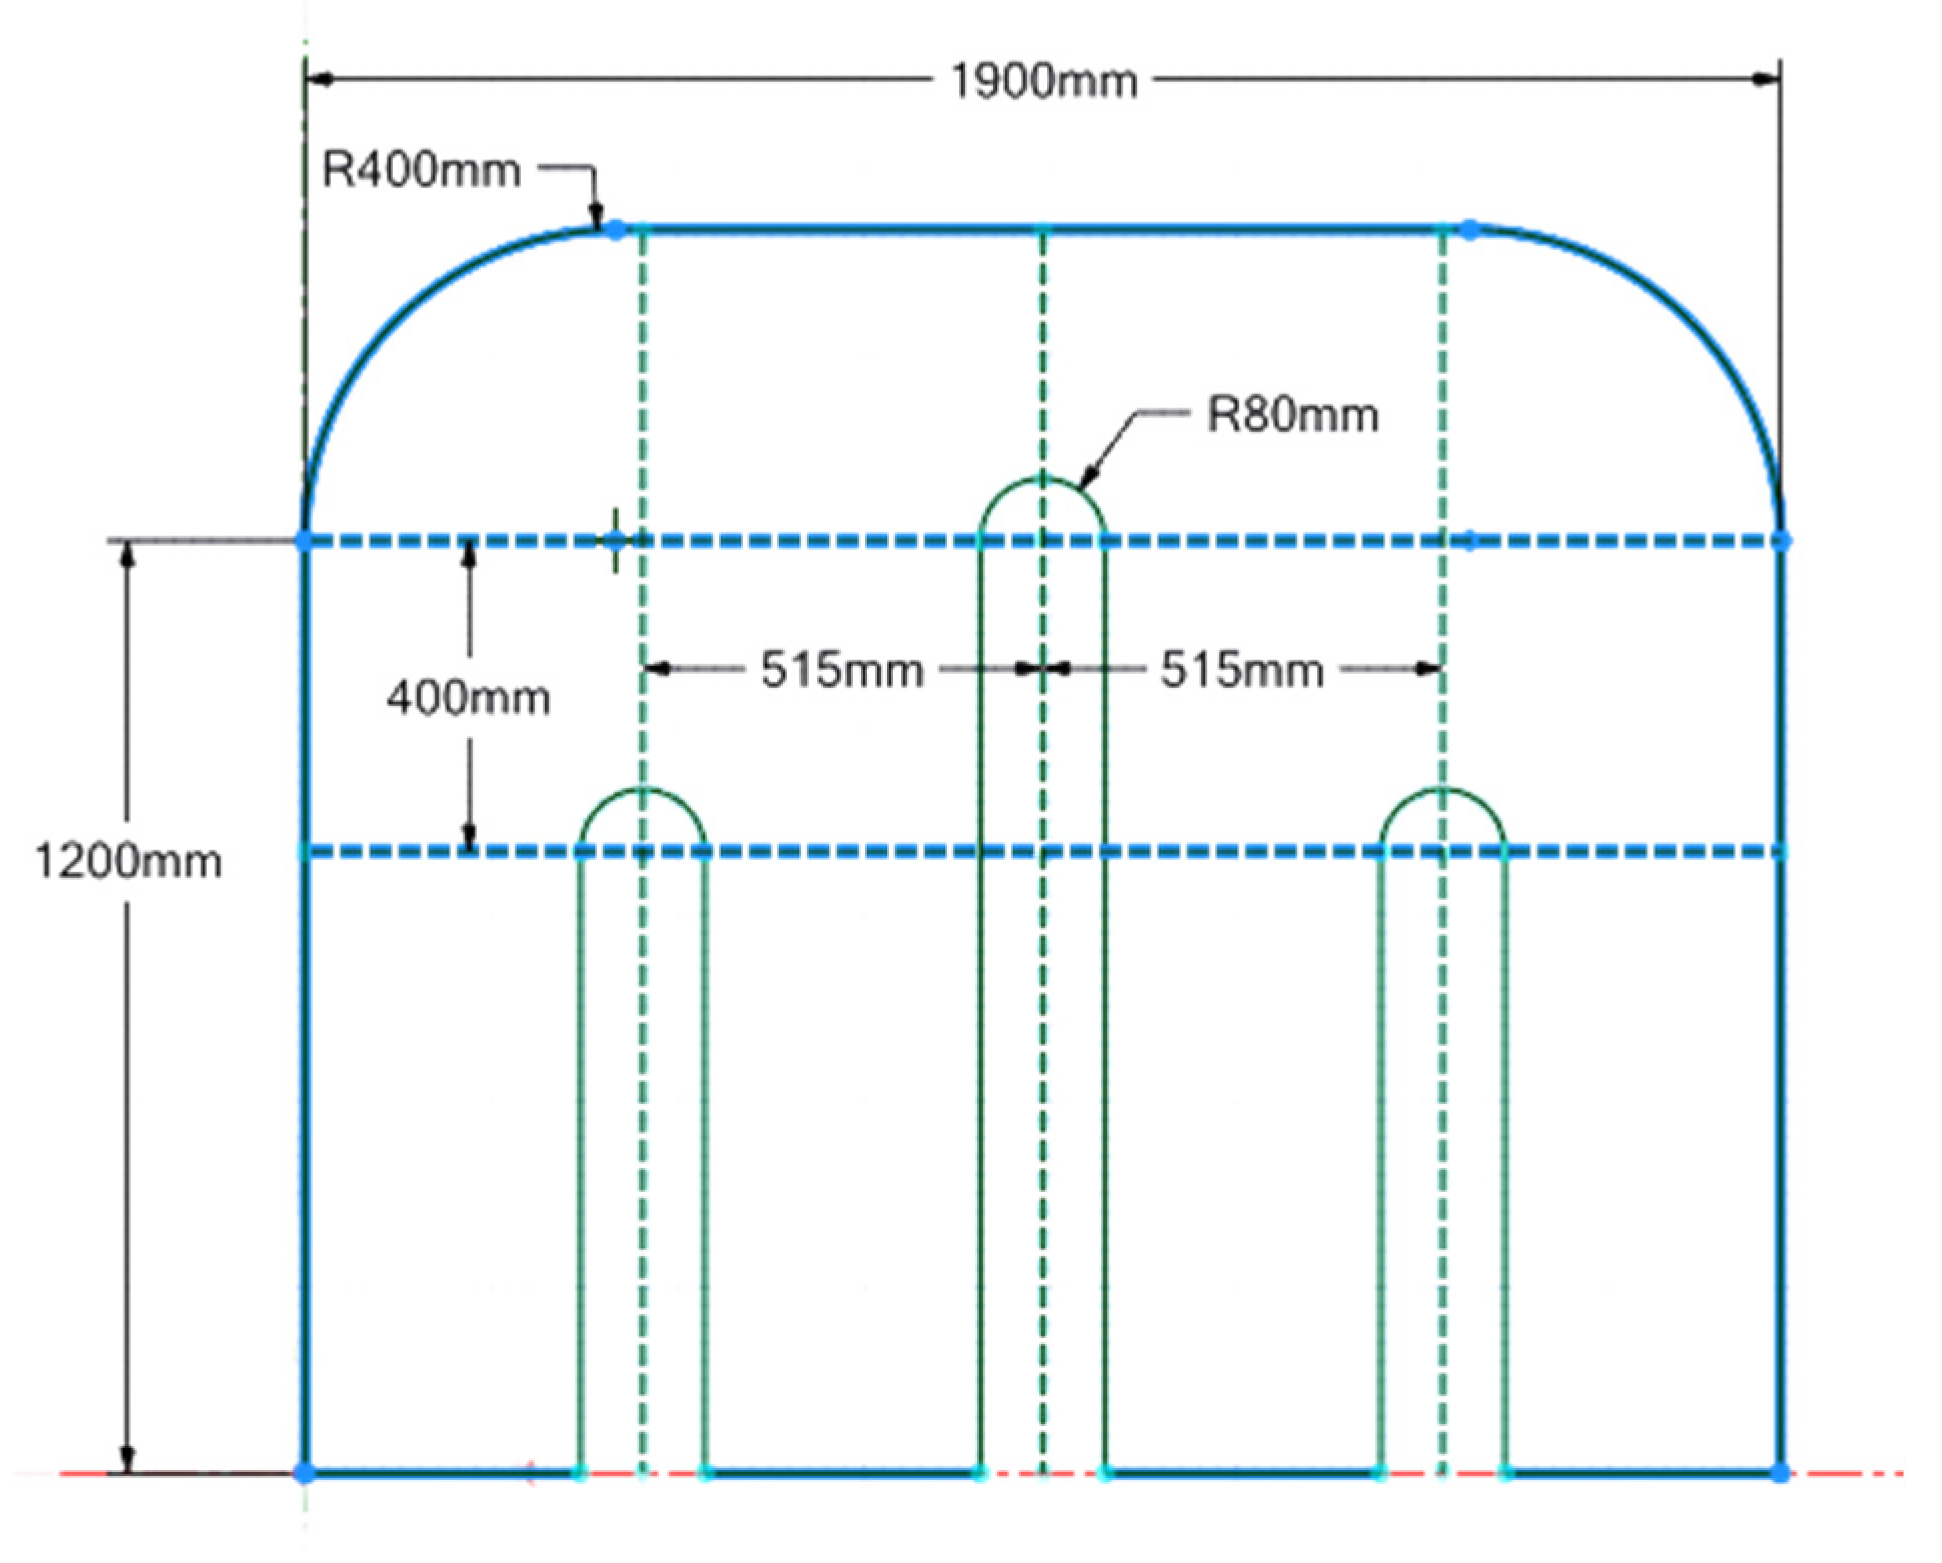
The specification of the modularized box is detailed in Figure 10 and Figure 11. The box has dimensions of 1.9 m in length, 1.6 m in width, and 2 m in height. The corners on the upper left and upper right sides are chamfered with a radius of 400 mm to ensure safety and a smooth design. Inside the heat accumulator, three domed rectangles are distributed evenly with a width of 160 mm and heights of 800 mm, 120 mm, and 80 mm, respectively, according to the specified distances. These distributions optimize the heat storage capacity and ensure efficient energy transfer. For ease of use and maintenance, the upper part of the modularized box is designed with hooks. These hooks allow the heat-carrying equipment to be lifted out easily at any time, facilitating movement and convenience during maintenance and overhaul activities.

Figure 10.
Modular cabinet design.

Figure 11.
Cross-sectional dimensions of the modular thermal storage box.
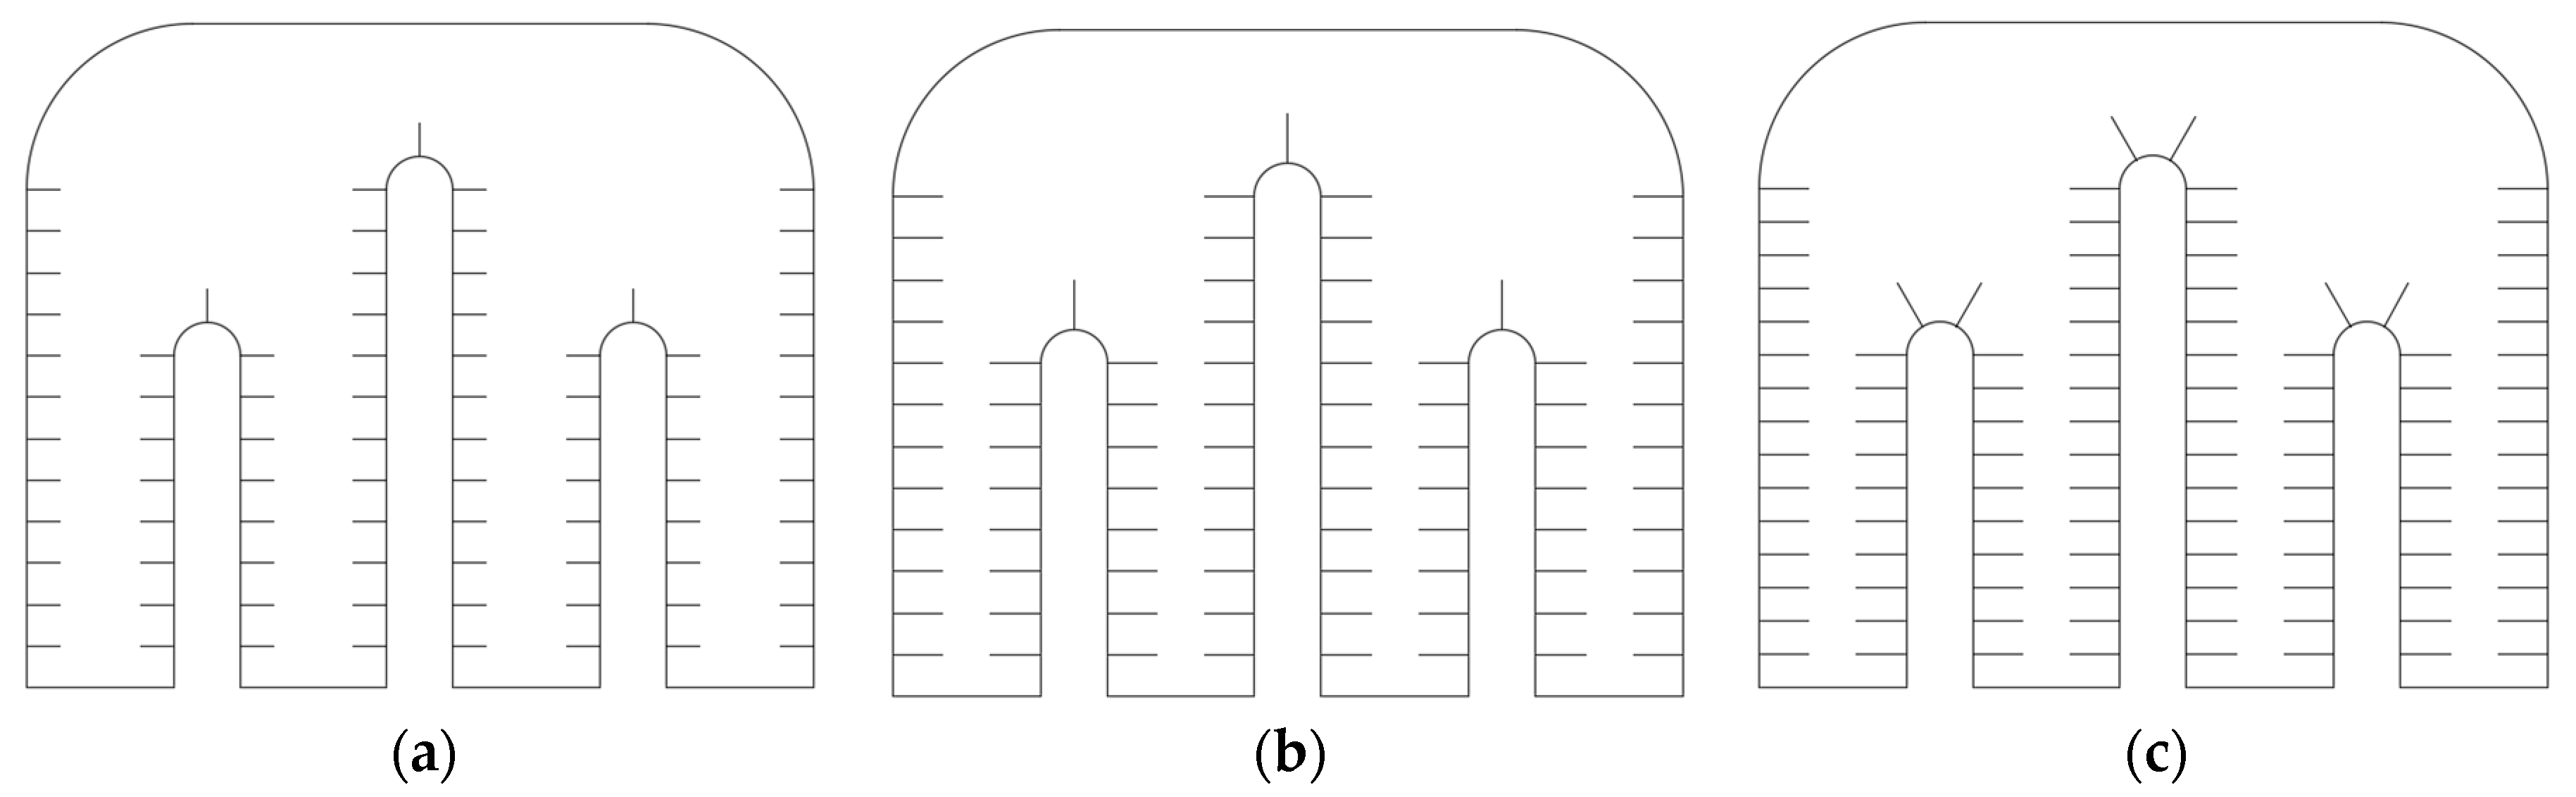
The heat transfer area of the heat accumulator plays a crucial role in heat transfer efficiency, and enhancing heat transfer can be achieved by increasing the heat transfer area. To explore this, three different conditions of adding fins are designed in this paper, as illustrated in Figure 12. The parameters for the three finned conditions are presented in Table 2. These designs aim to improve heat transfer effectiveness and optimize the performance of the heat accumulator.

Figure 12.
Two-dimensional model after adding fins. (a) Condition 1; (b) Condition 2; (c) Condition 3.
Table 2.
Fin arrangement Condition.
4.2. Calculation Method
In this study, simulations are conducted using different proportions of expanded graphite [27,28] and erythritol to create a composite heat storage material. The initial conditions, boundary conditions, setup, and mesh for the calculations remain unchanged throughout the simulations. The volume ratio of the two materials mixed is calculated linearly based on the following formula to determine the appropriate proportions for the composite material.
where x is the volume fraction of expanded graphite in the composite and y is the density value or specific heat value. They are taken as 0.071, 0.123, and 0.152 respectively (Table 3).
Table 3.
Thermal properties of expanded graphite.
5. Simulation Results and Discussion
5.1. Simulation Analysis of Different Finning Conditions
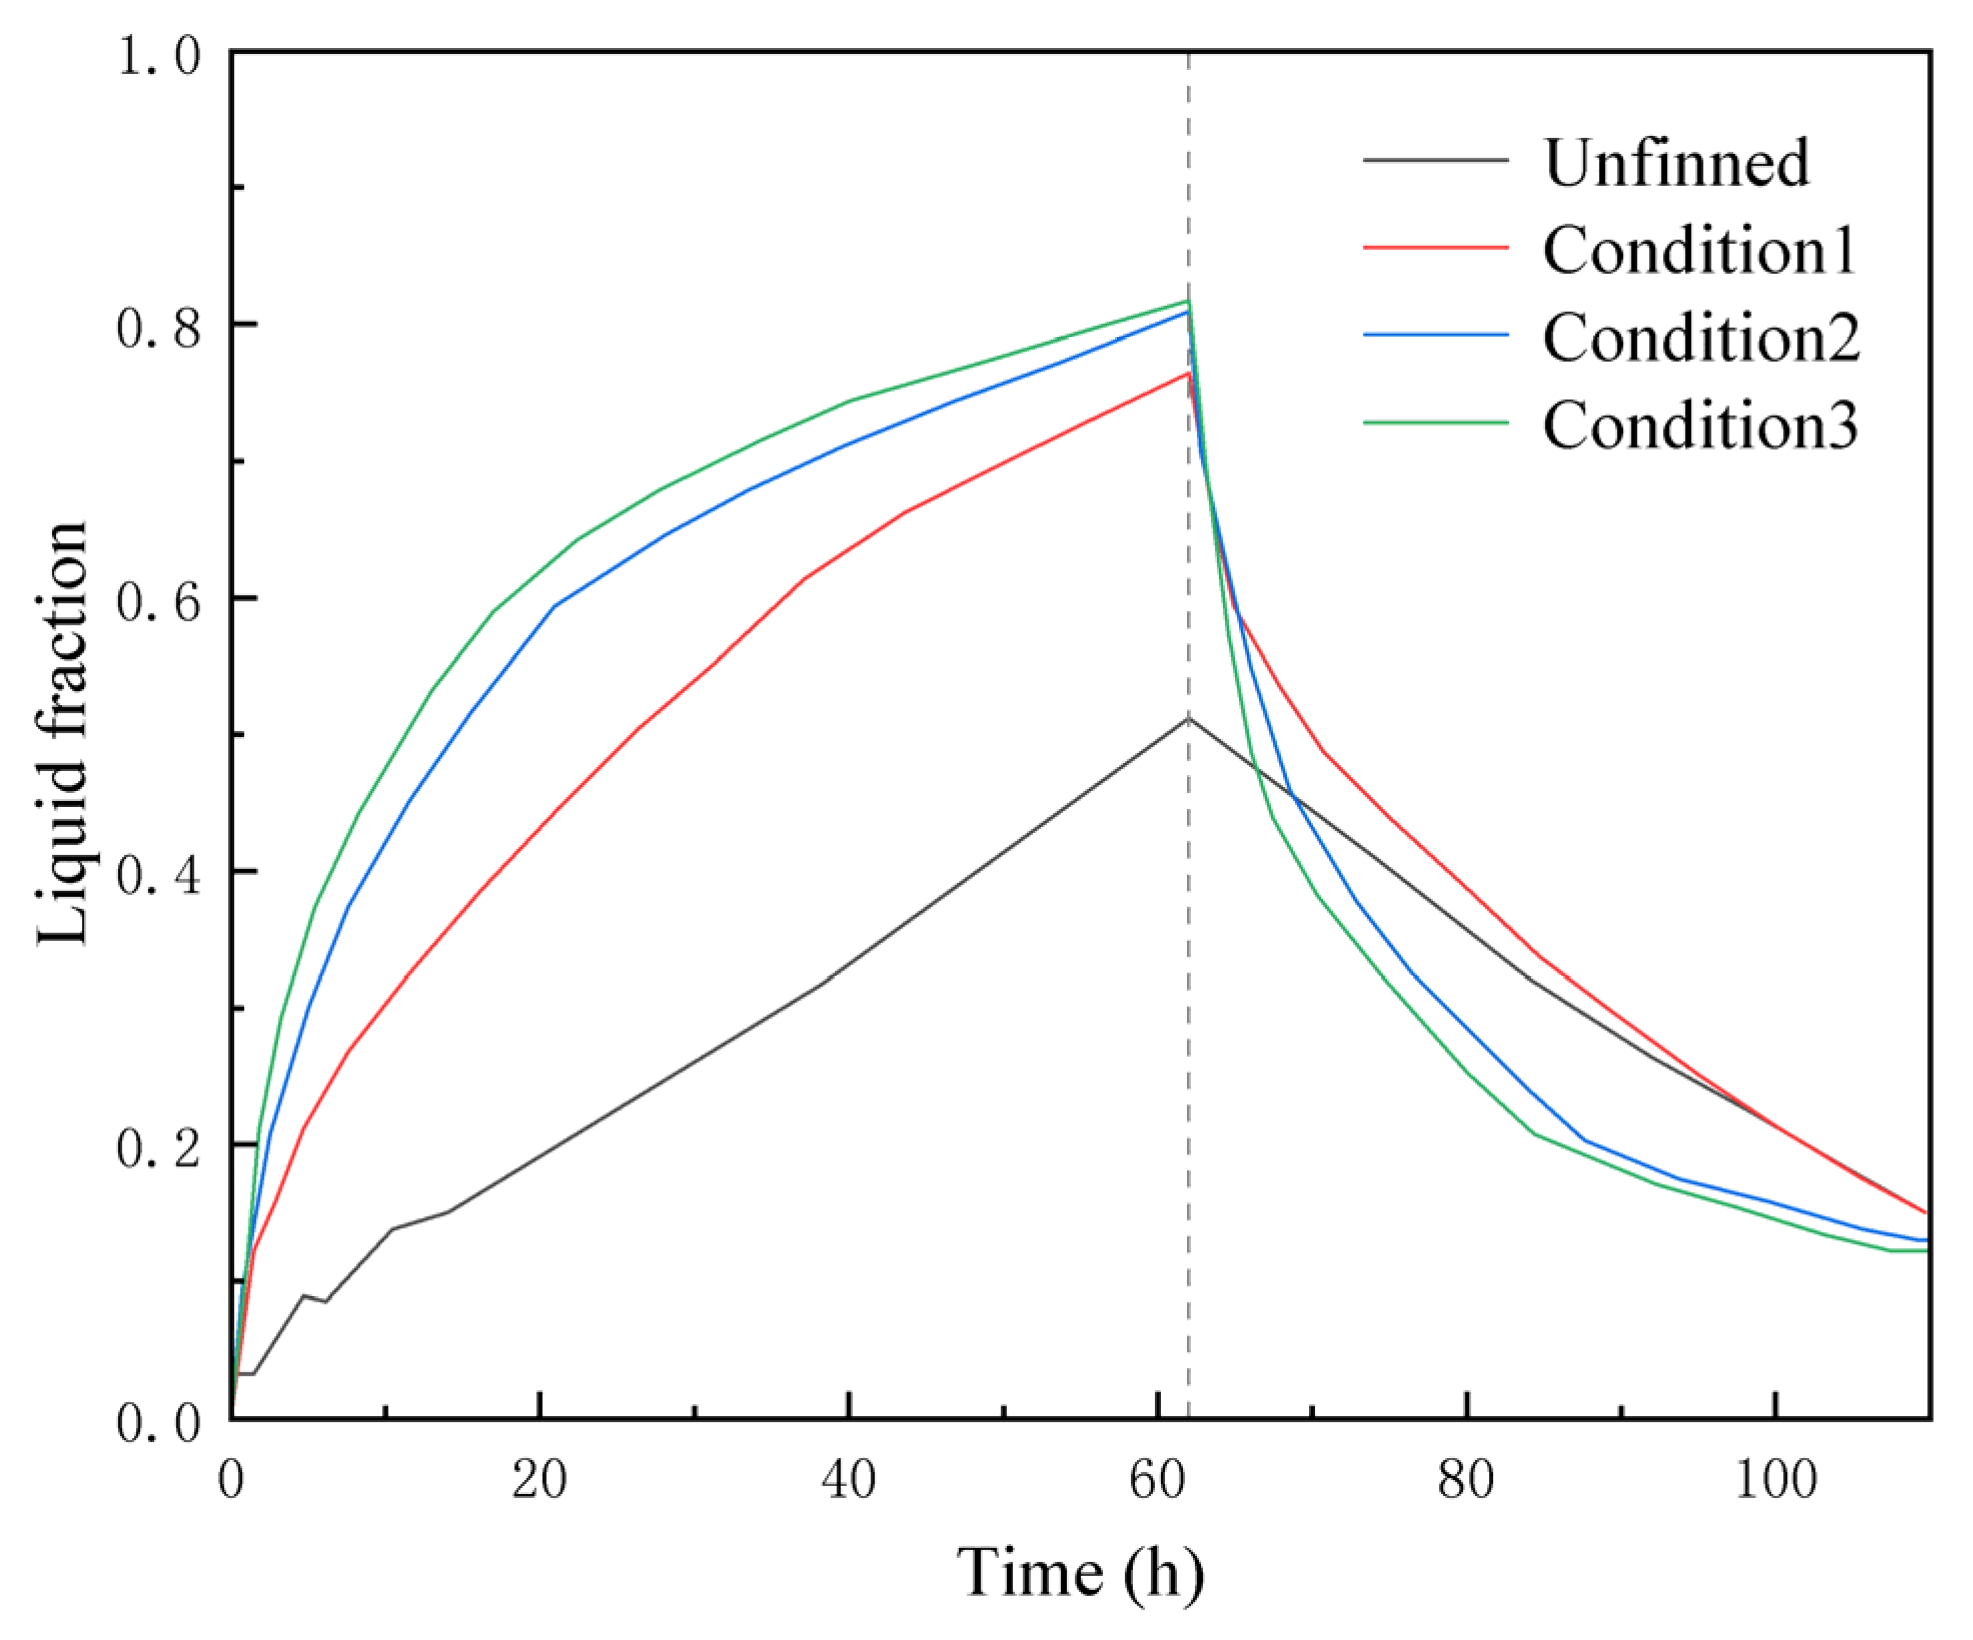
Figure 13 illustrates the percentage of melting and solidification of the heat storage material inside the heat accumulator over time under different scenarios. The dotted line in the figure is the 62-h scale of heat charging and represents the dividing line between the heat storage stage and the exothermic stage. The same is true for the dotted line in the figure below. It is manifestly evident that an augmentation in the surface area of the fins yields a pronounced escalation in the quantum of heat storage and concurrent heat dissipation achieved within an equivalent temporal interval. As the process continues, the effect of fin reinforcement gradually diminishes. After heating for approximately 50 h, the rate of liquid compared to the rate of change over time stabilizes and becomes almost equal. Subsequently, the heat transfer process primarily relies on natural convection and thermal conduction to heat the remaining unmelted portion of the material (Figure 14 and Figure 15).

Figure 13.
Liquid phase rate changes for three scenarios.

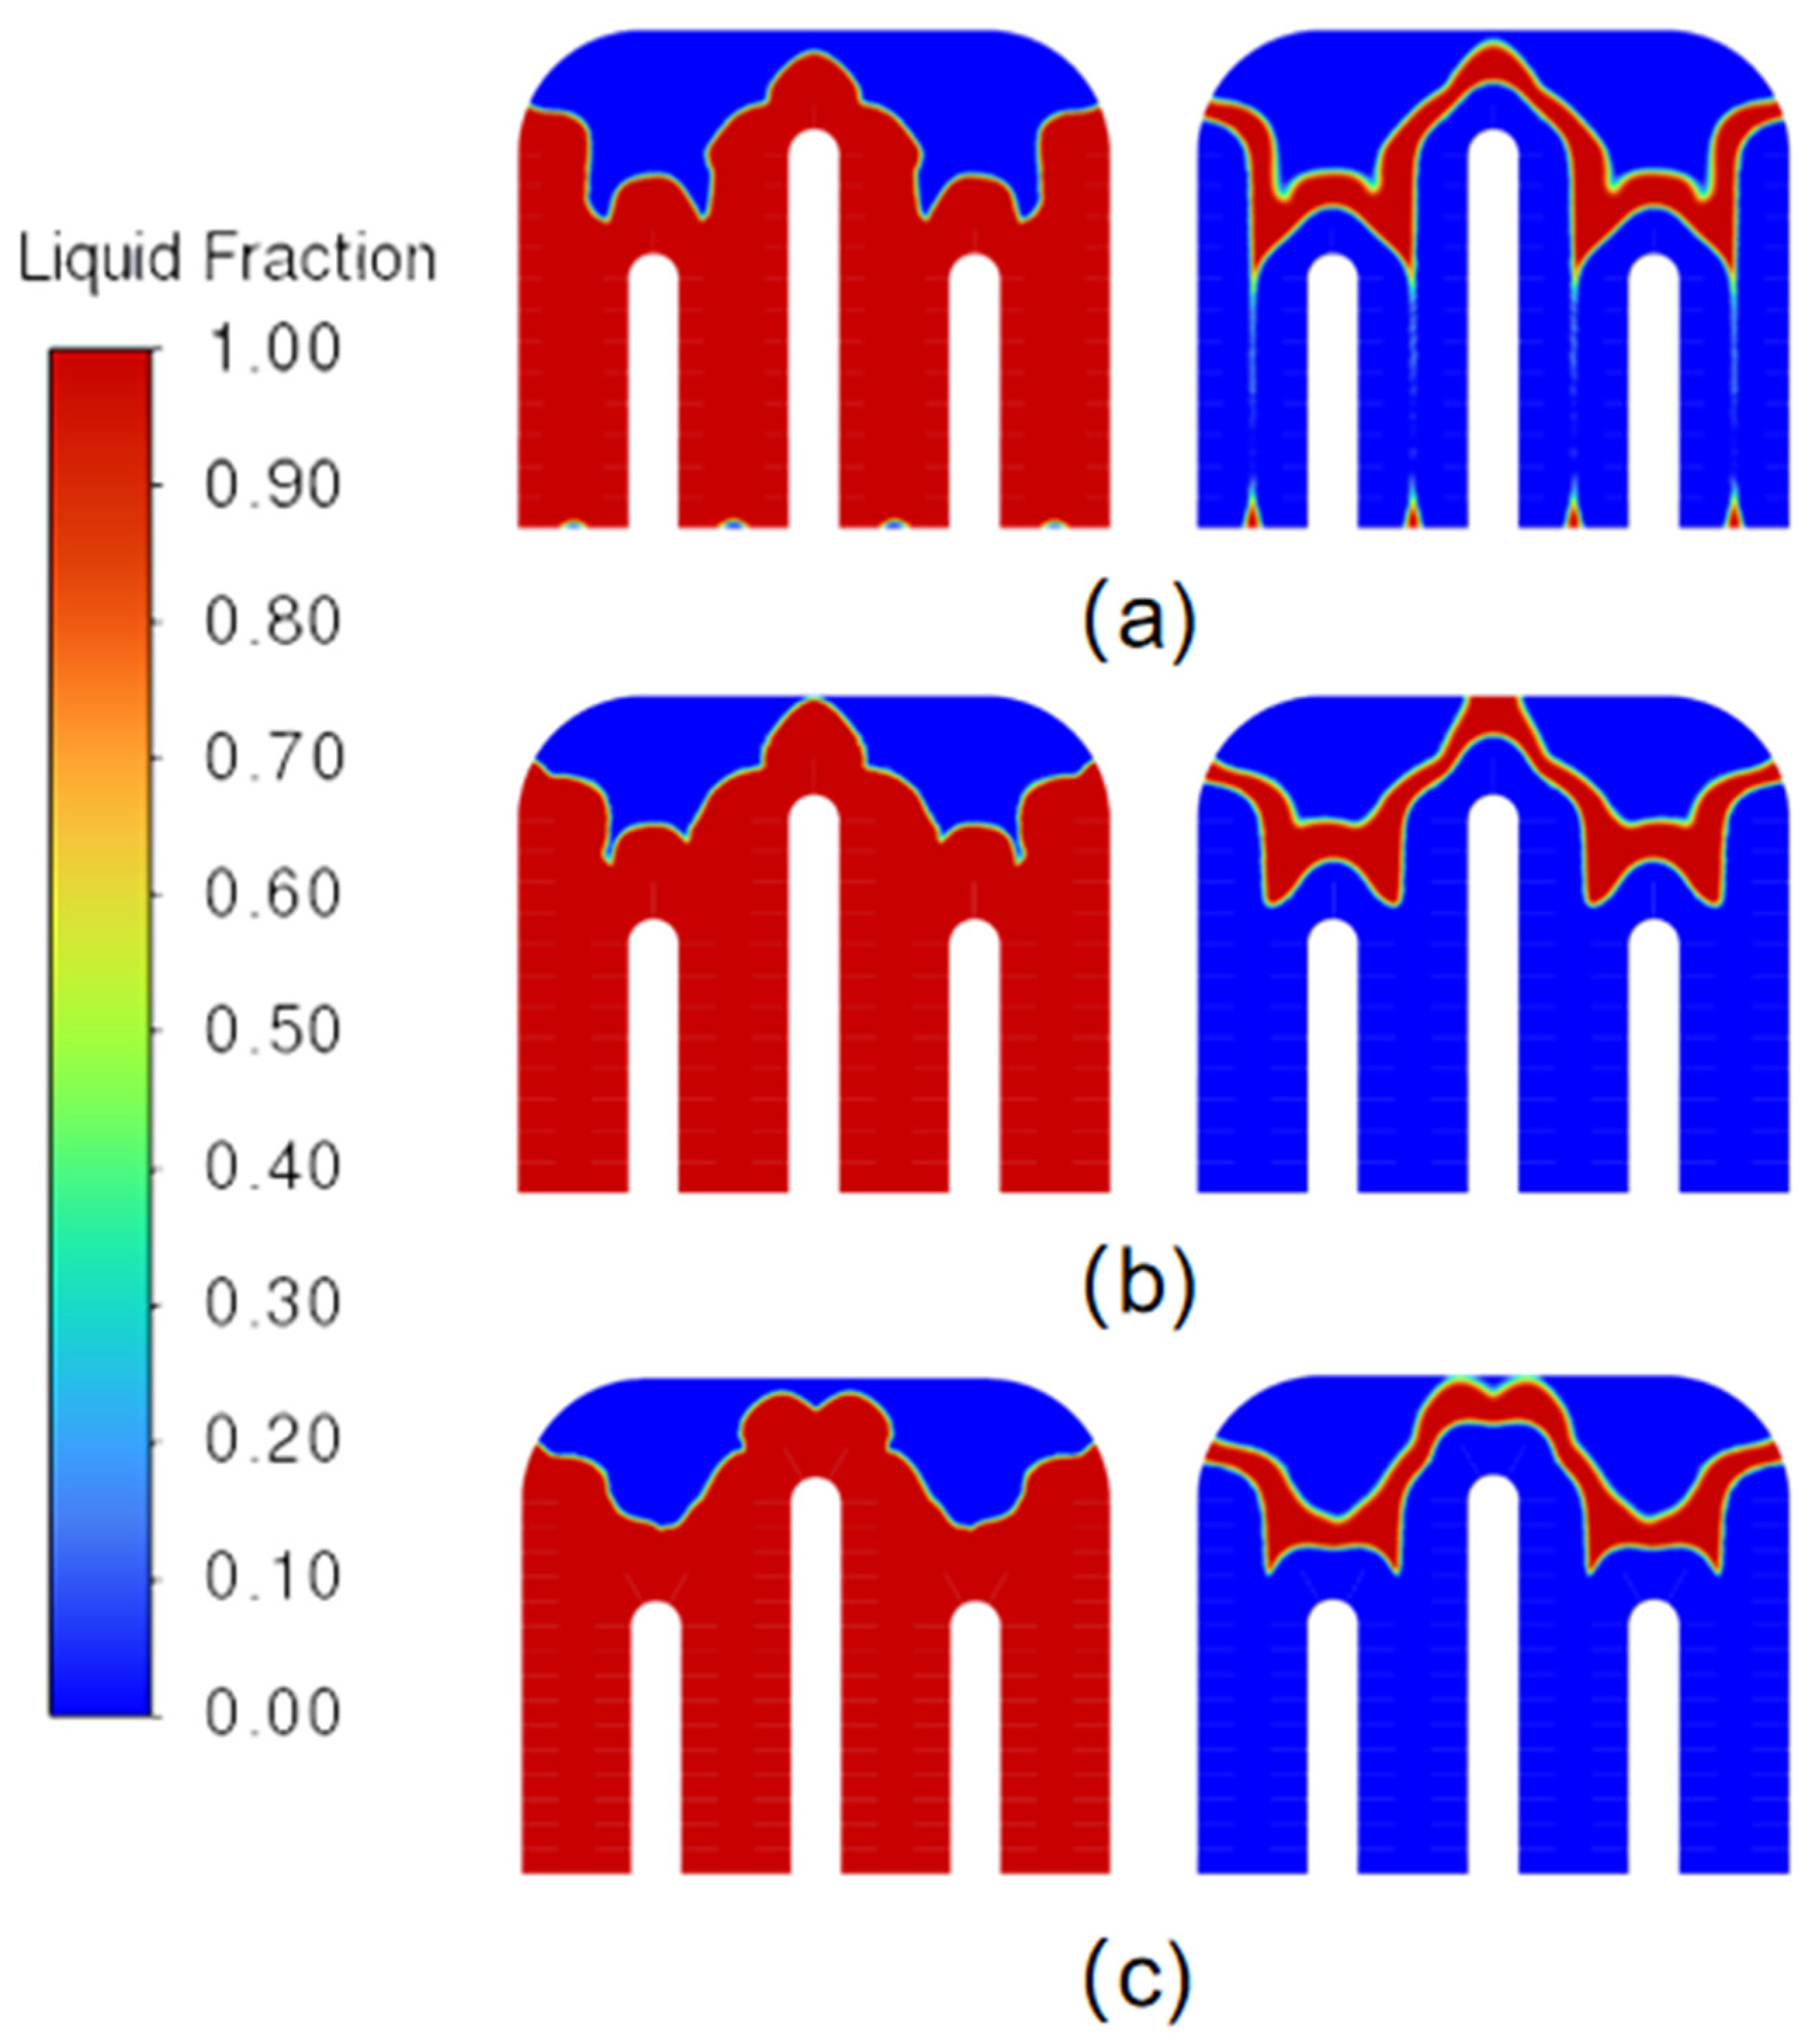
Figure 14.
(a) Phase-transition diagrams for 62 h of heat storage (left) and 48 h of exothermic heat release (right) for Condition 1; (b) Phase-transition diagrams for 62 h of heat storage (left) and 48 h of exothermic heat release (right) for Condition 2; (c) Phase-transition diagrams for 62 h of heat storage (left) and 48 h of exothermic heat release (right) for Condition 3.

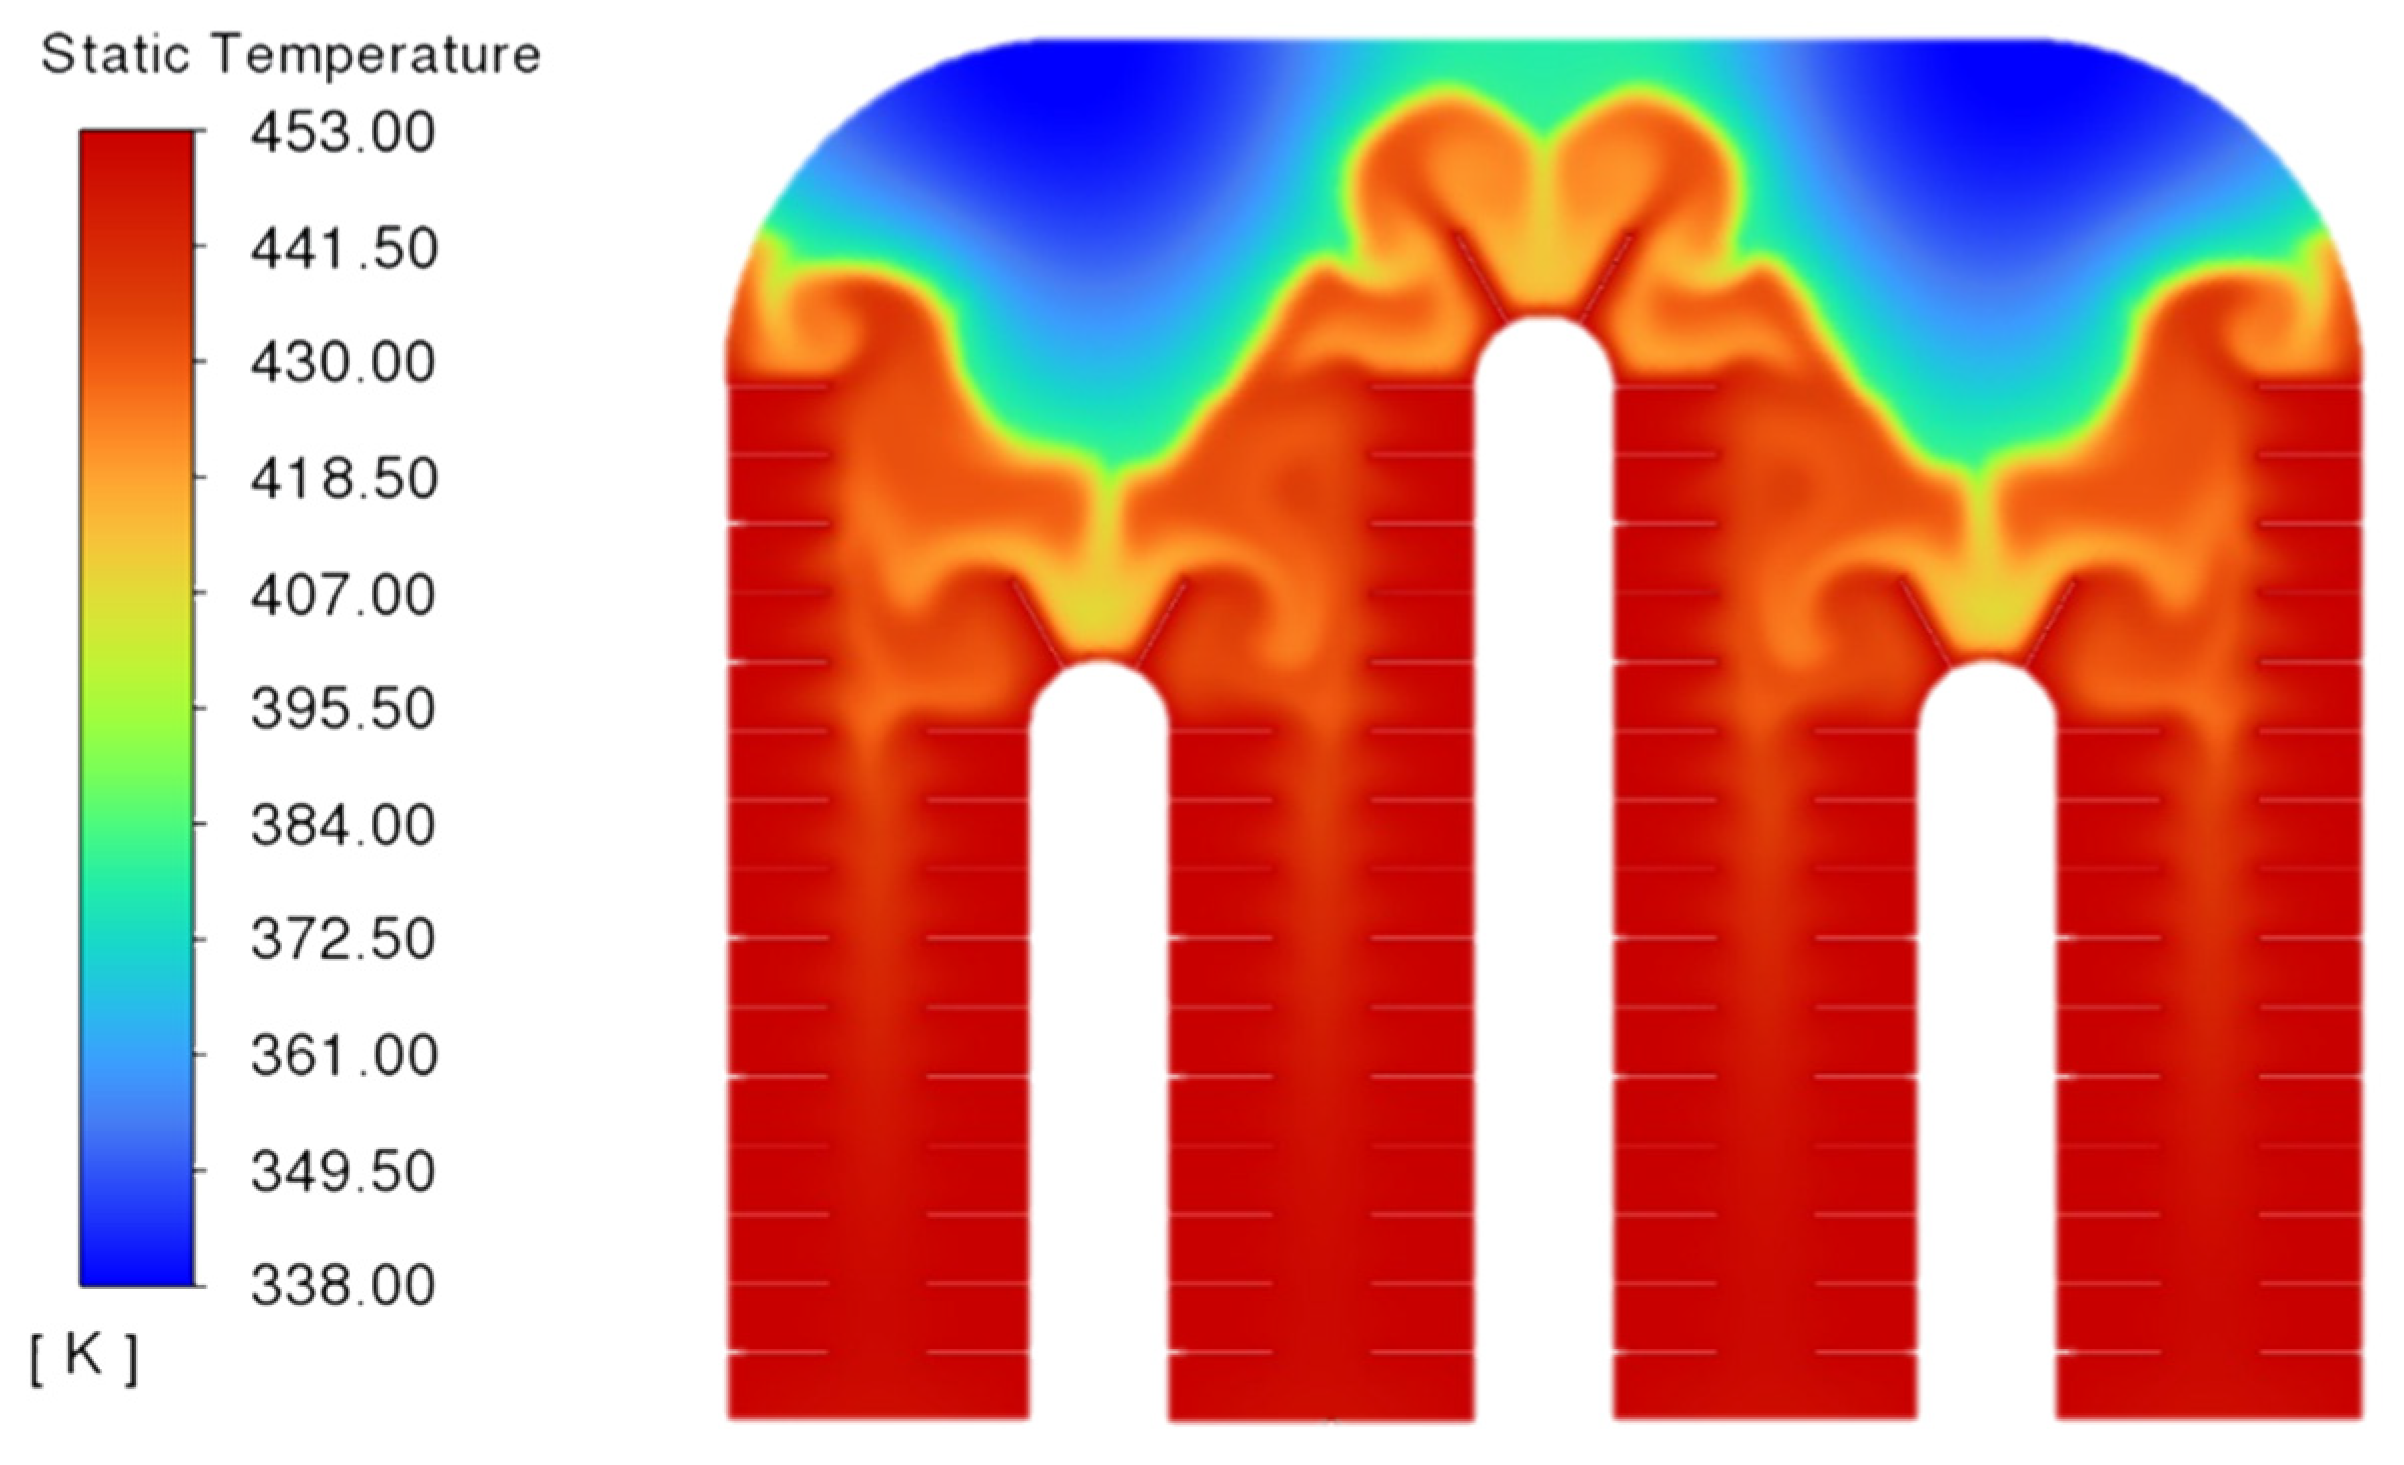
Figure 15.
Temperature distribution after 62 h of thermal storage for Scenario 3.
Indeed, when comparing the enhancement of Condition 2 over Condition 1, it is clear that the enhancement of Condition 3 over Condition 2 is not as significant, only about half of the former. This phenomenon can be partially ascribed to the relatively modest augmentation in the heat transfer area observed under Condition 3. Furthermore, the influence of heat transfer on the model has already undergone attenuation owing to the expanded heat transfer area encountered in Condition 2. If we were to further increase the number or height of fins beyond Condition 3, it is expected that the enhancement of heat transfer would continue to decrease. There is a limit to the benefits gained from increasing the number or height of fins, and excessive fins may lead to complex designs that obstruct the natural flow of the melted phase-change material. Moreover, adding too many fins would increase the ineffective counterweight of the box, reducing its efficiency and increasing overall cost.
Based on the findings of this paper, it can be concluded that the structure of the heat accumulator as determined in Condition 3 is the optimal design for the modular mobile heating system box. This configuration strikes a balance between heat transfer enhancement and practicality, making it the most suitable option for the modular design of the mobile heating system box, as explored in this study.
5.2. Comparative Analysis of Composite Materials
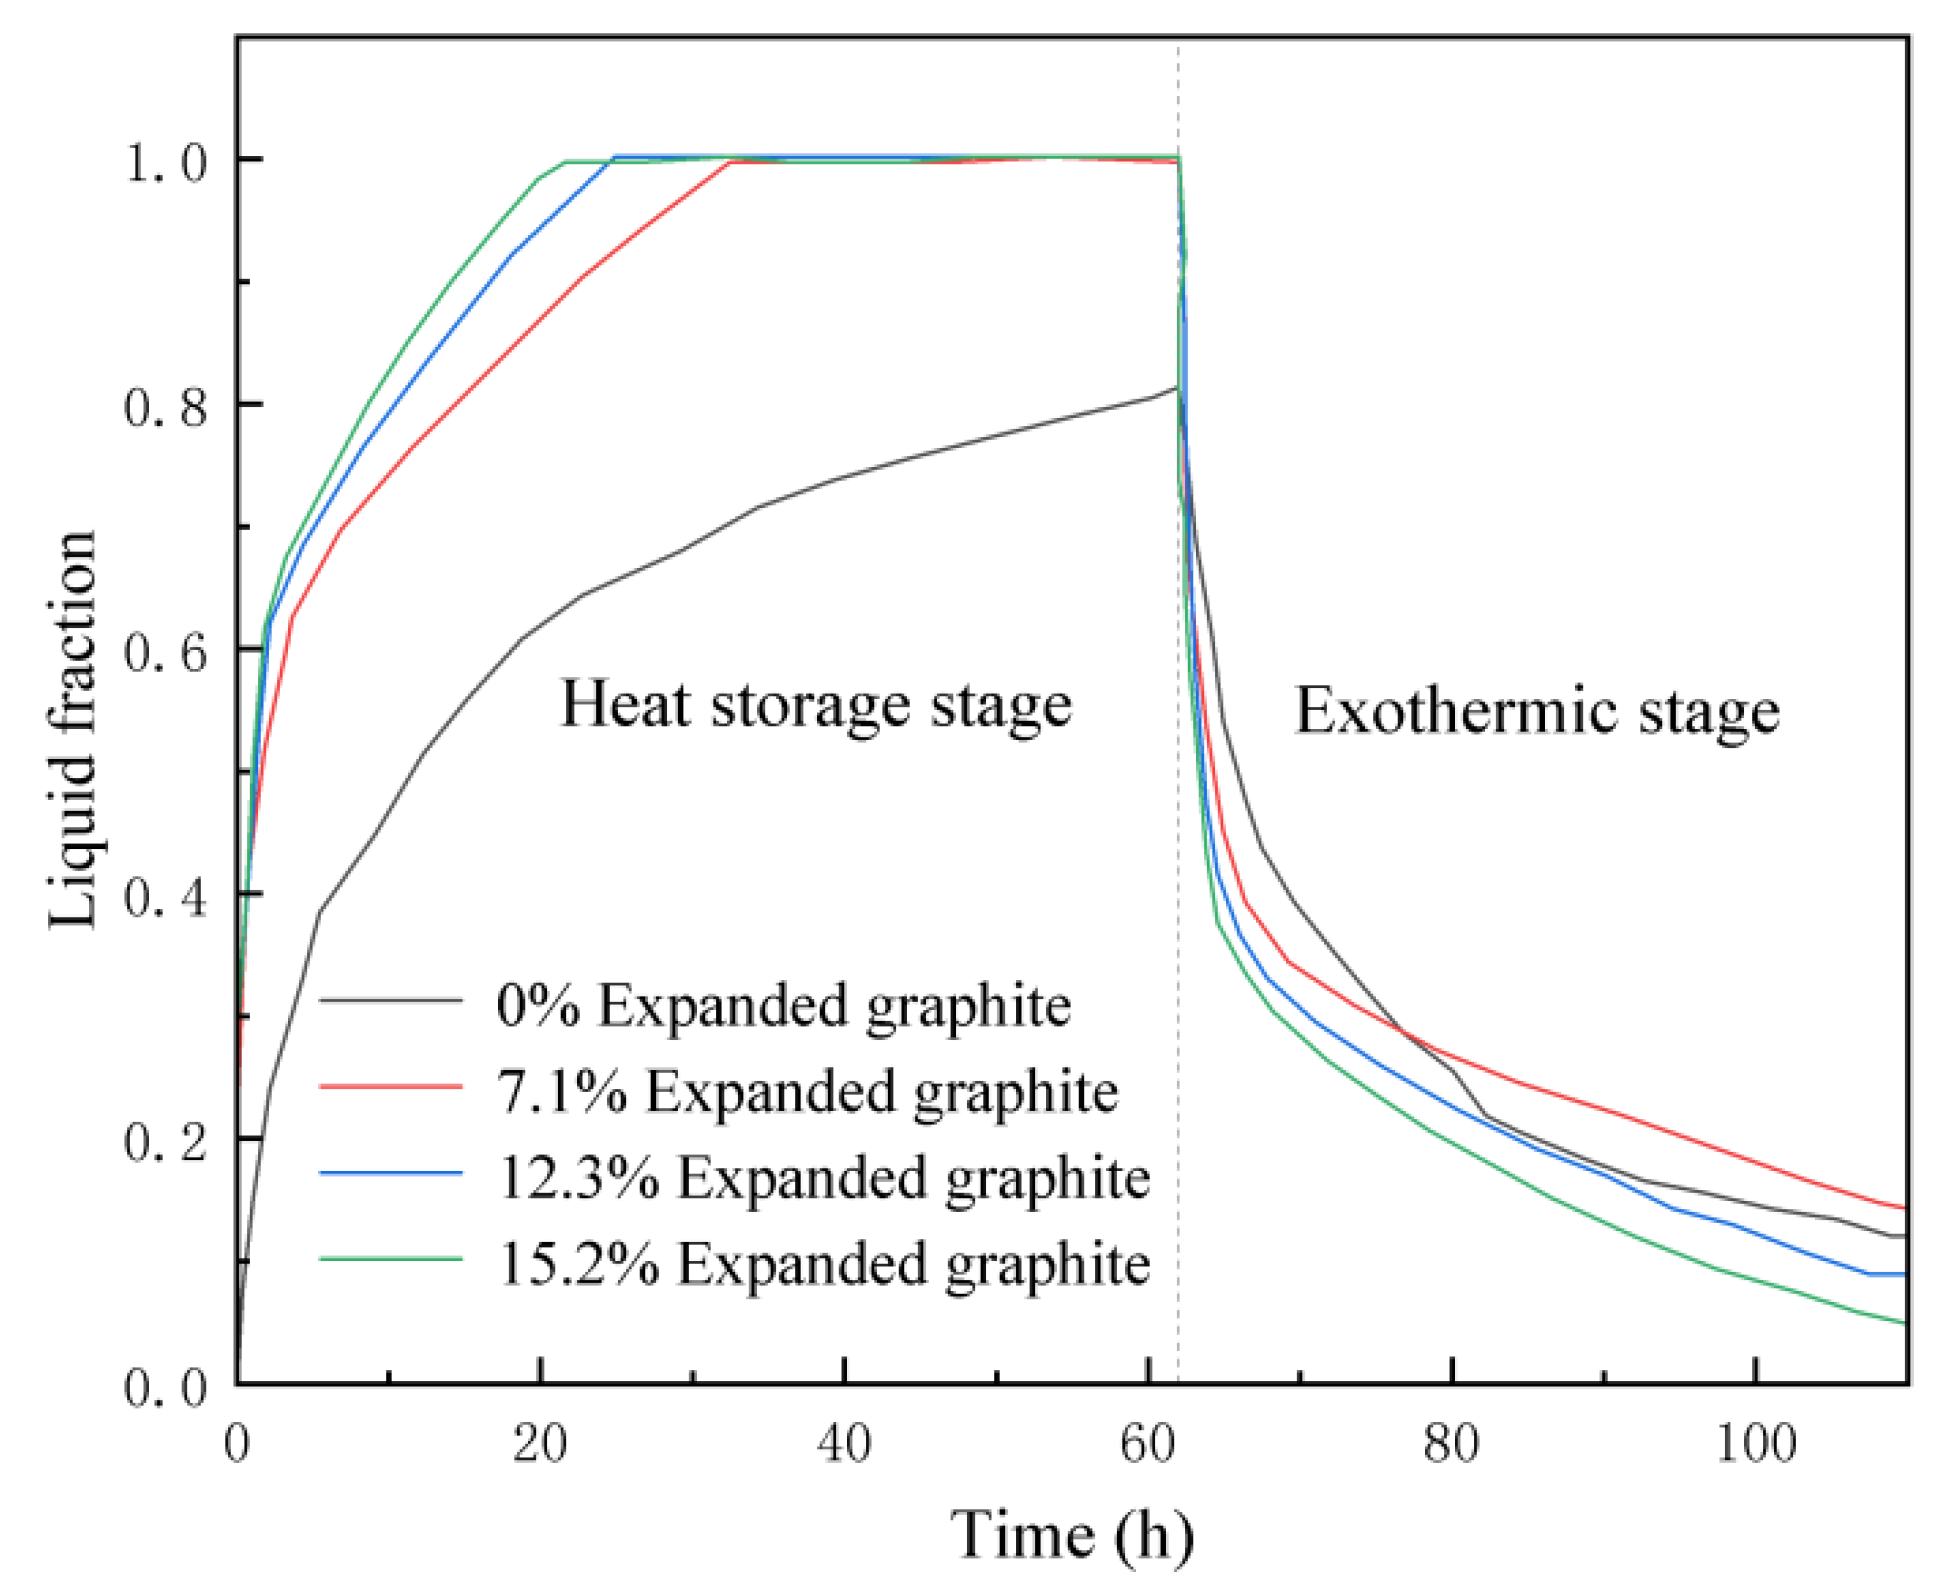
Figure 16 shows the variation of the liquid phase rate with time after adding different proportions of expanded graphite.

Figure 16.
Change in liquid ratio after mixing different ratios.
Based on the description of Figure 16, it is evident that adding expanded graphite with a volume fraction of 15.2% results in the fastest melting during the heat storage stage, taking 21.75 h to melt completely. Additionally, after adding expanded graphite, the heat storage material’s melting up to 75% occurs in less than 15 h, with the fastest melting taking only 6.75 h. This remarkable reduction in the time required for heat storage, down to nearly 10% of the original time, indicates a significant improvement in heat storage efficiency. In the exothermic stage, the final liquid phase rate of the heat storage material shows only a small difference of about 10% among the four different conditions. However, the critical observation is that the addition of expanded graphite allows for the exothermic process to start at a 75% liquid phase rate, meaning that it can release 25% more latent heat in the same period of time compared to the scenario without expanded graphite.
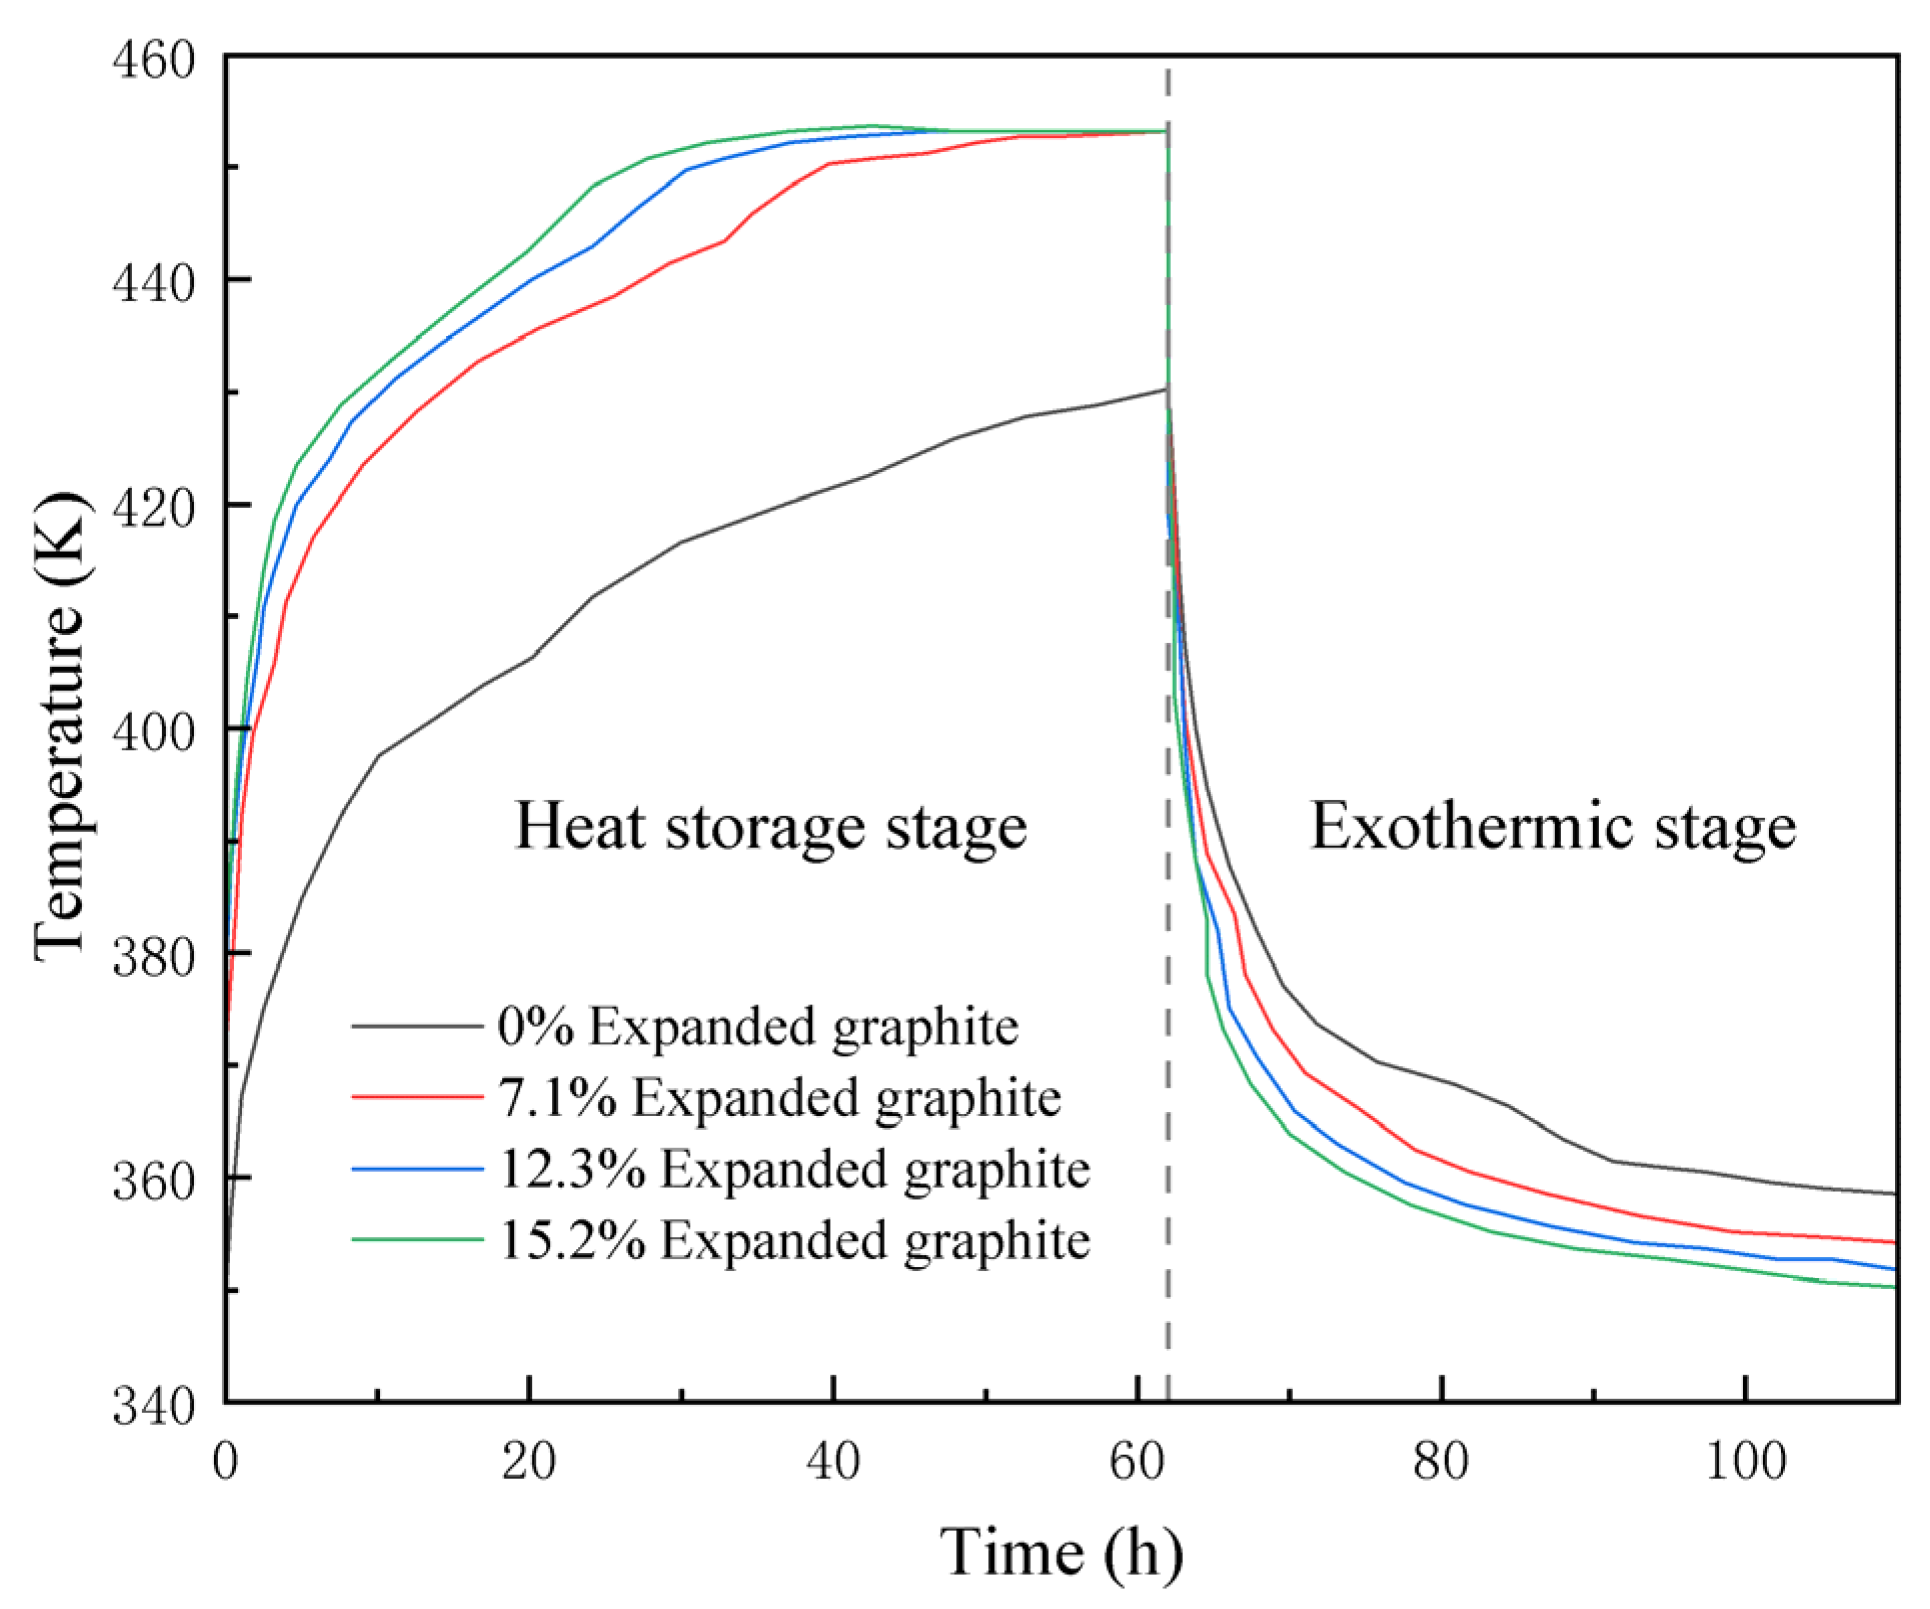
Figure 17, on the other hand, displays the variation of the average temperature on the plane of the modular heat accumulator with time for different ratios of expanded graphite. This temperature distribution is essential in understanding how heat is distributed and utilized within the heat accumulator during the simulation when different proportions of expanded graphite are added to the composite phase-change material.

Figure 17.
Mean surface temperatures for different ratios of expanded graphite.
From the analysis of Figure 17, it is observed that without the addition of expanded graphite, the average temperature of the heat storage area in the heat accumulator after 62 h is around 420 K, representing an increase of approximately 82 K compared to before the heat enhancement. Utilizing the specific heat capacity of erythritol at 20 °C (1.35 KJ/kg), conservative calculations show that a single modular heat accumulator at this time can achieve a sensible heat storage capacity of about 0.71 GJ, which is equivalent to approximately 33% of its stored latent heat. In contrast, when expanded graphite is added, as under the three different conditions, the heat storage can reach the heat source temperature of 453 K in about 30 h, which raises the temperature of the entire modular heat accumulator by 115 K. Using the same algorithm, a single modular heat accumulator can achieve a sensible heat storage capacity of about 0.99 GJ, which is a 50% increase in the sensible heat storage compared to the previous scenario without graphite expansion.
When comparing horizontally, with the addition of 12.3% of expanded graphite, the heat storage within the modular heat accumulator is completed after 26 h, and the average temperature of the heat storage material is 443.5 K. In this period, there is a temperature change of 104.5 K. It is estimated that the sensible heat storage capacity is about 0.9 GJ, accounting for approximately 40.9% of the single modular accumulator’s stored latent heat. This demonstrates the considerable impact of expanded graphite addition on enhancing the sensible heat storage capacity of the heat accumulator.
Table 4 clearly shows that the addition of expanded graphite significantly improves the phase-transition rate of the heat storage material when it is used as the main medium in combination with erythritol. However, it is essential to strike a balance between heat storage time and capacity by carefully controlling the amount of expanded graphite added, as an excessive amount may adversely affect heat storage efficiency.
Table 4.
Model operation under different operating conditions.
Taking into account the cost of expanded graphite, the processing time for fins, and the heat storage efficiency, the optimal operating condition for the modular heat accumulator in the new mobile heating system is as follows: a fin height of 12 cm, a fin spacing of 8 cm, and a 12.3% addition of expanded graphite. Under this condition, the heat storage material inside the heat storage box is completely melted after 25 h, and it reaches 75% melting in just 8 h, reducing the heat storage time by an impressive 87.1%. Concurrently, the exothermic efficiency in the same time (calculated by the latent heat released) increases by 50.2%. These improvements demonstrate the remarkable impact of the proposed operating condition on the heat storage and exothermic performance of the modular heat accumulator in the mobile heating system.
6. Conclusions
In order to meet the demands of the M-TES system, prior investigations have delved into the amalgamation of diverse PCMs and scrutinized the repercussions of both the quantity and installation methodology of fins on the efficacy of heat charging and discharging. Nevertheless, scholarly attention has been notably scant with regard to the modularization aspect of M-TES and the adoption of composite PCMs, exemplified by the combination of erythritol and expanded graphite. Therefore, this paper focuses on investigating a modular M-TES system employing different fin configurations and composite phase-change materials through numerical simulations. The findings of this research are summarized as follows.
- (1)
- The proposed new mobile heating system thermal storage box addresses the issue of uneven temperature distribution in traditional thermal storage boxes. The modular design optimizes the arrangement of heat accumulators, reducing the problem of uncoordinated heat storage in the length direction. The modular thermal storage box can be easily installed and uninstalled using a crane, making heat distribution more flexible and efficient.
- (2)
- The original model was optimized by introducing fins and subjected to numerical simulations to obtain model parameters under various operating conditions. The optimal solution resulted in a 30.7% increase in heat storage over 62 h and an 11.2% reduction in exothermic heat release over 48 h when compared to the no-fin condition. In contrast to the significant improvement observed between condition 1 and condition 2, the enhancement seen in condition 3 over condition 2 is less pronounced, accounting for only about half of the former’s improvement. It is noteworthy that continuing to increase the number of fins or their height further diminishes the heat transfer enhancement. This effect is compounded by the fact that excessive fins complicate the design, disrupt the natural flow of the melted phase-change material, increase the nonproductive weight of the container, and reduce the overall efficiency of the box. All these factors contribute to increased operational costs.
- (3)
- The combination of expanded graphite and erythritol in different proportions as a composite heat storage material shows promising results. By adding 12.3% expanded graphite, the complete heat storage time is reduced from 62 h to 26 h, achieving a 50% improvement in heat charging efficiency.
Author Contributions
Conceptualization, Z.K.; Methodology, Z.K.; Software, R.T.; Validation, R.T.; Formal analysis, R.T.; Investigation, W.Z.; Resources, W.Z.; Data curation, W.Z.; Writing—original draft, Z.K.; Visualization, S.L.; Supervision, S.L.; Project administration, Z.Q.; Funding acquisition, Z.Q. All authors have read and agreed to the published version of the manuscript.
Funding
This work is finically supported by the Academic Degrees & Graduate Education Reform Project of Henan Province (No. 2021SJGLX012Y, No. 2021SJGLX155).
Institutional Review Board Statement
Not applicable.
Informed Consent Statement
Not applicable.
Data Availability Statement
Not applicable.
Conflicts of Interest
The authors declare no conflict of interest.
References
- Guo, S.; Liu, Q.; Zhao, J.; Jin, G.; Wu, W.; Yan, J.; Li, H.; Jin, H. Mobilized thermal energy storage: Materials, containers and economic evaluation. Energy Convers. Manag. 2018, 177, 315–329. [Google Scholar] [CrossRef]
- Diarce, G.; Gandarias, I.; Campos-Celador, A.; García-Romero, A.; Griesser, U. Eutectic mixtures of sugar alcohols for thermal energy storage in the 50–90 C temperature range. Sol. Energy Mater. Sol. Cells 2015, 134, 215–226. [Google Scholar] [CrossRef]
- Höhlein, S.; König-Haagen, A.; Brüggemann, D. Thermophysical characterization of MgCl2· 6H2O, xylitol and erythritol as phase change materials (PCM) for latent heat thermal energy storage (LHTES). Materials 2017, 10, 444. [Google Scholar] [CrossRef]
- Peiró, G.; Gasia, J.; Miró, L.; Cabeza, L.F. Experimental evaluation at pilot plant scale of multiple PCMs (cascaded) vs. single PCM configuration for thermal energy storage. Renew. Energy 2015, 83, 729–736. [Google Scholar] [CrossRef]
- Kumar, Y.A.; Kim, H.-J. Effect of time on a hierarchical corn skeleton-like composite of CoO@ ZnO as capacitive electrode material for high specific performance supercapacitors. Energies 2018, 11, 3285. [Google Scholar] [CrossRef]
- Moniruzzaman, M.; Anil Kumar, Y.; Pallavolu, M.R.; Arbi, H.M.; Alzahmi, S.; Obaidat, I.M. Two-dimensional core-shell structure of cobalt-doped@ MnO2 nanosheets grown on nickel foam as a binder-free battery-type electrode for supercapacitor application. Nanomaterials 2022, 12, 3187. [Google Scholar] [CrossRef]
- Kaizawa, A.; Kamano, H.; Kawai, A.; Jozuka, T.; Senda, T.; Maruoka, N.; Akiyama, T. Thermal and flow behaviors in heat transportation container using phase change material. Energy Convers. Manag. 2008, 49, 698–706. [Google Scholar] [CrossRef]
- Wang, W.; Guo, S.; Li, H.; Yan, J.; Zhao, J.; Li, X.; Ding, J. Experimental study on the direct/indirect contact energy storage container in mobilized thermal energy system (M-TES). Appl. Energy 2014, 119, 181–189. [Google Scholar] [CrossRef]
- Wang, W.; Li, H.; Guo, S.; He, S.; Ding, J.; Yan, J.; Yang, J. Numerical simulation study on discharging process of the direct-contact phase change energy storage system. Appl. Energy 2015, 150, 61–68. [Google Scholar] [CrossRef]
- Kang, Z.; Zhou, W.; Qiu, K.; Wang, C.; Qin, Z.; Zhang, B.; Yao, Q. Numerical Simulation of an Indirect Contact Mobilized Thermal Energy Storage Container with Different Tube Bundle Layout and Fin Structure. Sustainability 2023, 15, 5511. [Google Scholar] [CrossRef]
- Li, H.; Wang, W.; Yan, J.; Dahlquist, E. Economic assessment of the mobilized thermal energy storage (M-TES) system for distributed heat supply. Appl. Energy 2013, 104, 178–186. [Google Scholar] [CrossRef]
- Krönauer, A.; Lävemann, E.; Brückner, S.; Hauer, A. Mobile sorption heat storage in industrial waste heat recovery. Energy Procedia 2015, 73, 272–280. [Google Scholar] [CrossRef]
- Kuta, M. Mobilized thermal energy storage (M-TES) system design for cooperation with geothermal energy sources. Appl. Energy 2023, 332, 120567. [Google Scholar] [CrossRef]
- Nekoonam, S.; Roshandel, R. Modeling and optimization of a multiple (cascading) phase change material solar storage system. Therm. Sci. Eng. Prog. 2021, 23, 100873. [Google Scholar] [CrossRef]
- Elfeky, K.; Li, X.; Ahmed, N.; Lu, L.; Wang, Q. Optimization of thermal performance in thermocline tank thermal energy storage system with the multilayered PCM (s) for CSP tower plants. Appl. Energy 2019, 243, 175–190. [Google Scholar] [CrossRef]
- Han, D.; Lougou, B.G.; Xu, Y.; Shuai, Y.; Huang, X. Thermal properties characterization of chloride salts/nanoparticles composite phase change material for high-temperature thermal energy storage. Appl. Energy 2020, 264, 114674. [Google Scholar] [CrossRef]
- Fragnito, A.; Bianco, N.; Iasiello, M.; Mauro, G.M.; Mongibello, L. Experimental and numerical analysis of a phase change material-based shell-and-tube heat exchanger for cold thermal energy storage. J. Energy Storage 2022, 56, 105975. [Google Scholar] [CrossRef]
- Bianco, N.; Caliano, M.; Fragnito, A.; Iasiello, M.; Mauro, G.M.; Mongibello, L. Thermal analysis of micro-encapsulated phase change material (MEPCM)-based units integrated into a commercial water tank for cold thermal energy storage. Energy 2023, 266, 126479. [Google Scholar] [CrossRef]
- Pourhemmati, S.; Hossainpour, S. Thermal improvement of the vertical plate-fin heat sink by variable fin thickness pattern and utilizing phase change material: A numerical investigation. J. Energy Storage 2023, 59, 106480. [Google Scholar] [CrossRef]
- Kheirabadi, A.C.; Groulx, D. Simulating phase change heat transfer using comsol and fluent: Effect of the mushy-zone constant. Comput. Therm. Sci. Int. J. 2015, 7, 427–440. [Google Scholar] [CrossRef]
- Shamsundar, N.; Sparrow, E. Analysis of multidimensional conduction phase change via the enthalpy model. J. Heat Trans. Aug. 1975, 97, 333–340. [Google Scholar] [CrossRef]
- Huang, R.; Wu, H.; Cheng, P. A new lattice Boltzmann model for solid–liquid phase change. Int. J. Heat Mass Transf. 2013, 59, 295–301. [Google Scholar] [CrossRef]
- Ebrahimi, A.; Kleijn, C.R.; Richardson, I.M. Sensitivity of numerical predictions to the permeability coefficient in simulations of melting and solidification using the enthalpy-porosity method. Energies 2019, 12, 4360. [Google Scholar] [CrossRef]
- Guo, S.; Zhao, J.; Li, X.; Wang, W.; Yan, J. Experimental study on waste heat recovery with an indirect mobilized thermal energy storage system. In Proceedings of the International Conference on Applied Energy, Perugia, Italy, 16–18 May 2011. [Google Scholar]
- Guo, S.; Zhao, J.; Wang, W.; Yan, J.; Jin, G.; Zhang, Z.; Gu, J.; Niu, Y. Numerical study of the improvement of an indirect contact mobilized thermal energy storage container. Appl. Energy 2016, 161, 476–486. [Google Scholar] [CrossRef]
- Kenisarin, M.M. High-temperature phase change materials for thermal energy storage. Renew. Sustain. Energy Rev. 2010, 14, 955–970. [Google Scholar] [CrossRef]
- Oya, T.; Nomura, T.; Okinaka, N.; Akiyama, T. Phase change composite based on porous nickel and erythritol. Appl. Therm. Eng. 2012, 40, 373–377. [Google Scholar] [CrossRef]
- Oya, T.; Nomura, T.; Tsubota, M.; Okinaka, N.; Akiyama, T. Thermal conductivity enhancement of erythritol as PCM by using graphite and nickel particles. Appl. Therm. Eng. 2013, 61, 825–828. [Google Scholar] [CrossRef]
- Gao, L.; Zhao, J.; An, Q.; Zhao, D.; Meng, F.; Liu, X. Experiments on thermal performance of erythritol/expanded graphite in a direct contact thermal energy storage container. Appl. Therm. Eng. 2017, 113, 858–866. [Google Scholar] [CrossRef]
Disclaimer/Publisher’s Note: The statements, opinions and data contained in all publications are solely those of the individual author(s) and contributor(s) and not of MDPI and/or the editor(s). MDPI and/or the editor(s) disclaim responsibility for any injury to people or property resulting from any ideas, methods, instructions or products referred to in the content. |
© 2023 by the authors. Licensee MDPI, Basel, Switzerland. This article is an open access article distributed under the terms and conditions of the Creative Commons Attribution (CC BY) license (https://creativecommons.org/licenses/by/4.0/).