Article

Research on Two-Stage Regulation Method for Source–Load Flexibility Transformation in Power Systems

School of Electrical Engineering, Northeast Electric Power University, Jilin 132012, China
*
Author to whom correspondence should be addressed.
Sustainability 2023, 15(18), 13918; https://doi.org/10.3390/su151813918
Submission received: 10 July 2023 / Revised: 4 September 2023 / Accepted: 12 September 2023 / Published: 19 September 2023

Abstract

:
Under the premise of continuously increasing the grid-connected capacity of new energy, the fluctuation and anti-peak shaving characteristics of wind power have always constrained the development of green power systems. Considering the characteristics of power system flexibility resources, this paper introduces a two-stage regulation approach for power systems with enhanced source–load flexibility. In the day-ahead stage, an advanced peak regulation transformation is employed, leveraging the combined heat storage device of conventional thermal power units to enhance their peak regulation capability. Additionally, the Energy Intensive Load (EIL) is integrated into the regulation system. A two-level coordinated optimization model is developed, incorporating wind power integration and dispatching power allocation, with the aim of optimizing wind power integration and achieving the optimal allocation of dispatching power. In the intra-day stage, the connection of wind plants and energy storage devices is utilized to minimize the wind power fluctuations and improve the control ability over wind power variations. Compared with traditional methods, the wind power consumption in Scenario 1 and Scenario 2 increases by 2741.1 MW/h and 2478.5 MW/h respectively. Furthermore, the inclusion of an energy storage device in the intra-day stage significantly reduces the wind power fluctuations, maintaining a stable fluctuation rate within ±1%. Therefore, this method can effectively improve the level of wind power consumption and reduce the impact of real-time fluctuations on the power system.

1. Introduction

The large-scale grid connection of wind power and the improvement of electricity load have many impacts on the stability and reliability of the power system. To address this series of challenges, more refined scheduling strategies must be proposed. The strategy enhances the economic and operational flexibility in the power system [1,2].
At present, problems such as serious wind curtailment, excess coal and electricity, and the impact of wind power fluctuations on the power system still exist, which restrict the green, low-carbon, and sustainable development of China’s power industry. The Chinese government has provided clear instructions in some documents regarding the participation of the industrial loads’ in-demand response, accelerating the promotion of electricity management policies and improving electricity management strategies [3,4].
As environmental issues continue to worsen, the demand for wind power has also increased. However, the random, volatile, and anti-peak shaving nature of wind power generation can negatively impact the reliability and security of the power system [5,6]. In the traditional dispatching approach, thermal power units primarily serve as the main energy source. With the continuous expansion of new energy grid connections, the government has implemented a series of measures aimed at enhancing the integration of renewable energy sources [7]. These measures ensure that adjustable resources can adapt their operational status according to the power system’s requirements [8], thereby enhancing the reliability and economic efficiency of the power system.
For the sake of addressing the limited peak regulation capability of thermal power units and the volatile nature of wind power, substantial research efforts have been devoted to enhancing the flexibility of generation-side resources. In [9], scholars propose a deep peak regulation transformation for traditional thermal power units to enhance their regulating capacity. In [10], a plant-level operational domain model is established, and the dispatching interval is solved using the Particle Swarm Optimization (PSO) algorithm. This optimization technique improves the operational flexibility of cogeneration devices, maximizes the utilization of renewable energy under the same heat load, and significantly reduces CO2 emissions. In [11], both a non-cooperative pricing model and a cooperative pricing model are developed. While enhancing the flexibility of thermal power and promoting the integration of wind power, it is crucial to consider the impact of wind power fluctuations on the power system. In [12], a two-level model for stabilizing the wind power fluctuations is established. Variable modulus decomposition is utilized to decompose the energy storage compensation power based on the frequency, enabling an accurate compensation power determination and enhancing the precision of wind power stabilization. In [13,14], an integrated Wind Energy Storage System (ESS) model is proposed to determine the appropriate scale of energy storage devices. The fluctuating power of wind power generation is calculated based on different energy storage device capacities, allowing for the effective adaptation to the wind power fluctuations.
The incorporation of load-side resources into the power system dispatching strategy and their interaction with the power generation side can effectively alleviate the peak load regulation pressure on thermal power units and enhance operational efficiency. Numerous studies have focused on the adjustable characteristics of load-side resources. In [15], a load control algorithm is proposed for constant temperature buildings to optimize the utilization of wind power resources within a specific region. In [16], a scheduling model for the joint operation of photovoltaic system, building system, and electric vehicle is proposed, which improves the load transfer from the daytime peak to night and improves the flexibility of the power system. However, small-capacity flexible loads have limitations in regulating large-scale and high-penetration wind power. Conversely, the EIL as a representative of flexible load resources exhibits significant power consumption, adjustable power output, and high flexibility [17,18], making it more manageable compared to other loads. This paper conducts research on improving the flexibility of the EIL, fully tapping into the regulatory capacity of the EIL while meeting the economic requirements of the EIL. Strengthening the interaction with the source side via the EIL is beneficial for compensating for the insufficient peak shaving capacity of thermal power units [19]. In [20], the EIL is introduced into the carbon emission market, along with the self-generation (SG) and load-scheduling models. The study also considers carbon emission permits and time-of-use (TOU) electricity tariffs to optimize the economic and environmental benefits. In [21], according to the adjustable capacity of the virtual power plant, the author establishes the auxiliary service market optimization model, classifies the power of the EIL, and gives full play to the regulation ability of the EIL.
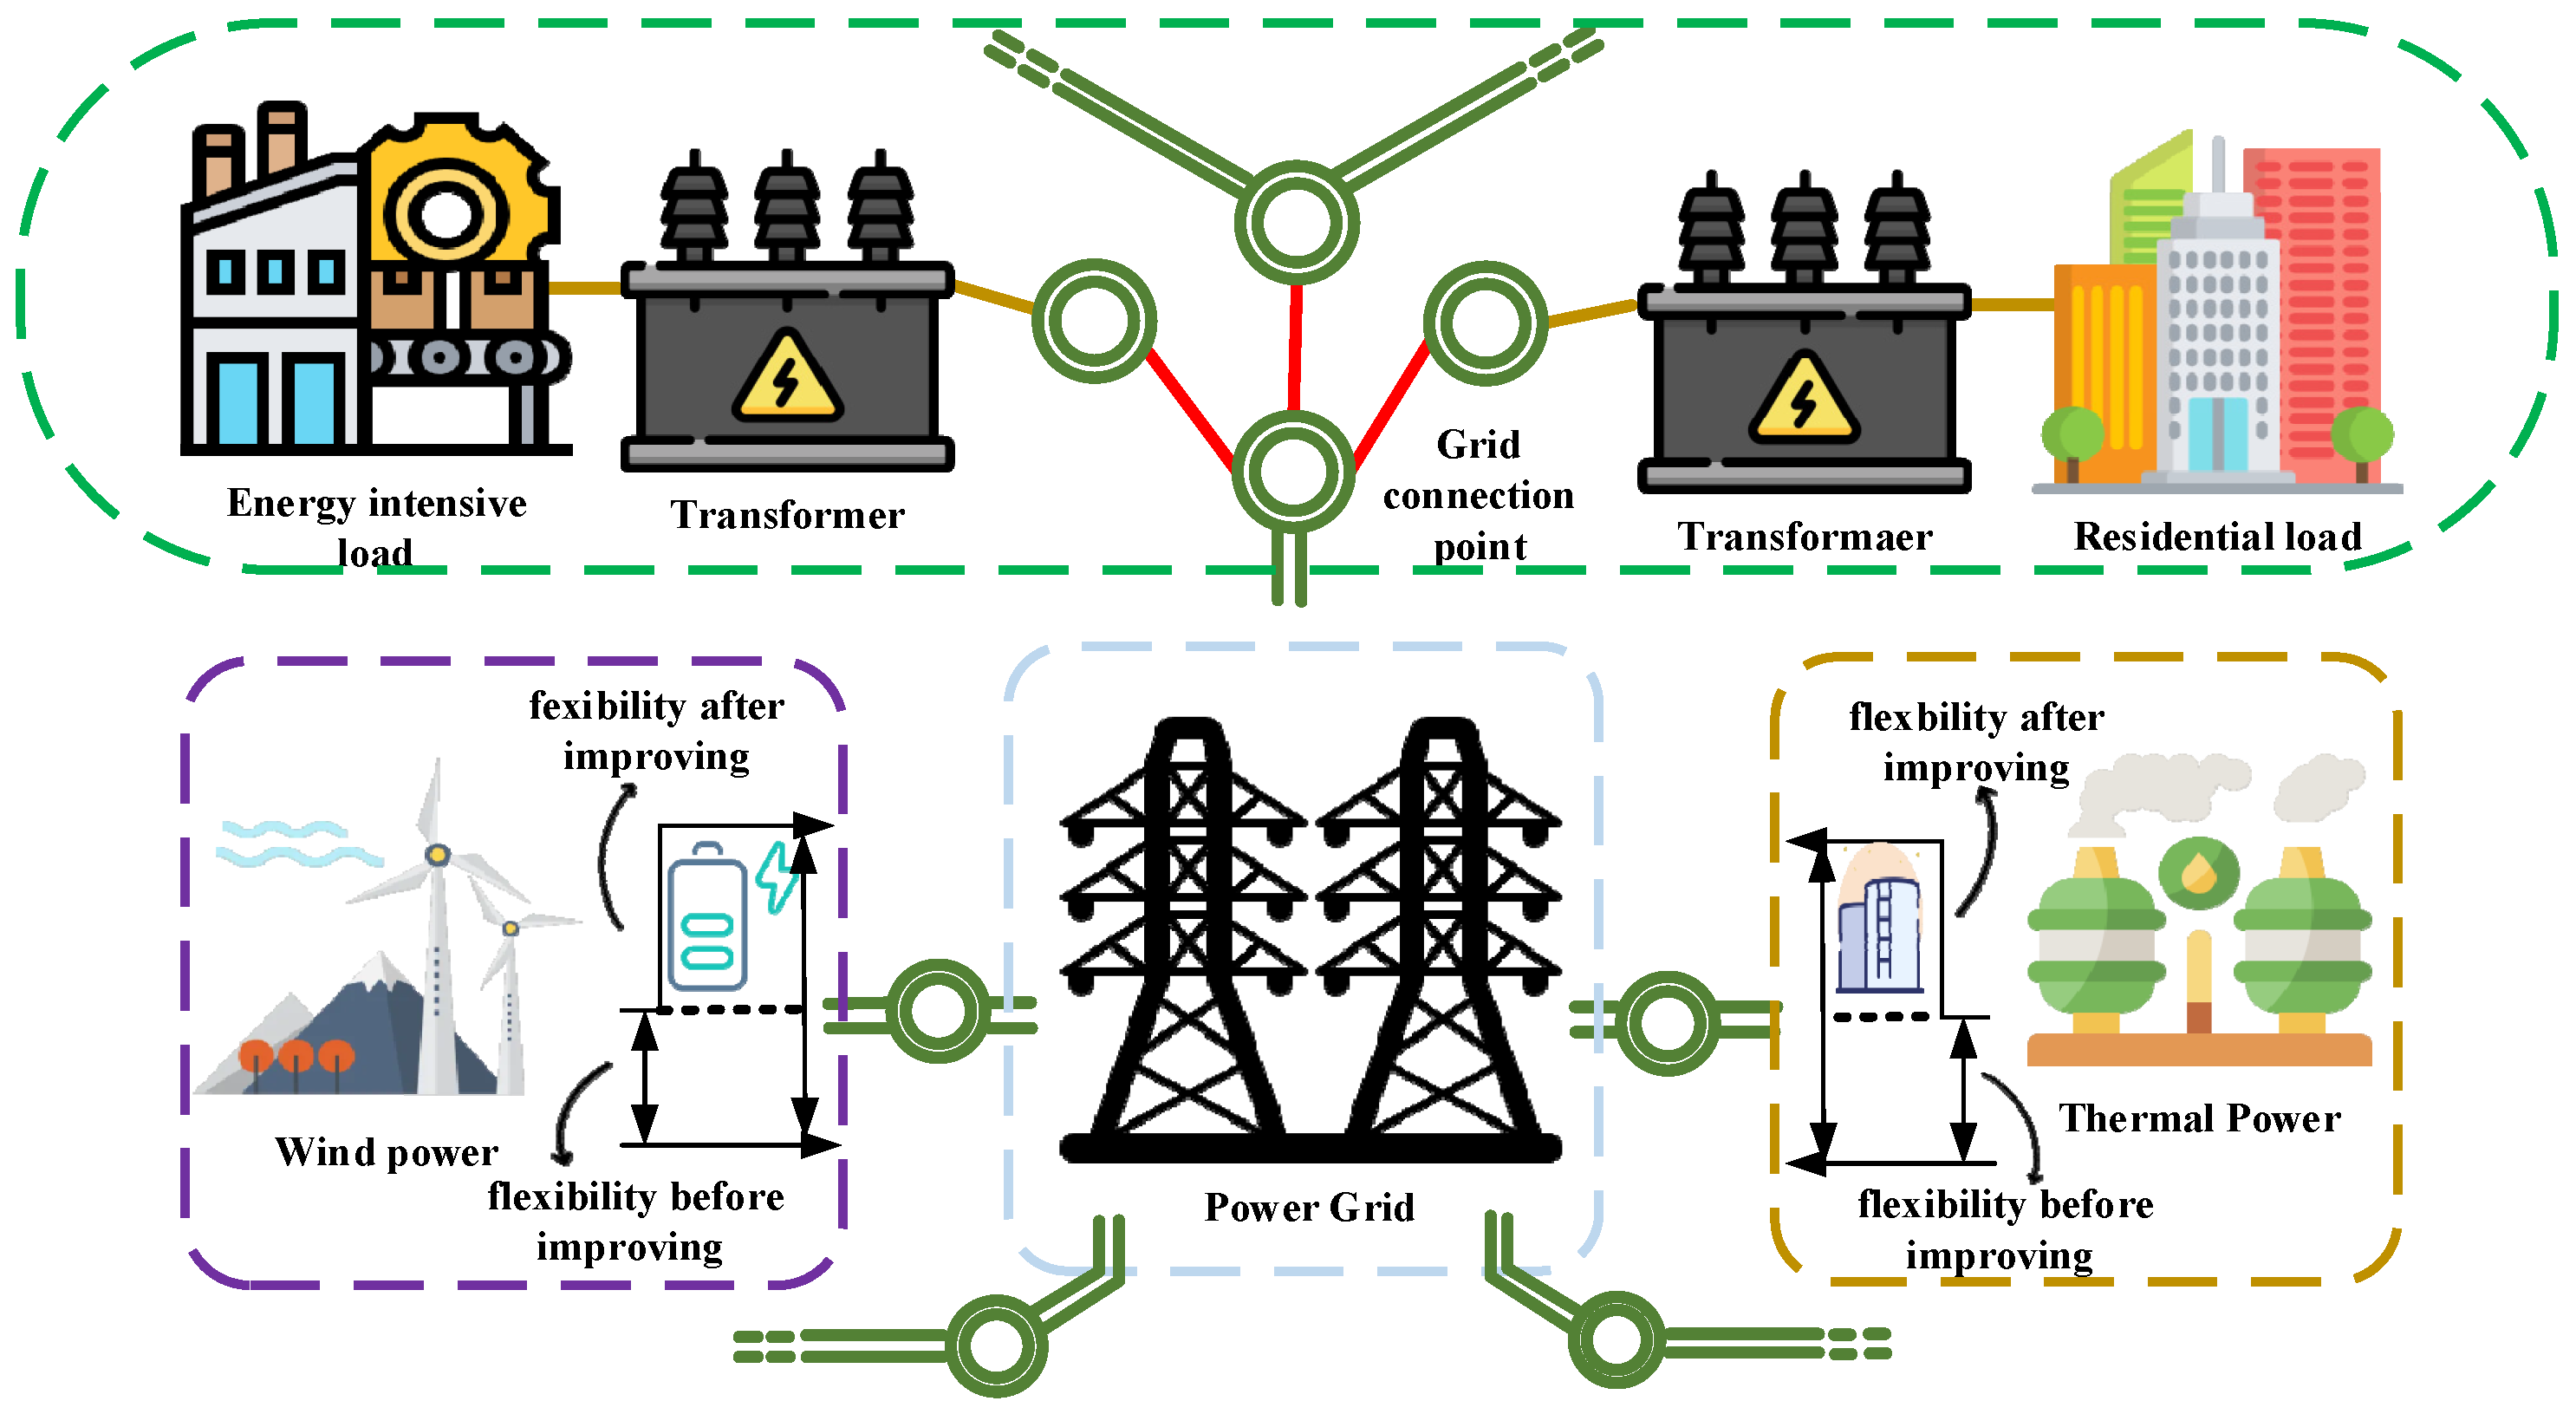
The above research focuses solely on enhancing the flexibility of either the source-side or the load-side without considering the combined source–load dispatching approach. A single flexibility on the source or load side alone is not conducive to improving the overall flexibility and changing economic efficiency. Moreover, they did not consider the impact and economic improvement of wind power grid connection under the combined action of thermal power, the EIL power, and energy storage devices. To expand the range of power system dispatching methods and improve wind power utilization, this paper proposes a two-stage regulation method for the source–load flexibility transformation. The paper aims to enhance the flexibility of thermal power units, the Energy Intensive Load (EIL), and wind plants across the day-ahead and intra-day time scales. By doing so, it stimulates the flexibility of dispatching resources within the power system, increases the incorporation of wind power, and mitigates the impact of unstable factors arising from the wind power fluctuations.

2. Mechanism Analysis of Source–Load Flexibility

2.1. Analysis of Source-Side Flexibility Transformation

To address this issue, adjusting the power output port adjustment range of thermal power plants and wind plants to the grid can enhance the flexibility at the source-side. This improves the integration of wind power and minimizes the adverse effects of wind power variability on the power system. Figure 1 illustrates the schematic diagram of the transformation of source-side flexibility as depicted in the paper. The schematic diagram of the source side flexibility transformation is shown in Figure 1.

2.1.1. Deep Peak Regulation Transformation of Thermal Power Units

In cases where meeting the peak regulation demands becomes challenging, the thermal power unit enters the deep peak regulation stage [22] to minimize wind curtailment.
The schematic diagram of the peak regulation cost at each stage of the thermal power unit is shown in Figure 2. In Figure 2, where Pmin is the lower limit of the conventional peak regulation for thermal power units, PA is the lower limit of peak regulation without oil for thermal power units, and PB is the lower limit of peak regulation with oil for thermal power units.
The coal consumption cost equation is depicted by:
E c o a l = a P 2 + b P + c
When the thermal power unit enters the deep peak regulation stage, the cost of the unit will increase. According to the Manson coffin formula [23], the life loss of the unit is roughly calculated in this paper. The unit’s loss cost is depicted by:
E f = α S g 2 N g ( P g t )
N g ( P g t ) = 0.00577 P g , i t 3 + 2.682 P g , i t 2 + 484 P g , i t 8411
where Sg is the cost of purchasing the machine, and N g ( P g t ) is the cost of the number of rotor fracture cycles.
When the unit power continues to decline, it will be difficult to ensure the stability of the unit. At this time, it is necessary to inject fuel oil into the unit to help prevent the unit from being disconnected and shut down. In the peak regulation stage, the peak regulation fuel cost of the unit also includes the fuel consumption cost. The fuel consumption cost is depicted by:
E c o i l = t = 1 T P o i l c o i l
where P o i l is thermal power during deep peak regulation with oil, and c o i l is the price of oil.

2.1.2. Coordinated Operation of Wind and Storage

Wind energy, as an environmentally friendly and renewable energy source, has experienced rapid development in recent years and shows a significant potential for future power system construction [24,25,26]. By connecting wind plants to energy storage devices, it becomes possible to define the upper and lower limits for the wind power output. This enables the pre-adjustment of the wind power output within a given range, effectively reducing the fluctuations of the planned wind power output. Energy storage not only ensures that the wind power output remains within acceptable limits but also provides a certain degree of autonomy. The regulation diagram of wind plants with energy storage is shown in Figure 3.

2.2. Load-Side Flexible Adjustment Mechanism

Industrial power generation accounts for almost 41% of global power generation [27]. For the sake of avoiding the increase in wind power blocking after large-scale wind power integration, this paper selects the EIL with a large capacity and high dispatching potential to participate in power system regulation. In recent years, a series of research on demand response technology has been carried out and gradually integrated with the industrial sector [28,29,30]. If the EIL adjusts their energy consumption according to the characteristics of wind power and actively participates in the power system dispatching, the current situation of power system dispatching will be greatly improved [31], the power system has will see improvements in both its flexibility and reliability, and the amount of wind power blockage will be effectively reduced. According to the regulation time and response speed of the EIL, the EIL is divided into two types: discrete adjustable load, continuously adjustable load, and interruptible adjustable load. In this section, we first model the discretely adjustable load (DAL), the continuously adjustable load, and the interruptible load (CAIL).
Typical DALs [32], such as the electrolytic aluminum load, are composed of multiple independent smelting modules. The characteristics of the discretely adjustable load in the metal smelting process are it cannot be regulated frequently, has certain production requirements, and has a regulation space.
Typical CAILs [33], such as the ferroalloy manufacturing load, can be continuously regulated within the designated time period. And, the CAIL is without a regulation frequency and time limit. The characteristics of the continuously adjustable load and the interruptible load in the production process are no regulation time limits, no production requirements, and certain regulation space. Modulatory attributes of the EIL are shown in Table 1.

2.2.1. Modeling of DALs

Adjusting power constraints, time constraints, and production constraints of the DALs are as follows:
The constraint of adjustable power is depicted by:
P H , min P H P H , max
where P H is the regulated power of the DALs, P H , max is the upper limit value of the DALs’ regulated power, and P H , min is the lower limit value of the DALs’ regulated power.
The constraint of adjustable time and frequency is depicted by:
{ [ S H ( t 1 ) S H ( t ) ] ( T H , o n T H , o n , min ) 0 [ S H ( t ) S H ( t 1 ) ] ( T H , o f f T H , o f f , min ) 0
where S H ( t ) is the regulation state variable of the DALs; T H , o n , min and T H , o f f , min are the lower limit time for the up and down adjustment of the DALs, respectively; and T H , o n and T H , o f f are the time of the continuous capacity input and the continuous load removal of the DALs, respectively.

2.2.2. Modeling of CAILs

Being different from the regulation of the DAL, the CAIL only considers the power limit of load operation. The operation of the DALs’ and the CAILs’ diagram is shown in Figure 4.

2.3. Impact on Wind Power Incorporation after Improving Source–Load Flexibility

To minimize the volatility of wind power interruption, the concept of enhancing the source–load flexibility via coordinated scheduling forms the basis for a three-stage model aimed at improving wind power incorporation.
  • Peak regulation stage only by thermal power (0–T1, T4–T)
In scenarios where the wind power fluctuations are gentle, the coordinated control of the power system involves only the participation of thermal power units. In order to enhance wind power integration, the conventional units are primarily operated at the lower limit output stage to ensure their normal operation, while the deep peak regulation units enter a state of deep peak regulation. The load at this stage consists solely of the conventional load P L o a d . At this particular stage, the upper limit of wind power generation P E 1 represents the critical value for the lower limit output regulation of the thermal power units, while denotes the minimum output level of the thermal power units. The equation of P E 1 is depicted by:
P E 1 = P L o a d P G , min
  • The EIL regulation stage (T1–T4)
The EIL regulation stage (T1–T4): As wind power surpasses the critical value, P E 1 indicates the lower limit regulation capacity of conventional units, and the EIL is engaged in system peak regulation. This involvement effectively mitigates the peak regulation pressure faced by the conventional units, reduces the duration for the conventional units to enter deep peak regulation, and enhances wind power integration. However, when wind power exceeds the EIL regulation capacity P E 2 , even with the full utilization of the EIL, the system is unable to fully absorb the excess wind power. In such cases, the system resorts to curtailing wind power. The equation of P E 2 is depicted by:
P E 2 = Δ P H , max + P L o a d P G , min
  • Stage of smoothing wind power fluctuations
When the wind power fluctuations are severe, the response speed of the EIL and thermal power units is insufficient to meet the requirements of stabilizing the fluctuations in wind energy production. Through the participation of energy storage batteries with a higher response speed in the dispatching strategy, the deficiencies of the EIL and thermal power units in regulating the fluctuations in wind energy production can be remedied.
By incorporating energy storage into power system scheduling and further optimizing the results of the EIL and the thermal power regulation stages, the objective is to alleviate the variability of planned wind power generation and achieve the minimized fluctuation rate. This approach aims to ensure a more stable and predictable wind power output, thereby minimizing the rate of wind power fluctuations P W . The equation of P W is depicted by:
Δ P W = | P W ( t + Δ t ) P W ( t ) | Δ t
Deep peak regulation and the EIL regulation are day-ahead regulations with a long time scale. The goal is to absorb wind power on a large scale. The thermal power units and the EIL are jointly regulated to increase wind power incorporation. Suppressing the wind power fluctuations is an intra-day regulation that requires a higher speed of the regulation of schedulable resources. The schematic diagram of source–load absorption wind power analysis is shown in Figure 5.

3. A Two-Stage Regulation Model for Source–Load

With the expanding connection of a great number of wind energy to the power grid, the issue of wind power prediction accuracy has become increasingly prominent. This paper establishes a two-stage optimization scheduling strategy considering the flexibility of the source–load based on the principle of “step-by-step coordination and multi-level optimization” [34]. The two-stage regulation model includes two time scales: day-ahead and intra-day. Due to the many differences in response speed and the regulation methods among thermal power units, the units of the EIL and the energy storage batteries. The energy storage batteries are superior to the EIL and thermal power units in response speed. Different regulation methods are arranged based on the characteristics of thermal power units, the units of the EIL, and the energy storage batteries to reduce wind power obstruction while reducing the impact of wind power fluctuations on the power system and meeting the regulation needs of the power system, better leveraging the regulatory role of schedulable resources.

3.1. A Day-Ahead Two-Level Scheduling Model for Wind Power Incorporation

During the day-ahead stage, the two-level optimization model is established with the objective of optimizing wind power incorporation and achieving the optimal scheduling power allocation. The two-layer optimization model refers to the process where the raw data is input into an upper-level model to obtain the upper-level model results. These results are then input into a lower-level model for further optimization, and the final output result is obtained when both the upper-level and lower-level models are satisfied. The scheduling cycle spans 24 h with a time interval of 15 min. In the upper-level model, the focus is on maximizing wind power incorporation. Through the optimized model, the day-ahead total wind power, thermal power, and the EIL’s scheduling power are determined. The output data from the upper-level model serves as the input data for the lower-level model, which then allocates the scheduling power in a reasonable manner.

3.1.1. The Upper Level Model

Taking into account a series of constraints such as system power stability, thermal power, and wind power, the upper level model optimizes the scheduling power of wind power, formulates a wind power incorporation strategy for the EIL regulation, and achieves the goal of maximizing wind power incorporation.
The upper level model optimization objective is depicted by:
max F 1 = t = 1 T k = 1 N W p W ( k , t )
where N W is the number of the specific wind plant, and p W is the wind power of the kth wind plant at time t.
The optimization goal of the upper level model is to increase wind power consumption, and the output of the total power of thermal power, wind power, and the EIL’s for the next day.

3.1.2. The Lower Level Model

While improving wind power incorporation, it is also necessary to consider the operation plans of various thermal power units, wind plants, and the EIL and develop a scheduling power allocation plan for wind power incorporation. Based on the results of the upper level model, dispatch power is allocated to various thermal power units, wind plants, and the EILs to achieve the optimal dispatch power allocation.
  • Optimal power allocation for thermal power dispatch
The power allocation for thermal power units in the dispatching process aims to minimize operating cost, thereby reducing the frequency and duration of deep peak regulation, which leads to increasing operational expenses. The optimization objective of power allocation for thermal power units’ dispatch is depicted by:
min F 2 = E c o a l + E f + E o i l
The equation of coal consumption cost of thermal power units is depicted by:
E c o a l = i = 1 N g t = 1 T a i P G 2 ( i , t ) + b i P G ( i , t ) + c i
where Ng is the number of thermal power units, and a i , b i , and c i are the coal consumption cost parameters of the thermal power units. The life loss of unit E f and the fuel consumption cost E o i l have been given in the previous text.
  • Distribution of wind power
The day-ahead dispatching strategy obtains the day-ahead wind power dispatching output, and the wind power output distributed by each wind plant shall not exceed the capacity of each wind plant installations. The wind power output obtained from the upper level model is distributed to each wind plant in the area according to the ratio of the capacity of the wind plant installations, and the day-ahead dispatching plan of wind power is completed. The wind power distribution power equation is depicted by:
[ p w 1 p w 2 p w 3 p w n ] = [ k w 1 k w 2 k w 3 k w n ] P W
k w n = W n W
where P W is total wind power in the day-ahead stage, p w n is the wind plant’s power, k w n is the ratio of capacity of the n th wind plant installation to all the wind plants in the region, W n is the capacity of the wind plant installations, and W is the total capacity of the wind plant installations in the region.
  • Dispatching power allocation for the EIL
To avoid increasing the burden on the EIL, due to participating in power system scheduling, the allocation of power for the EIL scheduling is based on the principle of minimizing the adjustment cost for each EIL [35,36].
The EIL distribution regulation power optimization objectives are depicted by:
min F 3 = min ( C s l r + C d v c )
{ C s l r = j = 1 N H t = 1 T | ( S H , s t a r t t ) t F | + j = 1 N H t = 1 T S H , j ( t ) q s l r G j G d v c = j = 1 N H t = 1 T S H , j ( t ) q d v c G j
where F 3 is the cost adjustment for the EIL, C s l r is the increased wage cost, C d v c is the increased storage cost, S H , s t a r t is the initial operating state of the EIL, t is the operating time of the EIL, t F is the expected starting operating time, and S H , j ( t ) is the regulating state of the j th EIL enterprise at time t. In the case of 0, the EIL experiences a decline, while in the case of 1, the EIL undergoes an ascent. G j is the daily production task volume of the j th EIL enterprise, q s l r , q d v c are the cost parameters of the EIL, and N H is the number of the EIL’s enterprises.
  • Power system balance and the constraints of the spinning reserve are depicted by:
i = 1 N g P g ( i , t ) + P W ( t ) = P L o a d ( t ) + Δ P H ( t )
{ i = 1 N g P g _ max ( i , t ) P g ( i , t ) R L , u p + R W , u p i = 1 N g P g ( i , t ) P g _ min ( i , t ) R L , d o w n + R W , u p
where P L o a d ( t ) is the total load, Pg (i, t) is the ith thermal power unit in the day-ahead stage at time t, and P H ( t ) is the power modification of the EIL. R L , u p and R W ,   d o w n represent the system load positive spinning reserve and the wind power positive spinning reserve. R L ,   d o w n and R W , d o w n represent the system load negative rotation reserve and the wind power negative rotation reserve.
  • The operational constraints of thermal power units [37] are depicted by:
S G ( i , t ) p G _ min ( i , t ) p G ( i , t ) S G ( i , t ) p G _ max ( i , t )
{ [ S G ( i , t 1 ) S G ( i , t ) ] ( T i , o n T i , o n , min ) 0 [ S G ( i , t ) S G ( i , t 1 ) ] ( T i . o f f T i , o f f , min ) 0
R G p G ( i , t ) p G ( i , t 1 ) R G +
where p G _   min and p G _   max are the upper limit and the lower limit output of the thermal power unit, S G   ( i , t ) is the start and stop condition of each thermal power unit at time t, T i ,   o n is the operation duration of the ith thermal power unit at time t after the last startup, T i ,   o f f is the continuous shutdown time of the ith thermal power unit after the last shutdown, T i , o n , min is the lower limit startup duration of the ith thermal power unit, and T i , o f f , min is the lower limit shutdown duration of the thermal power unit. R G + and R G represent the positive and negative ramp rates of the thermal power unit.
  • The constraints of wind power are depicted by
0 i = 1 N W p W ( t ) P W , f o r e ( t )
where p W is the power of a single wind plant, N W is the number of wind plants, and P W , f o r e is the day-ahead wind power forecast.
In the day-ahead phase, the goal is to maximize the wind power incorporation. According to the model constraints, the day-ahead scheduling model is solved. The day-ahead scheduling solution results are the output plans of each wind plant, the output plans of each thermal power unit, and the power regulation of each enterprise of the EIL.

3.2. Intra-Day Tracking Stage Based on Suppressing Wind Power Fluctuations

In the stage dedicated to mitigating the wind power fluctuations, there is a relatively high response speed in terms of scheduling resources. By utilizing the coordination mechanism between thermal power units and energy storage batteries, adjustments are made to the intra-day fluctuations of wind power, and the intra-day tracking strategy is formulated to enhance wind power stability. The intra-day stage is divided into 5 min intervals, and the wind power data for the next 4 h is obtained. The primary objective, during this stage, is to minimize the wind power fluctuations when connected to the power system. The intra-day regulation is carried out via the collaboration of thermal power units and energy storage devices. The intra-day tracking regulation model is solved based on the constraints specific to this stage. Drawing from the daily results, the planned output of wind power, the adjustment quantities for thermal power units, and the operational status of the energy storage devices are determined. The operational constraints of wind power and thermal power units have been discussed in the preceding text and will not be elaborated upon further. The subsequent section presents the intra-day stage model.

3.2.1. The Intra-Day Stage Optimization Objective

min F 4 = t = 1 T | P W , r e a l ( t ) P W , r e a l ( t 1 ) |
P W , r e a l ( t ) = P W * ( t ) + Δ P G ¯ ( t ) + Δ P b a t ( t )
where F 4 is the wind power wave rate, P W * is the wind power after the day-ahead regulation, P G ¯ ( t ) is the adjustment amount of thermal power in the intra-day stage, and P b a t is the adjustment amount of the energy storage battery.
The constraint of power balance in the intra-day stage is depicted by:
i = 1 N g P g ( i , t ) + P W ( t ) + P b a t ( t ) = P L o a d
where P L o a d is the load in the intra-day stage.
The constraints of SOC [38,39] are depicted by:
S O C ( t + 1 ) = S O C ( t ) + η c h P c h ( t ) E b a t P d i s ( t ) η d i s E b a t
S O C ( 1 ) = S O C ( T )
S O C min S O C ( t ) S O C max
where SOC (state of charge) is the quantity of electricity stored, η c h is the charge efficiency, η d i s is the discharge efficiency, P c h is the charge power, P d i s is the discharge power, and E b a t is the energy storage capacity. S O C min and S O C max represent the upper limit and lower limit values of SOC.
0 P c h ( t ) P c h , max ( t ) S c h
0 P d i s ( t ) P d i s , max S d i s
S c h + S d i s 1
where P c h , max and P d i s , max are the upper limit values of the charge and discharge power of the energy storage, and S c h , S d i s are the state variables of the energy storage charge and discharge.

3.2.2. Set Control Policy

According to the response speed and response capacity of thermal power units and energy storage devices, three control measures are set up in Table 2 [40].
P W F is the stable fluctuation limit of wind power. When the fluctuation range of wind power is less than this limit, the wind power belongs to the stable fluctuation range. This stage is regulated by the thermal power unit. When the fluctuation range of wind power is greater than the stable fluctuation limit and less than the energy storage regulation limit P W E , wind power belongs to the peak fluctuation range. This stage is regulated by the energy storage devices. When the wind power surpasses the energy storage regulation limit, the system opts to disregard wind energy.

3.2.3. The Intra-Day Dispatch Power Distribution

The regulation quantity of thermal power units shall be distributed according to the capacity ratio of each thermal power unit installations’ assembly unit. The formula for the adjustment allocation of thermal power units in the intra-day stage is depicted by:
[ Δ p G , 1 ¯ Δ p G , 2 ¯ Δ p G , 3 ¯ Δ p G , i ¯ ] = [ k G , 1 k G , 2 k G , 3 k G , i ] Δ P G ¯
where p G , i ¯ is the power adjustment amount of the ith thermal power unit, k G , i is the ratio of the capacity of the ith unit installations, and P G ¯ is the adjustment of thermal power in the intra-day stage. The process diagram of the source–load two-stage scheduling strategy is shown in Figure 6.

4. Case Study

The aforementioned two-stage scheduling model involves six thermal power units with a total capacity of 1012 MW. Among them, unit 1 is specifically designed for deep peak regulation. Table 3 presents the detailed operating parameters of the thermal power unit. Additionally, there are four wind plant installations with a combined capacity of 850 MW, which is distributed as follows: 250 MW, 200 MW, 200 MW, and 250 MW, respectively. Due to the inherent uncertainty of wind power, two distinct wind power scenarios, characterized by strong volatility and large amplitude changes, have been selected for analysis. In order to fully consider the wind power uncertainty, two representative wind power scenarios, anti-peak shaving and positive peak shaving, are selected. The day-ahead and intra-day wind power forecasts for Scenario 1 and Scenario 2 are displayed in Figure 7 and Figure 8, respectively. In this paper, we only consider the impact of improving the source–load flexibility on wind power, thermal power, and the EIL, assuming that the impact on power losses is small and is not accounted for in this research program.
A lithium iron phosphate battery is utilized as the energy storage battery participating in the intra-day stage to stabilize the wind power fluctuations. The specific energy storage related coefficients are detailed in Table 4.
The EILs are generally 24 h continuous operating loads. Considering the limitations of the DAL on the frequency of regulation adjustments, the frequency of regulation adjustments should not exceed six times based on the reference power to avoid affecting the quality of electrolytic aluminum load products. The parameters of the EIL are detailed in Table 5.
The conventional load forecast power is shown in Figure 9.
The scheduling results for Scenario 1 and Scenario 2 are presented in Figure 10 and Figure 11, respectively. The EIL adjustment diagrams for Scenario 1 and Scenario 2 are depicted in Figure 12 and Figure 13, respectively. The positive adjustment values indicate an upregulation state, while the negative values indicate a downregulation state. A comparison of wind power incorporation between Scenario 1 and Scenario 2 is also provided.
In the EIL adjustment diagram, the positive values indicate an upward state while the negative values indicate a downward state. Based on the dispatching results of thermal power units and the operational outcomes of the EIL, certain adjustments are made depending on the abundance or scarcity of wind power. When wind power generation is plentiful, the power output of thermal power units is reduced to prevent them from reaching a shutdown state and the instances of entering the deep peak regulation state is minimized. Simultaneously, the power output of the EIL is increased to ensure the smooth integration of wind power. The EIL chooses to increase the power between 0:00 and 8:30, and the wind power is absorbed due to the increase in the EIL reaching 680 MW/h. During the EIL upward stage, the maximum increase in the total load compared to the traditional dispatching mode is 137 MW. Conversely, when the wind power output is low, the power output of thermal power units is increased to avoid hindering the incorporation of wind power, while the power output of the EIL is reduced to alleviate the peak regulation pressure on thermal power units. The EIL reduced a total of 1185 MW/h of electricity during the downward stage between 9:30 and 22:30. During the EIL downward stage, the maximum decrease in the total load compared to the original scheduling method was 90 MW. Hence, it can be concluded that the EIL and thermal power units complement each other. The day-ahead dispatching strategy fully leverages the regulatory advantages of both the EIL and thermal power units, effectively meeting the requirements of wind power incorporation while reducing the peak regulation pressure on thermal power units and minimizing operation costs. The traditional dispatching mode energy-intensive loads are viewed as constant loads in the traditional dispatch models. We denote the EIL power consumption as the reference load. Energy storage is not involved in regulation. The traditional method relies only on the regulation of thermal power units for wind power consumption. When compared to the traditional dispatching mode, the operational cost of thermal power is reduced by 37,200 CNY in Scenario 1
In Scenario 2, the result analysis is similar to Scenario 1. The EIL increases its power consumption by 253 MW/h during the upregulation phase, with a maximum increase in the total load of 149 MW. During the EIL decrease phase, the power consumption decreased by 1778 MW/h, and the maximum total load decrease is 90 MW. When compared to the traditional dispatching mode, the operational cost of thermal power is reduced by 44,576 CNY in Scenario 2.
The wind power incorporation results in Scenario 1 is shown in Figure 14.
The day-ahead wind power incorporation results in Scenario 1 is shown in Figure 14. The conflicting nature of thermal power and wind power has resulted in a significant increase in wind power curtailment, which is a concerning phenomenon. However, the introduction of the EIL in the dispatching process has led to improvements in this issue. Figure 14 clearly demonstrates that, compared to the traditional dispatching method, the involvement of the EIL in power system regulation has greatly reduced the duration of wind power curtailment. In Scenario 1, there are only 25 times of wind power curtailment. During these curtailment periods, when the wind power forecast reaches its upper limit, the maximum blocked wind power is 70 MW. This represents a reduction of 2630 MW·h in wind curtailment compared to the traditional dispatching mode.
Figure 15 is a comparison of wind power consumption in Scenario 2. In Scenario 2, there are only four times of wind power curtailment, with a maximum blocked power of 51.2 MW at the upper limit wind power forecast. Due to the less pronounced anti-peak regulation characteristics of wind power in Scenario 2, the wind curtailment is further reduced compared to Scenario 1, amounting to a decrease of 2478 MW·h compared to traditional dispatching. In summary, the traditional dispatching mode, which fails to consider the coordination capabilities of the EIL and thermal power units, not only leads to an increased air volume within the system but also exacerbates the peak regulation pressure and operational costs of thermal power units. On the other hand, the inclusion of the EIL in the day-ahead dispatching strategy effectively enhances wind power incorporation and alleviates the peak regulation pressure faced by thermal power units. The day-ahead scheduling results are shown in Table 6.
In the intra-day stage, different adjustment strategies are implemented for thermal power units and energy storage devices to mitigate the impact of wind power fluctuations on the power system. The intraday dispatching cycle is set to 4 h with a time scale of 3 min. This approach aims to minimize the detrimental effects of wind power fluctuations on the power system. As the prediction accuracy improves, the intra-day range of the predicted wind power fluctuations is −30 MW and 30 MW. The results of smoothing the wind power fluctuations in Scenario 1 are illustrated in Figure 16.
Furthermore, Figure 16 demonstrates the impact of wind power incorporation after suppressing the wind power fluctuations in Scenario 1 via the thermal power units and energy storage. The regulation diagrams for thermal power and energy storage are presented in Figure 17 and Figure 18. Figure 17 shows that for thermal power units in the 3 min regulation time period, the regulation power size is limited to only 20 MW, where it is difficult to meet the real-time volatility of wind power in order to make up for the defects of the thermal power units to regulate the power of the energy storage in the peak moments and act as a major means of suppressing wind power. When the wind power fluctuation rate is stabilized within the range of ±1%, it indicates a stable fluctuation stage of wind power, meeting the suppression requirements. In Scenario 1, the upper limit wind power fluctuation rate after wind power suppression is ±0.36%.
Scenario 2 is analyzed in a similar way to Scenario 1. The results of smoothing the wind power fluctuations in Scenario 2 are illustrated in Figure 19. The regulation diagrams for thermal power and energy storage are presented in Figure 20 and Figure 21. In Scenario 2, the upper limit wind power fluctuation rate after wind power suppression is ± 0.25%. Both scenarios satisfy the operational requirements of the power system.

5. Conclusions

The main contribution of this paper lies in the joint transformation of source–load flexibility, utilizing the large dispatch power of the EIL to absorb more wind power and alleviate the pressure of thermal power peak shaving, where the flexibility of energy storage devices to adjust the frequency is utilized, and the fluctuations in wind power at small time scales are reduced. The harm of wind power to the power system is reduced. This paper presents the two-stage control strategy for the integration of large-scale wind power into the power system, taking into account the flexibility of both the source and the load. A coordinated optimization method is developed for the source-side and load-side. The feasibility and effectiveness of this method are demonstrated via a numerical example.
In the day-ahead and intra-day scales, the source and the load are coordinated and optimized, respectively. In the day-ahead stage, the two-level optimization model is used to improve wind power incorporation and optimize the dispatching power distribution of the power system. Compared with the traditional methods, the wind power consumption in Scenario 1 and Scenario 2 increases by 2741.1 MW/h and 2478.5 MW/h, respectively. The system operating costs have been reduced by 37,200 CNY and 44,576 CNY, respectively. In the real-time stage, via the coordinated optimization of thermal power units and energy storage, the fluctuation range of wind power is stable within ±1%. The reliability and economy of the power system have been improved.
This method and advanced forecasting technology can eliminate the deviation of other factors on wind power and load forecasting, improve the accuracy of power system dispatching, and better meet the demand of power system dispatching.

6. Discussion

In order to improve the wind power consumption and reduce the loss of wind power fluctuations to the power system, this paper proposes the two-stage method to improve the source–load flexibility. In the day-ahead stage, a two-level model is proposed to improve the flexibility of thermal power and the EIL. In the day-ahead stage, the wind power is more accurate via a smaller time scale, and the impact of wind power fluctuation on the power system is eliminated by using the regulation flexibility of energy storage devices. With the continuous reduction in the scale of thermal power units and the continuous increase in the scale of wind power, the accurate control of power systems is a very important research direction. This paper provides ideas for the future research of power systems.
This paper only studies the economic dispatch of small power systems, ignoring the impact of network topology, and should reflect the impact on power flow in future research work.

Author Contributions

Conceptualization, C.H.; Methodology, C.H.; Software, C.H.; Validation, C.H. and Y.W.; Formal analysis, Y.W.; Investigation, Y.W.; Resources, Y.W.; Data curation, C.L.; Writing—original draft, C.H.; Writing—review & editing, Y.W., C.L., G.Z., H.Y., D.W. and J.S. All authors have read and agreed to the published version of the manuscript.

Funding

This research received no external funding.

Institutional Review Board Statement

Not applicable.

Informed Consent Statement

Not applicable.

Data Availability Statement

Not applicable.

Conflicts of Interest

The authors declare no conflict of interest.

Abbreviations

The following abbreviations are used in this manuscript:
CALContinuously Adjustable Load and Interruptible Load
DALDiscretely Adjustable Load
EILEnergy Intensive Load
SOCState Of Charge

References

  1. Poorvaezi-Roukerd, S.; Abdollahi, A.; Peng, W. Flexibility-constraint integrated resource planning framework considering demand and supply side uncertainties with high dimensional dependencies. Int. J. Electr. Power Energy Syst. 2021, 133, 107223. [Google Scholar] [CrossRef]
  2. Sasaki, K.; Aki, H.; Ikegami, T. Application of model predictive control to grid flexibility provision by distributed energy resources in residential dwellings under uncertainty. Energy 2022, 239, 122183. [Google Scholar] [CrossRef]
  3. Notice of the Ministry of Industry and Information Technology on Issuing the “Guidelines for Power Demand Side Management in the Industrial Field”. Available online: https://www.gov.cn/zhengce/zhengceku/2019-11/22/content_5454429.htm (accessed on 2 December 2022).
  4. Notice of the National Development and Reform Commission and the National Energy Administration on Issuing the “14th Five Year Plan for Modern Energy System”. Available online: https://www.ndrc.gov.cn/xwdt/tzgg/202203/t20220322_1320017.html (accessed on 2 December 2022).
  5. Yang, J.; Peng, L.; Luo, L.; Yang, T. Control Strategy for Energy-Storage Systems to Smooth Wind Power Fluctuation Based on Interval and Fuzzy Control. IEEE Access 2023, 11, 20979–20993. [Google Scholar] [CrossRef]
  6. Ikegami, T.; Urabe, C.T.; Saitou, T.; Ogimoto, K. Numerical definitions of wind power output fluctuations for power system operations. Renew. Energy 2018, 115, 6–15. [Google Scholar] [CrossRef]
  7. Fan, W.; Huang, L.; Cong, B.; Tan, Z.; Xing, T. Research on an optimization model for wind power and thermal power participating in two-level power market transactions. Int. J. Electr. Power Energy Syst. 2022, 134, 107423. [Google Scholar]
  8. Tang, H.; Wang, S. Game-theoretic optimization of demand-side flexibility engagement considering the perspectives of different stakeholders and multiple flexibility services. Appl. Energy 2023, 332, 120550. [Google Scholar] [CrossRef]
  9. Zhu, J.; Cui, X.; Ni, W. Model predictive control based control strategy for battery energy storage system integrated power plant meeting deep load peak regulation demand. J. Energy Storage 2022, 46, 103811. [Google Scholar] [CrossRef]
  10. Wang, C.; Song, J.; Zhu, L.; Zheng, W.; Liu, Z.; Lin, C. Peak regulation and heat supply flexibility of thermal power plants. Appl. Therm. Eng. 2021, 193, 117030. [Google Scholar] [CrossRef]
  11. Liu, J.; Bao, H. Research on interest coordination model of wind power supply chain with energy storage participation. J. Energy Storage 2022, 49, 104107. [Google Scholar] [CrossRef]
  12. Ma, L.; Xie, L.; Ye, L.; Ye, J.; Ma, W. A wind power smoothing strategy based on two level model algorithm control. J. Energy Storage 2023, 60, 106617. [Google Scholar] [CrossRef]
  13. Cao, M.; Xu, Q.; Qin, X.; Cai, J. Battery energy storage sizing based on a model predictive control strategy with operational constraints to smooth the wind power. Int. J. Electr. Power Energy Syst. 2020, 115, 105471. [Google Scholar] [CrossRef]
  14. Adib, M.; Nasiri, F.; Haghighat, F. Integrating wind energy and compressed air energy storage for remote communities: A bi-level programming approach. J. Energy Storage 2023, 72, 108496. [Google Scholar] [CrossRef]
  15. Zeng, Y.; Zhang, R.; Wang, D.; Mu, Y.; Jia, H. A regional power grid operation and planning method considering renewable energy generation and load control. Appl. Energy 2019, 237, 304–313. [Google Scholar] [CrossRef]
  16. Ding, Y.; Zhu, Y.; Wang, Q.; Tian, Z.; Yan, R.; Yan, Z.; Xia, X. A comprehensive scheduling model for electric vehicles in office buildings considering the uncertainty of charging load. Int. J. Electr. Power Energy Syst. 2023, 151, 109154. [Google Scholar] [CrossRef]
  17. Li, X.; Cao, X.; Li, C.; Yang, B.; Cong, M.; Chen, D. A Coordinated Peak Shaving Strategy Using Neural Network for Discretely Adjustable Energy-Intensive Load and Battery Energy Storage. IEEE Access 2020, 8, 5331–5338. [Google Scholar] [CrossRef]
  18. Liao, S.; Xu, J.; Sun, Y.; Bao, Y.; Tang, B. Control of Energy-Intensive Load for Power Smoothing in Wind Power Plants. IEEE Trans. Power Syst. 2018, 33, 6142–6154. [Google Scholar] [CrossRef]
  19. Chen, G.; Zhang, X.; Wang, C.; Zhang, Y.; Hao, S. Research on Flexible Control Strategy of Controllable Large Industrial Loads Based on Multi-Source Data Fusion of Internet of Things. IEEE Access 2021, 9, 117358–117377. [Google Scholar] [CrossRef]
  20. Tan, M.; Chen, Y.; Su, Y.X.; Li, S.H.; Li, H. Integrated optimization model for industrial self-generation and load scheduling with tradable carbon emission permits. J. Clean. Prod. 2019, 210, 1289–1300. [Google Scholar] [CrossRef]
  21. Wang, Y.; Li, G.; Zhou, B.; Ma, H.; Li, Z. Optimal Dispatch Strategy for Virtual Power Plants with Adjustable Capacity Assessment of High-Energy-Consuming Industrial Loads Participating in Ancillary Service Markets. Sustainability 2023, 15, 10479. [Google Scholar] [CrossRef]
  22. Wang, J.; Zhang, S.; Huo, J.; Zhou, Y.; Li, L.; Han, T. Dispatch optimization of thermal power unit flexibility transformation under the deep peak regulation demand based on invasive weed optimization. J. Clean. Prod. 2021, 315, 128047. [Google Scholar] [CrossRef]
  23. Zhao, X.; Chen, H.; Liu, S.; Ye, X. Economic & environmental effects of priority dispatch of renewable energy considering fluctuating power output of coal-fired units. Renew. Energy 2020, 157, 695–707. [Google Scholar]
  24. Chang, F.; Li, Y.; Peng, Y.; Cao, Y.; Yu, H.; Wang, S.; Zhang, X.; Luo, L. A dual-layer cooperative control strategy of battery energy storage units for smoothing wind power fluctuations. J. Energy Storage 2023, 70, 107789. [Google Scholar] [CrossRef]
  25. Peng, Y.; Li, Y.; Lee, K.Y.; Tan, Y.; Cao, Y.; Wen, M. Coordinated Control Strategy of PMSG and Cascaded H-Bridge STATCOM in Dispersed Wind Farm for Suppressing Unbalanced Grid Voltage. IEEE Trans. Sustain. Energy 2021, 12, 349–359. [Google Scholar] [CrossRef]
  26. Xiong, Y.; Yao, W.; Yao, Y.; Fang, J.; Ai, X.; Wen, J.; Cheng, S. Distributed Cooperative Control of Offshore Wind Plants Integrated via MTDC System for Fast Frequency Support. IEEE Trans. Ind. Electron. 2023, 70, 4693–4704. [Google Scholar] [CrossRef]
  27. International Energy Agency, Paris, France, 2006. Key World Energy Statistics 2006. Available online: http://www.iea.org (accessed on 2 December 2022).
  28. Ma, S.; Zhang, Y.; Liu, Y.; Yang, H.; Lv, J.; Ren, S. Data-driven sustainable intelligent manufacturing based on demand response for energy-intensive industries. J. Clean. Prod. 2020, 274, 123155. [Google Scholar] [CrossRef]
  29. Zhang, S.; Zhang, K.; Zhang, G.; Xie, T.; Wen, J.; Feng, C.; Ben, W. The Bi-Level Optimization Model Research for Energy-Intensive Load and Energy Storage System Considering Congested Wind Power Consumption. Processes 2022, 10, 51. [Google Scholar] [CrossRef]
  30. Cirocco, L.; Pudney, P.; Riahi, S.; Liddle, R.; Semsarilar, H.; Hudson, J.; Bruno, F. Thermal energy storage for industrial thermal loads and electricity demand side management. Energy Convers. Manag. 2022, 270, 116190. [Google Scholar] [CrossRef]
  31. Xu, Q.; Lv, Y.; Wang, D.; Du, P. A Bilateral Tradeoff Decision Model for Wind Power Utilization with Extensive Load Scheduling. Appl. Sci. 2019, 9, 1777. [Google Scholar] [CrossRef]
  32. Kong, W.; Chai, T.; Ding, J.; Yang, S. Multifurnace optimization in electric smelting plants by load scheduling and control. IEEE Trans. Autom. Sci. Eng. 2014, 11, 850–862. [Google Scholar] [CrossRef]
  33. Babu, C.A.; Ashok, S. Peak load management in electrolytic process industries. IEEE Trans. Power Syst. 2008, 23, 399–405. [Google Scholar] [CrossRef]
  34. Yao, L.; Liu, Z.; Chang, W.; Yang, Q. Multi-level model predictive control based multi-objective optimal energy management of integrated energy systems considering uncertainty. Renew. Energy 2023, 270, 116190. [Google Scholar] [CrossRef]
  35. Cai, G.; Zhou, J.; Wang, Y.; Zhang, H.; Sun, A.; Liu, C. Multi-objective coordinative scheduling of system with wind power considering the regulating characteristics of energy-intensive load. Int. J. Electr. Power Energy Syst. 2023, 151, 109143. [Google Scholar] [CrossRef]
  36. Zhong, H.; Xia, Q.; Xia, Y.; Kang, C.; Xie, L.; He, W.; Zhang, H. Integrated dispatch of generation and load: A pathway towards smart grids. Electr. Power Syst. Res. 2015, 120, 206–213. [Google Scholar] [CrossRef]
  37. Cui, D.; Jin, Y.; Wang, Y.; Yuan, Z.; Cai, G.; Liu, C.; Ge, W. Combined thermal power and battery low carbon scheduling method based on variational mode decomposition.International. J. Electr. Power Energy Syst. 2023, 145, 108644. [Google Scholar] [CrossRef]
  38. Fang, X.; Hodge, B.-M.; Bai, L.; Cui, H.; Li, F. Mean-Variance Optimization-Based Energy Storage Scheduling Considering Day-Ahead and Real-Time LMP Uncertainties. IEEE Trans. Power Syst. 2018, 33, 7292–7295. [Google Scholar] [CrossRef]
  39. Zhou, Q.; Zhang, J.; Gao, P.; Zhang, R.; Liu, L.; Wang, S.; Cheng, L.; Wang, W.; Yang, S. Two-Stage Robust Optimization for Prosumers Considering Uncertainties from Sustainable Energy of Wind Power Generation and Load Demand Based on Nested C&CG Algorithm. Sustainability 2023, 15, 9769. [Google Scholar]
  40. Peng, G.; Jing, W.; Zhu, D.; Wang, W.; Liu, W. The coordination control strategy for large-scale wind power consumption based on source-load interactive. Trans. China Electrotech. Soc. 2017, 32, 1–9. [Google Scholar]
Figure 1. Schematic diagram of the source side flexibility transformation.
Sustainability 15 13918 g001
Figure 2. Schematic diagram of peak regulation cost at each stage of thermal power unit.
Sustainability 15 13918 g002
Figure 3. Regulation diagram of wind plants with energy storage.
Sustainability 15 13918 g003
Figure 4. DAL and CAIL operation diagram.
Sustainability 15 13918 g004
Figure 5. Schematic diagram of source–load absorption wind power analysis.
Sustainability 15 13918 g005
Figure 6. Process diagram of source–load two-stage scheduling strategy.
Sustainability 15 13918 g006
Figure 7. Day-ahead and intra-day wind power forecast in Scenario 1.
Sustainability 15 13918 g007
Figure 8. Day-ahead and intra-day wind power forecast in Scenario 2.
Sustainability 15 13918 g008
Figure 9. Conventional load in day-ahead stage.
Sustainability 15 13918 g009
Figure 10. Dispatch result chart in Scenario 1.
Sustainability 15 13918 g010
Figure 11. EIL adjustment diagram in Scenario 1.
Sustainability 15 13918 g011
Figure 12. Dispatch result chart in Scenario 2.
Sustainability 15 13918 g012
Figure 13. EIL adjustment diagram in Scenario 2.
Sustainability 15 13918 g013
Figure 14. Wind power incorporation results chart in Scenario 1.
Sustainability 15 13918 g014
Figure 15. Wind power incorporation results chart in Scenario 2.
Sustainability 15 13918 g015
Figure 16. Result chart of smoothing wind power fluctuation in Scenario 1.
Sustainability 15 13918 g016
Figure 17. Thermal power regulation diagram in Scenario 1.
Sustainability 15 13918 g017
Figure 18. Energy storage regulation diagram in Scenario 1.
Sustainability 15 13918 g018
Figure 19. Result of smoothing wind power fluctuation in Scenario 2.
Sustainability 15 13918 g019
Figure 20. Thermal power regulation diagram in Scenario 2.
Sustainability 15 13918 g020
Figure 21. Energy storage regulation diagram in Scenario 2.
Sustainability 15 13918 g021
Table 1. Modulatory attributes of the EILs.
Adjustment MethodRepresentative LoadUp/Down Time/hLong Time AdjustmentShort Time Adjustment
DALElectrolytic aluminum≥4×
CAILFerroalloy/
Note: where / represents no need for restrictions, √ represents possible, × represents impossible.
Table 2. Wind power fluctuation control strategy.
Wind Power Fluctuation RangeRegulatory Methods
< P W F thermal power regulation
[ P W F , P W E ]energy storage regulation
> P W E abandon
Table 3. Thermal power unit parameters.
Unit NumberPmax/(MW)Pmin/(MW)PA/PB (MW)a (¥/MW2·h)b (¥/MW·h)c (¥/h)Unit Climbing/(MW/15 min)
Unit 1455225182/1530.0004816.2100050
Unit 213065/0.00216.670025
Unit 313065/0.0021116.568025
Unit 416253/0.0039819.735025
Unit 58040/0.0071222.337018
Unit 65527/0.0022227.366815
Table 4. Energy storage battery parameters.
Energy Storage Battery ParametersParameter Value
battery capacity200 MW/h
initial SOC0.2
SOC upper and lower limits0.9/0.1
charge and discharge efficiency0.95/0.95
upper and lower limits of energy storage power50/10 MW
Table 5. EIL regulation parameter parameters.
EIL TypeRepresentative LoadReference Load/MWUpper Power/MWLower Power/MWNumber of Adjustments
DALElectrolytic aluminum40080606
CAILFerroalloy200 3030/
Table 6. Day-ahead scheduling results.
ScenarioScheduling ModeThe Cost of EIL/¥The Cost of Thermal Power/¥The Wind Curtailment (MW·h)
Scenario 1proposed method23,940325,621141.21
traditional method/386,7612741.1
Scenario 2proposed method12,000325,36376.6
traditional method/381,9392478.25
Disclaimer/Publisher’s Note: The statements, opinions and data contained in all publications are solely those of the individual author(s) and contributor(s) and not of MDPI and/or the editor(s). MDPI and/or the editor(s) disclaim responsibility for any injury to people or property resulting from any ideas, methods, instructions or products referred to in the content.

