Article

Numerical Simulation and Parameter Optimization of a New Reed–Nylon Net Combined Sand Fence

College of Mechanical Engineering, Xinjiang University, Urumqi 830046, China
*
Author to whom correspondence should be addressed.
Sustainability 2023, 15(18), 13920; https://doi.org/10.3390/su151813920
Submission received: 21 August 2023 / Revised: 12 September 2023 / Accepted: 14 September 2023 / Published: 19 September 2023
(This article belongs to the Section Environmental Sustainability and Applications)

Abstract

:
This paper introduces a kind of double-row reed–nylon net combined sand barrier. Using the computational fluid dynamics (CFD) method and the Euler–Euler double-fluid model, the new sand fences’ windproof effect and airflow features are simulated under different porosities and spacings, and the optimal configuration parameters are selected. The new sand fence has better windproof performance and practical significance than double-row reed and double-row nylon net fences. The new sand fences with a porosity of 0.3–0.4 and spacing of 28 H provide a longer protection range and a better wind protection effect. Considering the serious sand damage in China’s Taklamakan Desert, the new fences’ impact on sand buildup is examined. The combined sand fences have powerful sand blocking and accumulation effects, even though there is only a small quantity of sand accumulation on the leeward side of the second row. The sand particles primarily settle between sand fences in the center and rear areas. The combination of sand fences made of different materials combines the advantages of both, improves the construction efficiency and service life, and provides a more economical and efficient sand barrier arrangement for the arrangement of wind and sand-blocking facilities around railroads and highways in desert areas.

1. Introduction

Northwest China is deeply inland, with an arid climate, little rainfall, sparse vegetation, a harsh natural environment, and a wide distribution of desert and Gobi areas. Many natural sand sources and extremely windy weather areas are formed in this natural environment. Frequent windy weather causes serious wind–sand disasters in the desert and the railroads and roads crossing the desert, resulting in many property losses [1]. Under the influence of the wind, sand is discharged into the atmosphere to create a wind–sand flow, which is one of the important factors causing soil erosion, building erosion, formation of ripples and morphological dynamics of dunes, and propagation of desertification. In desert areas, wind erosion and sand accumulation affect traffic and roads more [2]. Wind erosion is an important factor causing wear and tear of railroad tracks and train surface; track and car bodies are damaged by wind and sand erosion, reducing the service life; sand accumulation leads to track burial under the joint action of crosswind, and the risk of derailment and overturning will be increased when the train is running [3]. The main technical means of wind and sand management include protective forests, sand grasses, sand fences, wind retaining walls, sand fence nets, straw checkerboard fences, etc. Among them, mechanical sand fences are widely used in sand control engineering facilities for their low cost, easy maintenance, environmental protection, no pollution, and better windproof performance. Many scholars have studied the protective characteristics of sand fences in previous studies, mainly divided into sand-blocking structures and sand-fixing structures according to the sand control function. Most of the research on sand-blocking structures is based on wind-blocking walls, wind fences, high vertical sand fences, and sand-blocking nets. By analyzing and discussing the flow field characteristics of sand-blocking structures on the windward and leeward sides under different arrangement methods, different opening rates, and different topography, the most suitable combination of arrangement spacing and opening rates are derived according to the analysis of flow field characteristics to pursue the ideal wind- and sand-blocking effect [4,5,6]. Sand blocking and sand fixing in desert areas is still an important means of desertification control at the present stage, and the adoption of a more diversified approach to improve the efficiency of sand control and the economy of sand control is challenging.
In previous studies, most of the studies were conducted with double rows of the same material structure, and there were fewer studies on the combination of windproof structures of different materials in multiple rows, each of which has its advantages and characteristics [7,8,9]. To the best of the authors’ knowledge, there are fewer studies on the changes in the aerodynamic properties of the flow field as well as the laws of wind and sand movement for the coupling of sand barriers of different materials, and further prediction and analysis of whether the process of cross-arrangement of multiple sand barriers produces a better use of the effect is also worthy of attention.
This paper compares a reed sand fence with a nylon net sand fence. As shown in Figure 1, reed straw is relatively easy to obtain in Xinjiang, with significant economic benefits. As shown in Figure 2, a nylon net sand fence has a long service life, high construction efficiency, and can be recycled [10]. In Table 1, the differences and advantages present in the novel setup of this study are compared with conventional nylon net sand barriers and reed sand barriers. This paper will study the net wind and sand-containing fields of two different material sand fences. This paper will then analyze the flow field characteristics, effective protection distance (EPD), and sand accumulation to investigate whether different combined sand fences have better adaptability and practicality. The combination of different types of sand fences can achieve the complementary advantages and disadvantages of both, considering the economic cost, construction efficiency, effective life, and other factors in the construction process, providing certain suggestions and references for the arrangement and selection of sand control and sand fixation projects along railroads, highways, and other routes.
The Hotan–Ruoqiang railway is in Hotan Prefecture and Bayin Guoleng Mongolian Autonomous Prefecture in southern Xinjiang Uygur Autonomous Region, China, with a length of 825.476 km. It is an important traffic artery in southern Xinjiang. The Helo Railway officially started in December 2018. It officially operated in June 2022, and took three and a half years to complete, marking the successful completion of the first desert railway loop project in China and the world. The roadmap is shown in Figure 3. The Taklamakan Desert, the second floating desert on Earth, has an unusually dry climate with more wind than rain, a wide difference in temperature between day and night, little vegetation, many sand sources, and frequent sandstorms, which have posed significant difficulties for building and running the railway. The sand control facilities are shown in Figure 4. According to the data of the weather stations distributed on the southern margin of the desert by Wang et al. [11] and from the wind direction rose diagram of the southern margin of the Taklimakan Desert as shown in Figure 5, it can be seen that the main sand-driving winds (wind speed above 5 m/s) in Hotan and Minfeng areas are WNW, W, and WSW. In the Ruoqiang and Qiemo areas, the main wind direction is NE and ENE, and the installation of sand fences should be perpendicular to the direction of the incoming wind as far as possible to enhance the efficiency of sand protection. The wind speed variation in the Taklamakan Desert refers to the maximum wind speed and wind direction in June at the monitoring station in Tazhong. The average range of maximum wind speed at the monitoring station is 5.7–15.5 m/s, and the maximum wind speed is 22 m/s. The average maximum wind speed in the hinterland of the Taklamakan Desert is generally around 20 m/s, and the maximum wind speed at the mouth of the wind does not exceed 27 m/s [12]. Therefore, three wind speeds of 15 m/s, 20 m/s, and 25 m/s of incoming flow are selected for analysis in this paper.

2. Numerical Simulation

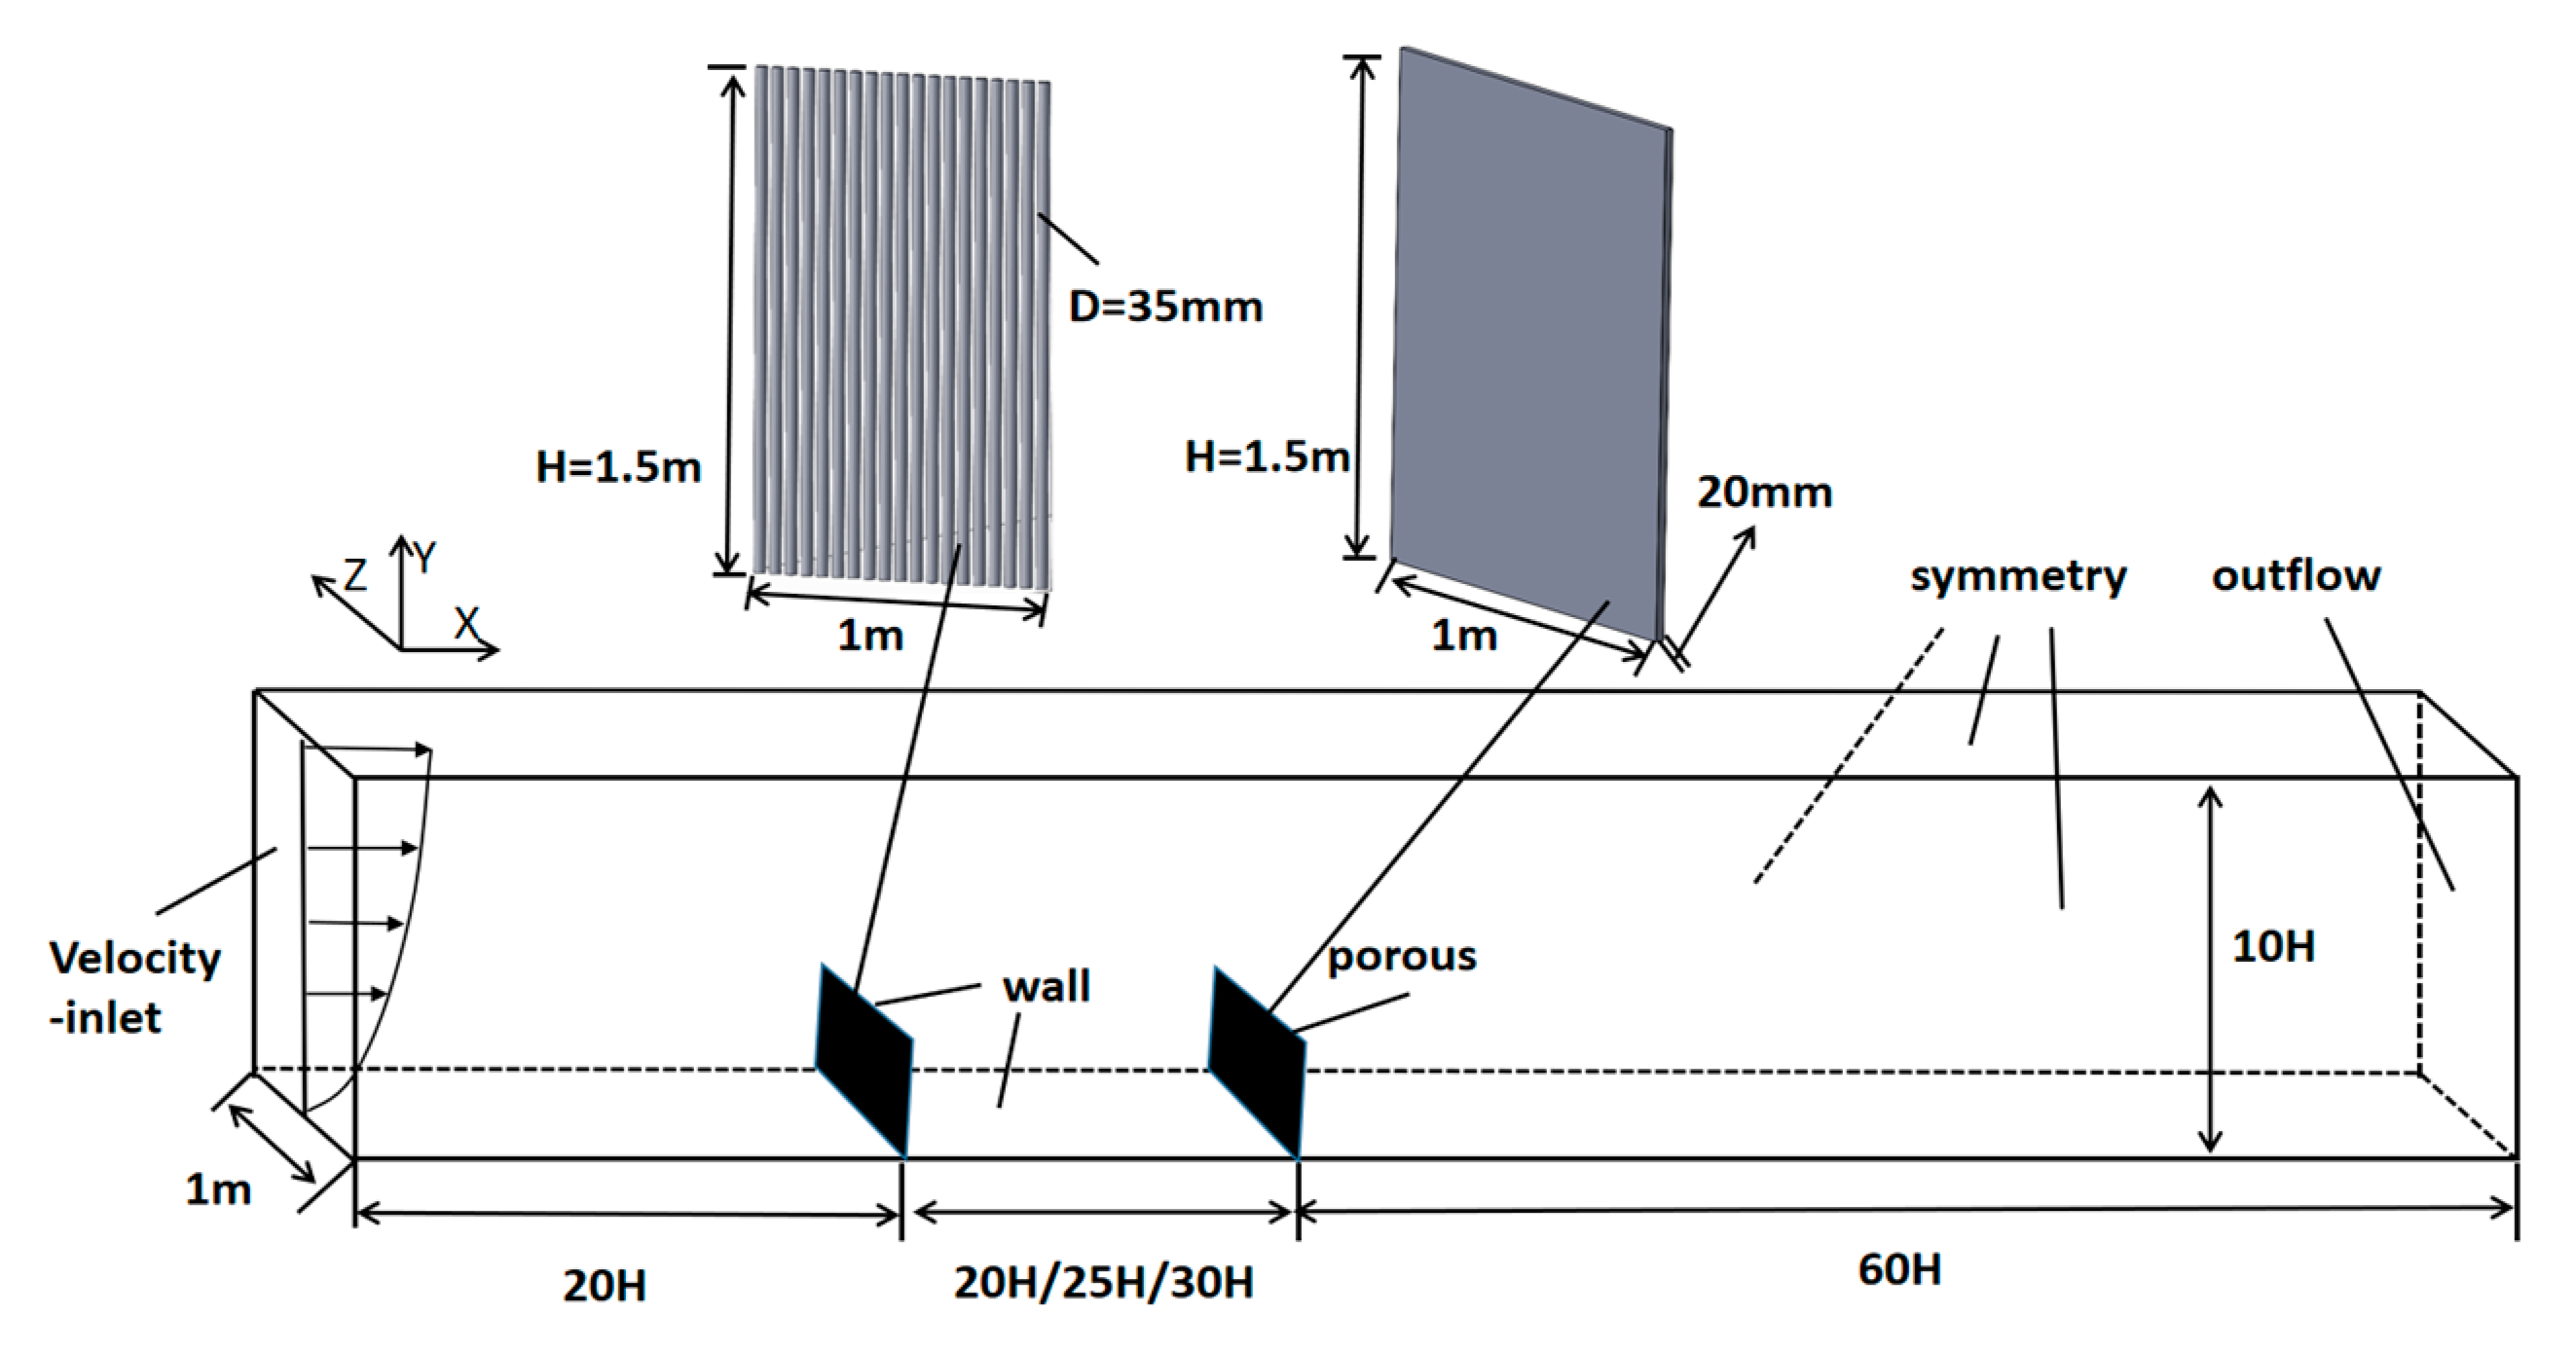
2.1. Geometric Modeling

In the previous double-row sand control structure, it was noticeable that sand would accumulate at the bottom of the first sand control fence and in the middle of the two sand control fences. The sand-blocking performance of the reed sand fence was better than that of the nylon net sand fence, the service life of the nylon net sand fence was much longer than that of the reed sand fence, and the effective use time was longer [13]. Therefore, the reed sand fence is used as the first sand fence, and the nylon net sand fence is utilized as the second sand fence, considering the overall sand fence’s service life and protective impact. Figure 6 shows the calculation domain’s three-dimensional model. The types of sand fences commonly used in railways and the actual porosity are selected [14]. The usual height, H = 1.5 m, was chosen as the height of the sand barrier. The calculation model was chosen as a 35 mm diameter cylinder indicating reeds, and the spacing controlled the porosity parameters. Values of 0.5 and 0.4 were chosen for the reed fence, and 0.4 and 0.3 were chosen for the nylon net sand fence [15]. The entry is 20 H from the first sand fence, which may prevent the first sand fence’s effect on the entering flow. The overall height is 10 H, the length of the calculation domain is 80 H; the breadth is 1 m.

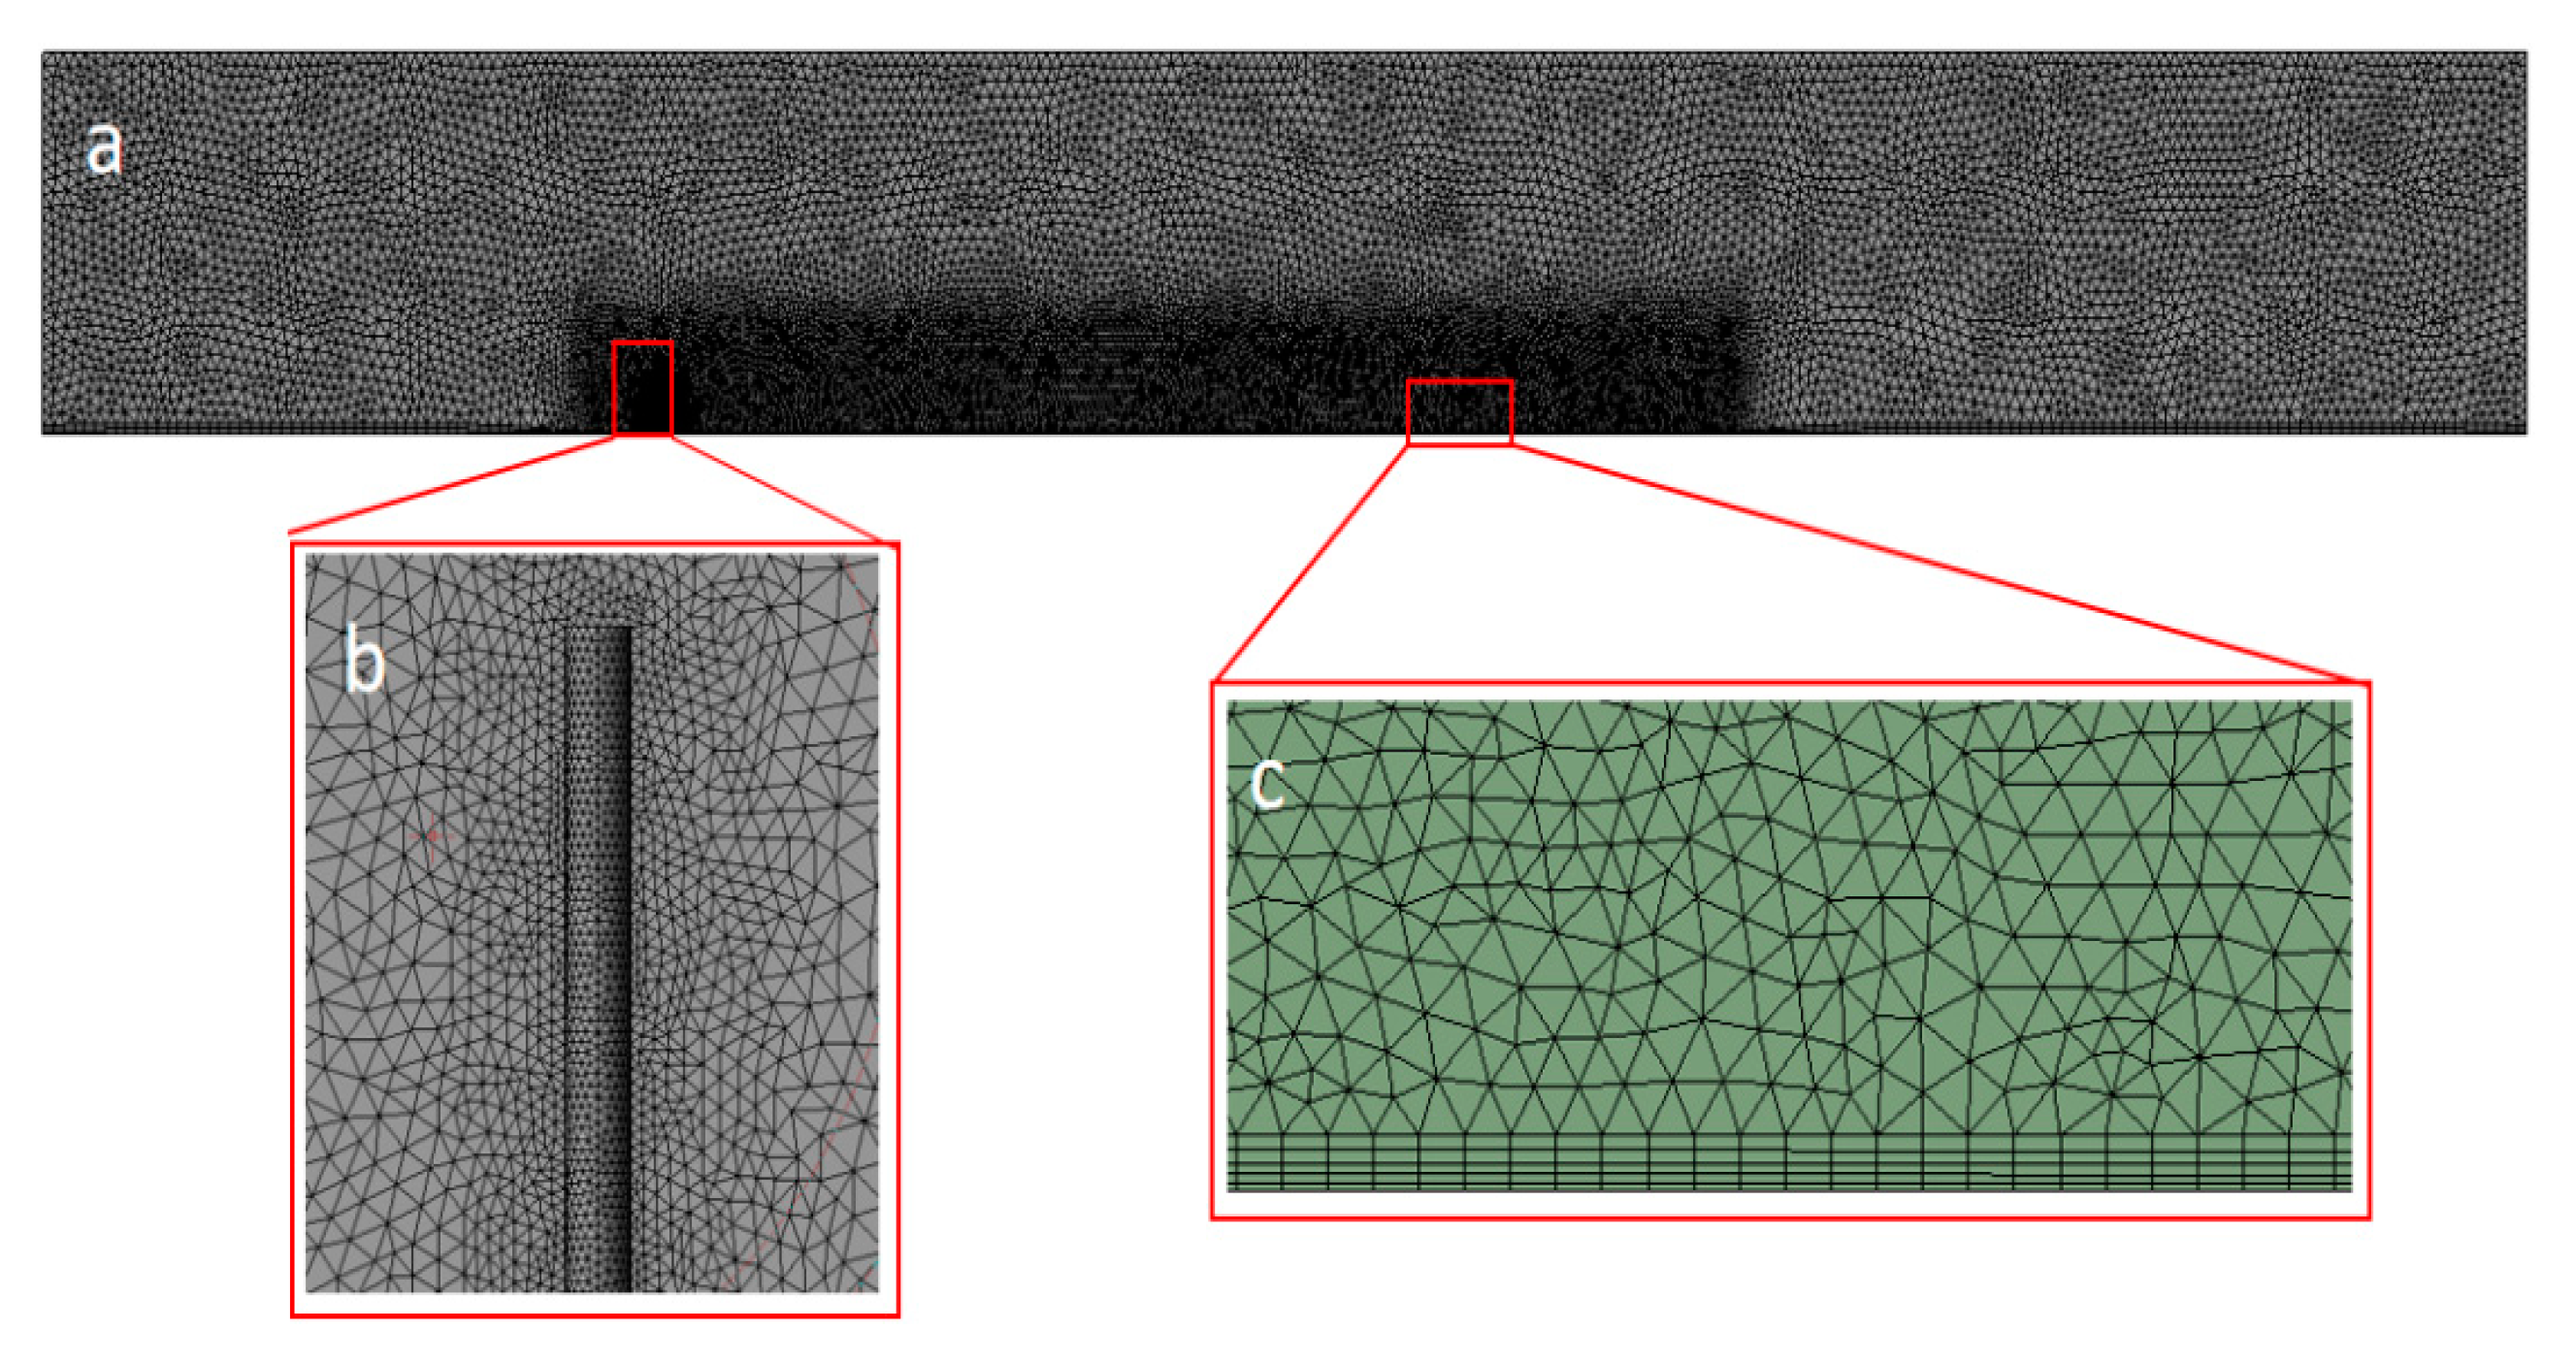
2.2. Mesh Generation

In this study, the model is meshed using a tetrahedral mesh, the number of model meshes is about 12.35 million, and the skewness of the meshes is within 0.75. The mesh elements are encrypted in the mesh close to the sand barriers’ area to turn on the surface capture to fit the surface of the sand barriers efficiently. Smaller meshes are used to populate the possible vortices, return areas, and backflow areas, and a 5-layer prismatic layer mesh is encrypted close to the surface area. Elements are sized from small to large, from the base of the foundation and the surface of the sand barriers to the outer edges. A very fine grid is concentrated at the edges of the foundation. The outer vertical edge of the mesh is larger than 5 times the size of the base of the foundation. Thus, the size of the grid in the encrypted area is sufficient to avoid boundary effects on the surface of the sand barrier and the ground [16,17]. The meshing results are shown in Figure 7.

2.3. Calculation Parameters

The outlet is a pressure outlet with typical atmospheric pressure as the outlet pressure, the inlet is set as velocity inlet, and the logarithmic profile of wind speed is selected for the inlet wind field.
u y = u κ l n y + y 0 y 0
where  u  is the friction speed;  y 0  is the roughness height;  y 0 =  DS/30 (DS is the diameter of sand particles); κ is the von Karman coefficient (0.41 was used in this study); y is the height; u(y) is the wind speed value at the height of y.
The upper boundary, left boundary, and right boundary are set as symmetric boundaries. When the wind field is fully developed, the airflow in the calculation domain is unaffected by the boundary, and the lower boundary and the first sand fence surface are set as non-slip walls. The porous media region is selected to simulate the nylon mesh sand fence, and the interface between the porous media domain and the fluid domain is set as the interface [18]. The settings of the sand field in this study are: sand particle size DS = 0.1 mm, sand density ρs = 2650 kg/m3, viscosity μ = 0.047 Pa·s [19], initial sand volume fraction = 3%, air density ρk = 1.225 kg·m−3, and aerodynamic viscosity μ = 1.789 × 10⁻⁵ Pa·s.

2.4. Control Equations and Solution Setup

The wind speed in the computational domain is less than 100 m/s (Mach number < 0.3). The gas is regarded as an income fluid. The necessary control equations are the continuity equation and momentum equation [20]. The continuity equation and momentum equation are as follows:
u i x i = 0
u j u i x j = 1 ρ p x i + x i μ e u i x j
where the subscript ( i ,   j =  1, 2, 3) represents three directions (x, y, z) and their corresponding velocity components (u, v, w), respectively;  p  is pressure;  ρ  is the air density;  μ e  is effective viscosity ( μ e = μ + μ t );  μ  is the air viscosity coefficient and turbulent (or eddy) viscosity; and  μ t  is calculated by combining  k  and  ε  as follows:
μ t = C μ k 2 ε
In the single wind field simulation, the turbulence model is chosen to be the standard k-ε model, which can better show the rotational, separation, and return characteristics of the airflow in the study of the flow field characteristics around the sand fence, and the feasibility of this turbulence model has been confirmed in previous studies [21,22,23,24,25,26]. The wind–sand flow model is simulated using the Euler-Euler model and the Realizable k-ε turbulence model, which solves the velocity and pressure fields by the COUPLE algorithm, and the accuracy of the calculated residuals is set to 10−6. The COUPLE algorithm has fast convergence speed, high calculation accuracy, and good robustness.
For verifying the windproof effect of the sand barrier, the windproof coefficient (RC) is selected to represent the horizontal speed reduction efficiency on the leeward side of the sand barrier at a given height (H) and distance [27,28]. The formula used is as follows:
R C x , z = 1 u x , z u 0 x , z
where  R C x , z  is infinite wind protection coefficient, the subscript x is the distance of the measurement point from the sand barrier on the leeward side of the sand barrier, the subscript z is the vertical height from the ground,  u x , z  is the horizontal wind speed at the detection point, and  u 0 x , z  is the horizontal wind speed at the same height as the measurement point when there is no sand barrier.

3. Comparative Verification of Simulation Settings

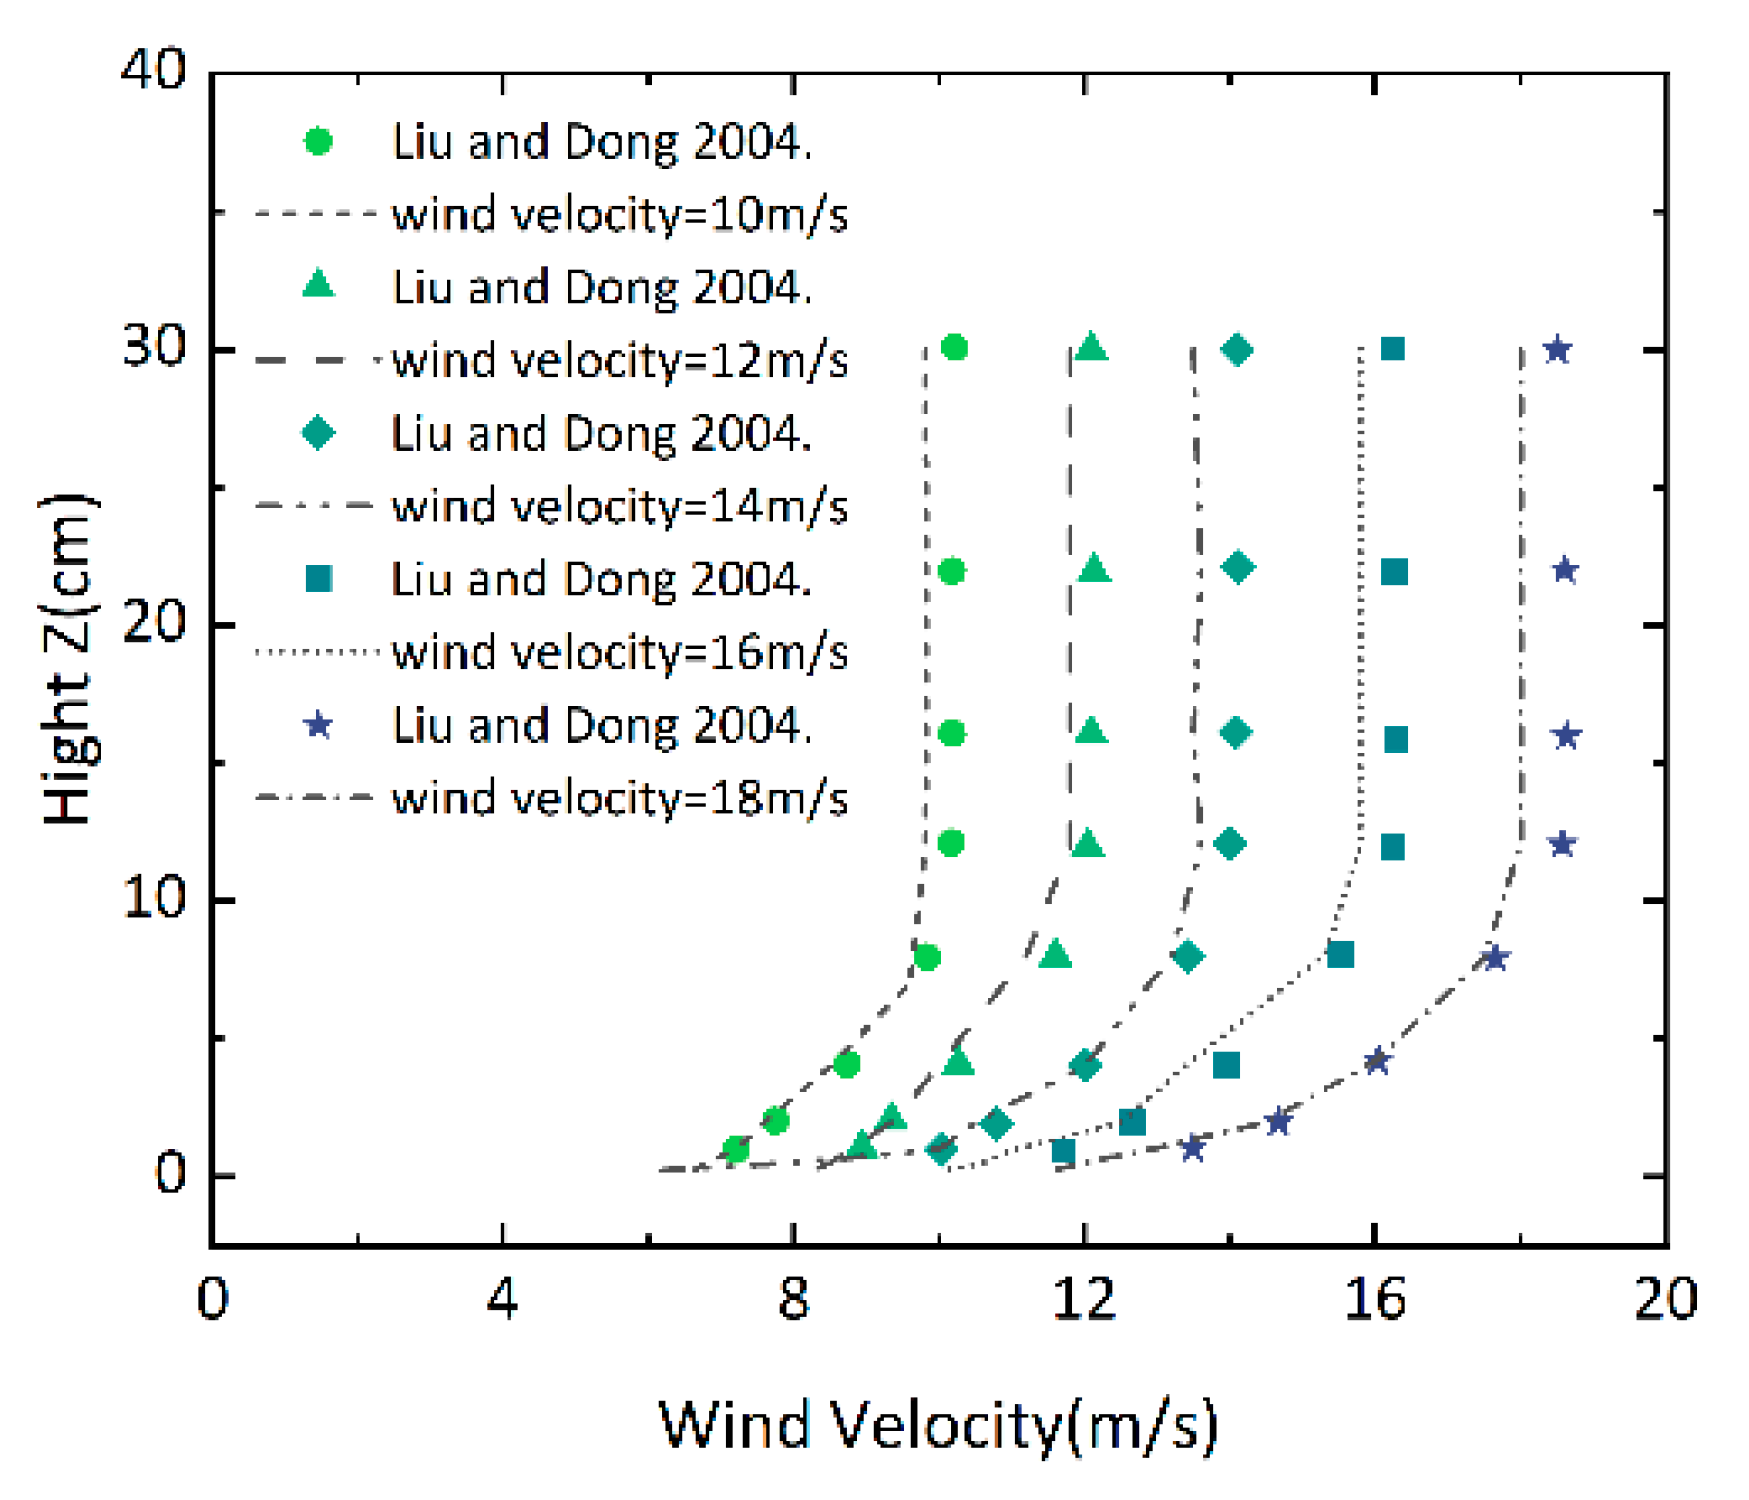
3.1. Validation of the Single Wind Field Setup

To verify whether the wind field data are reliable under this computational setting, the wind tunnel experimental results of previous research by Liu [29] are simulated in this paper. According to these references, the corresponding conditions are selected as follows: the height of the sand barrier is H = 8 cm, and the thickness is 0.5 cm; the length and width of the overall calculation domain are 80 H, 2 H, and 10 H, respectively. The distance between the inlet and the sand barrier is 20 H, and the velocity inlet is set to uniform incoming flow with a velocity of 10 m/s. Four groups of different porosities, 0, 0.1, 0.2, and 0.3, were selected for comparison. The shape of the open hole is circular, and the diameter of the open circle is 1 cm. In this comparison experiment, the focus is on the effective wind protection length, which is defined as the distance where the velocity on the leeward side of the sand barrier recovers to 80%. In this paper, the boundary condition settings are used for this experimental simulation and compared with the results of this wind tunnel experiment, and the results obtained are shown in Table 2.
Table 1 shows that the results of this numerical simulation are similar to the experimental results. The errors of the results are within 9%, so the pure wind field model is reasonable, and the corresponding pure wind field study can be carried out subsequently.

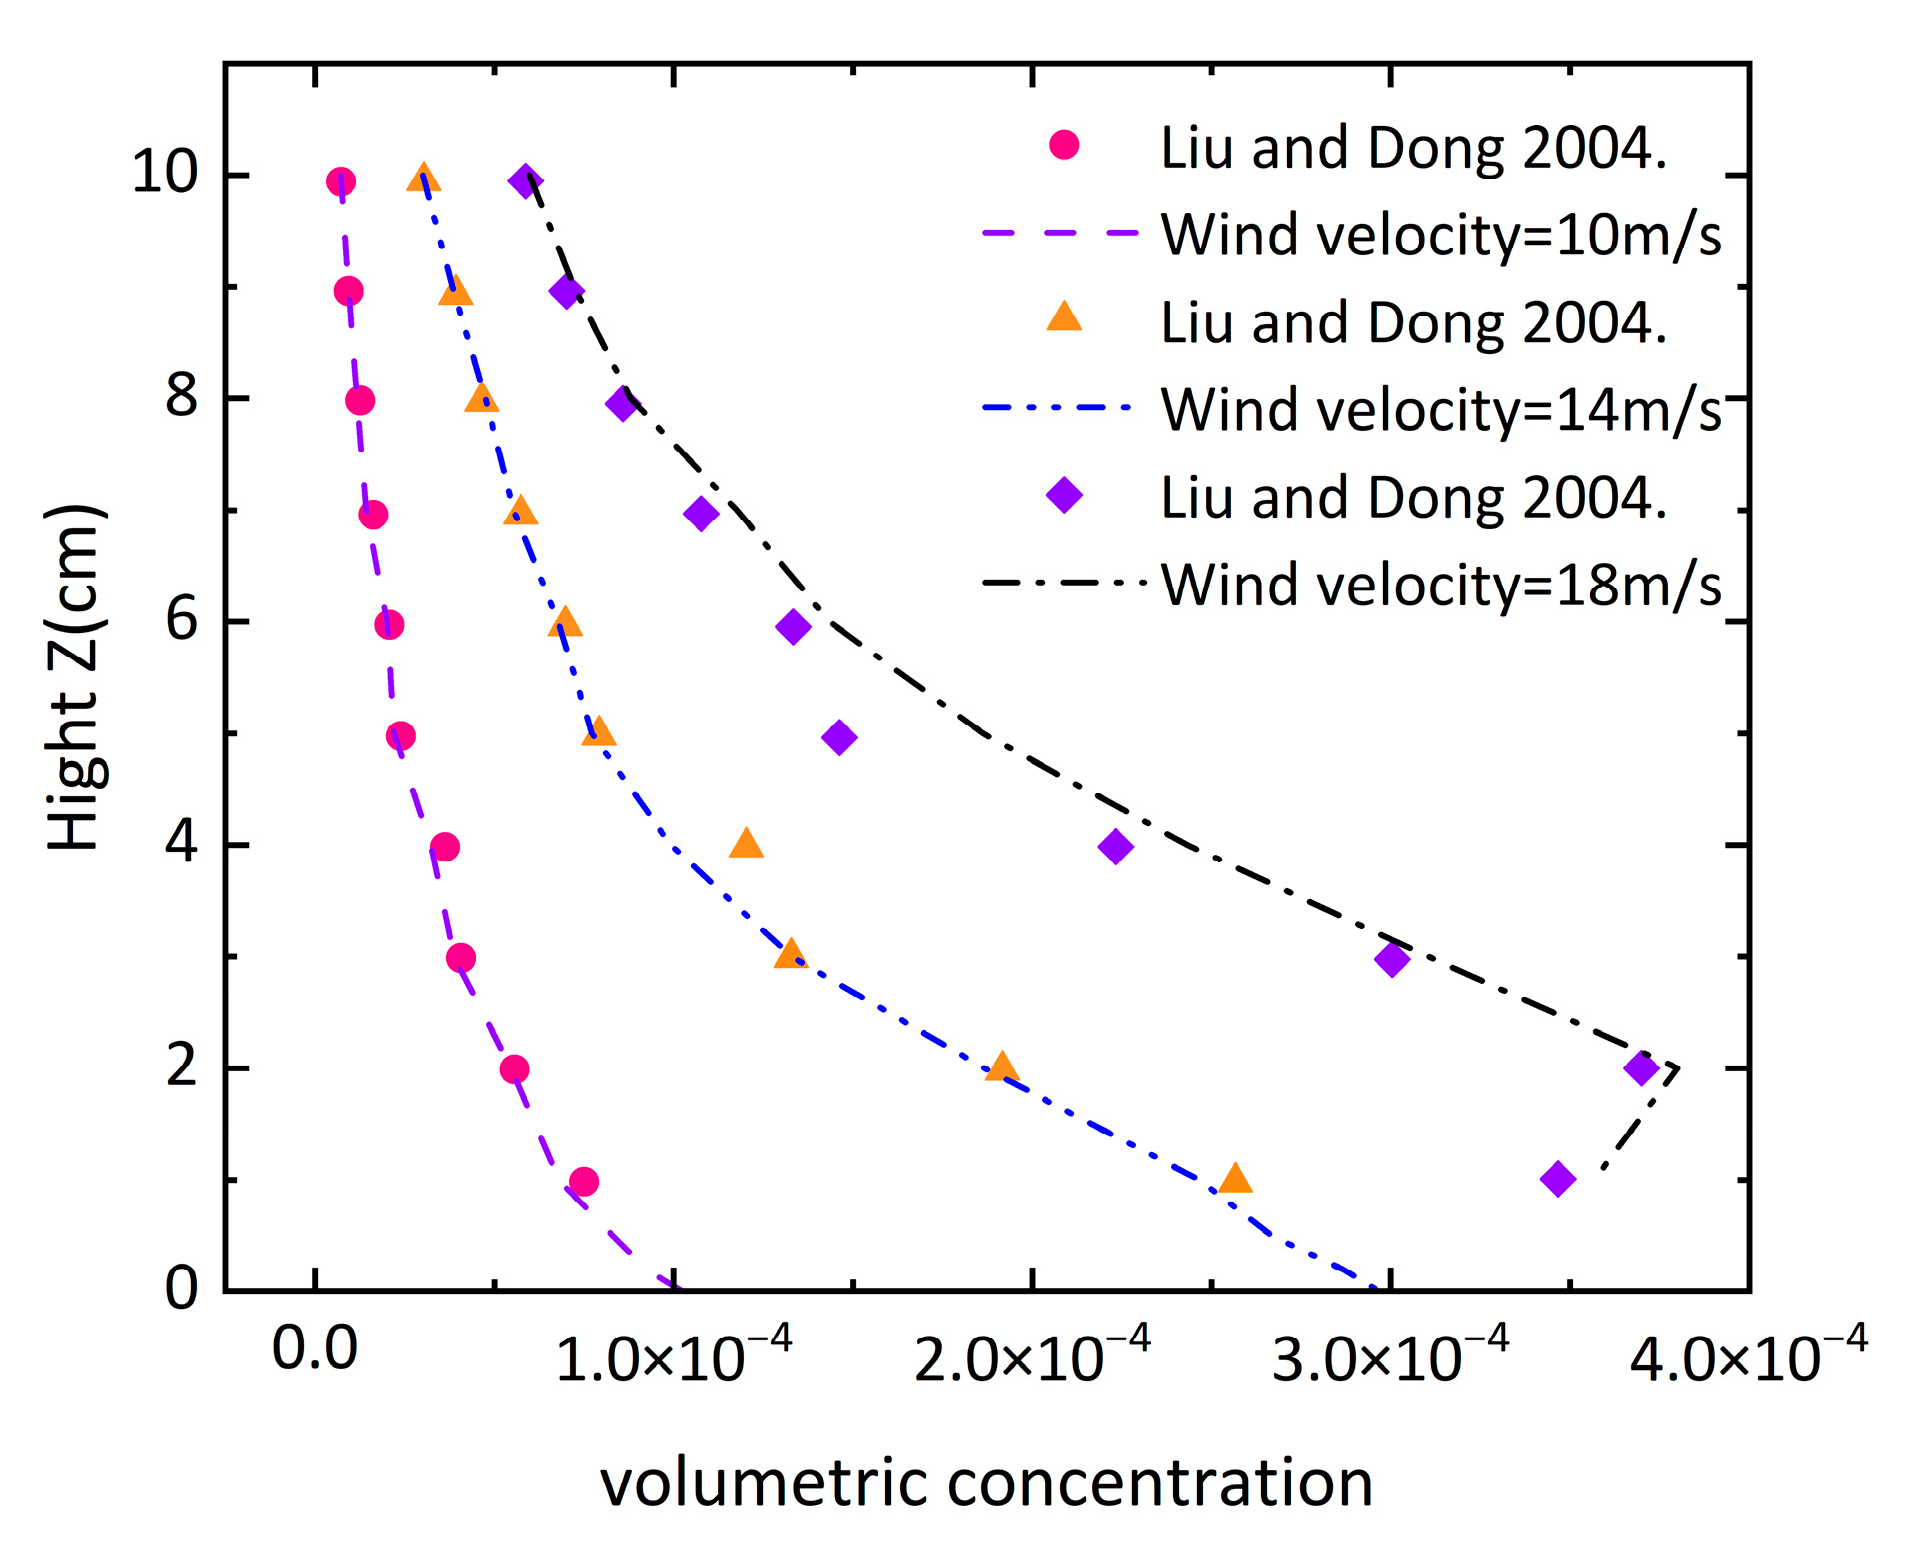
3.2. Validation of Wind–Sand Two-Phase Flow Setup

To verify the reasonableness of this wind–sand simulation setup, this study refers to the wind-blown sand experimental test by Liu et al. [30]. According to the corresponding experimental settings, the length, width, and height of the calculation domain are 16.23 × 1 × 0.6 m. The inlet flow is a uniform wind field, and the wind speeds are 10 m/s, 12 m/s, 14 m/s, 16 m/s, and 18 m/s. The thickness of the sand bed laid at the bottom of the calculation domain is 5 cm, and the diameter of the sand particles is 0.1 mm. The result is as follows.
Figure 8 shows that the wind velocity profiles at speeds of 10 m/s, 12 m/s, 14 m/s, 16 m/s, and 18 m/s are similar to the wind tunnel experimental results, and the error range is within 10%, so the wind velocity characteristics of the sand flow of the model are reasonable. Figure 9 shows that at wind speeds of 10 m/s, 14 m/s, and 18 m/s, the volume fraction of sand concentration at different heights is consistent with the experimental structure of the wind tunnel of Liu et al. [30]. The error range is within 12%, which shows that the model is reasonable in the two-phase flow of wind and sand, and the reason for the difference here may be due to the difference in size between the sand grains used in the experiment and the simulated sand grains, which are acceptable within this range.

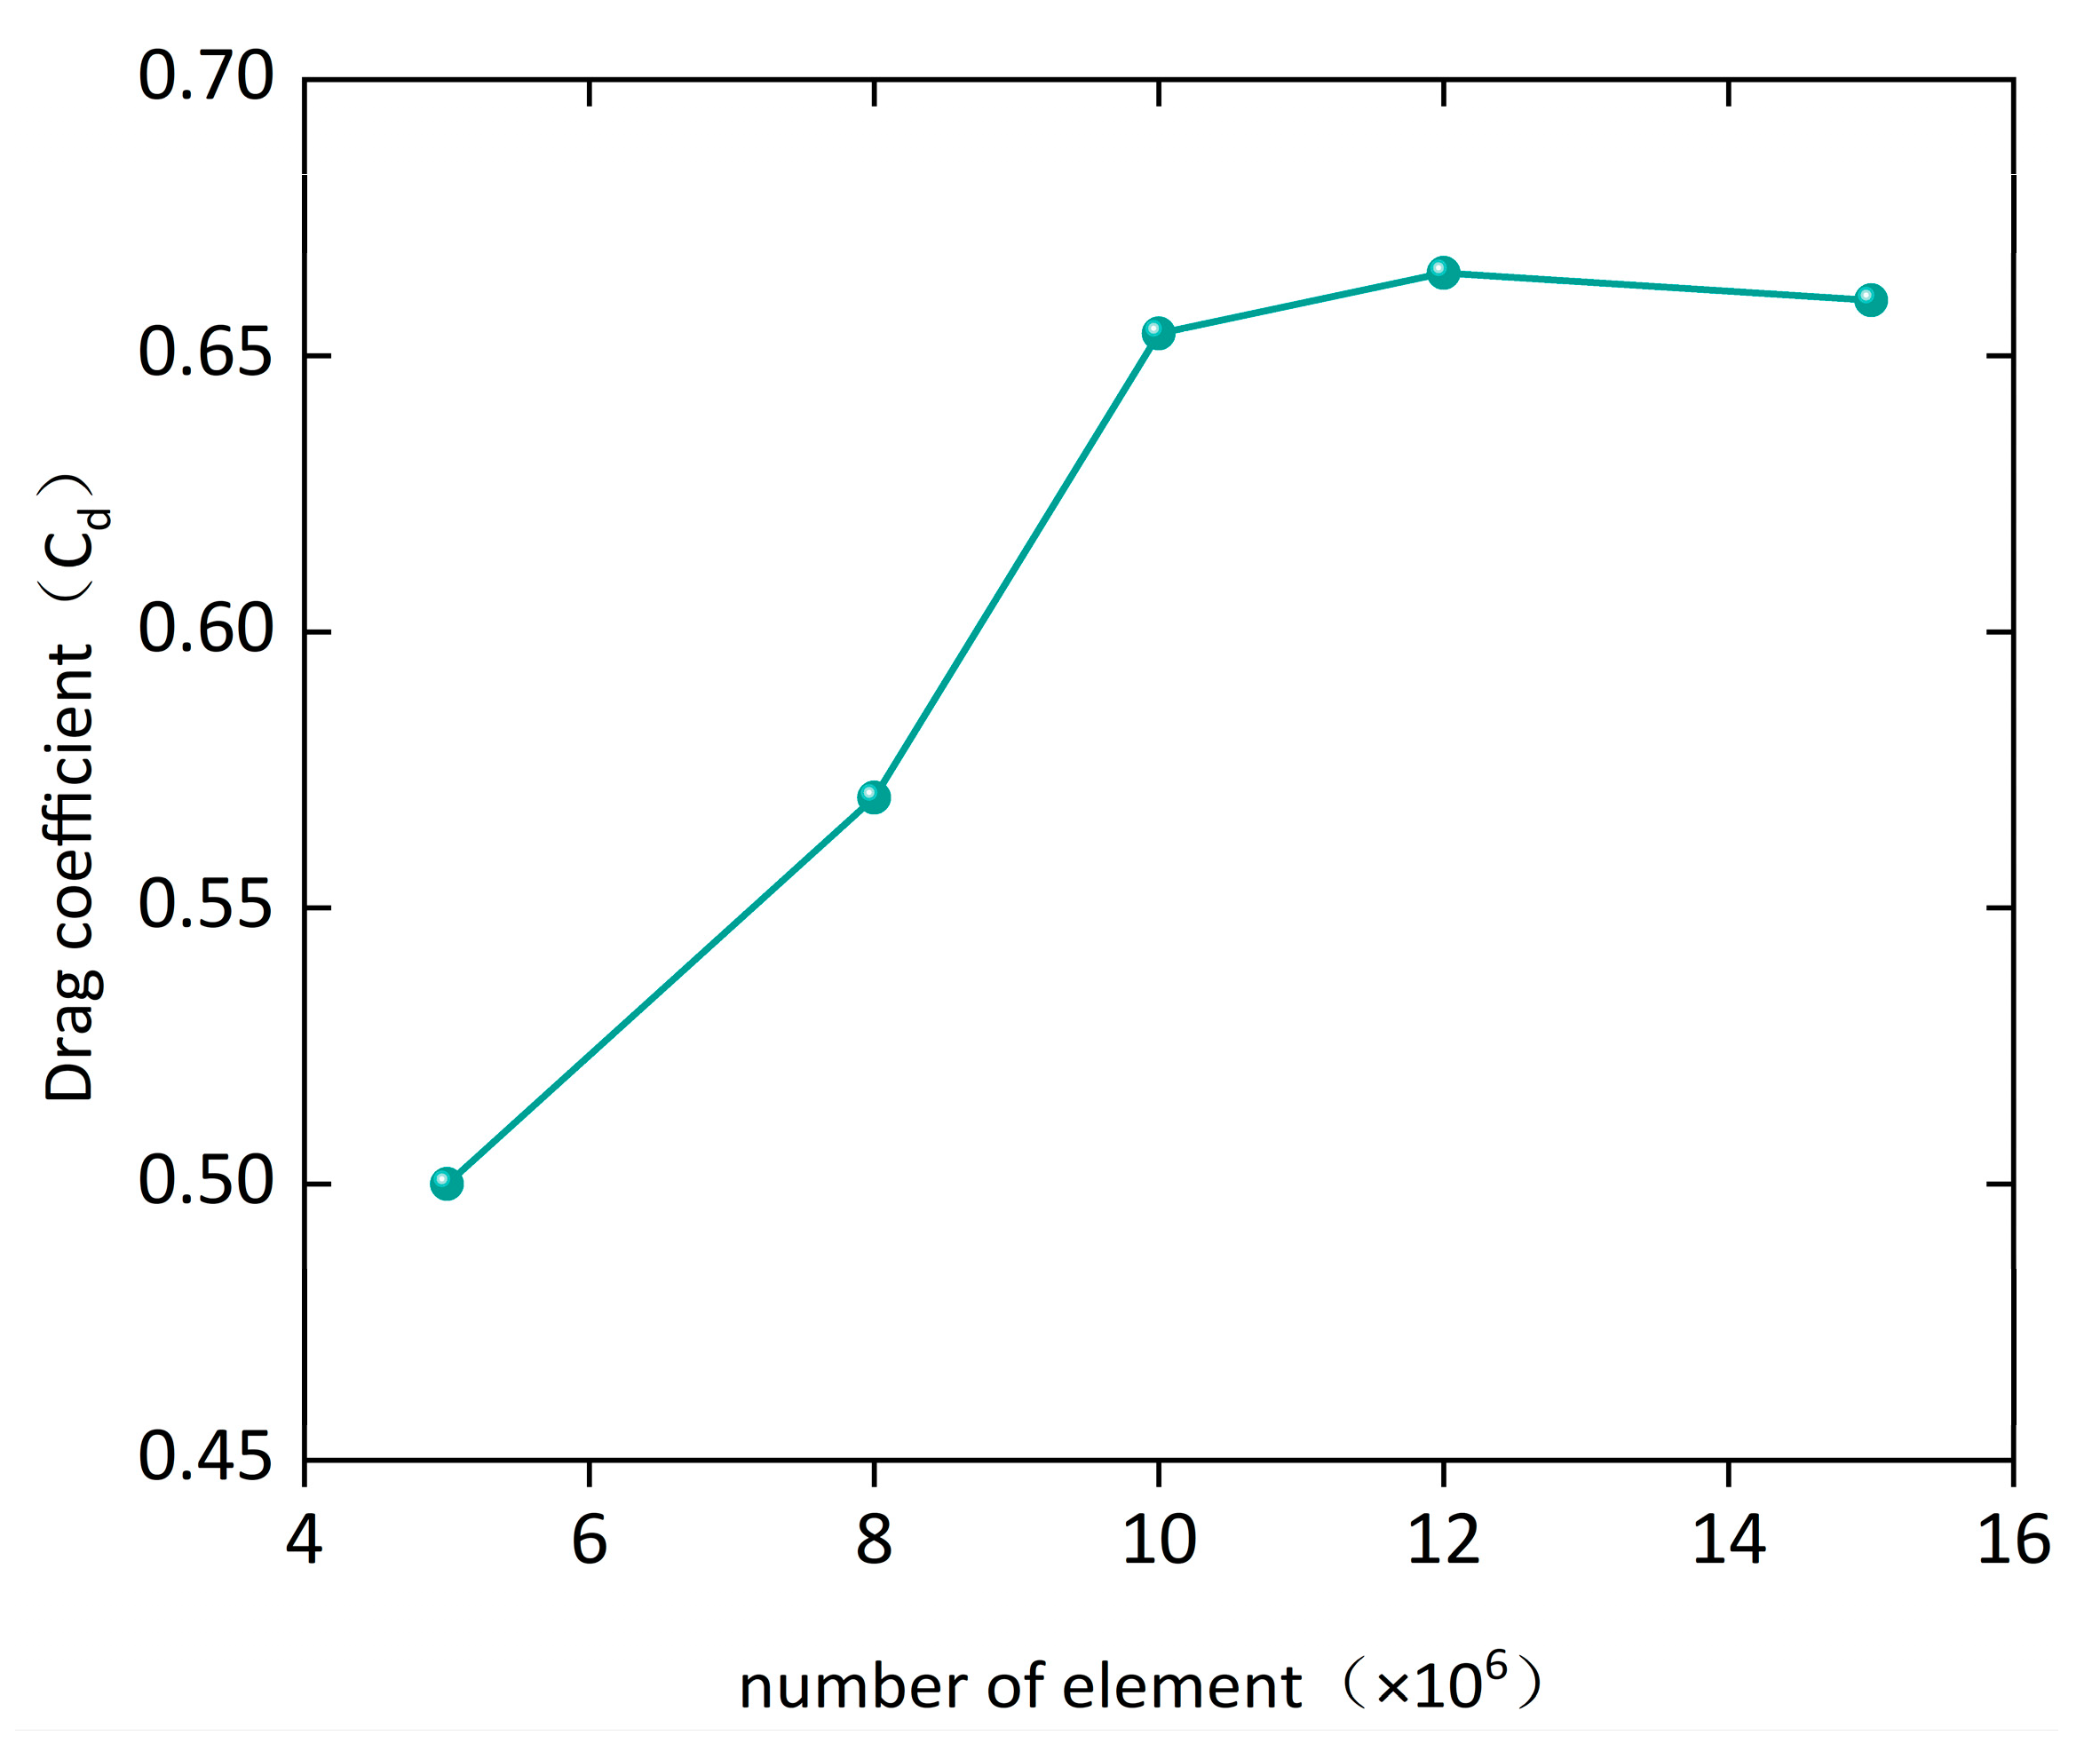
3.3. Mesh Independence

To choose a more economical and reliable number of meshes, numerical simulations of different numbers of meshes are compared in this paper. The minimum and maximum grid sizes are 0.005 m and 0.25 m, respectively, and the growth ratio is 1.1 to provide finer grids near the ground to capture the rapid changes of the flow field in the boundary layer. In this paper, the most reasonable grid is chosen by studying the variation of the sand barrier drag coefficient Cd under the conditions of different numbers of grids (5.21 million, 8.32 million, 10.3 million, 12.35 million, and 15.3 million). The most reasonable number of grids is chosen for the simulation. The results obtained are shown in Figure 10. The results show that by increasing the number of meshes to 12.35 million, there is no significant change, and, therefore, 10.3 million meshes can be used for numerical simulations.
The drag coefficient (Cd) is defined by
C d = p 0.5 ρ V 2
where p is the pressure on the sand barrier; ρ is the density; V is the velocity.

4. Results of Numerical Simulation

4.1. Comparison of Reed–Nylon Net Sand Barrier with Double-Row Reed and Double-Row Nylon Net Sand Barrier

In order to observe whether the combined sand barrier has the flow field characteristics of a double-row reed sand barrier and double-row nylon net sand barrier and whether the combined sand barrier has a better wind and sand barrier effect, the flow field of the sand barrier under the conditions of V = 10 m/s, porosity of 0.3–0.4, spacing of 10 H, and H = 1.5 m is compared and analyzed in this paper.
Taking a wind velocity of 15 m/s, a porosity of 0.3–0.4, and a spacing of 10 H as an example, Figure 10 shows the velocity clouds for the three different configurations of the sand barriers, and there is a clear change in the flow field around the sand barriers. There is a deceleration zone, acceleration zone, and vortex zone around the sand barrier. This is due to the retarding effect of the sand barrier area, which causes the airflow to create a retarding zone on the windward side. When the air passes over the top of the sand barrier, it creates a violent squeeze and separation. However, as the pressure difference in the shear layer forces the flow to curve downwards, the streamlines return to the separation zone as the flow approaches the surface, thus compensating for the portion of the flow that is lost due to entrainment. As a result, an acceleration zone is formed above the sand barriers, while a vortex zone appears on the leeward side. The comparison in Figure 11 shows that the deceleration zone on the windward side of the reed sand barrier is smaller than that on the nylon net barrier. The speed belt on the leeward side of the three types of wind barrier (a), (b), and (c) show regular fluctuation; the distance of the deceleration zone presents (a) > (b) > (c); the area of the acceleration zone and the length of the vortex zone above the sand barrier presents (a) < (b) < (c).
Figure 12 shows that all three types of sand barriers provide good attenuation of surface wind speed, but there are different differences between them. Figure 12a–c shows that the wind speed decreases sharply near the sand barriers, but there is an obvious difference in the first layer of sand barriers after the decline; the three kinds of sand barriers show a “V-shape” trend, which is similar to the horizontal changes in the horizontal direction of the “V-type” or “W-type” trend found by research [31,32]. Figure 11c shows that the nylon net sand barrier’s protection role is similar to the hole plate wind fence. On the leeward side of the flow field, the structure changes drastically and turbulence intensity is high, so the wind speed behind the sand barrier returns to a relatively slow speed, and the wind speed on the leeward side of a certain range shows a sharp increase in the weakening. Figure 12a shows the slow reduction of wind speed on the leeward side of the reed barriers. This is because the incoming wind passes through the bundled reed structure, whose flow field characteristics are similar to those of a cylindrical winding structure, and such a sparse structure results in more airflow passing through the middle of the reed barriers, with a relatively small loss of speed, but with a longer distance of effective wind protection. Figure 12b shows that the wind speed in the first reed sand barriers began to attenuate; the second nylon mesh sand barriers are further weakened, and the protective effect is similar to the double-row nylon mesh sand barriers, while the reed barriers in the wind environment have more toughness and are more durable so that the nylon mesh barriers need to be protected. The second nylon mesh barriers also have better sand-blocking properties so that more sand particles are deposited in the barriers and the larger number of nylon net barriers are also more convenient to rearrange. Therefore, the reed–nylon net barriers have better feasibility in the process of use; they can cope with a more severe wind and sand environment.

4.2. Parameter Optimization of Reed–Nylon Net Sand Barriers

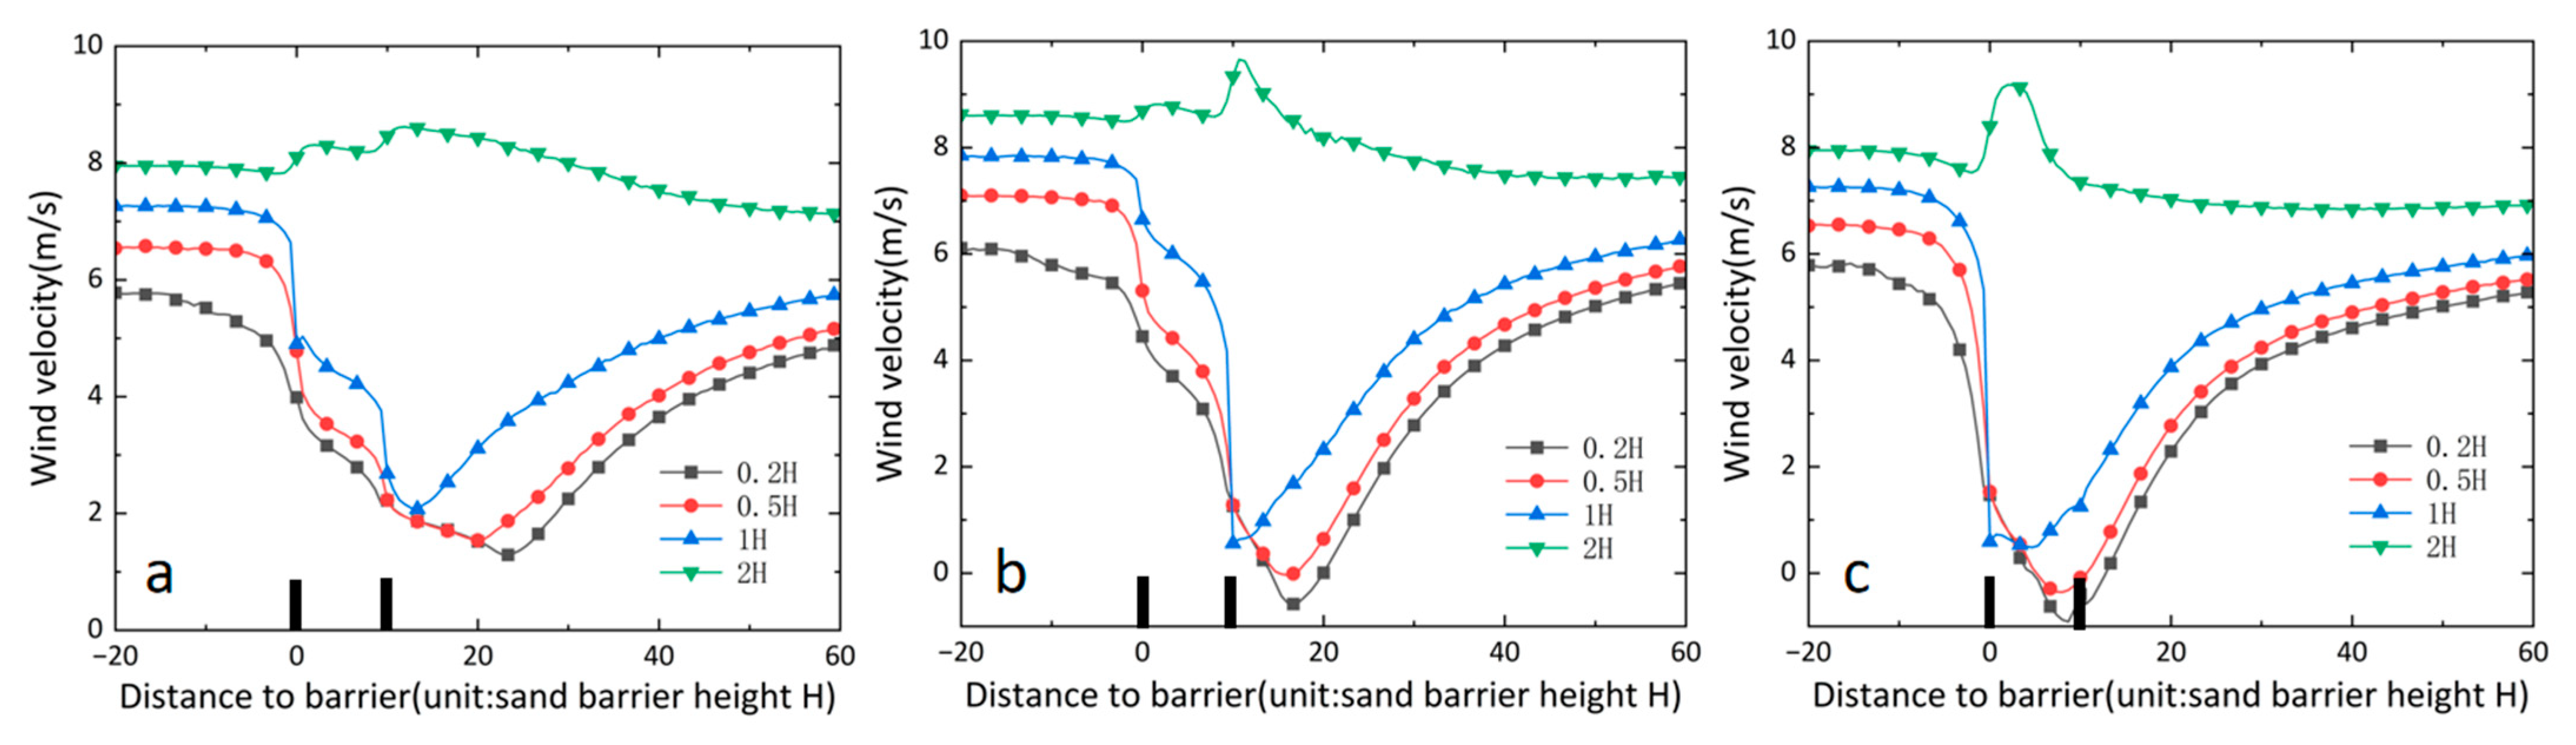
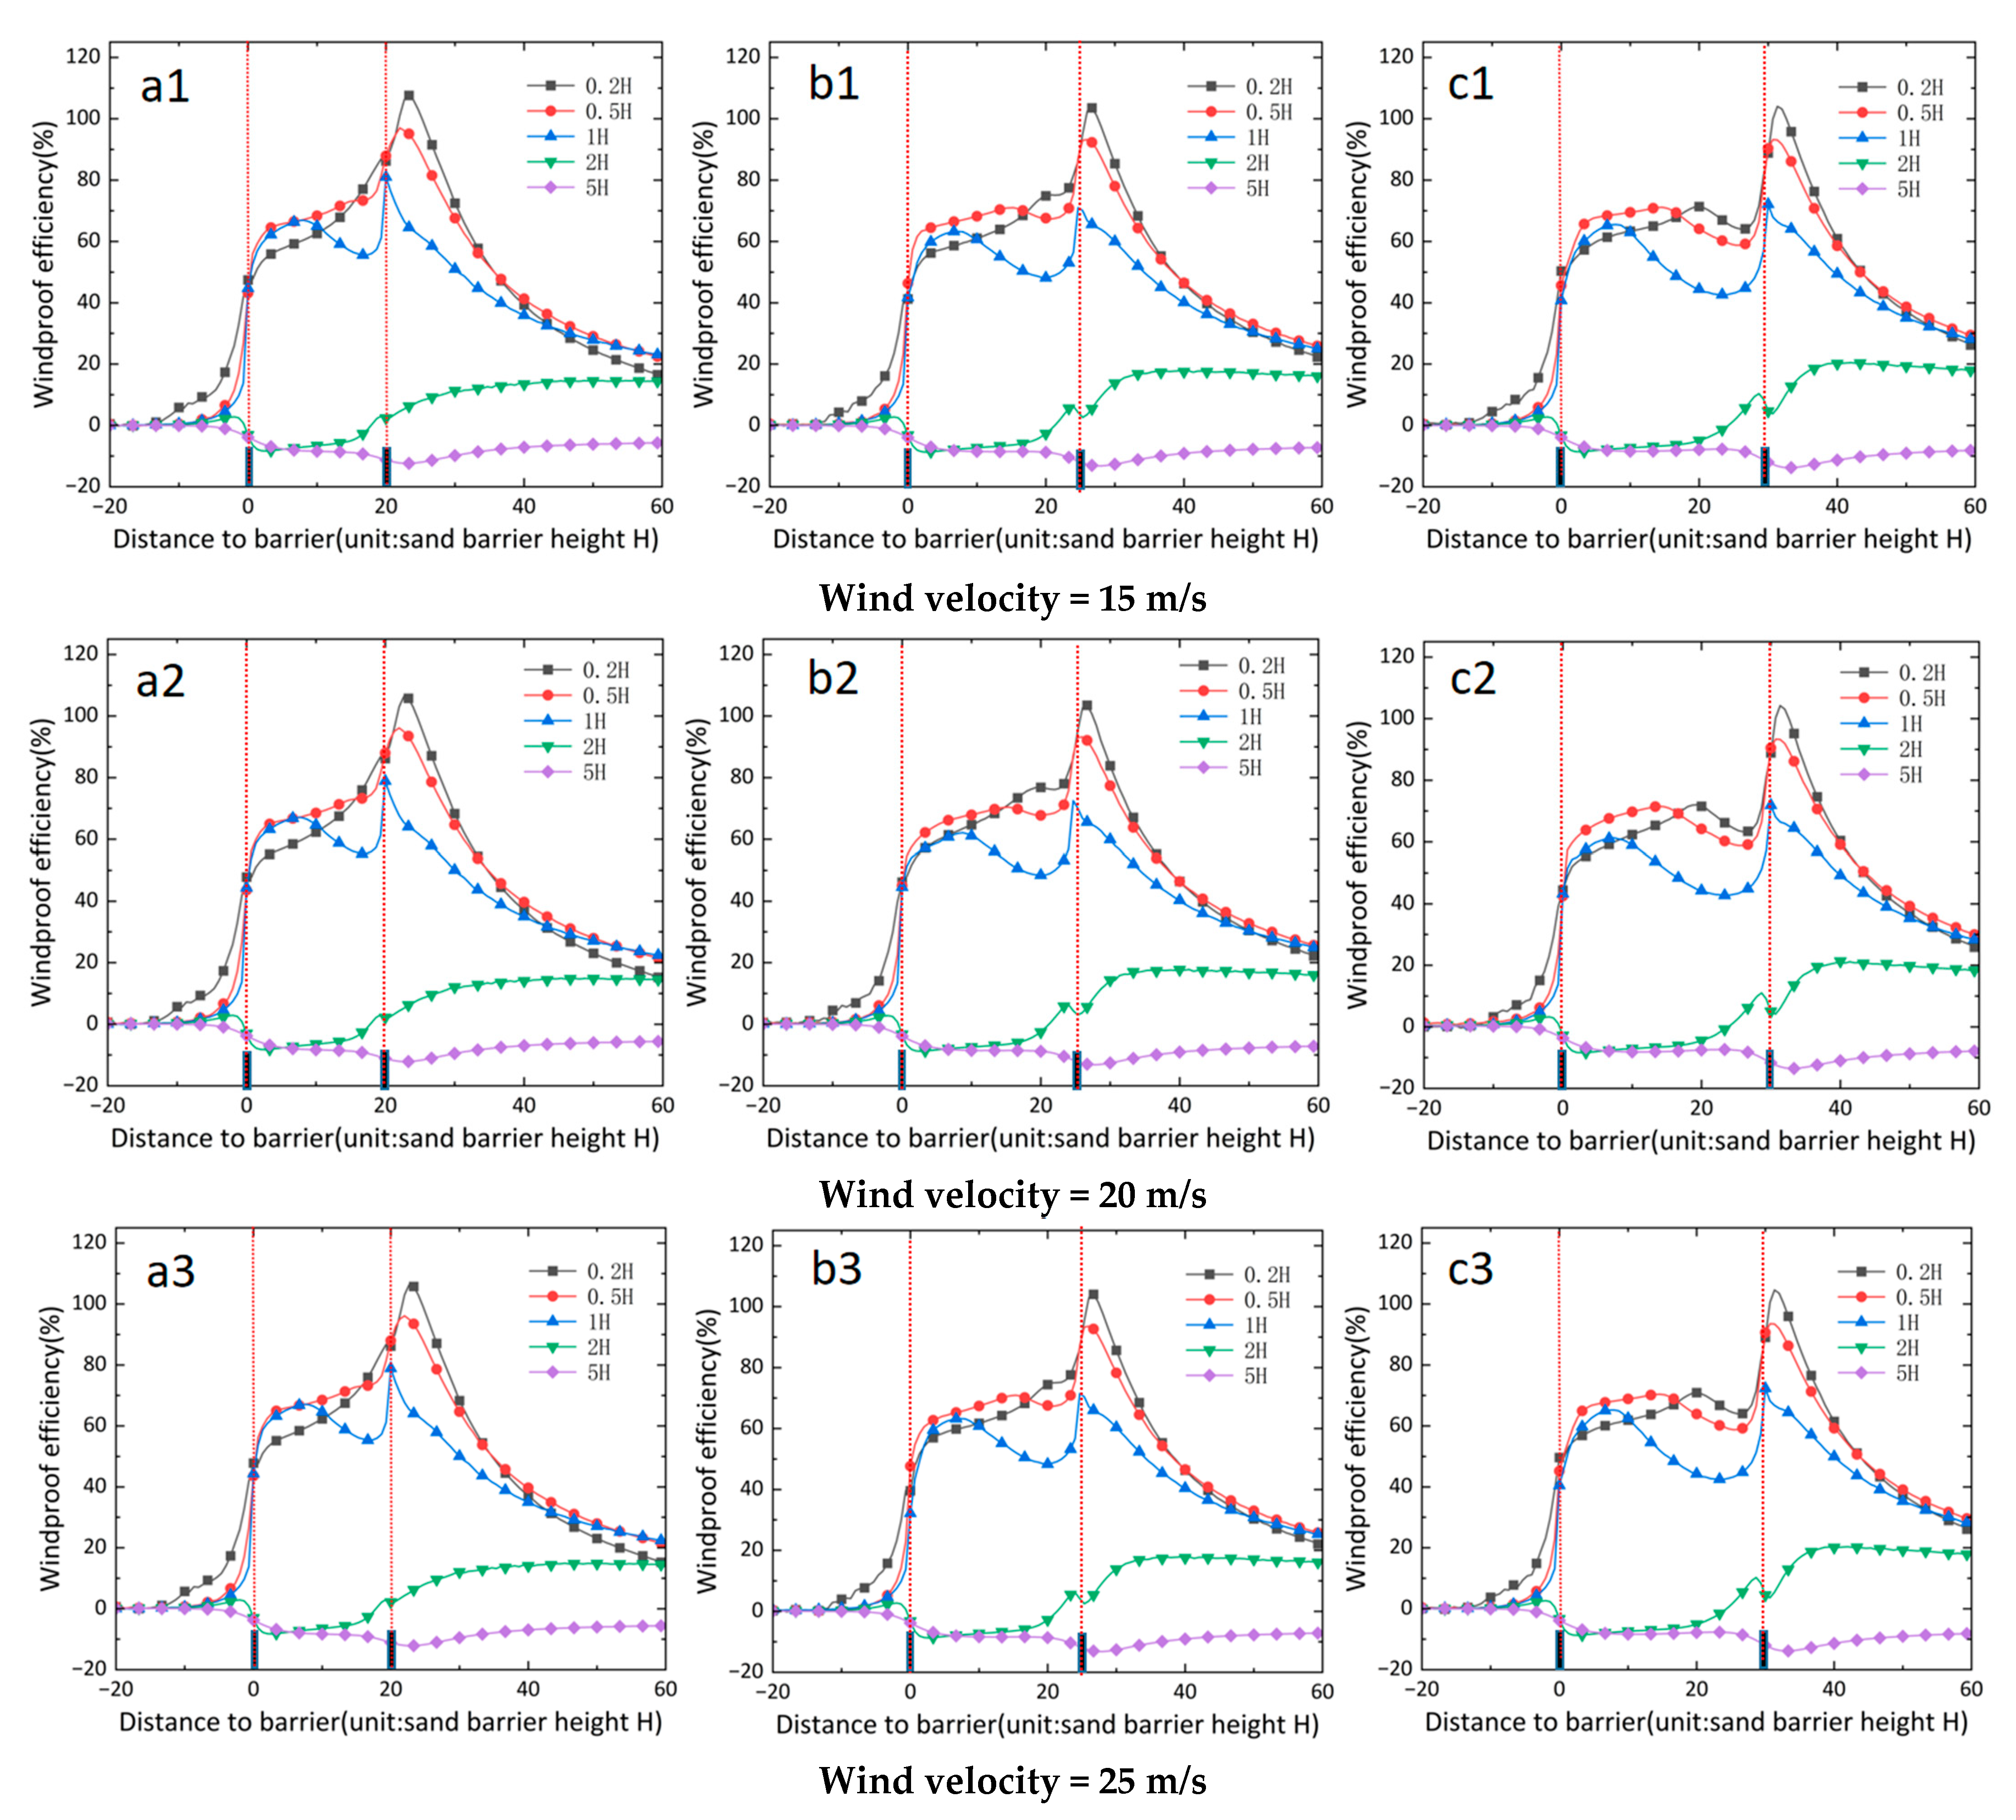
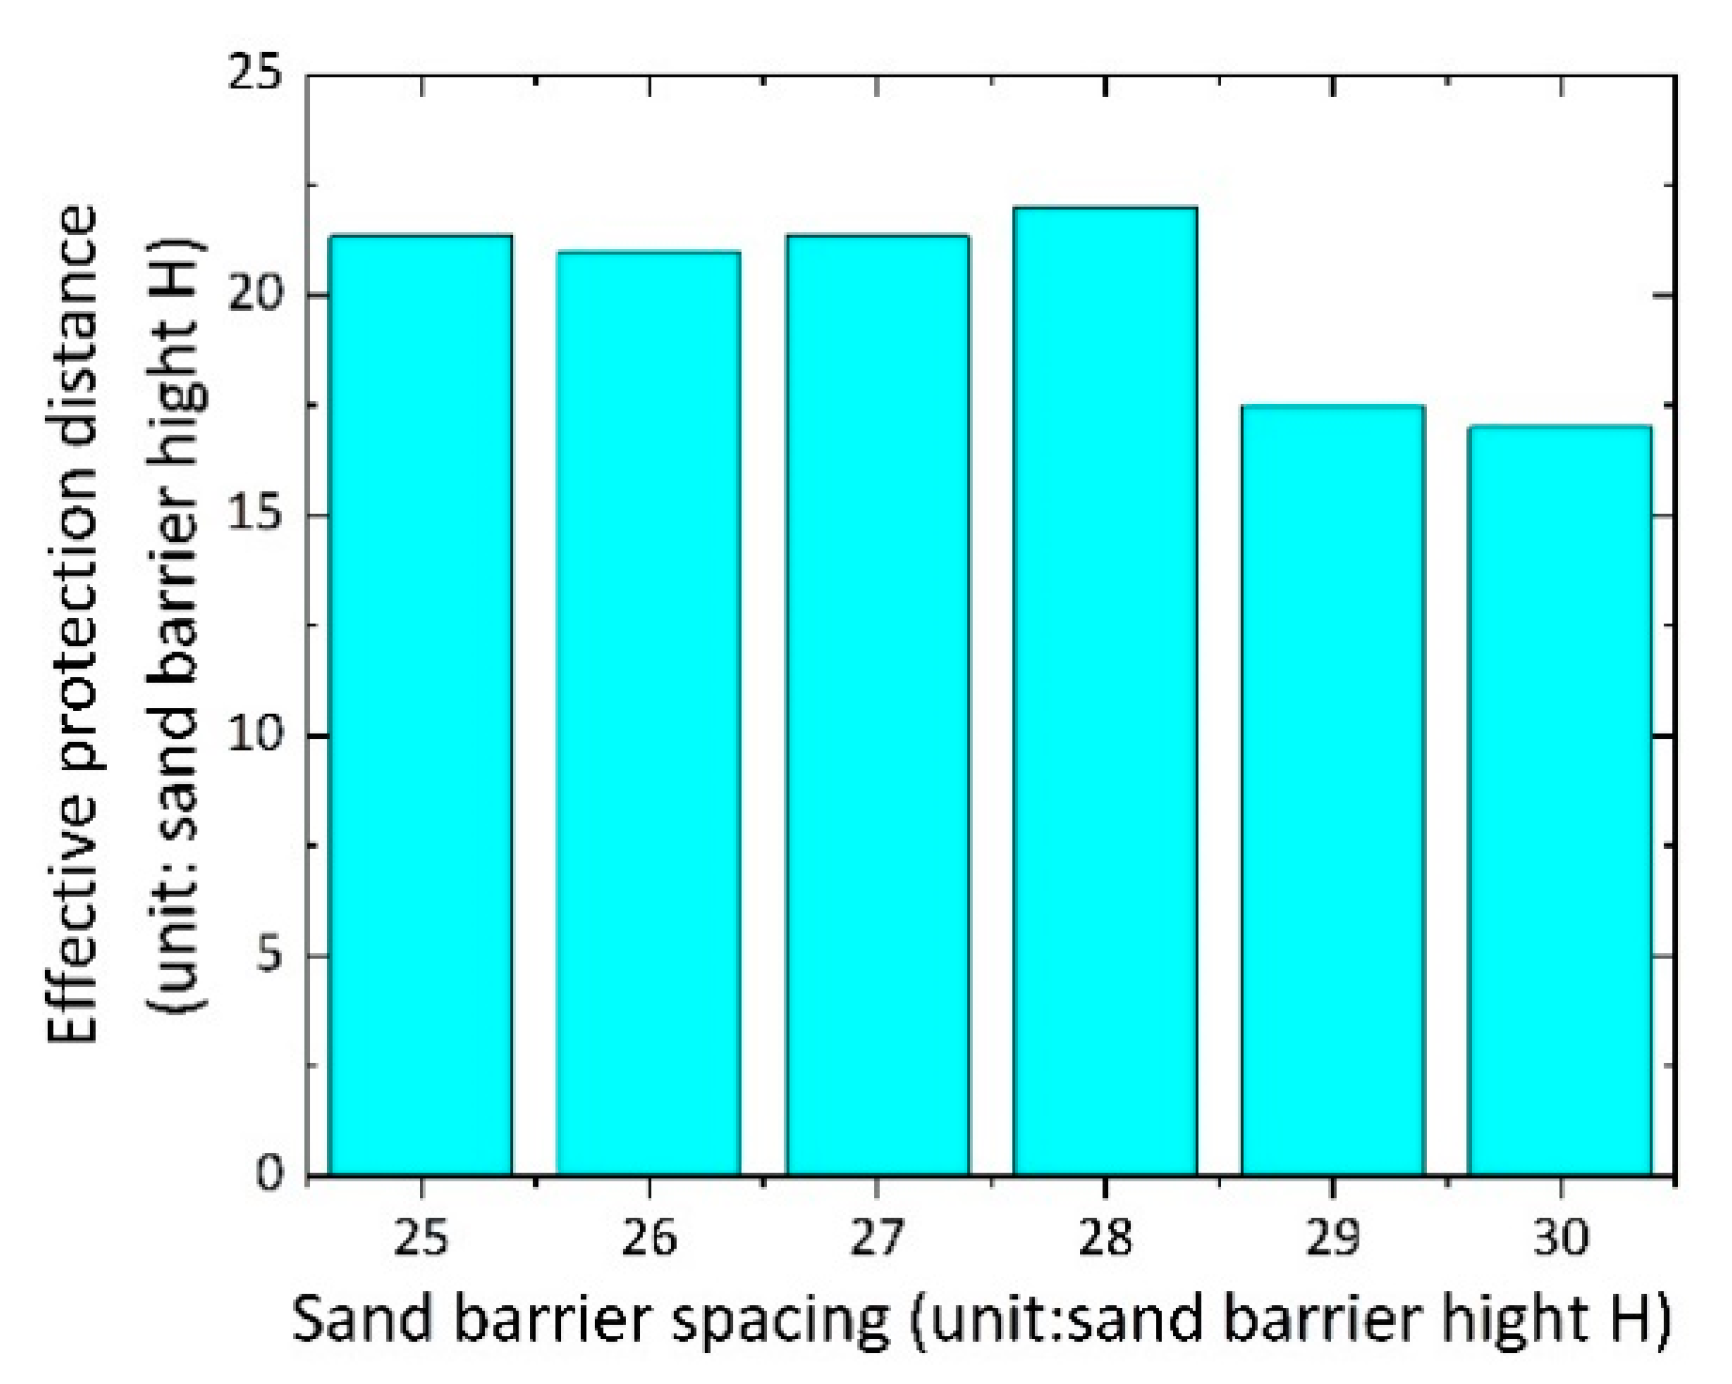
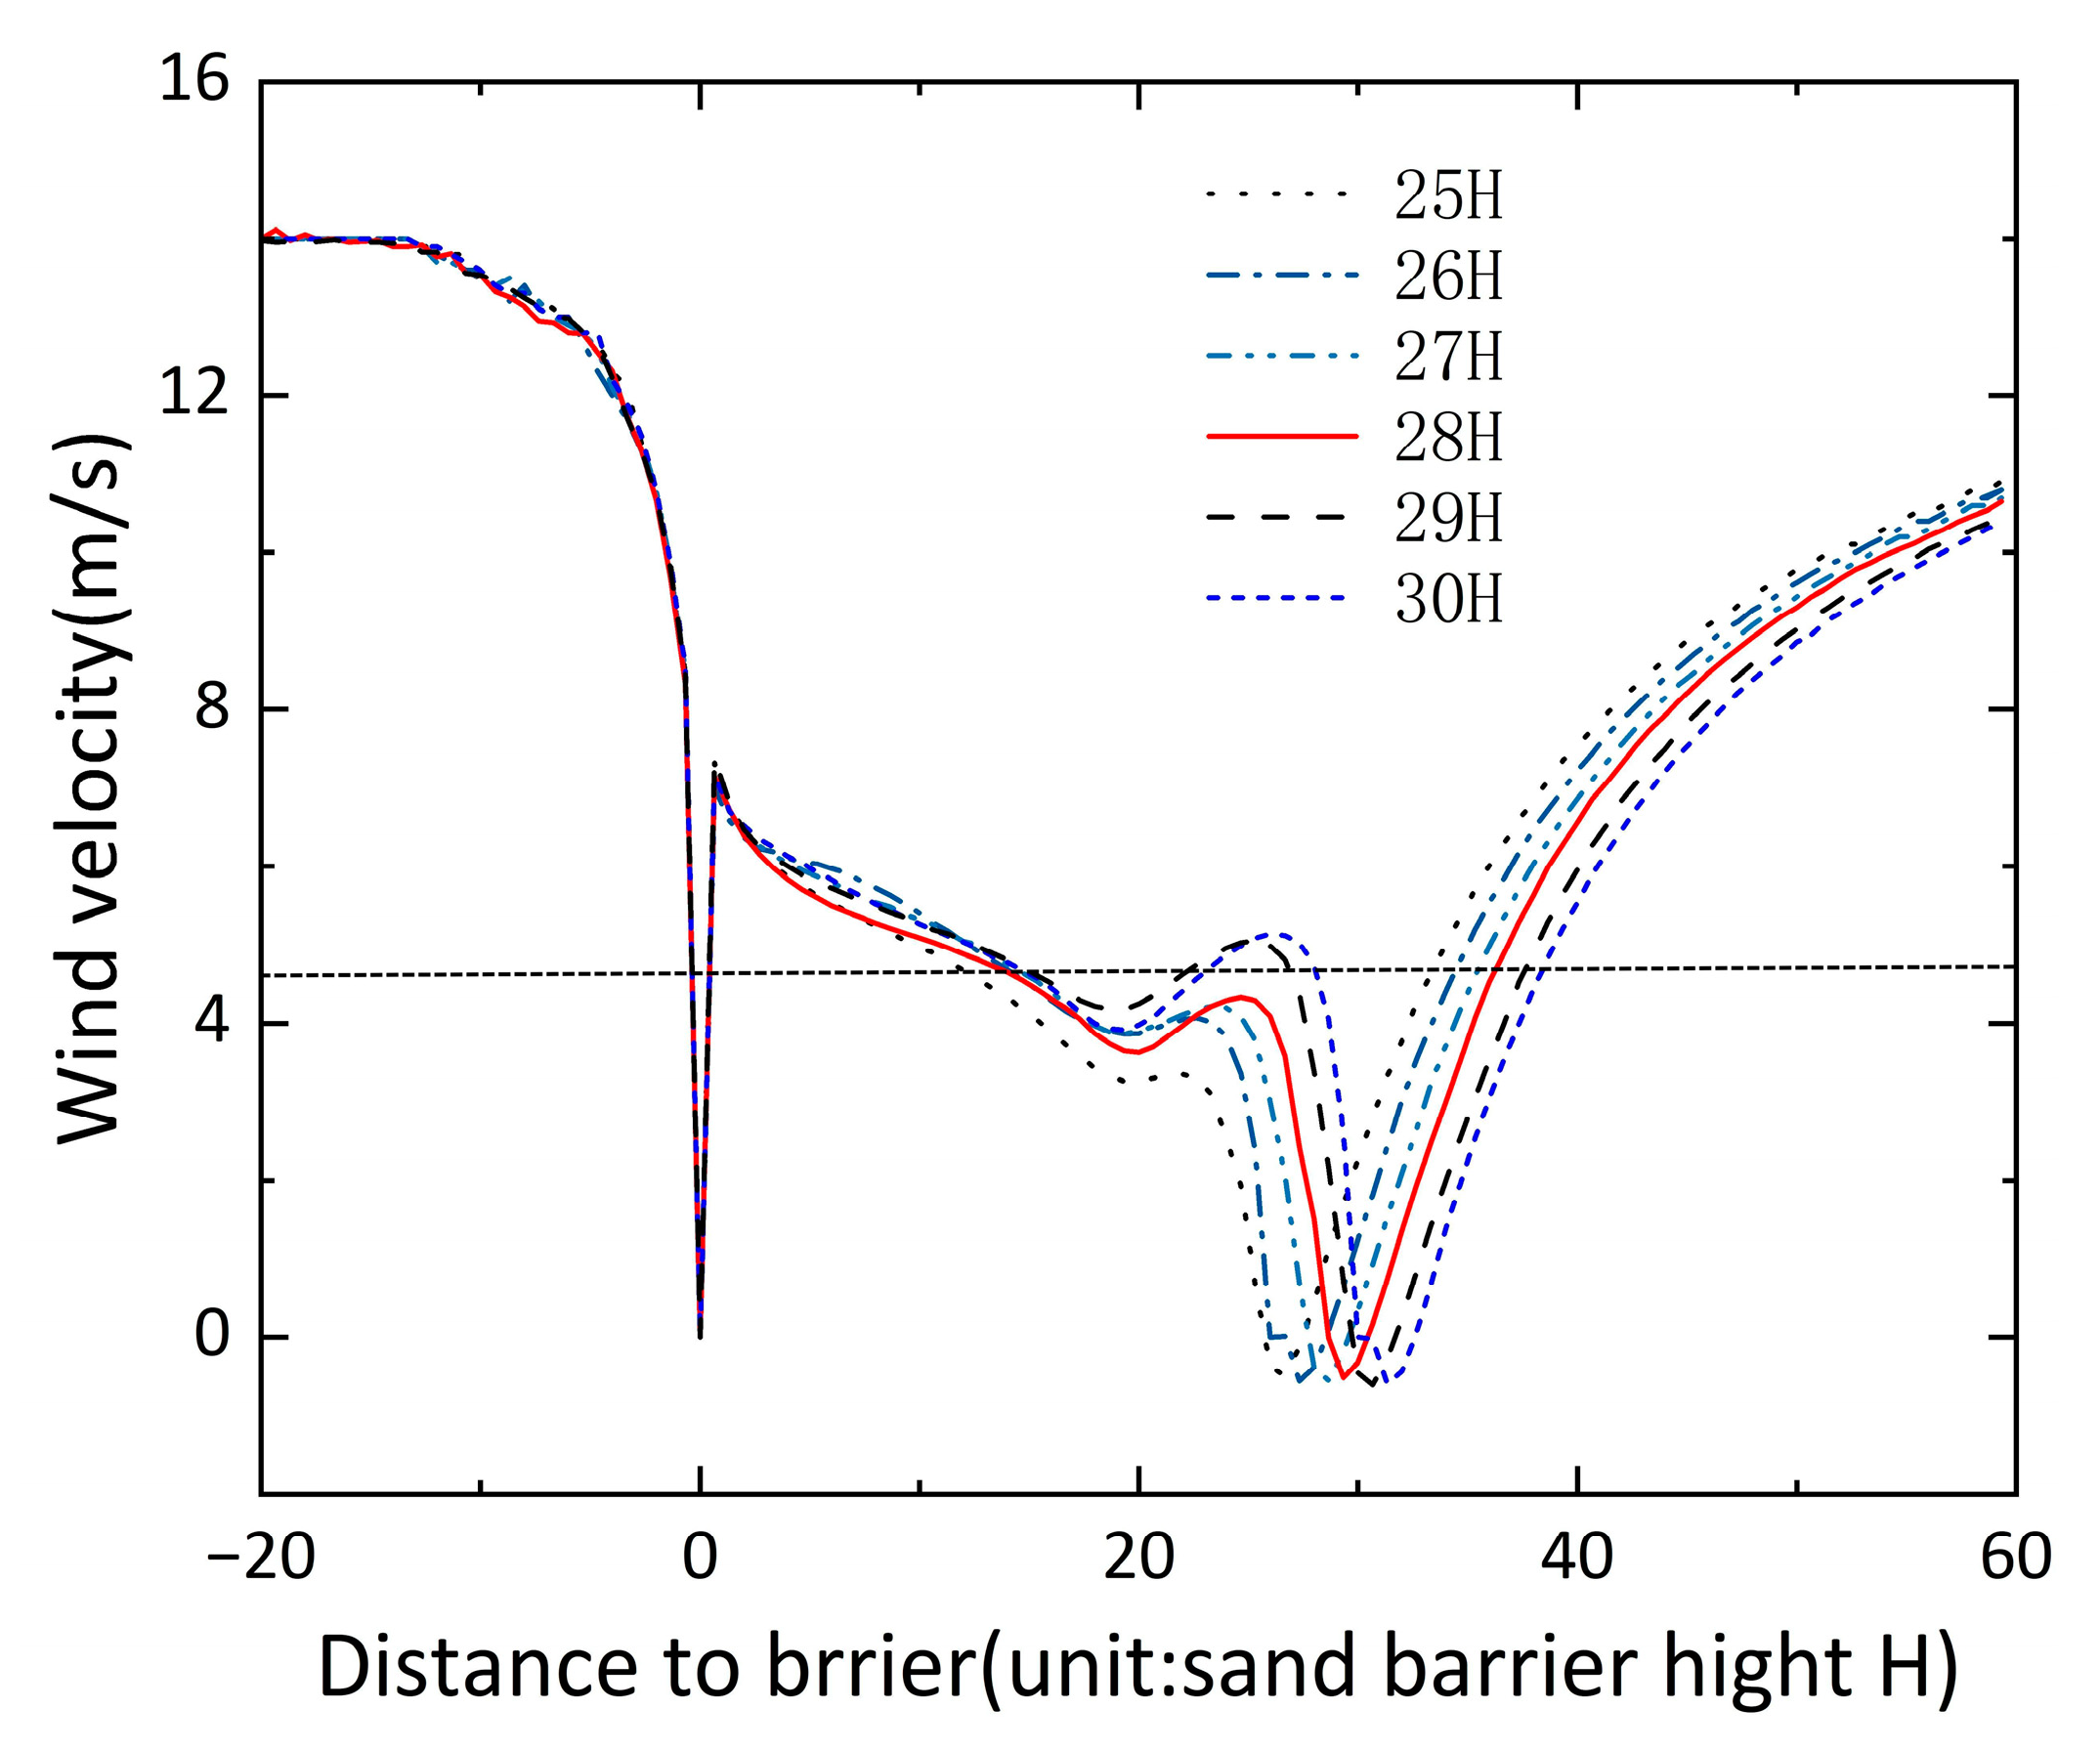
4.2.1. Impact of Spacing

According to Equation (5), five different height positions (0.2 H, 0.5 H, 1 H, 2 H, and 5 H) were selected to calculate the wind protection efficiency of the three types of sand barriers, as shown in Figure 13. The vertical coordinates indicate the wind protection efficiency of the sand barriers; the horizontal coordinates indicate the distance positions (positive = leeward side; negative = windward side). The wind protection efficiency curves of the three spacing sand barriers have obvious elevation segments after the sand barriers, showing an “M-shape” trend. As the spacing of the sand barriers (10 H, 15 H, and 20 H) increases (indicated by the red dotted line), the peak of the wind protection efficiency gradually moves towards increasing with the increase in the spacing, and the wind protection area gradually increases. Comparing the wind protection efficiency at 0.2 H, it is found that there is a significant decrease in the wind protection efficiency between the sand barriers at 30 H, which is due to the increased spacing producing a velocity recovery zone and reducing the wind protection efficiency. There was no significant change in wind protection efficiency with increasing wind speed, and the overall change was stable. The protective effect is better below 1 H, and the windproof efficiency increases significantly. When the height is 2 H–5 H, the wind protection efficiency is always lower than 20%, and under the effect of the acceleration zone, the wind protection efficiency in some areas shows a negative value, which indicates that the sand barriers have a negligible effect on the reduction of the kinetic energy of the airflow at this height, and their protection effect is poor. Therefore, the optimal spacing range is roughly between 25 H and 30 H, and the effective protection height is about 1 H.
Sand barriers effectively intercept sand particles in creeping and leapfrogging motions and significantly reduce airflow below 1 H, meeting the goal of desert surface fixation, but they provide little protection against suspended sand particles.
Wind–sand movement is a near-surface sand-carrying movement, with most sand particles moving within 30 cm above the surface. To further determine the optimal spacing parameters, the EPD and wind speed vertical profile of a spacing of 25–30 H (wind speed at 20 m/s) at 0.2 H are analyzed. Figure 14 shows that as the spacing increases, the EPD increases, but at 29 H, there is a significant decrease in the EPD, which is due to the wind speed being restored. Therefore, part of the area’s wind speed is greater than the critical wind speed of the sand, so the effective protection area is interrupted, split into two small protection areas, and the overall protection area is gradually reduced. Figure 15 shows that with the increase in the spacing, the velocity value of the wind speed recovery area between the 0.2 H height barriers increases gradually, in which the maximum value of the wind speed at the spacing of 25–28 H does not exceed the critical wind speed of 4.7 m/s (black dotted line), and the value of the wind speed at the spacing of 29–30 H recovers faster and partially exceeds the critical wind speed of the sand. Therefore, a spacing of more than 29 H is unfavorable for sand accumulation, and more consideration should be given to improving the sand accumulation effect between the barriers and reducing the sand initiation for the sand barriers, so the spacing should be no more than 28 H. Figure 15 shows that the flow field between the barriers shows an obvious trend of increasing, then decreasing, then increasing, then gradually decreasing, and the wind speed at 28 H is not higher than the critical wind speed of sand, which is in line with the trend characteristics of the optimal spacing of the double-row sand barriers. Therefore, it can be seen that the optimal spacing of this condition under the consideration of the construction economy should be 28 H.

4.2.2. Impact of Porosity

In sand barrier protection systems, porosity has the greatest effect on sand retention when the length of the sand barrier is much greater than its height [33]. When evaluating the influence of porosity on the effectiveness of sand barriers, the application range should be considered. For sand barriers with small porosity, the accumulation area is concentrated, and more sand particles are concentrated on the windward side; for sand barriers with larger porosity, the main sand accumulation area is on the leeward side, and the extent of sand accumulation increases, the accumulation area gradually extends to the rear, and is higher than that of sand barriers with small porosity in terms of service life (Znamensky, 1960). The sand barriers studied in this paper were laid mainly at locations farther away from the Hotan–Ruoqiang railway railroad bed, about 200 m from the basement location, in order to block the incoming sand to protect the subsequent sand-fixing facilities from the impact of sand burial. In order to improve the service life of the sand barriers, a sparsely permeable sand barrier should be selected, and the porosity should be not less than 0.3 [5]. For the arrangement of double rows of sand barriers, sand particles should be concentrated in the middle of the barriers as much as possible, which needs to be considered to improve the sand accumulation efficiency of the leeward side of the first row of sand barriers and the windward side of the second row of sand barriers. The deceleration zone, as the main sand accumulation area, requires that the wind speed in the deceleration zone be lower than the critical sand initiation wind speed in order to stabilize the accumulation of sand particles without secondary initiation. Liu et al. [34] analyzed the wind erosion and sand initiation characteristics in the Taklamakan region with the ground observation data from 2009 to 2018 at the Ta Zhong meteorological station in the hinterland of the Taklamakan Desert, and the critical sand initiation wind speed ranged from 4.47 to 4.92 m/s. In this paper, a critical sand initiation wind speed of 4.7 m/s was selected.
Take a porosity of 0.4–0.5 and 0.3–0.4 and a sand barrier spacing of 10 H as an example. Figure 16 shows that there are obvious differences in velocity changes between sand barriers with different porosity variations, and the critical wind speed is indicated by the black horizontal dashed line in Figure 16, and whether the wind speed change curve exceeds the critical sand initiation wind speed between sand barriers is the focus of attention. When the wind speed value in this region is lower than the critical sand velocity, the sand particles are more creeping and leaping, and the sand deposition effect is better and more stable; on the contrary, the sand particles are driven by the wind speed to obtain more kinetic energy and are easily captured by the air in the process of leaping, forming sandy flow. Figure 16a shows that the wind speed of 0.4–0.5 is significantly greater than that of 0.3–0.4, so the sand accumulation performance of 0.3–0.4 is higher than that of 0.4–0.5. Figure 16b,c shows that the wind speed between the barriers increases significantly as the wind speed increases, the wind speed between the barriers of 0.4–0.5 exceeds the critical sand initiation wind speed, and the wind protection effect is significantly lower than that of 0.3–0.4.

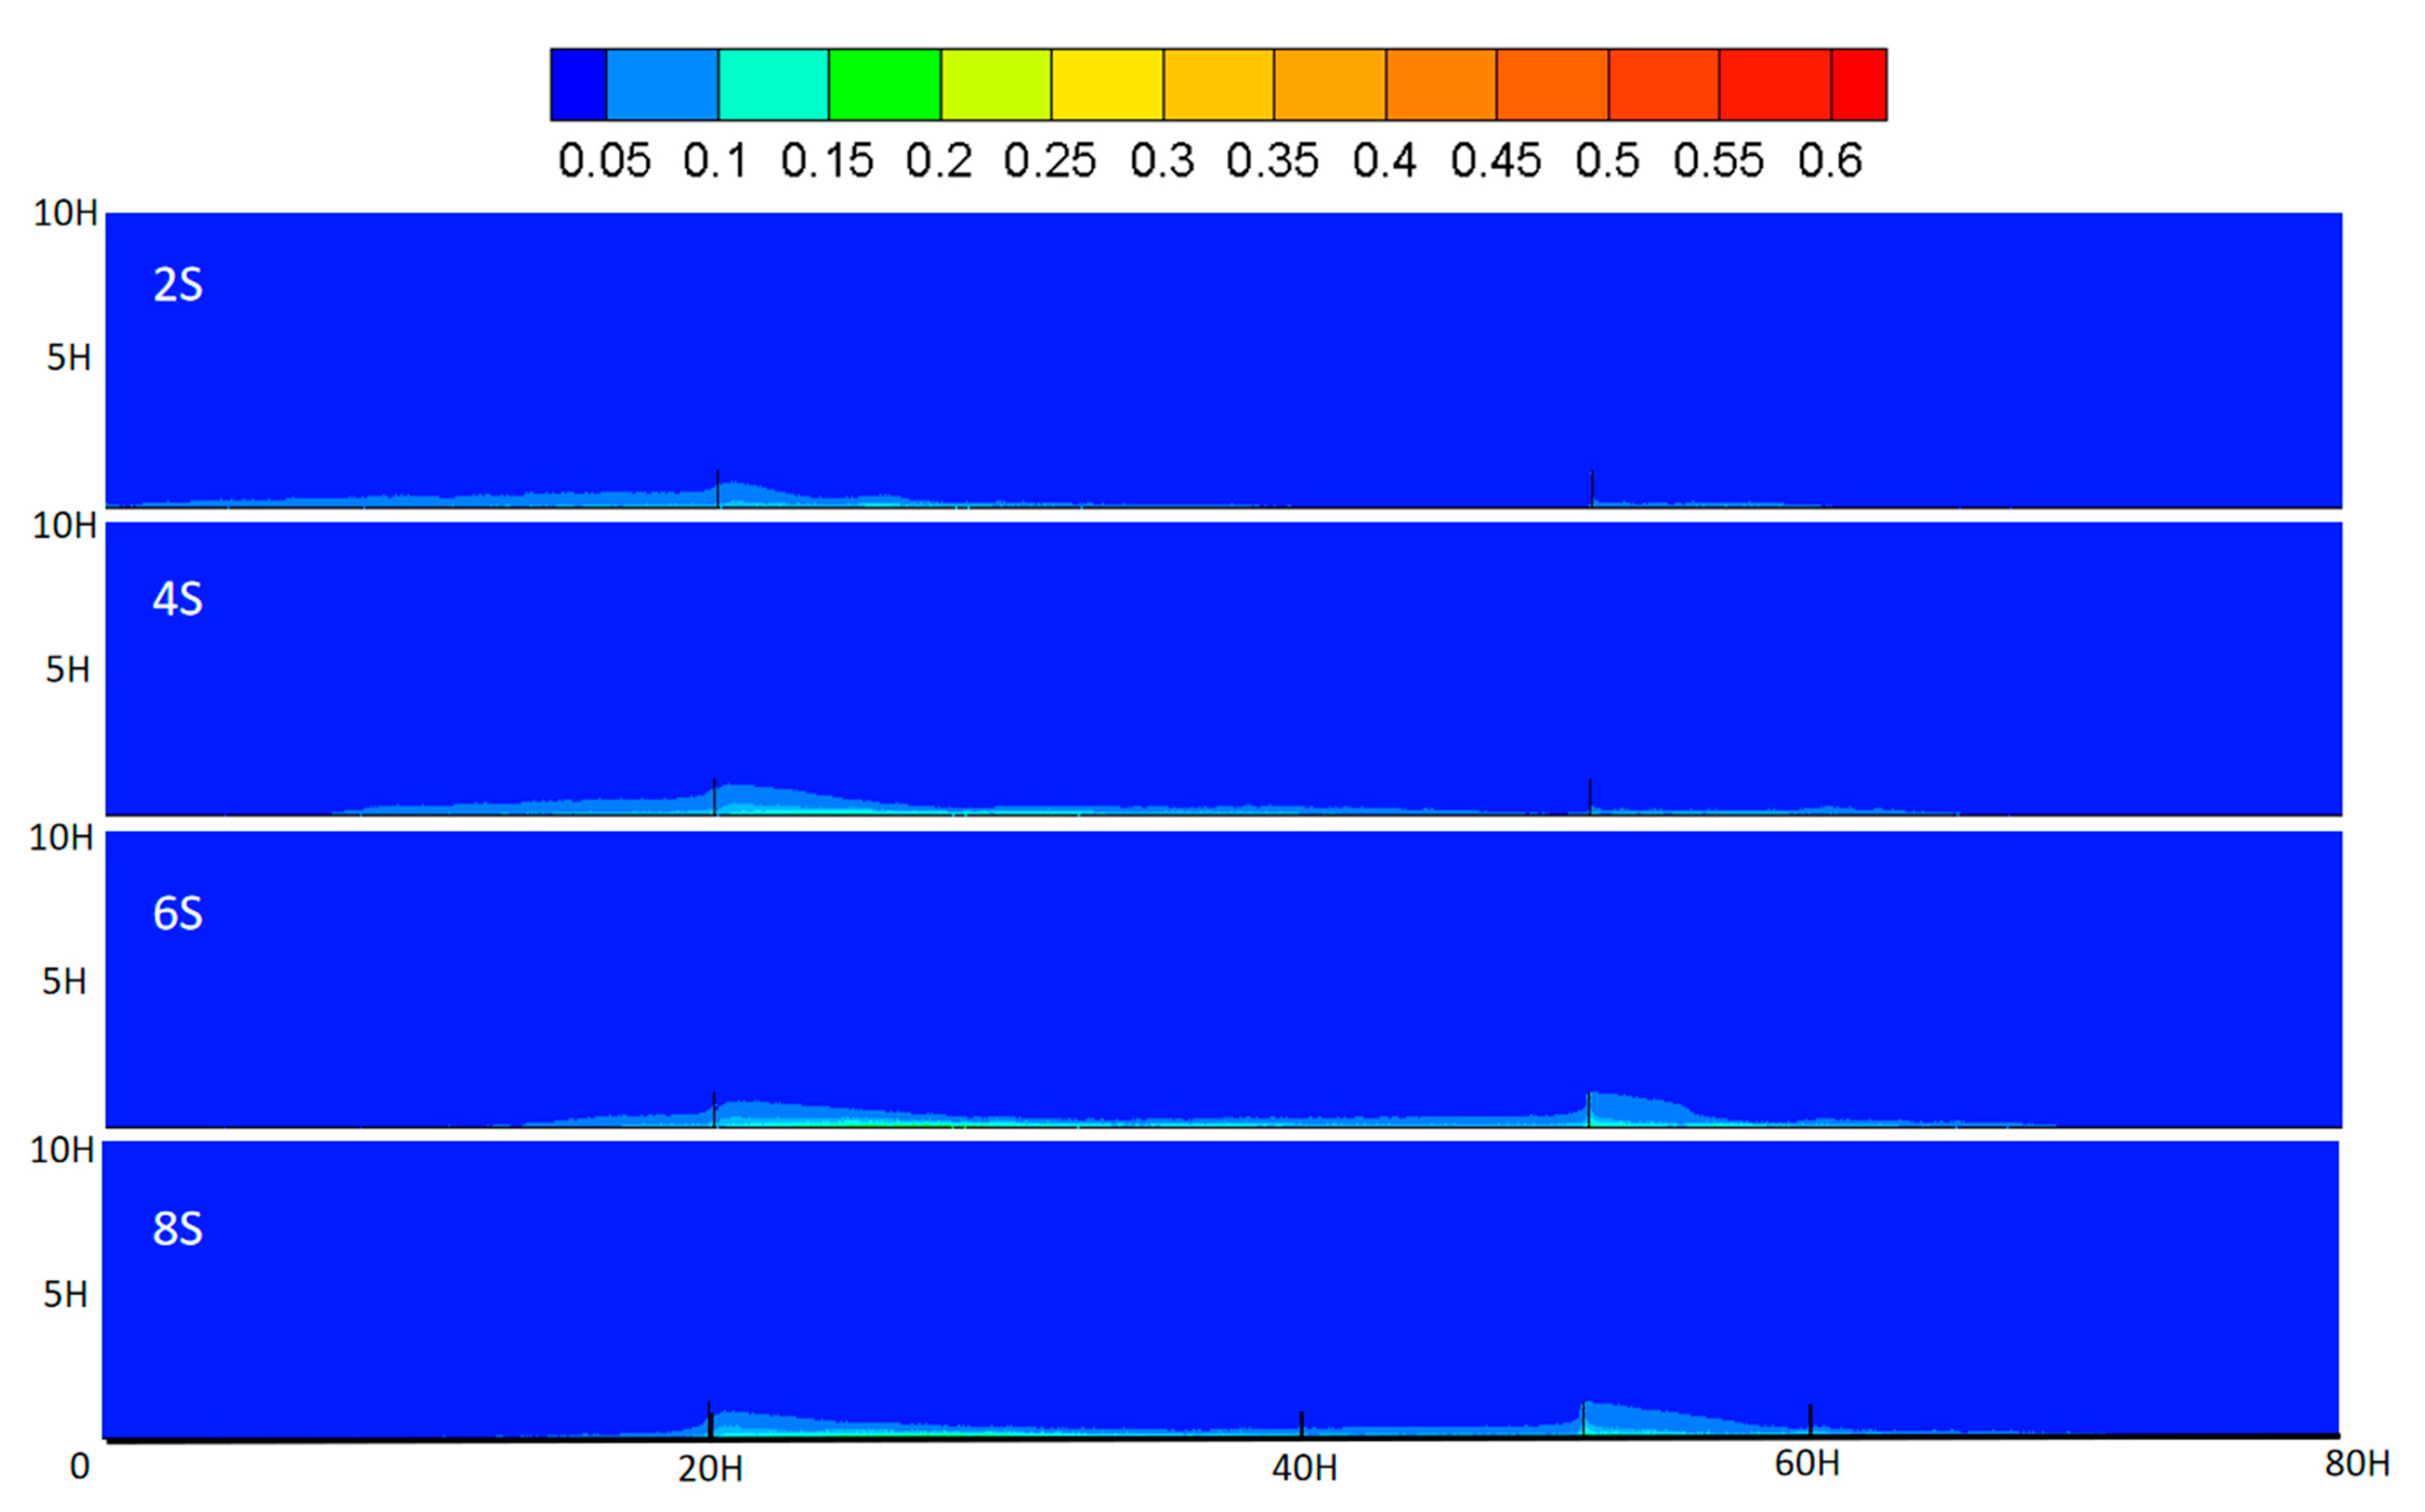
4.2.3. Sand-Blocking Effect

Figure 17 shows the spread of sand accumulation around the sand fence of reed and nylon mesh at different times (V = 20 m/s, spacing = 28 H). As shown in Figure 17, the wind–sand flow enters the zone from the entrance, encounters the first reed sand fence, the wind speed decreases, the sand-carrying capacity decreases, and some sand grains begin to deposit in the deceleration zone. At t = 2 s, there was obvious sand deposition in the deceleration zone before and after the first reed sand fence; the amount of sand sediment on the leeward side of the sand fence is greater than that on the windward side, and there is a small accumulation of sand on the leeward side of the second nylon mesh sand fence. Therefore, it can be seen that the main role of the first sand fence in the initial stage is in the protection system, and the main sand accumulation area is near the first sand fence. As the time increased, the accumulation of sand around the first sand fence gradually increased, the area of sand deposition gradually expanded, and the amount of sand deposited on the lee side of the second sand fence gradually increased. At 4 s, the sand particles gradually decreased on the windward side of the first sand fence, began to shift along the wind direction, and gradually accumulated significantly at the back of the first row of the lee side, while the sand particles accumulated slowly at the back of the second sand fence. When the time increased to 6 s, the amount of sediment between the sand barriers continued to increase. Most of the sand particles on the windward side of the first sand fence had been transferred to the lee side of the first sand fence, more sand particles had been deposited between the two sand barriers, and some sand particles began to transfer to the rear. The volume fraction of sand deposited on the lee side of the second row of sand fences increased because the sand fences could not capture the sand particles along the height of the sand fences. Therefore, the concentration of sand volume fraction on the leeward side increases gradually with the increase in time. The reed–nylon mesh sand fence has a better sand control effect, and more sand particles are deposited between the sand fences, effectively blocking the sand particles in the air near the surface.
Figure 18 shows the distribution of sand volume fraction at different locations and heights in time (t = 10 s). The wind velocity is 20 m/s, the spacing is 28 H, and the sand content in the air is 3%. Figure 18 shows that there are obvious differences in the volume fraction of sand particles within the height of 1 H at three locations with different spacings (10 H, 30 H, and 60 H). The sand particles at 10 H are in the initial state; the concentration of sand particles decreases with the increase in height; the sand particles begin to be deposited near the surface due to the action of the sand barriers at 30 H; the volume fraction of sand particles near the surface is much larger than that of the other heights; and the sand particles at 50 H are deposited at the surface by the sand barrier, which is much larger than that of the other heights. At 50 H, the sand particles at the surface are blocked and collected by the sand barrier. At 30 H, sand particles begin to be deposited near the surface due to the sand barrier, and the volume fraction of sand particles near the surface is much larger than the volume fraction of sand particles at other height locations. At 50 H, sand particles at the surface are blocked and collected by the sand barrier, and there is a small accumulation of sand particles at 1 H. The volume fraction of sand particles decreases with increasing height, and the volume concentration of sand particles in the accumulation is smaller than that at 30 H and gradually inclines towards the initial value.

5. Discussion

The overall trend of the three types of sand barriers shows a “V-shape”, which has a good deceleration and blocking effect on the incoming wind. Double-row reed barriers, reed–nylon net barriers, and double-row nylon net barriers all have acceleration, eddy, and deceleration zones in their flow fields. For the reed barriers, the airflow passes through the reed bundles with high airflow hydrophobicity, and there is an obvious deceleration zone, which produces a phenomenon called cylindrical bypass, and the overall airflow is easier to recover with lower turbulence intensity. The nylon net barriers dampen the air more, with a larger vortex area on the leeward side and higher turbulence intensity on the leeward side of the airflow. The windward protection area of the nylon net barriers was larger than the windward protection area of the reed barriers, while the opposite was true for the leeward area. The double-row reed barriers have a greater range of deceleration zones, but the wind speed reduction is weaker and more wind-sparing, making them better suited to strong wind environments. The deceleration effect of double rows of nylon net barriers is obvious, and the wind speed is reduced greatly; a larger wind pressure on the surface is created and it is easily damaged in windy environments. The reed–nylon net barrier can effectively reduce the wind speed on the lee side of the first reed sand barrier and effectively block the windward side of the second nylon net, which is more suitable for the peripheral protection zone of desert railways and highways. The advantages of the reed and nylon net are combined, and this combination not only has better wind protection characteristics but can also be moved after sand accumulation and increase the service life of the sand barrier.
Under different porosity combinations, the porosity is positively correlated with the wind speed between the reed–nylon mesh sand barriers, and the wind speed between the barriers increases with the increase in porosity. The general trend of wind speed between the sand barriers with a porosity of 0.4–0.5 and a porosity of 0.3–0.4 increases with the increase in wind speed, but the wind speed between the sand barriers with a porosity of 0.4–0.5 is significantly higher than that with a porosity of 0.3–0.4, and the wind speed between the barriers is higher than the critical sand-producing wind speed with the increase in wind speed. Choosing a smaller porosity combination is more conducive to the accumulation of sand particles between barriers, reducing the wind speed between barriers and reducing the start-up of sand particles. Under the premise of ensuring certain permeability, the optimal porosity combination should be 0.3–0.4.
At different spacing, the flow field characteristics around the reed–nylon net fence are also different. Within the optimal spacing of 28 H, the spacing is proportional to the EPD. With the change in wind speed, the overall trend of wind protection efficiency has little change. The results show that the windproof efficiency of the fence shows an “M-shaped” trend at 20 H, 25 H, and 30 H spacings. The windproof efficiency increases significantly at the height of 0 H~1 H, and gradually decreases and presents a negative value at the height of 1 H~5 H. As the height advances, the windproof efficiency gradually decreases, and the effective protection height is within 1 H. As spacing increases, the wind speed between the fence gradually begins to recover and increase, forming a deceleration zone and a recovery zone, which shows a trend of first increasing, then decreasing, then increasing, and gradually decreasing. By comparing the change of EPD between 25 H and 30 H, the EPD gradually decreases after more than 28 H, and the best distance between the reed–nylon net fence is 28 H.
The reed–nylon net sand fence with 28 H spacing and a porosity of 0.3–0.4 has a good effect on preventing sand. The sand particles mainly settle in the middle and back areas between the sand barriers. The sand particles on the windward side of the first reed fence decrease with an increase in time, while the sand particles on the lee side of the second nylon net fence increase with an increase in time. As time goes on, the accumulation of sand particles starts from the first sand fence and moves along the wind direction, gradually accumulating in the area between the two sand fences. Most of the sand particles are deposited between the sand fences, there are fewer sand particles on the lee side of the second row of sand fences, and the accumulation effect is relatively ideal, which effectively reduces the migration of sand particles at 1 H of the surface attachment height. The reed–nylon net sand fence has good application value in blocking and stacking effects.

6. Conclusions

This paper focuses on wind and sand control in the construction of desert transportation facilities in a strong wind and sand environment, and a new type of combined sand barrier is simulated by using the Euler–Euler two-fluid model. The aerodynamic characteristics and sand accumulation mechanism around the sand barriers are simulated and analyzed under the net wind field and the sand-containing field and optimization of the design parameters is discussed. The conclusions are as follows:
(1)
There is a comprehensive consideration of the overall windbreak effect and service life of the sand barriers. The new reed sand barriers have excellent wind resistance, environmental protection, and economic potential. The nylon mesh sand barriers are good sand barriers with good service life. To make up for the shortcomings of the two themselves, we combined them to enhance the practicality of the sand barriers and their economic value.
(2)
When the porosity of the new combined sand barrier is 0.3–0.4 and the spacing is 28 H, the wind protection efficiency is high and the effective protection distance is longest. In the practical application process, this range can be used to be more economical and efficient.
(3)
When the porosity of the new combined sand barrier is 0.3–0.4 and the spacing is 28 H, the sand accumulation effect is good. The sand accumulation area is concentrated in the sand barrier and the lee side of the second sand barrier, and the sand particles at 1 H height from the surface are effectively intercepted. With the passage of time, the sand gradually migrated backward with the direction of the incoming wind, the amount of sand accumulated on the lee side of the second sand barrier gradually increased, and the sand accumulation rate was greater than that between the sand barriers.
Many railways, roads, and other infrastructure in areas around deserts in northwest China are affected by strong winds and sandstorms throughout the year, leading to traffic paralysis and inefficient operation, burying tracks and roads, and causing large economic losses. It is hoped that this study can provide some theoretical and technical support for the design of sand prevention projects along the railway and highways in the northwest desert area of China.

Author Contributions

Conceptualization, H.P.; methodology, H.P.; software, B.Z.; validation, B.Z.; formal analysis, S.Z.; investigation, S.Z.; resources, S.Z.; data curation, H.P. and S.Z.; writing—original draft preparation, H.P.; writing—review and editing, H.P. and S.Z.; visualization, B.Z.; supervision, A.J.; project administration, A.J. All authors have read and agreed to the published version of the manuscript.

Funding

National Natural Sciences Foundation of China, Grant/Award Number: 51968069.

Institutional Review Board Statement

Not applicable.

Informed Consent Statement

Not applicable.

Acknowledgments

This work was supported by the National Natural Sciences Foundation of China (51968069). The authors would like to thank the anonymous reviewers and the editor for providing valuable comments that helped improve the quality of this paper.

Conflicts of Interest

The authors declare no conflict of interest.

References

  1. Zheng, X.J. Mechanics of Wind-Blown Sand Movements; Springer: Berlin/Heidelberg, Germany, 2009. [Google Scholar] [CrossRef]
  2. Cheng, J.J.; Xue, C.X. The sand-damage–prevention engineering system for the railway in the desert region of the Qinghai-Tibet plateau. J. Wind Eng. Ind. Aerodyn. 2014, 125, 30–37. [Google Scholar] [CrossRef]
  3. Luca, B.; Marko, H.; Lorenzo, R. Windblown sand along railway infrastructures: A review of challenges and mitigation measures. J. Wind Eng. Ind. Aerodyn. 2018, 177, 340–365. [Google Scholar] [CrossRef]
  4. Xin, G.W.; Huang, N.; Zhang, J. Wind-tunnel experiment on sand deposition mechanism and optimal measure of Wind-break wall along railway in strong wind area. Chin. J. Theor. Appl. Mech. 2020, 52, 635–644. Available online: https://kns.cnki.net/kcms/detail/11.2062.o3.20200427.0938.002.html (accessed on 20 October 2022).
  5. Chen, X.G. Numerical Simulation Research on Sand Blocking Mechanism of Upright Reed Fence; Lanzhou University: Lanzhou, China, 2021; Available online: https://kns.cnki.net/kcms2/article/abstract?v=qMv6CFc_riaedTc-JZg5vpnhSN4FdPCiSQO_xQVQREKTKr7wDOmaZ_aLfSiHB7aPFGlerMaNSlIybO3ly-c4fH32w-DJk9yJI1WzBfvW8I6itgLGGqJr6fz8fuT87YalIvOn-YcTzl0=&uniplatform=NZKPT&language=CHS (accessed on 20 August 2023).
  6. Li, K.C.; Tan, L.H.; Shi, L.; Wei, Y.J. Influence of Porosity on Blown Sand Protection Effect of Reed Sand Barrier. J. China Railw. Soc. 2022, 44, 166–170. [Google Scholar] [CrossRef]
  7. Chen, B.Y.; Cheng, J.J.; Li, S.Y. Analysis of reasonable spacing of vertical reed sand barriers on Xinjiang S214 provincial highway. Arid Zone Res. 2020, 37, 782–789. [Google Scholar] [CrossRef]
  8. Jia, G.P. Fluent Numerical Simulation of Protective Effectiveness of Double-Row Nylon Sand-Blocking Net; Inner Mongolia Agricultural University: Hohhot, China, 2020. [Google Scholar] [CrossRef]
  9. Qu, J.J.; Liu, X.W.; Lei, J.Q.; Li, F.; Yu, Z.Y. Wind tunnel simulation of sand control effect of nylon fence. Chin. Desert 2001, 62–66. Available online: https://kns.cnki.net/kcms/detail/detail.aspx?FileName=ZGSS200103012&DbName=CJFQ2001 (accessed on 20 August 2023).
  10. Dong, Z.B.; Chen, G.T.; He, X.D.; Han, Z.W.; Wang, X.M. Controlling blown sand along the highway crossing the Taklimakan Desert. J. Arid Environ. 2004, 57, 329–344. [Google Scholar] [CrossRef]
  11. Wang, Y.B. Characteristics of the Surface Wind in the Southern Margin of Taklamakan; Sichuan Normal University: Chengdu, China, 2018. [Google Scholar]
  12. Li, J.F. Weather and Climate of Taklimakan Desert and Surrounding Mountains; China Science Press: Beijing, China, 2003. [Google Scholar]
  13. Qu, J.J.; Ling, Y.Q.; Liu, B.J. Research status and development trends of wind-sand engineering in China. Adv. Earth Sci. 2019, 34, 225–231. [Google Scholar] [CrossRef]
  14. Shi, L.; Wang, D.Y.; Li, K.C. Windblown sand characteristics and hazard control measures for the Lanzhou–Wulumuqi high-speed railway. Nat. Hazards 2020, 104, 353–374. [Google Scholar] [CrossRef]
  15. Xi, C.; Zuo, H.J.; Wang, H.B.; Yan, M.; Jia, G.P. Wind-proof and sand-blocking characteristics of high vertical nylon net sand barrier and its rational allocation. Arid Zone Res. 2021, 38, 882–891. [Google Scholar] [CrossRef]
  16. Afnan, Y.T.; Yan, B.; Xiong, Y.L.; Ye, G.L.; Usama, K.; Xu, Z.H. Numerical analysis on zone-divided deep excavation in soft clays using a new small strain elasto–plastic constitutive model. Undergr. Space 2022, 7, 19–36. [Google Scholar] [CrossRef]
  17. Yadav, S.K.; Ye, G.L.; Xiong, Y.L.; Usama, K. Unified numerical study of shallow foundation on structured soft clay under unconsolidated and consolidated-undrained loadings. Mar. Georesour. Geotechnol. 2020, 38, 400–416. [Google Scholar] [CrossRef]
  18. Wang, L.; Cheng, J.J.; Zhi, L.Y.; Xin, G.W. Simulation Applicability Analysis of Sand-protecting Barrier along the Railway Based on Porous Media Method. Railw. Stand. Des. 2016, 60, 5. [Google Scholar] [CrossRef]
  19. Wang, D.X. Numerical Simulation of Wind Sand Two Phase Flow in Double Windbreak Wall; Lanzhou University: Lanzhou, China, 2020. [Google Scholar] [CrossRef]
  20. Lee, S.J.; Park, K.C.; Park, C.W. Wind tunnel observations about the shelter effect of porous fences on the sand particle movements. Atmos. Environ. 2002, 36, 1453–1463. [Google Scholar] [CrossRef]
  21. Zhao, P.; Jin, A.F.; Xie, F.R.; Reyhanguli, M. Study on structural parameters optimization of a new inclined inserting and hole plate-type combined sand barrier. Proc. Inst. Mech. Eng. Part C J. Mech. Eng. Sci. 2022, 236, 6593–6606. [Google Scholar] [CrossRef]
  22. Lima, I.L.; Parteli, E.J.R.; Shao, Y.; Andrade, J.S.; Herrmann, H.J.; Araújo, A.D. CFD simulation of the wind field over a terrain with sand fences: Critical spacing for the wind shear velocity. Aeolian Res. 2020, 43, 100574. [Google Scholar] [CrossRef]
  23. Chen, B.Y.; Cheng, J.J.; Xin, L.G.; Wang, R. Effectiveness of hole plate-type sand barriers in reducing aeolian sediment flux: Evaluation of effect of hole size. Aeolian Res. 2019, 38, 1–12. [Google Scholar] [CrossRef]
  24. Li, B.L.; Sherman, D.J. Aerodynamics and morphodynamics of sand fences: A review. Aeolian Res. 2015, 17, 33–48. [Google Scholar] [CrossRef]
  25. Xin, G.W.; Huang, N.; Zhang, J.; Dun, H.C. Investigations into the design of sand control fence for Gobi buildings. Aeolian Res. 2021, 49, 100662. [Google Scholar] [CrossRef]
  26. Wang, H.; Li, L.; Li, J.; Sun, D. Drained expansion responses of cylindrical cavity under biaxial in situ stresses: Numerical investigation with implementation of anisotropic S-CLAY1 model. Can. Geotech. J. 2022, 60, 198–212. [Google Scholar] [CrossRef]
  27. Wang, T.; Qu, J.J.; Ling, Y.Q.; Liu, B.L.; Xiao, J.H. Shelter effect efficacy of sand fences: A comparison of systems in a wind tunnel. Aeolian Res. 2018, 30, 32–34. [Google Scholar] [CrossRef]
  28. Wang, T.; Qu, J.J.; Ling, Y.Q. Wind tunnel test on the effect of metal net fences on sand flux in a Gobi Desert. J. Arid Land 2017, 9, 888–899. [Google Scholar] [CrossRef]
  29. Liu, X.W. Experimental Sand Physics and Sand Engineering; Science and Technology Press: Beijing, China, 1995. [Google Scholar]
  30. Liu, X.P.; Dong, Z.B. Experimental investigation of the concentration profile of a blowing sand cloud. Geomorphology 2004, 60, 371–381. [Google Scholar] [CrossRef]
  31. Shi, L.; Jiang, F.Q. Numerical simulation on the parameter’s optimization of the oblique inserting plate retaining wall design. J. Desert Res. 2014, 34, 666–673. [Google Scholar] [CrossRef]
  32. Jia, G.P.; Zuo, H.J.; Wang, H.B. Numerical simulation and experiment of wind-sand movement characteristics around high vertical nylon mesh sand barriers. Trans. Chin. Soc. Agric. Eng. 2020, 36, 109–117. [Google Scholar] [CrossRef]
  33. Heisler, G.M.; Dewalle, D.R. Effects of windbreak structure on wind flow. Agric. Ecosyst. Environ. 1988, 22–23, 41–69. [Google Scholar] [CrossRef]
  34. Liu, Y.N.; Zhong, X.J.; Ma, K.; Yang, F.F.; Qiu, H.M. Observational Study on the Characteristics of Wind Erosion and Dust Emission in the Hinterland of Taklimakan Desert. Desert Oasis Meteorol. 2021, 15, 5. [Google Scholar] [CrossRef]
Figure 1. High vertical reed barriers.
Sustainability 15 13920 g001
Figure 2. High vertical nylon net barriers.
Sustainability 15 13920 g002
Figure 3. Hotan–Ruoqiang railway roadmap.
Sustainability 15 13920 g003
Figure 4. Arrangement of sand control works of Hotan–Ruoqiang railway.
Sustainability 15 13920 g004
Figure 5. Wind rose map of the Taklimakan Desert south margin.
Sustainability 15 13920 g005
Figure 6. Computation domain and boundary condition diagram.
Sustainability 15 13920 g006
Figure 7. Computational domain mesh generation: (a) vortex zone mesh encryption; (b) sand barrier grid encryption; (c) boundary layer.
Sustainability 15 13920 g007
Figure 8. Variation of vertical wind speed profile at different wind speeds [30].
Sustainability 15 13920 g008
Figure 9. The volume fraction of sand grains varies with height at different wind speeds [30].
Sustainability 15 13920 g009
Figure 10. Mesh independence validation.
Sustainability 15 13920 g010
Figure 11. Speed cloud map of different sand barriers: (a) double-row reed barrier (b) reed–nylon net barrier (c) double-row nylon net barrier.
Sustainability 15 13920 g011
Figure 12. Comparison of vertical wind speed profiles around different sand barriers: (a) double-row reed barrier; (b) reed–nylon net barrier; (c) double-row nylon net barrier.
Sustainability 15 13920 g012
Figure 13. Change curve of wind protection efficiency of new sand barriers at different spacings (porosity 0.3–0.4): (a1a3) spacing = 20 H, (b1b3) spacing = 25 H, and (c1c3) spacing = 30 H.
Sustainability 15 13920 g013
Figure 14. EPD with different spacings.
Sustainability 15 13920 g014
Figure 15. Vertical wind speed profiles vary at different spacings.
Sustainability 15 13920 g015
Figure 16. Vertical profile of wind speed at different porosities.
Sustainability 15 13920 g016
Figure 17. Distribution of sand deposits around the sand barrier of reeds and nylon net at different times with porosities of 0.3–0.4 and a spacing of 28 H.
Sustainability 15 13920 g017
Figure 18. Distribution of sand volume fraction at different heights in different locations.
Sustainability 15 13920 g018
Table 1. Comparison of advantages of different sand barriers.
Sand Barrier TypeDouble-Row Nylon Net Sand BarrierReed–Nylon Net Sand BarrierDouble-Row Reed Sand Barriers
EconomyThe cost is more expensive, and the initial investment is largeThe cost is less than nylon, and low input costsMinimal material costs and easy access to obtain
Service lifeIt is not easy to decompose, and longer service life in places where the wind is not strong After combination, the service life can be extended in windy, and the protection efficiency is higherShort service life, natural decay decomposition
Wind and sand resistanceGood sand resistance, but not suitable for windy environmentsGood sand resistance, suitable for windy environments, the protection efficiency decreases slowlyGood wind protection, but significantly less effective once natural decomposition begins, easily toppled and buried
Ecological restoration advantageThe material is not easy to degrade and does not improve the soil qualityThe reeds in the front row can be disintegrated to make up for the lack of nylon net sand barriersThe material can be naturally decomposed into soil nutrients, improving the soil environment
Table 2. EPD on sand barriers leeward side.
EPD/cm
Height above the Sand Bed/cm
1 cm 2 cm
PorosityExperimentSimulationErrorExperimentSimulationError
01521637.2%1681807.1%
0.11681754.1%1761855.1%
0.21681828.3%1841956.0%
0.31761907.9%1922035.7%
Disclaimer/Publisher’s Note: The statements, opinions and data contained in all publications are solely those of the individual author(s) and contributor(s) and not of MDPI and/or the editor(s). MDPI and/or the editor(s) disclaim responsibility for any injury to people or property resulting from any ideas, methods, instructions or products referred to in the content.

