1. Introduction
In the dynamic landscape of contemporary economies, the intricate interplay between financial development and income inequality stands as a significant subject and a scholarly inquiry [
1,
2,
3,
4]. As the global economic paradigm continues to evolve, the mechanisms through which financial systems interact with income distribution patterns have garnered substantial attention from economists, policymakers, and researchers alike. The intricate balance between fostering economic growth, promoting financial inclusion, and addressing the widening income gaps has emerged as a central concern in the present context. This academic discourse seeks to illuminate the multifaceted relationship between financial development and income inequality in the backdrop of the current economic dynamics [
5].
In an era characterized by unprecedented technological advancements, rapid globalization, and shifting socio-economic paradigms, financial development holds a pivotal role in shaping the trajectories of nations’ economic progress [
6]. A robust financial system is considered an essential conduit for channeling investments, fostering entrepreneurship, and catalyzing economic expansion. At the same time, the implications of financial development on income distribution patterns cannot be understated [
7]. As economies harness the potentials of financial innovations, questions arise concerning the extent to which these advancements contribute to equitable wealth distribution or inadvertently accentuate income disparities [
8].
In the context of this study, “financial development” refers to the growth and modernization of the financial sector within Central and Eastern European countries (CEEC). This includes the expansion and improvement of financial institutions such as banks, stock markets, and financial services. Contemporary financial systems encompass an array of institutions, markets, and instruments that serve as conduits for resource allocation and capital mobilization. These systems, ranging from banking and stock markets to emerging fintech platforms, offer avenues for individuals and businesses to access credit, manage risks, and engage in productive economic endeavors. Consequently, Levine [
9] believed that understanding how financial services are distributed across socio-economic strata and the impact of such distribution on income distribution is paramount.
Yet, the dynamic relationship between financial development and income inequality is nuanced and intricate. While financial systems have the potential to foster inclusive growth by providing opportunities for marginalized segments of society to participate in economic activities, concerns arise regarding the equitable distribution of financial services. Unequal access to credit and investment opportunities can hinder the upward mobility of disadvantaged populations, contributing to the widening income gap [
10]. As a result, policymakers grapple with the challenge of harnessing the positive aspects of financial development while mitigating its potential to exacerbate income inequality.
In the context of this study, income inequality is of particular interest as it pertains to CEECs. Understanding how income is distributed within these nations and how it has evolved over time is a key aspect of this research. In the backdrop of the contemporary economic landscape, the relationship between financial development and income inequality holds a particular resonance in the context of CEECs. As these nations traverse the intricate terrain of post-transition economies, the dynamic interplay between financial systems and income distribution patterns becomes a focal point of academic inquiry and policy consideration. Against the backdrop of historical transformations, rapid globalization, and evolving socio-economic paradigms, understanding how financial development influences income inequality in CEECs is a subject of great significance [
11,
12,
13].
The transition of CEECs from centrally planned to market-based economies in the latter part of the 20th century brought forth a host of challenges and opportunities. As these nations embraced liberalization, privatization, and economic reforms, financial development emerged as a crucial driver of economic growth and structural transformation. The proliferation of financial institutions, capital markets, and innovative financial products laid the foundation for enhanced resource allocation, investment, and economic diversification. Cevik and Correa-Caro [
14] found that this transition, however, was accompanied by a reshaping of income distribution patterns, sparking debates about the consequences of financial development on social equity.
At the heart of this exploration lies the recognition of the dual nature of financial development in CEECs. On one hand, financial development can act as a catalyst for inclusive growth, fostering entrepreneurship, investment, and job creation. On the other hand, concerns persist regarding unequal access to financial services, potential concentration of wealth, and the perpetuation of income disparities. These issues gain prominence as CEECs navigate the challenges of post-transition economies while grappling with the imperatives of sustainable and equitable development.
The CEECs have undergone remarkable social and economic transformations, aligning their economies and societies much more closely with the standards of Southern, Western, and Northern Europe than anyone could have imagined in 1989. These reforms, which led to the social and economic convergence of the CEE region with the rest of the European Union (EU), were not without their challenges: They involved significant social costs, including mass emigration from the region, insufficient social safety nets, and limited support for the elderly and disadvantaged [
15].
Over the past few decades, CEECs have witnessed a significant evolution in income inequality, reflecting the intricate interplay between economic transitions, policy shifts, and socio-economic dynamics [
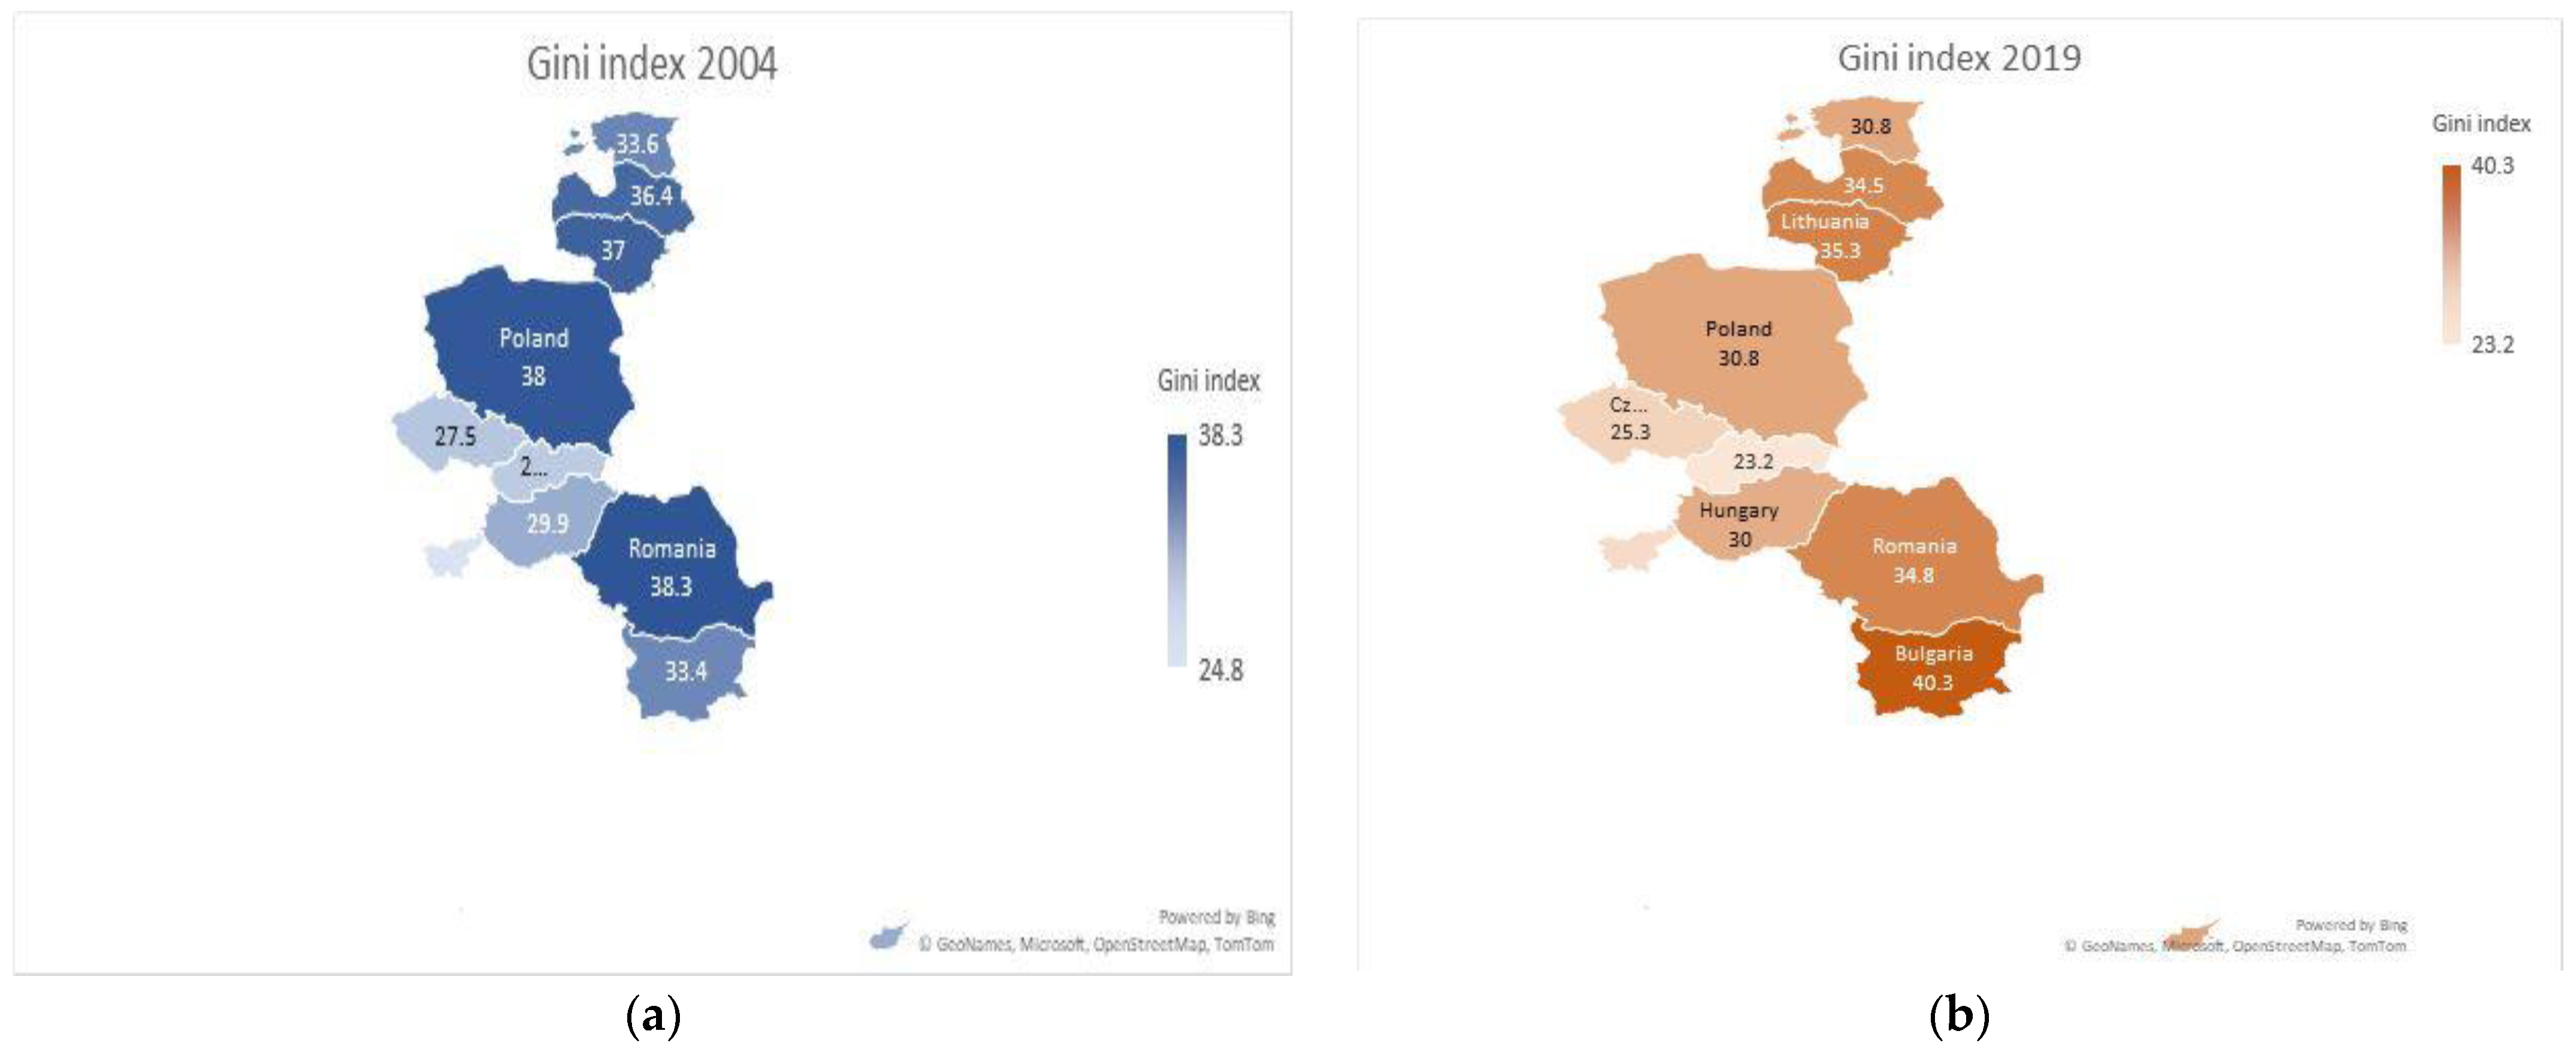
16]. As these countries transitioned from centrally planned to market-oriented economies, their income distribution patterns underwent significant changes. In the early stages of transition, income disparities often widened due to the realignment of economic structures, labor market shifts, and privatization processes. However, as market economies matured and policy interventions were introduced, some CEECs experienced a stabilization or even a decline in income inequality. For instance, countries like Hungary and the Czech Republic have witnessed relatively lower Gini coefficients in recent years, indicative of a more equitable income distribution. Conversely, countries like Bulgaria and Romania have grappled with persistently higher values [
17]. These trends highlight the nature of income inequality dynamics in CEE countries as shaped by historical legacies, policy choices, and the impact of financial development on income distribution.
The evolution of financial development in CEECs has been characterized by substantial progress and variations across the region. In the aftermath of the transition from centrally planned to market economies, CEECs embarked on a journey to modernize their financial systems and align them with global standards. For instance, countries like Poland and the Czech Republic have demonstrated impressive growth in their banking sectors, with indicators such as the ratio of bank assets to GDP reaching around 80% and 160%, respectively. Moreover, these countries have embraced financial innovation, with over 50% of their populations having access to digital banking services. In terms of capital market development, the Warsaw Stock Exchange has emerged as a leading player in the region, attracting both domestic and foreign investors. On the other hand, Bulgaria and Romania have experienced challenges related to non-performing loans and banking sector stability. Despite these variations, CEECs have made substantial strides in improving access to finance, as seen in the increase of credit to the private sector as a percentage of GDP, reaching approximately 50% and 40% in countries like Hungary and Slovakia, respectively [
18]. The journey towards comprehensive financial development in CEECs remains ongoing, reflecting the delicate balance between fostering growth, ensuring stability, and promoting inclusive access to financial services.
The financial development–income inequality nexus is a complex subject that has gained increased relevance, particularly in the context of CEECs. These countries, characterized by transition economies, underwent significant financial reforms post-1990s, making them an interesting case for studying the impact of financial development on income inequality [
19].
The study seeks to contribute to this ongoing dialogue by empirically examining the relationship between financial development and income inequality in CEECs. By applying sophisticated quantitative methods, the research aims to provide nuanced insights that can inform theory and practice in this important area of economic development. Extending from the importance of understanding the effects of financial development on income inequality, the study further incorporates the aspect of transition economies.
The disparities in income distribution and the associated social and economic challenges are another motivation for choosing the CEECs as a case study. Despite significant progress in their economic transition, the process has been uneven across countries and within countries, leading to significant disparities in income distribution. As such, it is crucial to understand the role of financial development in shaping these income disparities.
Thus, the study’s focus on the relationship between financial development and income inequality in CEECs is not only academically interesting but also has significant practical and policy implications. Its findings can contribute to a deeper understanding of this relationship and inform policy decisions aimed at promoting both financial development and income equality in these countries.
This paper is structured as follows:
Section 2 delves into a thorough review of the existing literature.
Section 3 presents the theoretical framework, methodology, and data used in this study. The study’s results and corresponding discussions are presented in
Section 4 and
Section 5. Finally,
Section 6 uncovers the primary conclusions of the study, offers policy recommendations, and acknowledges the study’s limitations, which are areas to be addressed in future research.
2. Literature Review
The relationship between financial development and income inequality is a complex and debated topic in economics. Different studies and empirical evidence have shown mixed results, and the relationship can vary depending on various factors, including the level of economic development, the structure of the financial system, and the policies in place.
Some research suggests that financial development can exacerbate income inequality, i.e., a positive relationship. This could happen through mechanisms such as unequal access to financial services, where the wealthy can access credit and investment opportunities more easily than the less affluent. Additionally, financial markets might primarily benefit the already wealthy, leading to a concentration of wealth and income. Hsieh et al. [
1] examined the relationship between financial development and income inequality in developing countries. The results suggest that financial development may exacerbate income inequality in these economies. Asongu and Odhiambo [
2] explored the relationship between financial development and income inequality in African countries. The findings indicate that financial development has a significant positive effect on income inequality in the context of African economies. Shahbaz and Shafiullah [
20] investigated the relationship between financial development and income inequality using data from the global subprime mortgage crisis. The findings suggest that financial development can lead to an increase in income inequality in both developed and developing economies. Kim and Lim [
21], due to the results they obtained, proved that the positive impact of financial development on income is manifested only if the country has reached a certain level of financial development.
On the other hand, some argue that a well-developed financial system can contribute to reducing income inequality, i.e., negative relationship. For instance, by providing access to credit and investment opportunities for marginalized populations, financial development might help reduce poverty and increase economic mobility. Furthermore, efficient financial markets can allocate capital to productive projects that can lead to economic growth and job creation. Asongu et al. [
22] explored the impact of financial inclusion and financial development on income inequality in African countries. The findings suggest that financial inclusion and financial development contribute to reducing income inequality. Demir et al. [
3] employed a new approach to investigate the relationship between financial development and income inequality. The results suggest that financial development contributes to a reduction in income inequality in emerging and developing economies. Van et al. [
23] examined the relationship between financial inclusion, financial development, and income inequality in Asian countries. The results indicate that financial inclusion and development can lead to a reduction in income inequality. There is also the possibility of a U-shaped relationship where, at the early stages of financial development, income inequality might decrease as access to finance becomes more widespread. However, as the financial system becomes more sophisticated and complex, income inequality might increase before potentially stabilizing or decreasing again. Destek et al. [
24] investigated the relationship between financial development and income inequality in Turkey. The results provided evidence of an inverted U-shaped relationship with income inequality for overall financial development and banking sector development. Mdingi et al. [
5] reviewed the existing literature on finance and income inequality, acknowledging that the relationship can exhibit a U-shaped pattern depending on the stage of economic development, level of financial development, and institutional quality. Zungu and Grelying [
25] explored the relationship between financial development and income inequality in 21 emerging economies using a panel smooth transition regression approach. The results suggest a U-shaped relationship where financial development initially reduces inequality but may exacerbate it beyond a certain threshold. Ahmed and Masih [
26] argued that financial development could lead to unequal income growth in the event that “access to finance is limited to a certain group of people depending on their income level, locality and their ability to provide collateral”. The results of their research show that income inequality is negatively related to market capitalization/GDP (the variable used to express financial development), indicating that low income inequality is associated with higher market capitalization/GDP. Based on these works, we can identify two empirical hypotheses regarding the current relationship: the hypothesis of an expansion of income inequality or of a restriction under the impact of financial development. Studies such as that of Park et al. [
27] found that financial development could reduce income inequality through the channel of financial inclusion. They argued that in economies where the poor have more access to financial services, the income-boosting benefits of financial development are more evenly distributed, which helps reduce income inequality.
The impact of financial development on income inequality is highly dependent on the institutional framework. Well-designed financial policies and regulations can mitigate the negative effects of financial development on inequality and promote more inclusive growth. Demirgüç-Kunt and Levine [
6] emphasized that the relationship between financial development and income inequality is contingent on the quality of financial institutions and the effectiveness of financial policies. Well-functioning institutions can mitigate the negative effects of financial development on inequality. Huynh and Tran [
4] examined the relationship between financial development, institutions, and income inequality. They emphasized that the effectiveness of institutions is crucial in shaping the impact of financial development on income inequality. Law et al. [
28] found that the relationship between financial development and income inequality in CEECs was conditioned by the level of financial openness and institutional quality.
Further examinations in the literature delve into the dimensions of financial development, the types of financial institutions involved, and the role of specific financial reforms. Thus, financial development is a multi-dimensional concept encompassing not only the size but also the depth and efficiency of financial markets. It is important to explore which dimensions of financial development have a more significant impact on income inequality. For instance, Ang [
29] found that the efficiency of financial intermediaries in allocating resources is more critical in reducing income inequality than the sheer size of the financial sector. Furthermore, the types of financial institutions and their roles in an economy can significantly influence the relationship between financial development and income inequality. For example, Beck et al. [
30] found that the expansion of banks and other formal financial institutions tends to reduce income inequality more effectively than the growth of informal or semi-formal financial entities. Nevertheless, specific financial reforms can also impact income inequality. Barajas et al. [
31] examined the impact of interest rate liberalization, a key financial reform, on income inequality. They found that such reforms could initially increase income inequality by favoring wealthier individuals but might ultimately lead to a more equitable income distribution as market mechanisms take hold and competition increases.
Within the context of CEECs, the literature provides more nuanced views. Gimet and Lagoarde-Segot [
32] found that the initial rise in income inequality during the transition period was mostly due to the rapid development of the stock market, which initially benefited the wealthier population segments. However, as the banking sector matured, and more people gained access to banking services, the income inequality started to decline. Some studies, such as that of Mlachila et al. [
11], found that in the early stages of transition, financial development increased income inequality in CEECs, which is consistent with the concentration hypothesis. This was largely due to the initial wealth-based access to the developing financial markets.
The literature shows that the relationship between financial development and income inequality can be influenced by various aspects of financial development, the types of financial institutions, specific financial reforms, and the process of financial integration. The case of CEECs demonstrates how country-specific factors, such as transition dynamics and regional financial integration, can shape this relationship. These insights underline the complexity of the financial development–income inequality nexus and the need for further research.
Further research in the literature explores the role of financial crises, financial literacy, demographic factors, and the interplay between financial development, income inequality, and poverty. Financial crises can significantly alter the relationship between financial development and income inequality. Jaumotte [
33] found that during financial crises, income inequality tends to rise, as the poor and middle-class households are disproportionately affected due to their limited access to credit and lower capacity to absorb shocks. This study highlights the importance of financial stability in managing income inequality. Financial literacy, the ability to understand and use various financial concepts, is increasingly recognized as a key factor in the financial development–income inequality relationship. Lusardi and Mitchell [
34] argued that financial literacy can enhance the benefits of financial development for lower-income households, reducing income inequality. They showed that improving financial literacy, particularly among disadvantaged groups, could ensure more equitable benefits from financial development. Demographic factors can also influence the financial development–income inequality relationship. A study by Jappelli and Pistaferri [
35] found that age and household composition significantly impact the distributional effects of financial development. For instance, younger and smaller households tend to benefit more from financial development, which could influence income inequality dynamics.
While much of the literature focuses on the relationship between financial development and income inequality, some studies examine the interplay between financial development, income inequality, and poverty. A study by Seven and Yetkiner [
36] found that financial development could exacerbate income inequality in the short run but reduce poverty in the long run by promoting economic growth.
In the context of CEECs, Sukiassyan [
12] found that while financial development reduced income inequality in the long run, it had limited impact on poverty reduction. On the other hand, Aidis et al. [
13] argued that the quality of the legal system and the level of corruption could significantly affect the impact of financial development on income inequality and poverty in these countries.
Thus, the literature suggests that the relationship between financial development and income inequality is influenced by a variety of factors, including financial crises, financial literacy, demographic factors, and the interaction between financial development, income inequality, and poverty. In the context of CEECs, country-specific factors, such as the quality of the legal system and the level of corruption, also play a crucial role. These findings underline the complex nature of the financial development–income inequality relationship and highlight the need for a comprehensive approach in policymaking.
The most recent study on the relationship between financial development and income inequality—but under the aspect of the impact of different types of financial development on the growth–inequality link—was carried out by Proano et al. [
37]. The authors concluded that economic growth leads to increased incomes of the population when financial institutions and markets are deeper and financial markets are more efficient. As a result, we see that the impact and the relationship between these components differ from one period to another depending on the level of financial development.
Although research on the relationship between financial development and income inequality has grown considerably in recent years, until now, no such research has been carried out to include the emerging economies of Central and Eastern Europe. Thus, the main objective of the proposed study is to identify to what extent financial development influences income inequality in CEECs.
Therefore, the following hypothesis was postulated:
Hypothesis: The financial development has a significant impact on the income inequality in CEESs.
The study constitutes several contributions. First of all, the use of quantile regression offers a nuanced understanding of the relationship between financial development and income inequality. Unlike ordinary least squares (OLS) regression, which provides an average effect, quantile regression allows for the examination of the effects of financial development across the entire distribution of income inequality (as measured by the Gini coefficient). This enables a more granular understanding of how financial development influences income inequality at different levels, which is particularly relevant given the potential non-linear relationship between these variables. Second of all, another contribution of the study is the use of a comprehensive financial development index, which encompasses various dimensions of financial development (such as financial depth, access, and efficiency), and it offers a more robust and comprehensive measure of financial development compared to single indicators. This helps to capture the complex nature of financial development and its potential effects on income inequality. Thirdly, the specific focus on CEECs fills a gap in the literature. These countries have undergone substantial financial development since transitioning from centrally planned to market economies. However, the impact of this financial development on income inequality in these countries has been relatively under-studied. By focusing on CEECs, the study provides valuable insights that are relevant not only for these countries but also for other transitioning and emerging economies. Finally, the findings of this study have important policy implications. Supporting financial development in CEECs and similar transition economies can be an effective strategy for tackling income inequality. Therefore, this study contributes to the literature by offering a comprehensive empirical analysis of the relationship between financial development and income inequality in CEECs. Its findings can inform policy debates and help guide the design of financial policies in these and other similar countries.
4. Results
In order to use quantile regression equation, normality, cross-section dependence, and heteroscedasticity tests are performed with the linear regression equation. The results of these tests are presented below.
Figure 3 indicates the Jarque–Bera test results. This is a statistical test used to assess whether a given dataset follows a normal distribution. It was introduced by Carlos Jarque and Anil Bera in 1980 [
46]. The test is based on the skewness and kurtosis of the data. The null hypothesis of the Jarque–Bera test is that the data are normally distributed. If the
p-value associated with the test is less than a chosen significance level, then we reject the null hypothesis and conclude that the data do not follow a normal distribution. The results show that the residuals are not normally distributed.
For the cross-section dependence, we applied three tests: the Breusch–Pagan Lagrange multiplier (LM) test statistic (1980) [
47], the Pesaran scaled LM (2004) [
48], and the Pesaran CD (2004) [
48]. The null hypothesis is that there is no cross-section dependence (correlation) in residuals. The null is rejected, and the results in
Table 2 show that the residuals are serially correlated because the
p-values for all the tests are below 0.05. The significance level can have a different standard, but the most commonly accepted significance level is 0.05. In addition, it essentially sets our level of reasonable doubt. If we set lower level, we will have a harder time rejecting the null hypothesis, and a higher level makes it easier to reject the null hypothesis. It is important to set our significance level before collecting data. If we set α later in the process, after we have collected our data, we will bias our results or be tempted to search for values that yield significant results.
The heteroscedasticity test belongs to the class of asymptotic tests known as Lagrange multiplier (LM) tests [
49]. Also, for the heteroscedasticity test, the results in
Table 3 reveal that the residuals are heteroscedastic because the null is rejected according to the value of the probability lower than 0.05. This is the final condition for the quantile regression to be applied in the study.
The Huber sandwich method is used for computing the covariance matrix, with individual sparsity estimates obtained using kernel methods. The bandwidth uses the Hall and Sheather [
50] formula, yielding a value of 0.16841. The quantile regression results indicate a statistically significant negative influence of financial development on the Gini coefficient. Therefore, with a percentage increase in the median value of financial development, there will be a 21.25 percent decrease in the median value of the Gini coefficient.
The bottom portion of the output reports the Koenker [
51] goodness-of-fit measure (pseudo R-squared) and adjusted version of the statistic as well as the scalar estimate of the sparsity using the kernel method. From the values of R-squared from
Table 4 it can be seen that the evolution of the Gini coefficient is explained in a proportion of 17% by the evolution of the financial development index. The probability associated with the quasi-LR statistic indicates that the model is stable.
Table 5 presents the results for the 10 quantiles proposed in this study. It can be seen that for the 10% and 20% quantiles, the coefficients are not significant because their
p-values are higher than 0.05. Except for the third and fifth quantiles, the results show an increasing trend that is statistically significant.
Quantile regression allows researchers to understand how the relationship between the independent variables and the dependent variable changes across different quantiles (or percentiles) of the dependent variable’s distribution.
In this case, the results indicate that for the 10% and 20% quantiles (i.e., the lowest 10% and 20% of the income distribution), the coefficients are not statistically significant. This is determined by the p-values being higher than 0.05, a commonly used threshold for statistical significance. In other words, at these low levels of the income distribution, there is no statistically significant relationship between financial development and income inequality.
However, for the remaining quantiles, an increasing trend is observed, which is statistically significant except for regarding the third and fifth quantiles. This means that as we move up the income distribution (from the lower percentiles to higher percentiles), financial development has a stronger and statistically significant impact on income inequality.
This result suggests that financial development may have a different impact on income inequality at different points in the income distribution. Specifically, it appears that financial development has a more significant impact on income inequality among higher-income groups in CEECs. This finding underscores the complexity of the relationship between financial development and income inequality and highlights the importance of considering income distribution when examining this relationship.
According to the results in
Table 5, following Koenker [
52],
Figure 4 displays a process graph for a modified version of the earlier equation: a median regression using the Engel data, where we fit the Gini coefficient data to the centered financial development index series and a constant. We display the results for 10 quantiles, along with 95% confidence intervals.
The Koenker and Bassett [
53] test results for the equality of the slope coefficients across quantiles are presented in
Table 6. According to Wald test, the chi-square value of slope equality test is 18.55, which is statistically significant. Therefore, it rejects the slope equality hypothesis at the 5% significance level, which means that slope equality is different across quantile levels. This means that the effect of the independent variables on the dependent variable differs across different quantiles of the dependent variable. In other words, the slope of the relationship between the independent and dependent variables is not the same across the distribution of the dependent variable.
We conclude that, after comparing the slope (non-intercept) coefficients of the estimated tau with the 10 taus specified in study, the coefficients differ across quantile values, and the conditional quantiles are not identical. The mention of “10 taus” refers to the specific quantiles that were modeled in the study. In quantile regression, tau corresponds to the quantile being modeled (e.g., tau = 0.10 corresponds to the 10th percentile; tau = 0.50 corresponds to the median or 50th percentile, etc.). The fact that the coefficients differ across quantile values means that the effect of the independent variables on the dependent variable is not the same at different points in the distribution of the dependent variable. Therefore, this result suggests that the relationship between financial development and income inequality in CEECs varies across the distribution of income inequality.
The symmetric quantiles test performs the Newey and Powell [
54] test of conditional symmetry. Conditional symmetry implies that the average value of two sets of coefficients for symmetric quantiles around the median will equal the value of the coefficients at the median. In
Table 7, the overall
p-value for the test is 0.00 and shows evidence of asymmetry across the quantiles.
This test is used in quantile regression analysis to check whether the effect of the independent variables on the dependent variable is symmetrical around the median. The test operates under the principle that if the relationship between the independent and dependent variables is symmetrical, then the average effect at two symmetric quantiles around the median (for example, the 25th and 75th percentiles) should be equal to the effect at the median.
In this case, the p-value for the test is reported as 0.00, which is less than the commonly used significance level of 0.05. A p-value less than 0.05 typically leads to the rejection of the null hypothesis. Therefore, the null hypothesis of symmetry is rejected, suggesting that the effect of the independent variables on the dependent variable is not symmetrical around the median.
In other words, this result provides evidence of asymmetry across the quantiles, meaning that the relationship between the independent variables (in this case, measures of financial development) and the dependent variable (income inequality) differs not only across the distribution but also in terms of how this relationship changes above and below the median. This finding adds to the complexity of the relationship between financial development and income inequality in CEECs, suggesting that the impact of financial development on income inequality may depend not only on the level of income inequality but also on whether that level is above or below the median.
5. Discussions
The results suggest that the relationship between financial development and income inequality in CEECs varies across the distribution of income inequality.
Thus, there is evidence to suggest that financial development can impact income inequality. A well-developed financial system can provide access to financial services such as credit, savings, and insurance, which can help individuals and businesses improve their economic well-being. This access to financial services can potentially reduce income inequality by enabling individuals from lower-income brackets to participate in economic activities and accumulate wealth. However, the relationship between financial development and income inequality is not straightforward. In some cases, financial development can exacerbate income inequality. For example, if financial services are primarily accessible to the wealthy or if the financial system is prone to speculative bubbles or financial crises, it can lead to increased inequality. Additionally, the relationship between the Gini coefficient and financial development can be influenced by other factors such as government policies, social institutions, and the overall level of economic development. Therefore, it is important to consider a wide range of factors when examining the relationship between the Gini coefficient and financial development.
Through this study, we managed to obtain results that support the hypothesis initiated by Rewilak [
55], according to which financial development helps to reduce poverty but not for all economies (economic spaces). Thus, the impact of financial development on incomes cannot be generalized. This hypothesis is argued by the fact that the income growth of the poorer classes reacts differently to financial development depending on the region. Also, the findings support the “trickle-down” hypothesis [
56], which suggests that financial development can reduce income inequality. This is also consistent with the findings of [
57], who found a negative relationship between financial development and income inequality.
As a result, our results are opposite to those obtained by Beck et al. [
30], where they analyzed the same relationship. If their results suggested that financial development is positively associated with increasing the incomes of the poor and that reforms in the financial sector reduce income inequality, in the case of our study, a statistically significant negative influence of financial development on the Gini coefficient was obtained. Moreover, the findings contrast with the “concentration” hypothesis, which suggests that financial development can exacerbate income inequality, at least in the short to medium term, as proposed by Greenwood and Jovanovic [
58]. Nevertheless, the results also differ from earlier studies on CEECs, such as that by Mlachila, Tapsoba, and Tapsoba [
11], who found that in the early stages of transition, financial development increased income inequality in these countries. Thus, we can conclude that these contradictory results on this subject can arouse even more interest but also the need for more extensive studies that confirm the hypothesis of a different impact of financial development on incomes depending on the economic level of the analyzed region.
6. Conclusions, Policy Implications, and Limitations
The study’s findings add to the mixed results in the literature on the relationship between financial development and income inequality. By using a nuanced approach of quantile regression, the study provides more detailed insights that can help reconcile some of the conflicting findings in the literature. Moreover, its focus on CEECs contributes to our understanding of the financial development–income inequality dynamics in these unique transition economies.
Thus, this study’s hypothesis that financial development has a significant impact on income inequality in CEECs is validated, and it also has theoretical and practical implications. It enriches our theoretical understanding of the financial development–income inequality relationship and provides valuable insights for policymaking and development practice.
Theoretical implications. The finding of a negative relationship between financial development and income inequality in CEECs contributes to the broader theoretical debate on the financial development–income inequality nexus. It provides empirical support for the “trickle-down” hypothesis, suggesting that financial development can indeed help reduce income inequality by improving access to credit for the poor, fostering entrepreneurial activities, and promoting economic mobility. This result also enriches our understanding of the dynamics of financial development and income inequality in transition economies. It shows that, over time, financial development in these economies can lead to more equitable income distribution despite the initial rise in income inequality during the early stages of transition.
Practical implications. The practical implications of this finding are significant for both policymakers and development practitioners.
Therefore, for policymakers in CEECs, the result underscores the importance of promoting financial development as a strategy for reducing income inequality. Policies that foster the growth and maturity of financial institutions, enhance the efficiency of financial markets, and improved financial inclusion can contribute to more equitable income distribution. Moreover, the results also highlight the need to ensure that the benefits of financial development reach all segments of society. This could involve promoting financial literacy, strengthening consumer protection in financial services, and using technology to expand access to financial services, particularly for under-served populations. Furthermore, given that financial development can contribute to more equitable income distribution, maintaining financial stability becomes even more crucial. Policymakers need to ensure a robust regulatory framework that prevents financial crises, which can disproportionately hurt the poor and exacerbate income inequality. Nevertheless, for international development agencies and financial institutions, this finding suggests that supporting financial development in CEECs and similar transition economies can be an effective strategy for tackling income inequality. This could involve providing technical assistance for financial sector reforms, promoting best practices in financial regulation, and supporting initiatives that enhance financial inclusion.
The study provides valuable insights into the relationship between financial development and income inequality. Like all research, it has certain limitations, which in turn suggest avenues for future research. Therefore, the study focuses on CEECs, and its findings may not be generalizable to other regions or countries with different socio-economic contexts. Also, while the financial development index and Gini coefficient are widely used indicators, they are not without limitations. For instance, the financial development index may not capture all aspects of financial development, and the Gini coefficient may not fully reflect the complexity of income inequality. The study’s time frame may limit its findings. If the study uses a relatively short time frame, it may not capture the long-term effects of financial development on income inequality. However, the quantitative approach used in this study, while valuable, does not provide qualitative insights into how and why financial development influences income inequality in CEECs.
Future research could examine the relationship between financial development and income inequality in other regions or compare findings across different regions to provide a more comprehensive picture. Also, future studies could use alternative or additional measures of financial development and income inequality to address the limitations of the financial development index and Gini coefficient.
These limitations and suggested future research avenues highlight the need for ongoing investigation into the complex relationship between financial development and income inequality.

 ,
, 


