Article

Superhydrophobic Microchannel Heat Exchanger for Electric Vehicle Heat Pump Performance Enhancement

1
School of Energy and Environment, City University of Hong Kong, Hong Kong, China
2
Shenzhen Research Institute, City University of Hong Kong, Shenzhen 518057, China
*
Author to whom correspondence should be addressed.
These authors contributed equally to this work.
Sustainability 2023, 15(18), 13998; https://doi.org/10.3390/su151813998
Submission received: 2 August 2023 / Revised: 13 September 2023 / Accepted: 19 September 2023 / Published: 21 September 2023
(This article belongs to the Section Energy Sustainability)

Abstract

:
Battery-powered electric vehicles (EVs) have emerged as an environmentally friendly and efficient alternative to traditional internal combustion engine vehicles, while their single-charge driving distances under cold conditions are significantly limited due to the high energy consumption of their heating systems. Heat pumps can provide an effective heating solution for EVs, but their coefficient of performance (COP) is hampered by heat transfer deterioration due to frost accumulation. This study proposes a solution to this issue by introducing a microchannel heat exchanger (MHE) with superhydrophobic surface treatment (SHST) as a heat pump evaporator. A computational fluid dynamics MHE model and a dynamic heat pump model are developed and rigorously validated to examine the detrimental impact of frost accumulation on heat transfer, airflow resistance, and heat pump performance. When the frost layer thickness is 0.8 mm at a given air-side velocity of 1.0 m/s, the air-side heat transfer coefficient can be reduced by about 75%, and the air-side pressure drop sharply increases by 28.4 times. As frost thickness increases from 0 to 0.8 mm, the heating capacity drops from 3.97 to 1.82 kW, and the system COP declines from 3.17 to 2.30. Experimental results show that the frost thickness of the MHE with SHST reaches approximately 0.4 mm after 30 min, compared to that of 0.8 mm of the MHE without SHST, illustrating the defrosting capability of the superhydrophobic coating. The study concludes by comparing the performance of various heating methods in EVs to highlight the advantages of SHST technology. As compared to traditional heat pumps, the heating power consumption of the proposed system is reduced by 48.7% due to the defrosting effect of the SHST. Moreover, the single-charge driving distance is extended to 327.27 km, an improvement of 8.99% over the heat pump without SHST.

1. Introduction

Amid the global shift towards carbon neutrality, battery-powered electric vehicles (EVs) have emerged as an environmentally friendly and efficient alternative to traditional internal combustion engine vehicles, attracting significant attention in recent years [1,2]. For EVs reliant entirely on battery power, the air conditioning system is the second most energy-intensive component after the powertrain, consuming about a third of the total energy supplied by the battery [3]. Therefore, it plays a critical role in improving energy efficiency and thermal comfort in EVs [4]. The energy sources for air conditioning systems differ between electric and fuel vehicles. Fuel vehicles use the engine to drive the air conditioning compressor for cooling and exploit waste heat for heating and defrosting. However, EVs do not have the benefit of engine waste heat [5]. As a result, the energy needed for cooling, heating, and defrosting in EVs comes solely from the battery, significantly decreasing the single-charge driving distance.
Under severe winter conditions, the heat pump system is an effective alternative to traditional positive temperature coefficient (PTC) heating for EV heating due its high coefficient of performance (COP). Contrary to the cooling process, where the condenser is inside, the heating process uses an indoor condenser and an outdoor evaporator [6]. The water vapor in outdoor air often results in frost accumulation on the evaporator surface, creating a layer that increases thermal resistance and decreases the heat transfer coefficient [7]. This significantly affects the heat transfer performance and the COP of the heat pump system [8]. Because frost accumulation substantially influences the single-charge driving distance of pure EVs, defrosting techniques for heat pump systems have become a key research area in the automotive and air conditioning sectors and a crucial technology to boost the single-charge driving distance of pure EVs [9].
Defrosting techniques can be classified into active and passive methods [10,11]. Active defrosting techniques include compressor shutdown defrosting, electric heating defrosting, hot-water-spraying defrosting, hot-gas bypass defrosting, reverse-cycle defrosting, etc. [12]. Passive defrosting techniques typically involve the modification of the heat exchanger surface morphology through microgrooves, antifreeze coatings, and superhydrophobic coatings to enhance drainage efficiency and reduce frost adhesion [13]. Although passive defrosting techniques exhibit a slower defrost rate than their active counterparts, they focus on preventing frost accumulation at the source and facilitating frost melting [14]. Notably, passive defrosting methods do not require additional systems or extra energy input [15], making them a prominent area of research in recent years.
Several studies have examined the defrosting performance of different passive methods. Amer et al. [16] carried out a comparative analysis of various defrosting techniques, discovering that passive defrosting methods could facilitate frost liquid drainage. Furthermore, superhydrophobic coatings were found to effectively delay frost initiation and exhibited reduced water adhesion during defrosting, offering superior performance compared to hydrophilic and uncoated surfaces. Li et al. [17] conducted periodic frost–defrost experiments on vertical fins coated with hydrophilic and superhydrophobic coatings. They modeled the drainage performance of these surface coatings using dynamic tilt angles. Their results indicated that superhydrophobic surfaces expelled frost in the form of a frost–water mixture during defrosting, thereby reducing the defrosting time by approximately 9.8% compared to hydrophilic surfaces. Consequently, the defrosting capabilities of superhydrophobic surface treatment (SHST) technology proved to be superior to other passive defrosting methods [18].
The defrosting mechanism and performance of SHST technology on heat exchangers have been extensively researched recently. This technology can form a water film on the heat exchanger surface, leading to an approximate reduction of 24% in frost thickness [19]. This reduction can lead to a decrease in wind resistance and a 44% reduction in defrosting time during heating [20]. Research has demonstrated that applying a superhydrophobic coating to the heat exchanger surface decreases condensate formation [21]. It was found that the frost thickness and mass of a fin-tube heat exchanger with SHST were 17.1% and 28.8% less than those of a bare one. This reduced condensate curtailed energy loss due to droplet evaporation and improved defrosting efficiency. In addition, frost accumulation on superhydrophobic surfaces was reported to take twice as long as on untreated surfaces [22]. The frost deposition on the surface with SHST was delayed for 55 min compared with the plain copper surface. This effect was largely due to the diminished adhesion of condensate on superhydrophobic surfaces, where droplets often form spherical shapes and display jumping and rolling behaviors [23]. On a nanostructured Al surface, frost formation was delayed more than four times compared to a smooth Al surface. Therefore, SHST technology has potential to solve frosting problems of outdoor heat exchangers in cold winters.
As evidenced by prior research, SHST techniques have proven effective in enhancing the heat transfer performance of traditional heat exchangers, particularly in large-scale air conditioning systems operating under cold winter conditions. However, there is a research gap concerning the implications of applying the superhydrophobic coating to microchannel heat exchangers (MHEs). MHEs, with their compact structure, lightweight design, and excellent heat transfer capabilities, are well-suited for integration into electric vehicle heat pump systems [24]. It is important to note that the current emphasis of SHST techniques primarily concerns the prevention of frost accumulation, with less investigation into their impact on the cycle performance of heat pumps, such as improving the COP and reducing the compression power.
Therefore, this study proposes a superhydrophobic surface treatment-based MHE for application in an electric vehicle heat pump, targeting fin defrosting, flow resistance reduction, and heat transfer enhancement. Owing to the excellent defrosting effect and heat transfer performance under cold conditions, the COP of the heat pump system and the single-charge driving distance of the electric vehicle are significantly improved by the proposed microchannel heat exchanger with SHST. Based on the computational fluid dynamics (CFD) tool FLUENT that has been verified with high accuracy which has been extensively used in some applications [25,26,27,28], we investigate the influence of frost accumulation on the heat transfer coefficient and pressure drop. Moreover, we also study the defrosting effect of the superhydrophobic surface on heat transfer performance improvement and flow resistance reduction to elucidate the synergistic mechanism. A dynamic heat pump model utilizing the microchannel heat exchanger with a superhydrophobic surface is developed and validated by experimental results. An experiment is conducted to measure and compare the frost thickness on MHEs with and without SHST. Lastly, we make a fair comparison of the COP, compressor power, fan power, and single-charge driving distance of the heat pump with and without a superhydrophobic surface, highlighting the superiority of SHST techniques.

2. Methodology

In this work, an MHE model derived from the published works is presented to estimate heat transfer performance and flow resistance, with related parameter settings given. A CFD simulation of microchannel heat exchangers is conducted, and the simulated results agree well with the results from the established MHE model. Finally, a heat pump model is developed and verified with high accuracy to investigate the cycle performance based on Modelica language.
The flowchart of this work is presented in Figure 1 to express the relationship between the established models. Based on the operating and geometric data, the heat transfer coefficient and pressure drop can be estimated based on the MHE model (Equations (1)–(8)) and CFD simulation (Equations (9)–(16)). The results between the two models are in good agreement, and the CFD simulation can help us understand the effect of frost formation on cycle performance in terms of heat transfer and flow resistance. By combining the MHE model, CFD simulation, and heat pump model (Equations (17)–(23)), a multi-scale mathematical model is developed to investigate the cycle performance and single-charge driving distance. The effects of frosting formation, as well as operating conditions, geometry parameters, and other factors, on cycle performance can also be predicted.

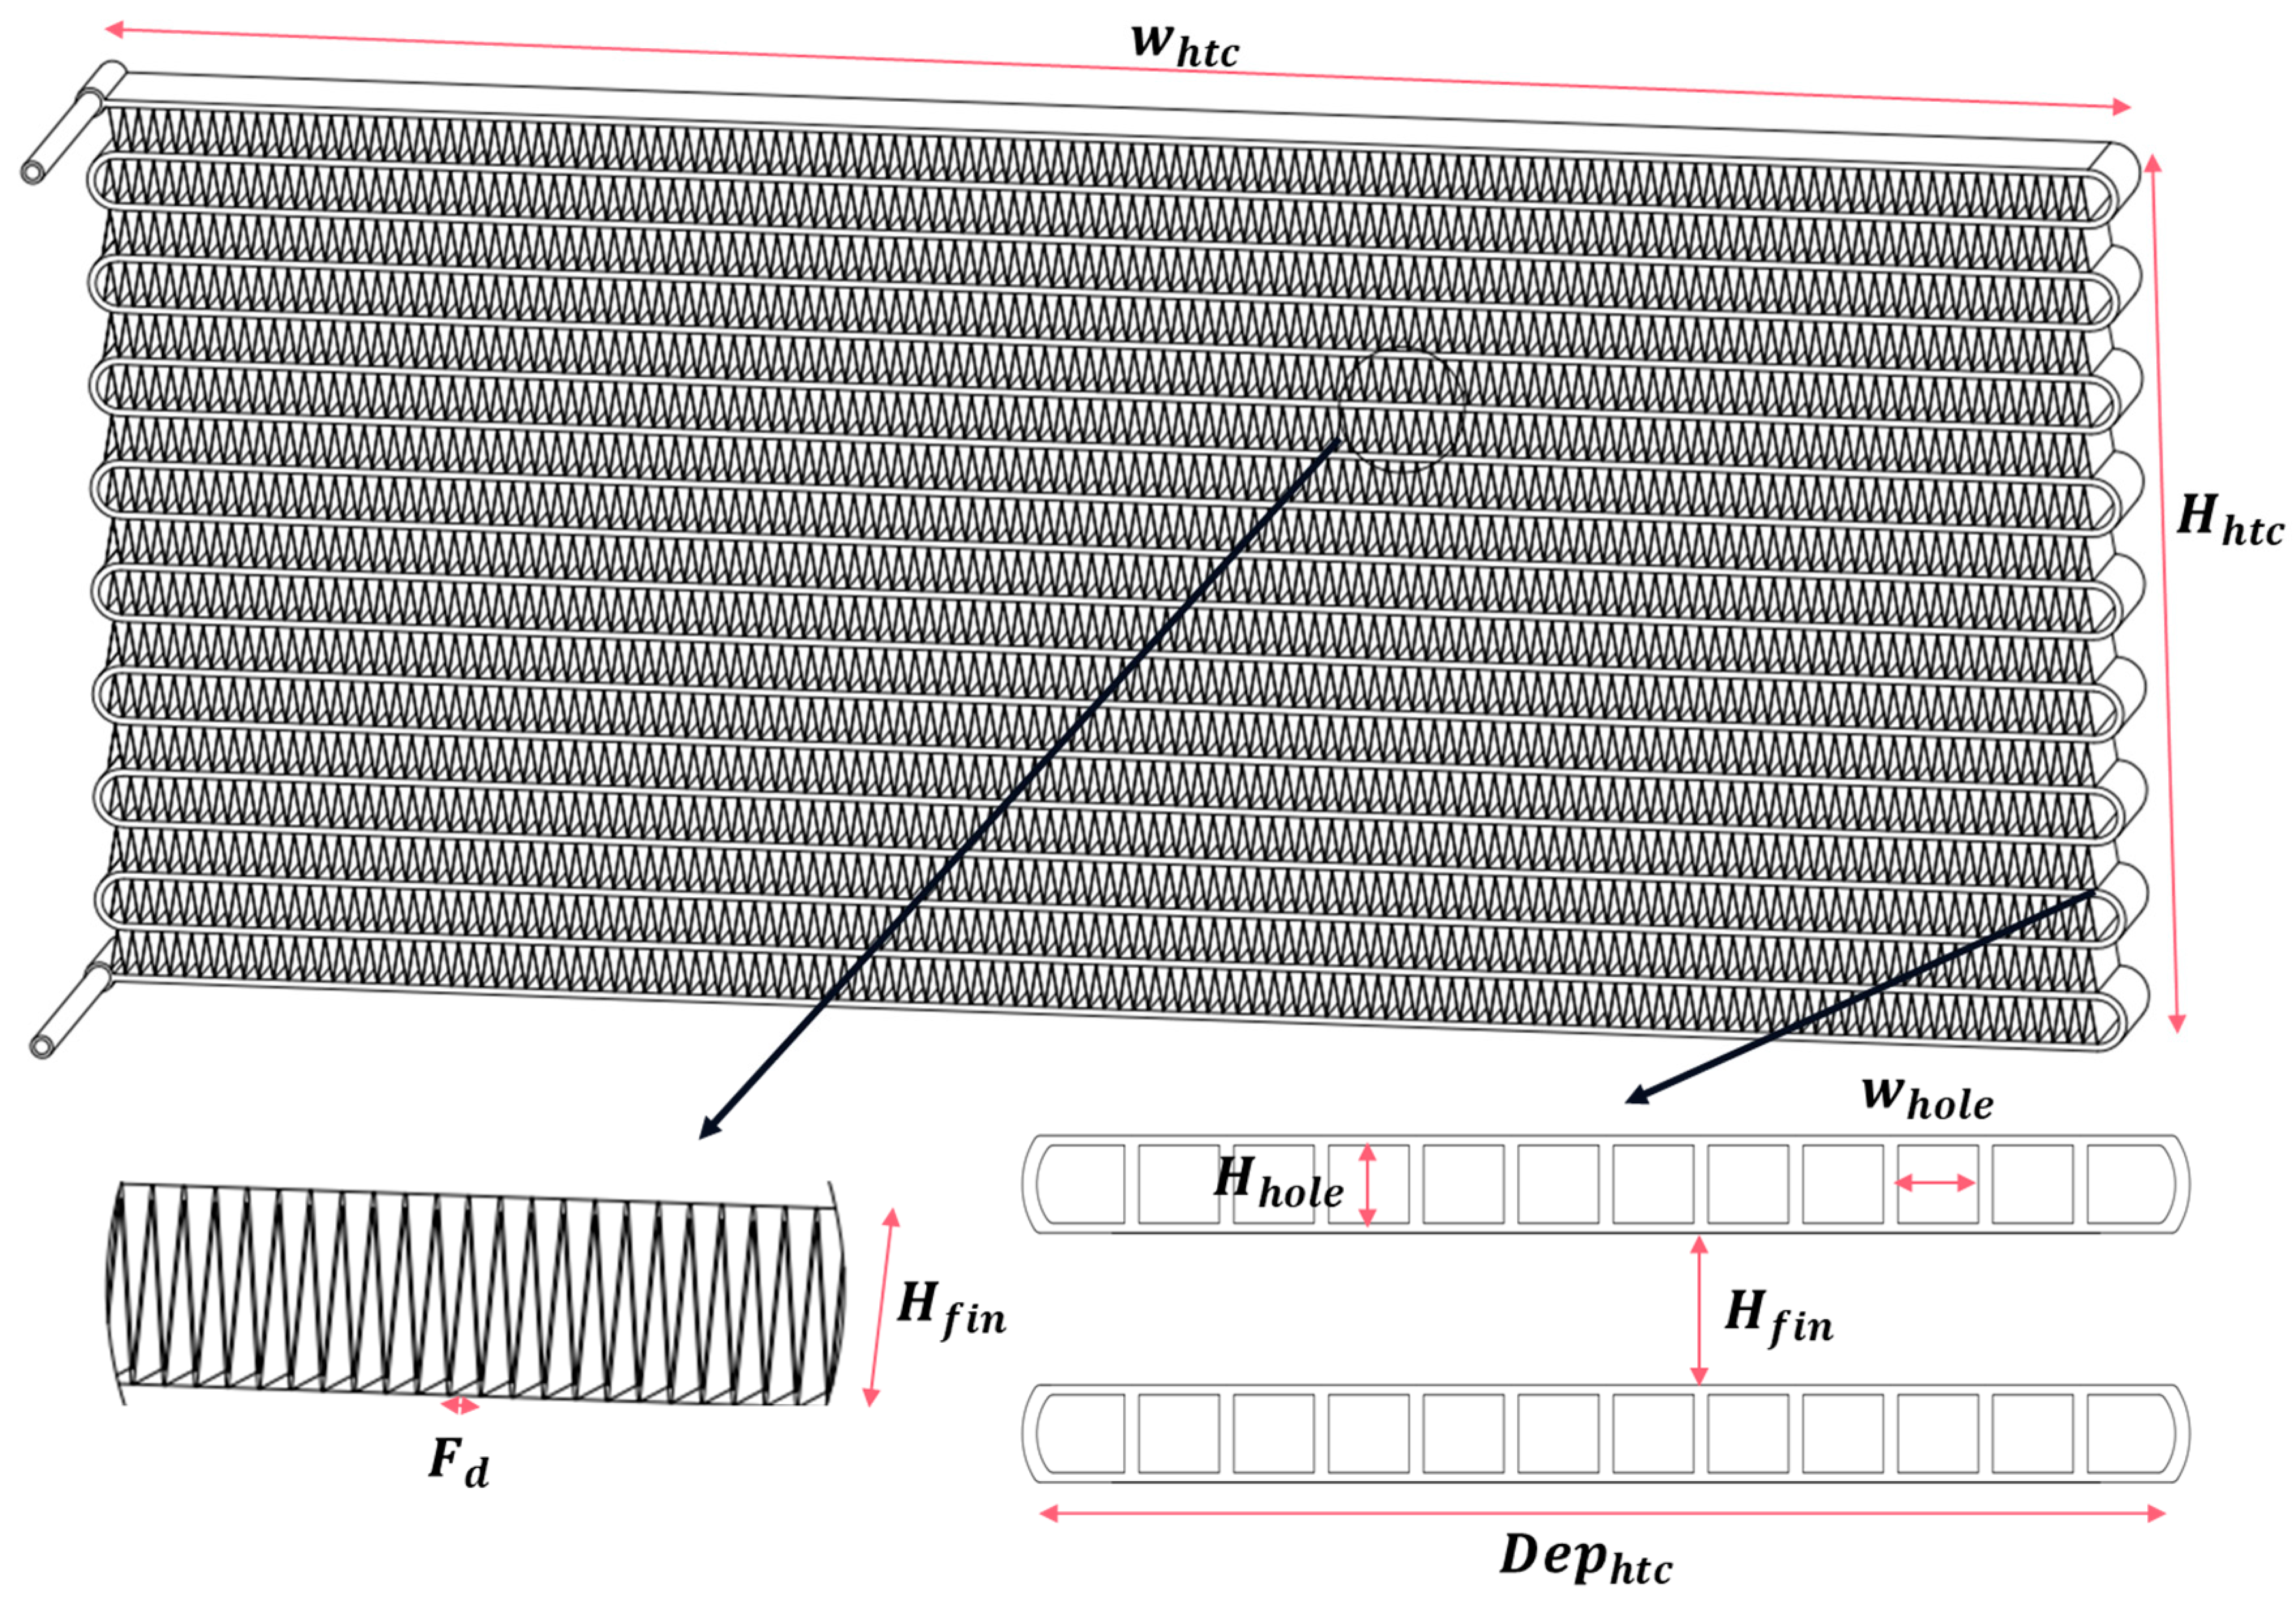
2.1. Microchannel Heat Exchanger Model

The geometric structure and parameters of the studied microchannel heat exchanger are presented in Figure 2 and Table 1, respectively. Based on these parameters, the heat transfer coefficients and pressure drop can be estimated using the following equations.
The hydraulic diameter of the air side is calculated as follows:
D a = 2 F d H f i n F d + 2 ( F d 2 ) 2 + H f i n 2
The heat transfer area at the air side is calculated as follows:
A a = D e p h t c ( F d + 2 ( F d 2 ) 2 + H f i n 2 ) N t u b e w h t c F d
where all the geometric parameters in Equations (1) and (2) can be found in Table 1.
The air-side convective heat transfer coefficient α a and pressure drop Δ P a are defined by [29,30,31,32]:
α a = j ρ a v e l o a C p , a P r 2 / 3
Δ P a = f G a 2 2 ρ a A t o t A m i n
P r = C p , a i r μ a λ
R e a = ρ a v e l o a D a μ
j = 0.874 R e a 0.716
f = 0.778 R e a 0.375
where ρ a refers to the average air density; v e l o a is the velocity of the air; C p , a and μ a are the specific heat capacity and dynamic viscosity of the air; R e and P r refer to the Reynolds number and Prandtl number, respectively. N u refers to the Nusselt number; j denotes the Colburn j-factor, which is a widely used analogy between heat, momentum, and mass transfer. G a refers to the air mass flux; A m i n is the minimum free-flow area of air through the core; A t o t is the total heat transfer area in the air side. f refers to the friction factor.

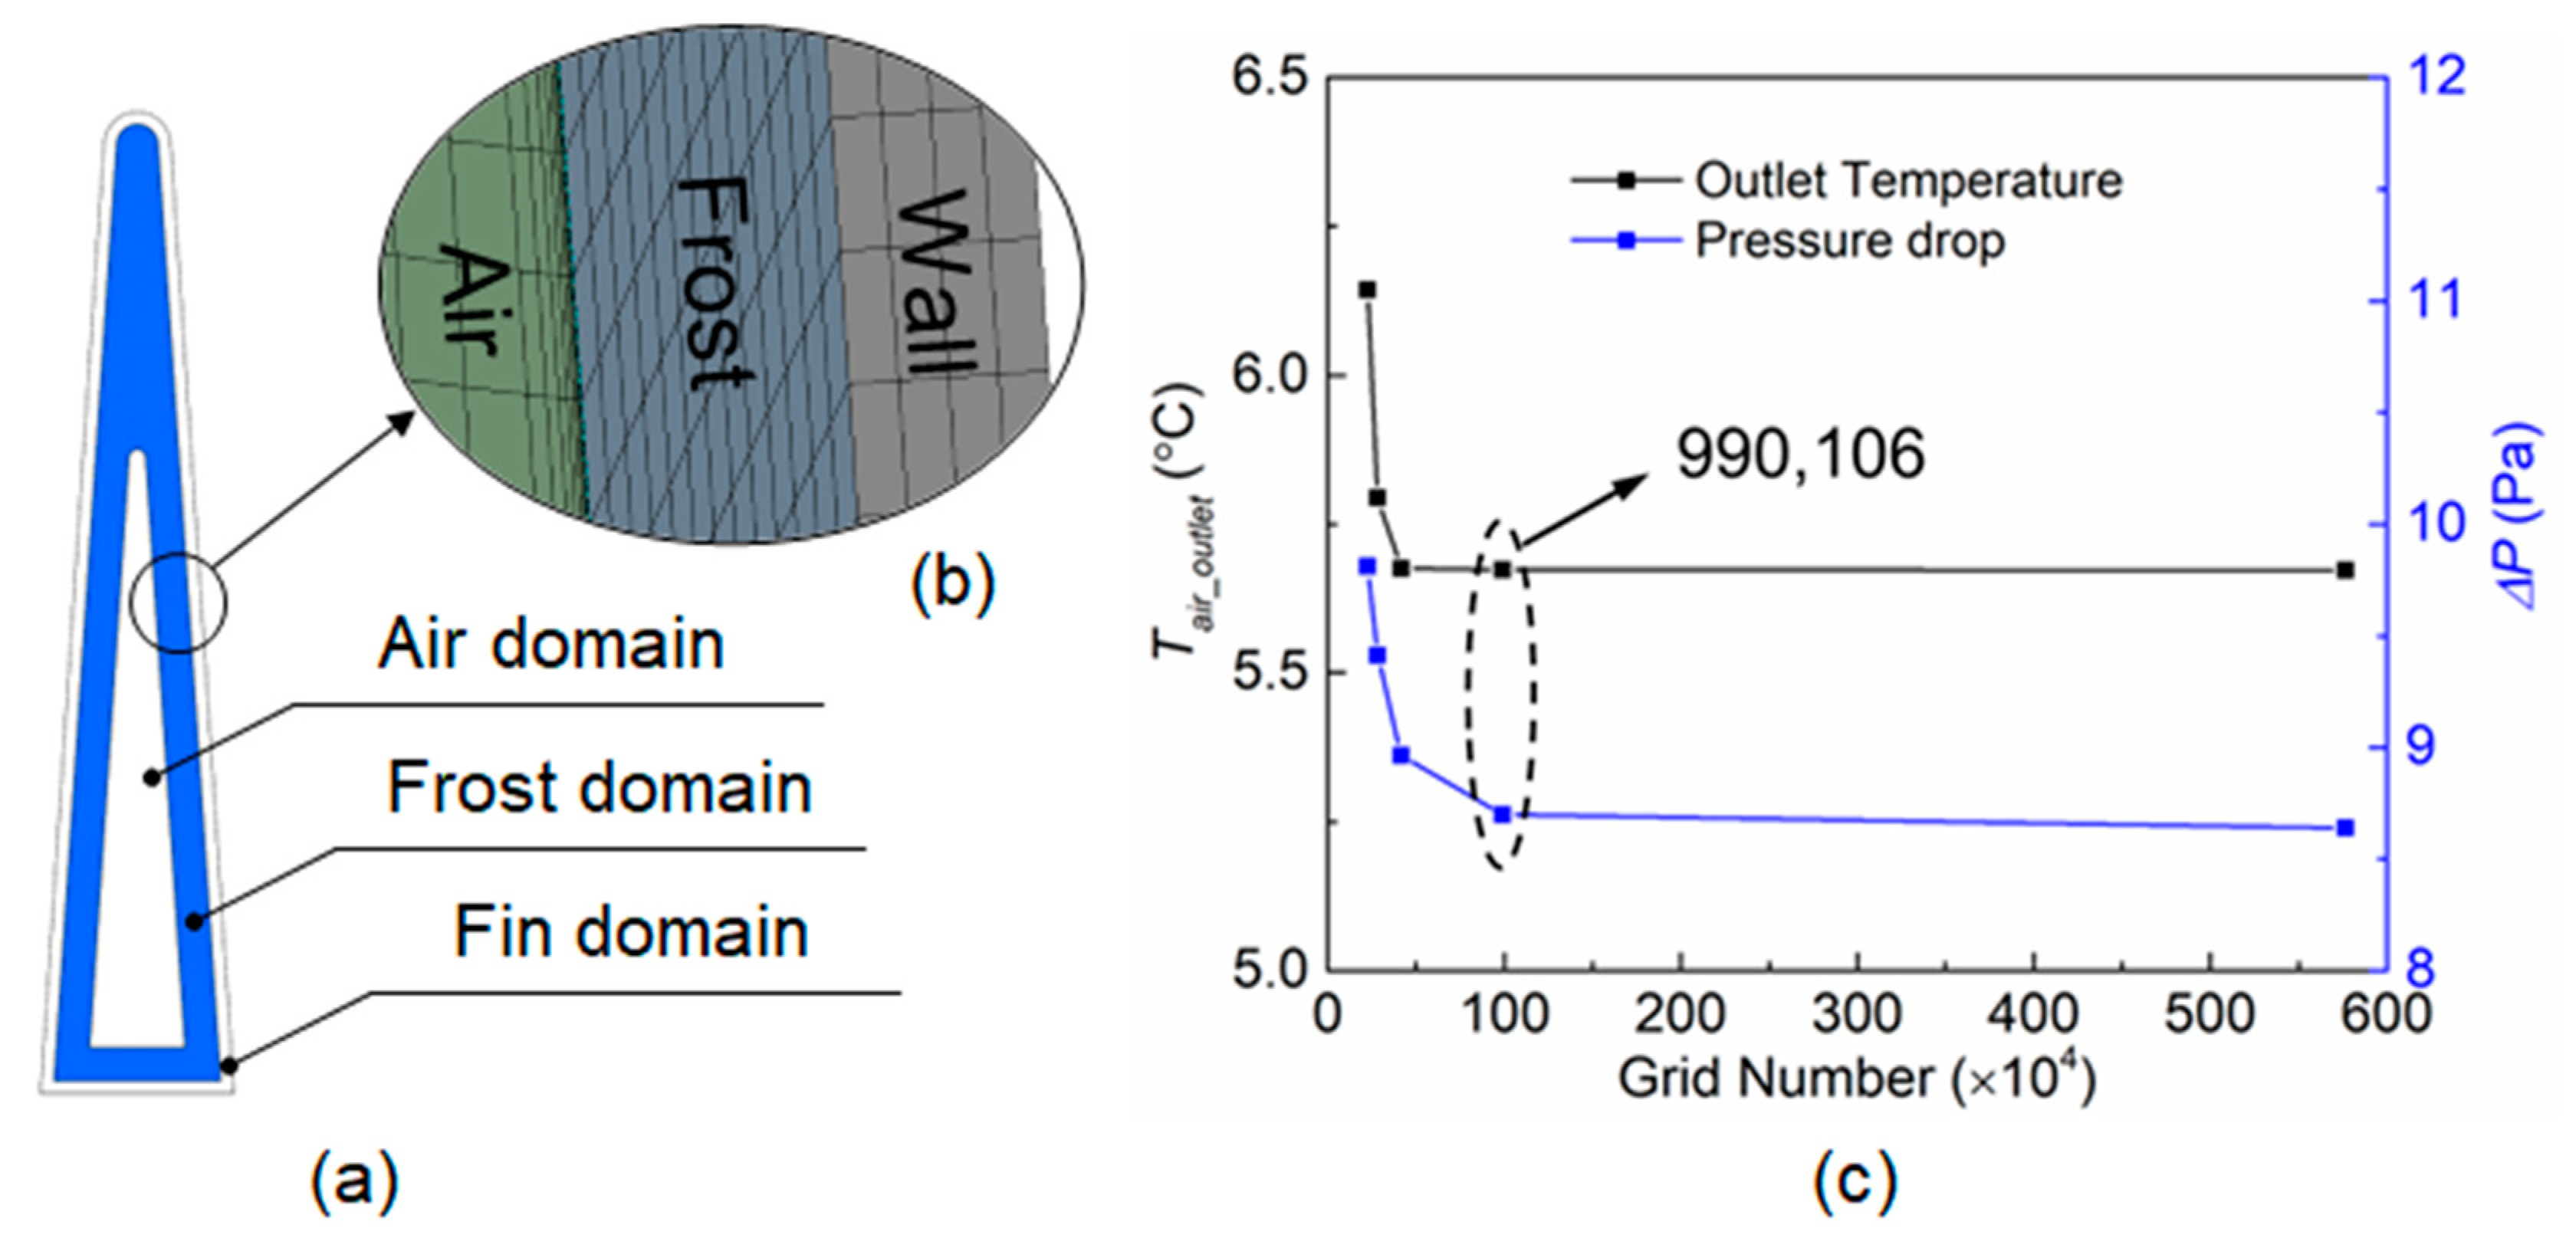
2.2. Air-Side CFD Simulation

A CFD model is developed to evaluate the effects of air velocity and frost thickness on the microchannel heat exchanger in detail. Frost growth on the fin surface involves complex heat and mass transfer processes. To simplify the simulation, some assumptions are as follows:
  • The frost distribution is homogeneous and uniform on the surface of the heat exchanger.
  • The thermal conductively of the frost ( λ f) is considered to be a function of the frost density as follows [33]:
    λ f = 1.202 × 10 3 ρ f 0.963
    where ρf is the frost density, which is considered to be 1000 kg/m3 in this work.
  • The heat radiation between the air and frost layer is negligible.
The laminar model is used to simulate the flow of the air side due to the low Reynolds number. Detailed governing equations, including mass, energy, and momentum equations, are given as follows [34]:
· ( ρ v ) = 0
· ( ρ v v ) = p + · τ ̿ + ρ g + F
· v ρ E + p = · λ T
where ρ is the air density; v is the air velocity; p is the pressure; τ ̿ is the stress tensor; g is the gravitational acceleration; F is the external body forces; E is the energy; λ is the thermal conductivity; T is the temperature.
In this CFD simulation, the computational domains include the air domain, frost domain, and fin domain, as shown in Figure 3a. In an effort to balance efficiency with accuracy in calculations, simulations are conducted using four distinct grid groups, comprising 226,570, 283,946, 415,650, 990,106, and 5,766,436 meshes, respectively. The detailed boundary conditions are as follows:
Air-side velocity-inlet boundary:
v a = v i n ,   T a = T i n
Air-side outflow boundary:
v a = 0 ,   T a = 0
Constant temperature wall of the fin:
v a = 0 ,   T a = T w a l l
Adiabatic wall of the fin:
v a = 0 ,   T a = 0
The computational meshes are shown in Figure 3b. The convergence criteria for the calculation are that (1) the air-side outlet temperature reached steady values, or (2) the relative residuals for all the governing equations are lower than 10−10. Grid independence is validated by comparing the outlet temperature and inlet pressure of the air domain. Based on the boundary conditions given in Table 2, Figure 3b demonstrates that the grid scheme with 990,106 meshes achieves independence.

2.3. Heat Pump Cycle Model

For the heat pump cycle model, the mass flow rate through the compressor is defined by [35]:
m r τ = η v o l V c o m p n 60 v r τ
where m r is the mass flow rate of the refrigerant; η v o l is the volumetric efficiency of the compressor; v r refers to the specific volume of the refrigerant; V c o m p and n denote the theoretical displacement and frequency of the compressor.
The power consumed by the compressor is defined by [36,37]:
W ˙ c o m p τ = m ˙ r τ · h o u t , i d e τ h i n τ η i s , c o m p · η m e , c o m p
where W ˙ c o m p refers to the power consumed by the compressor; h o u t , i d e and h i n refer to the ideal specific refrigerant enthalpy at the outlet and the specific refrigerant enthalpy at the inlet; η i s , c o m p and η m e , c o m p are the isentropic efficiency and mechanical efficiency, respectively.
The flow in the expansion valve can be regarded as an adiabatic throttling process as follows [38]:
h e x , i n τ = h e x , o u t τ
m ˙ r τ = c e x A e x 2 ρ r ( P e x , i n τ P e x , o u t τ )
where h e x , i n and h e x , o u t refer to the specific enthalpies of the expansion valve inlet and outlet, respectively; P e x , i n and P e x , o u t refer to the pressures of the expansion valve inlet and outlet, respectively; c e x denotes the flow coefficient; A e x is the flow area of the expansion valve.
The power consumed by the fan is defined as follows:
W ˙ f a n τ = v e l o a A h t c Δ P a τ η f a n
where W ˙ f a n refers to the power consumed by the fan; A h t c is the cross-sectional area of the heat exchanger; η f a n is the fan efficiency.
C O P c o m p is the coefficient of performance only considering compressor power, and C O P s y s is the coefficient of performance considering fan power, and these are defined by [39,40]:
C O P c o m p τ = Q c τ W ˙ c o m p τ
C O P s y s τ = Q c τ W ˙ c o m p τ + W ˙ f a n τ
where Q c refers to the heat duty of the condenser for heating.

2.4. Model Validation

To verify the feasibility of the established cycle model, the results estimated from the cycle model are compared with those from an experiment on a heat pump applied in an electric vehicle. The investigated heat pump is designed with a cooling capacity of 23 kW and a working fluid of R410a. The width, length, and depth of the external heat exchanger are 1200 mm, 756 mm, and 101.6 mm, respectively, while those of the internal heat exchanger are 681 mm, 378 mm, and 101.6 mm, respectively. The parameter settings of the test conditions for cooling/heating are listed in Table 3.
Table 4 and Table 5 present the cooling and heating performance comparison between the experiment and simulation. Under the operating conditions for cooling, the deviations of cooling capacity, compressor power, and COP between the experiment and simulation results are 0.43%, 2.38%, and 2.08%. Under the operating conditions for heating, the deviations of cooling capacity, compressor power, and COP between the experiment and simulation results are 5.17%, 4.38%, and 8.56%. Hence, the deviations in cooling capacity, compressor power, and high-side pressure are lower than 10%, indicating that the established heat pump model is accurate enough for further study.
To validate the developed CFD model, the simulation results are compared with the data published in [31]. In that study, the air-side heat transfer and flow performances of a multi-port serpentine cross-flow microchannel heat exchanger were investigated experimentally, and the airflow and heat transfer correlations were derived. It can be seen from Figure 4 that the Nusselt number and pressure drop predicted by the CFD model are in good agreement with the experimental data.

3. Air-Side Flow and Heat Transfer Characteristics with Frost Growth

This section investigates the effect of frost growth on the heat transfer performance and flow resistance of MHEs with and without SHST.

3.1. The Heat Transfer Coefficients with and without SHST

Figure 5 depicts the effect of the frost layer thickness on the heat transfer coefficient under different air velocities, and the corresponding Reynold number is between 11.6 and 306.7. In this work, the microchannel heat exchanger without frost growth is considered as a baseline. It can be found that the heat transfer coefficient increases with the increase in air velocity with a power-law relationship, which agrees with the experimental data [31]. For a given air velocity, the heat transfer coefficient decreases as the frost layer thickness increases. The decrease can be attributed to the thermal resistance caused by frost growth. Increasing air velocity improves the heat transfer coefficient, which can relieve the effect of frost growth on heat transfer. Meanwhile, frost growth also decreases the effective heat transfer area, resulting in poor heat transfer performance.
To further understand the effect of frost growth on the air-side heat transfer, a quantitative index (αh) is proposed. The αh represents the ratio between the heat transfer coefficient of the frosted case and that of the baseline (without frost). The frost layer thickness significantly affects the heat transfer characteristics, as shown in Figure 6. The heat transfer coefficient is reduced by about 75% when the frost layer thickness is 0.8 mm. Meanwhile, it can be found from Figure 6 that the effect of the frost growth on the heat transfer coefficient is more significant at a lower velocity.

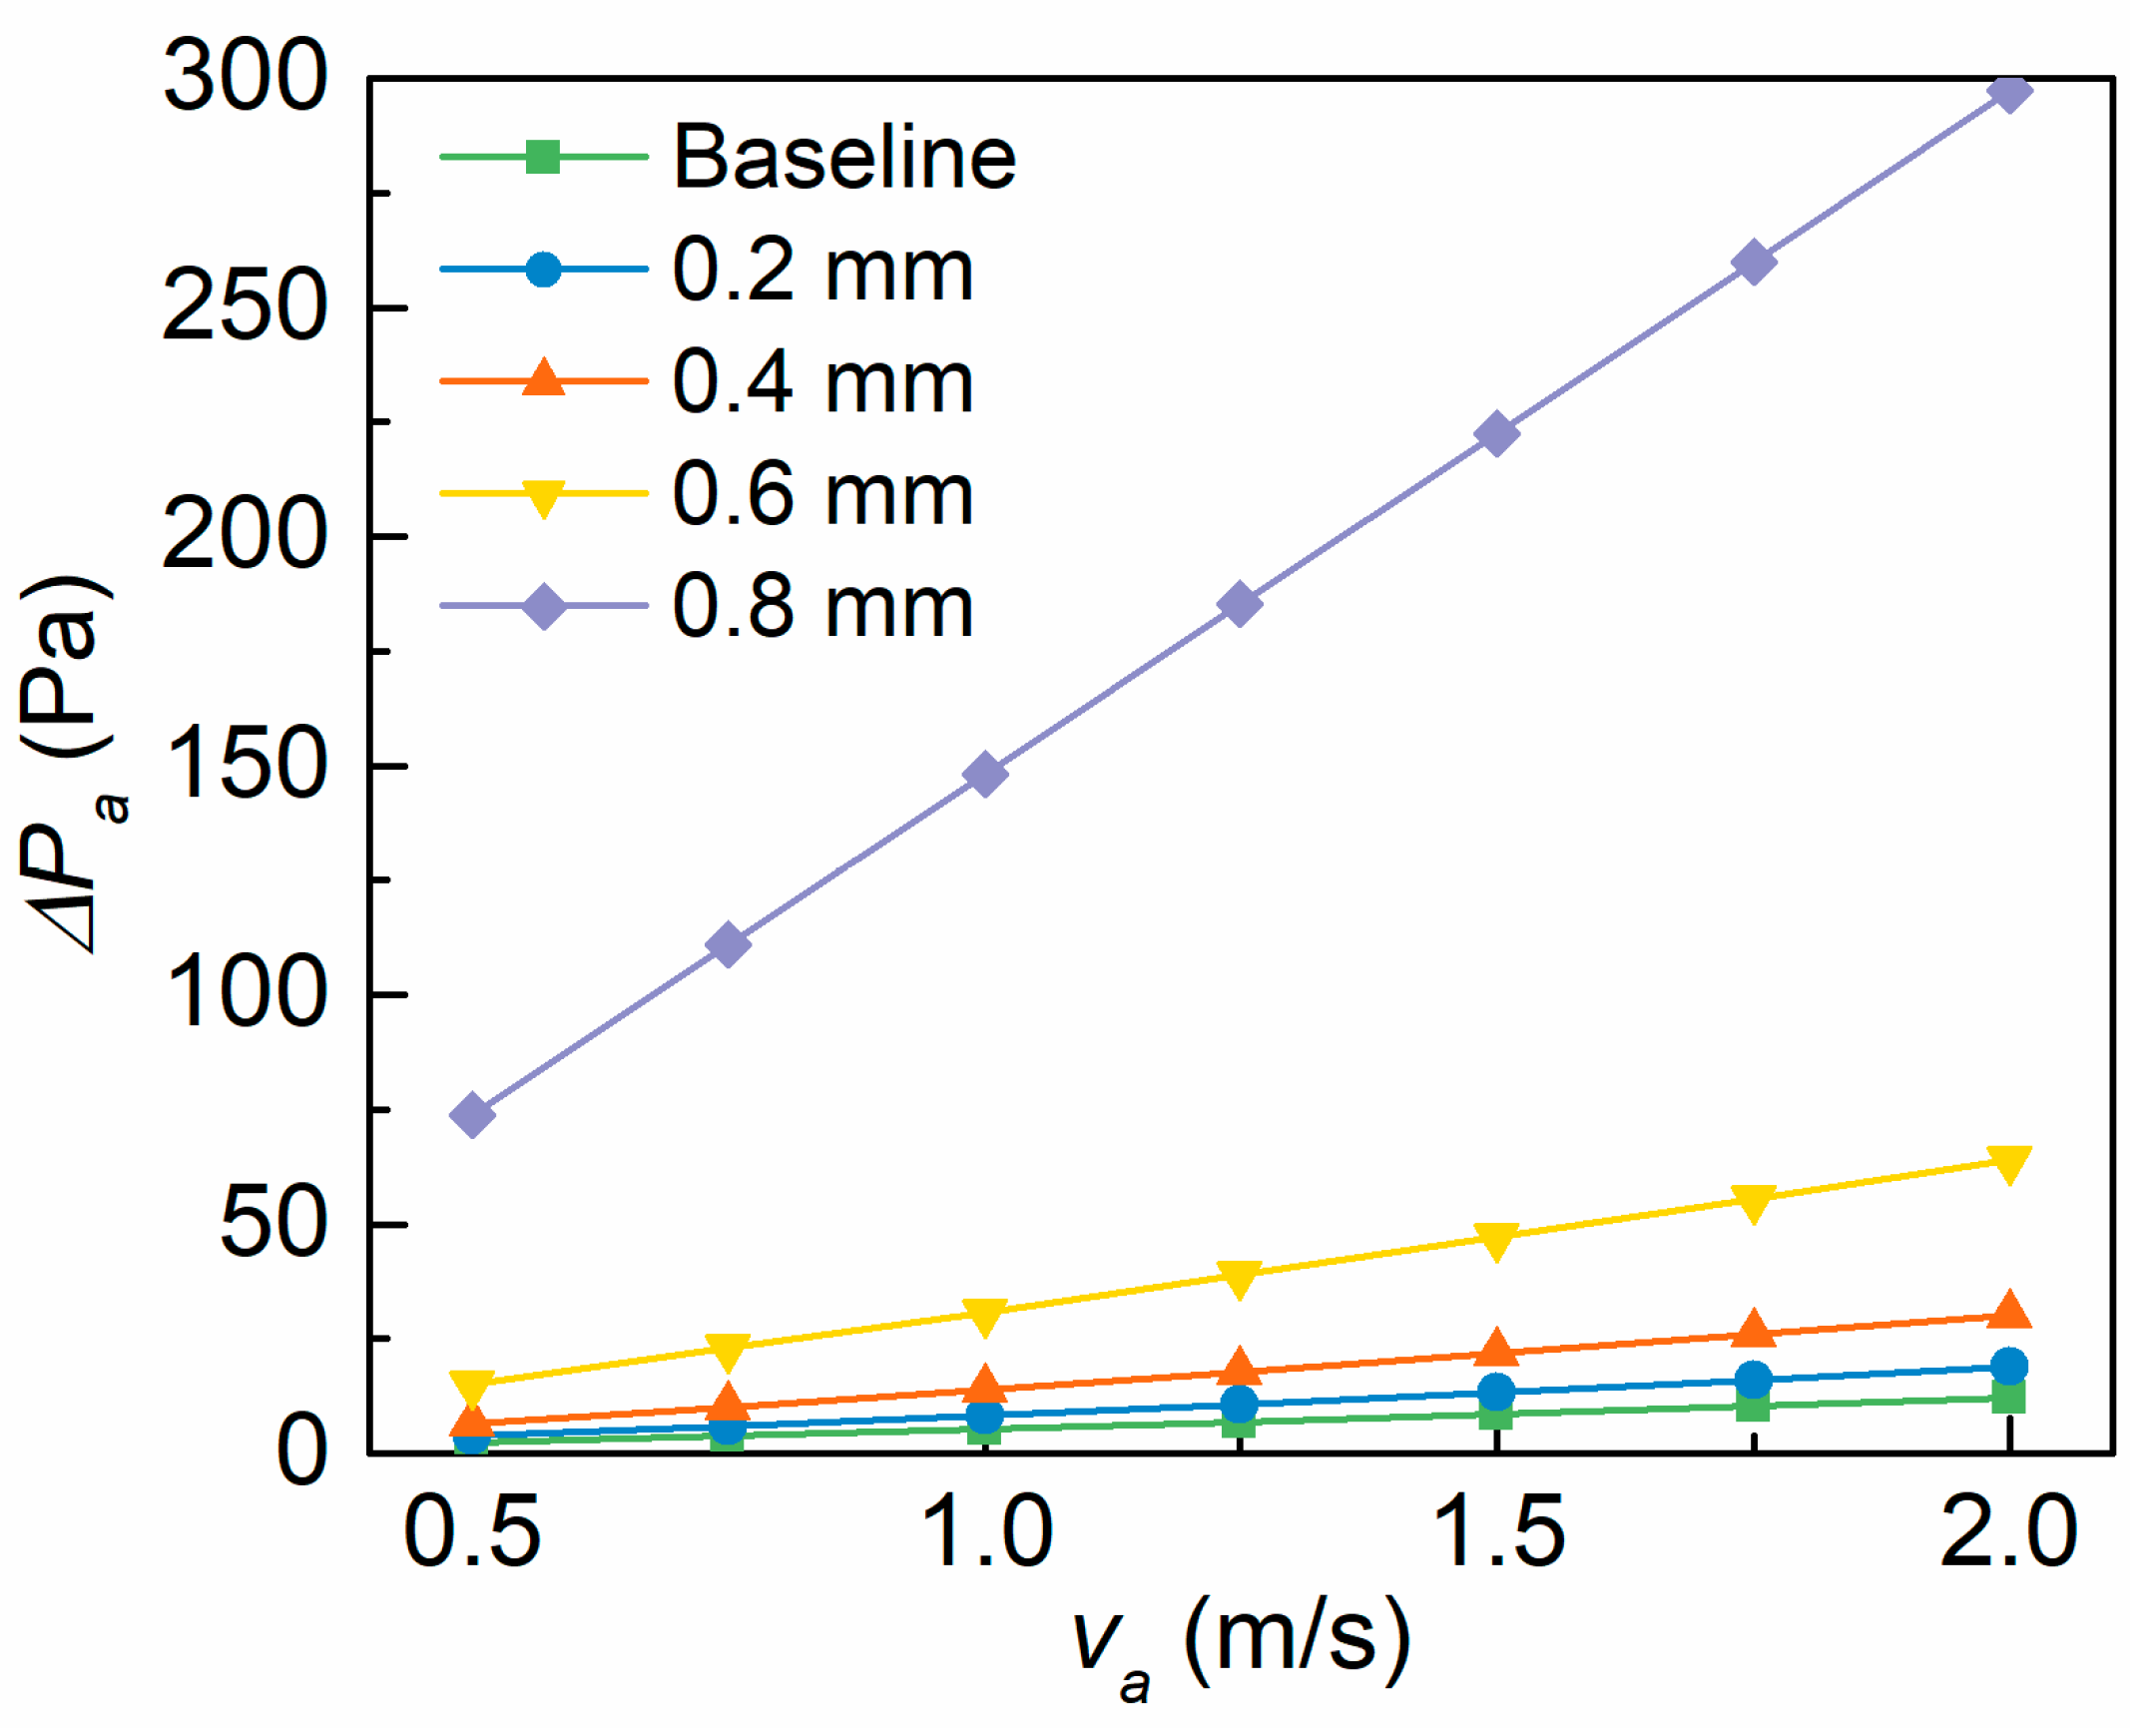
3.2. The Pressure Drops with and without SHST

Figure 7 shows the effect of frost layer thickness on the air-side pressure drop between the air-side inlet and the air-side outlet. The air-side pressure drop increases with increasing air velocity in a linear manner, which is consistent with the laminar principle. At an inlet air-side velocity of 1.5 m/s, the flow resistance at the frost thicknesses of 0.4 mm is 90.1% lower than that at the frost thicknesses of 0.8 mm. Meanwhile, variations in air-side streamlines at a given inlet velocity of 0.5 m/s are depicted in Figure 8. The air-side pressure drop increases with increasing air velocity in a linear manner, which is consistent with the laminar principle. Meanwhile, as the frost layer thickness increases from 0.2 mm to 0.8 mm, the air-side cross-sectional area decreases and the pressure drop gradually increases. This phenomenon can be explained by the fact that the flow area presents an exponential downtrend as the frost thickness rises. At frost thicknesses of 0.2 mm and 0.4 mm, the flow areas of one fin channel exhibit values of 9.24 mm2 and 4.78 mm2, but those values descend to 0.18 mm2 when the frost thickness reaches 0.8 mm. A very small flow area seriously strengthens the flow resistance, thus causing a sudden increase in pressure drop.
Figure 9 illustrates the effect of the frost layer thickness on the air-side pressure drop. For a given air-side inlet velocity of 1.0 m/s, the pressure drop is increased from 1.6 times to 28.4 times with the frost layer thickness increasing from 0.2 mm to 0.8 mm, compared to the baseline. Meanwhile, the αp decreases as the air-side inlet velocity increases, especially in the case of a thicker frost layer.

4. Experiment on Microchannel Heat Exchangers with SHST

To evaluate the defrosting effect of the SHST, an experimental platform is designed, which places two microchannel heat exchangers in an environmental chamber. One of the microchannel heat exchangers does not have a superhydrophobic coating applied, while the other one does. These two microchannel heat exchangers simulate the operating conditions of the evaporators in the heat pumps and are supplied with internal working fluids by a low-temperature bath. In the experiment, the inlet temperature, humidity, and velocity of the air are controlled at 9 °C, 73%, and 1.5 m/s, respectively, while the inlet temperature and mass flow rate of the refrigerant are kept at −5 °C and 51.75 g/s, respectively. The geometric parameters of the microchannel heat exchangers are given in Table 1. The superhydrophobic coating is sourced from Shenzhen Wei Jing Advanced Materials Co., Ltd., Shenzhen, China. K-type thermocouples (Omega) are mounted at the center and four corners of the microchannel heat exchangers to measure the average temperature and are connected to a data acquisition system (GM10-1C0, Yakogawa, Tokyo, Japan). The purpose of this experiment is to compare the defrosting performance of the two microchannel heat exchangers with and without a superhydrophobic coating under different operating conditions and to analyze the effects of superhydrophobic coating on the heat transfer and pressure drop characteristics of the microchannel heat exchangers.
The contact angles of copper surfaces with and without SHST are depicted in Figure 10. The contact angle of the surface with the superhydrophobic coating exceeds 150°, which is 51° higher than that of the surface without the coating.
Figure 11 portrays the frost thickness of microchannel heat exchangers with and without SHST. At an operating time of 30 min, there is frost accumulation appearing on both the fins, with and without superhydrophobic coating. The frost thickness of the microchannel heat exchanger with SHST measures approximately 0.4 mm, while that of the one without SHST is about 0.8 mm, signifying that the addition of the superhydrophobic coating to the fin surface has a defrosting effect. This observation can be mainly attributed to the spherical shapes formed by the droplets and their jumping and rolling behavior due to the reduced condensation adhesion on superhydrophobic surfaces, which impedes frost accumulation. When frost thickness reaches 0.8 mm, the formed frost can nearly block the flow areas of the microchannel heat exchanger, explaining the swift decrease in the air-side heat transfer coefficient and pressure drop. The microchannel heat exchanger with SHST demonstrates less frost accumulation than the one without, enhancing the heat transfer coefficient and improving the cycle performance of heat pumps under cold operating conditions.

5. Cycle Performance of Heat Pump with Frost Accumulation

In cold operating conditions, frost accumulation can markedly curtail the heating capacity, thereby significantly decreasing the COP. This section explores the impact of frost thickness on heating capacity, compressor power, fan power, operating pressure, refrigerant flow rate, and COP. The operating parameters for heating are listed in Table 3.
Figure 12 illustrates the refrigerant mass flow rate with varying frost thicknesses. A gradual decrease is initially observable in the refrigerant mass flow rate as frost thickness augments, followed by a steep decline. This trend is primarily due to the reduction in the air-side heat transfer rate and an escalation in flow resistance as frost thickness rises, adversely affecting the heat transfer efficiency of the evaporator and diminishing the refrigerant mass flow rate. The degradation of the heat transfer coefficient becomes pronounced when the frost thickness surpasses 0.4 mm, resulting in a sharp decrease in the refrigerant mass flow rate.
Figure 13 demonstrates the changes in the high-side pressure P h i g h and low-side pressure P l o w of the heat pump system in response to variations in frost thickness. An increase in frost thickness results in a decrease in both high-side and low-side pressures, attributable to the reduced heat transfer coefficient, which consequently leads to a decrease in evaporator temperature and, thus, a reduced low-side pressure. The refrigerant temperature at the compressor outlet also drops due to a lower inlet temperature, causing a decrease in the condenser temperature and, hence, a lower high-side pressure. Thus, frost accumulation induces a drop in heat transfer efficiency, resulting in a lower refrigerant mass flow rate and operating pressures.
Figure 14 reveals the impact of frost thickness on the heating capacity, compressor power, and fan power. With the increase in frost thickness, a decline in the heating capacity is observed, which is primarily attributed to a lower refrigerant mass flow rate and a lower high-side pressure, resulting in a smaller refrigerant enthalpy change in the indoor heat exchanger. With an increase in frost thickness from 0 to 0.8 mm, the heating capacity declines from 3.97 to 1.82 kW. The compression power also declines as frost forms, caused by a lower refrigerant mass flow rate. When the frost thickness exceeds 0.4 mm, the heating capacity and compression power decrease steeply, implying that frost thickness should be restrained to 0.4 mm during operation to maintain an adequate heating capacity. Figure 15 presents the effect of frost accumulation on the fan power and pressure drop. As frost thickness rises, so does the pressure drop, necessitating increased fan power to counteract the flow resistance. A significant increase in fan power from 0.037 kW to 0.13 kW is observed when the frost thickness increases from 0.6 mm to 0.8 mm, primarily due to the abrupt increase in flow resistance.
Figure 16 represents the compressor COP and system COP under various frost thicknesses. With an increase in frost thickness from 0 to 0.8 mm, the system COP (factoring in both compression power and fan power) declines from 3.17 to 2.30, while the compressor COP, which only considers compression power, reduces from 3.13 to 1.97. Even though both the heating capacity and compression power decrease as the frost thickness escalates, a continuous decrease in both the compressor COP and system COP is observed, owing to the more pronounced decrease in the heating capacity compared to the compression power. Furthermore, the system COP decline is further propelled by the increased pressure drop and fan power. A rise in frost thickness causes an increase in fan power, thus amplifying the discrepancy between the system COP and compressor COP. When the frost thickness is reduced to 0.8 mm, the system COP shrinks to 1.97. This significant reduction potentially elevates the power consumption for heating, consequently reducing the single-charge driving distance.

6. Performance Comparison of EVs Using Different Heating Methods

Using an EV with a battery capacity of 60 kWh and a driving velocity of 50 km/h as a benchmark, the COP, power consumption for heating, EV power consumption, and single-charge driving distance of four heating methods, including a heat pump with ideal SHST, a heat pump with SHST, a heat pump without SHST, and traditional positive temperature coefficient (PTC) heating, are analyzed for comparison. The phrase “heat pump with ideal SHST” means that the applied superhydrophobic coating can completely eliminate frost accumulation, representing the ideal defrosting effect achievable with SHST technology. The PTC heating method, commonly utilized for heating EVs in cold winters, has a notably low COP, which is assumed to be 0.95 in this study. The cycle performances of the heat pump with ideal SHST, the heat pump with SHST, and the heat pump without SHST methods are evaluated based on established models of heat pumps.
As indicated in Figure 17a, the COP of the heat pump without superhydrophobic coating is 1.98 due to its cycle performance deterioration under cold conditions. However, with the application of SHST, the COP of the heat pump increases to 2.93, indicating that the power consumption of the heat pump with SHST is 48.7% less than that of the heat pump without SHST. Furthermore, the COP of the heat pump with an ideal superhydrophobic coating reaches 3.13, illustrating the potential of superhydrophobic coating in preventing cycle performance deterioration. The SHST also facilitates enhanced cooling cycle performance by promoting condensate drainage and reducing the liquid film area on the fins. Under the cooling conditions specified in Table 3, the COP for cabin cooling reaches 2.72. Figure 17b indicates that the power consumption for heating is in the following order: heat pump with ideal SHST (1.60 kW) < heat pump with SHST (1.70 kW) < heat pump without SHST (2.53 kW) < PTC heating (5.36 kW). This order highlights that a higher COP corresponds to lower energy consumption. The power consumption of EVs follows the same pattern as that for heating. At a driving speed of 50 km/h, an EV equipped with SHST consumes 9.17 kWh per hour, which is 38.8% lower than traditional PTC heating. Lastly, a comparative analysis of the single-charge driving distances of the four heating methods is conducted, as shown in Figure 17d. The single-charge driving distance of the heat pump with SHST reaches 327.27 km, which is 8.99% longer than that of the heat pump without SHST and 28.0% longer than that of traditional PTC heating. Consequently, the application of SHST technology can significantly improve the cycle performance of heat pumps and augment the single-charge driving distance of EVs.

7. Conclusions

This work investigates a microchannel heat exchanger (MHE) with superhydrophobic surface treatment (SHST) as an evaporator to overcome the problem of heating capacity attenuation of heat pumps in electric vehicles (EVs), which is caused by frost accumulation under cold conditions. By integrating the MHE model, CFD simulation, and the dynamic heat pump model that has been verified with high accuracy, the adverse effects of frost accumulation on air-side heat transfer, air-side flow resistance, and heat pump cycle performance are investigated. An experiment is conducted to compare the frost thickness on MHEs with and without SHST. Furthermore, the performance of different heating methods in EVs is comparably analyzed to elucidate the advantages of SHST technology. Key findings of the research include:
(1)
The validated CFD model demonstrates that frost growth significantly affects the heat transfer characteristics of MHEs. When the frost layer thickness is 0.8 mm at a given air-side velocity of 1.0 m/s, the air-side heat transfer coefficient can be reduced by about 75%, and the air-side pressure drop sharply increases by 28.4 times.
(2)
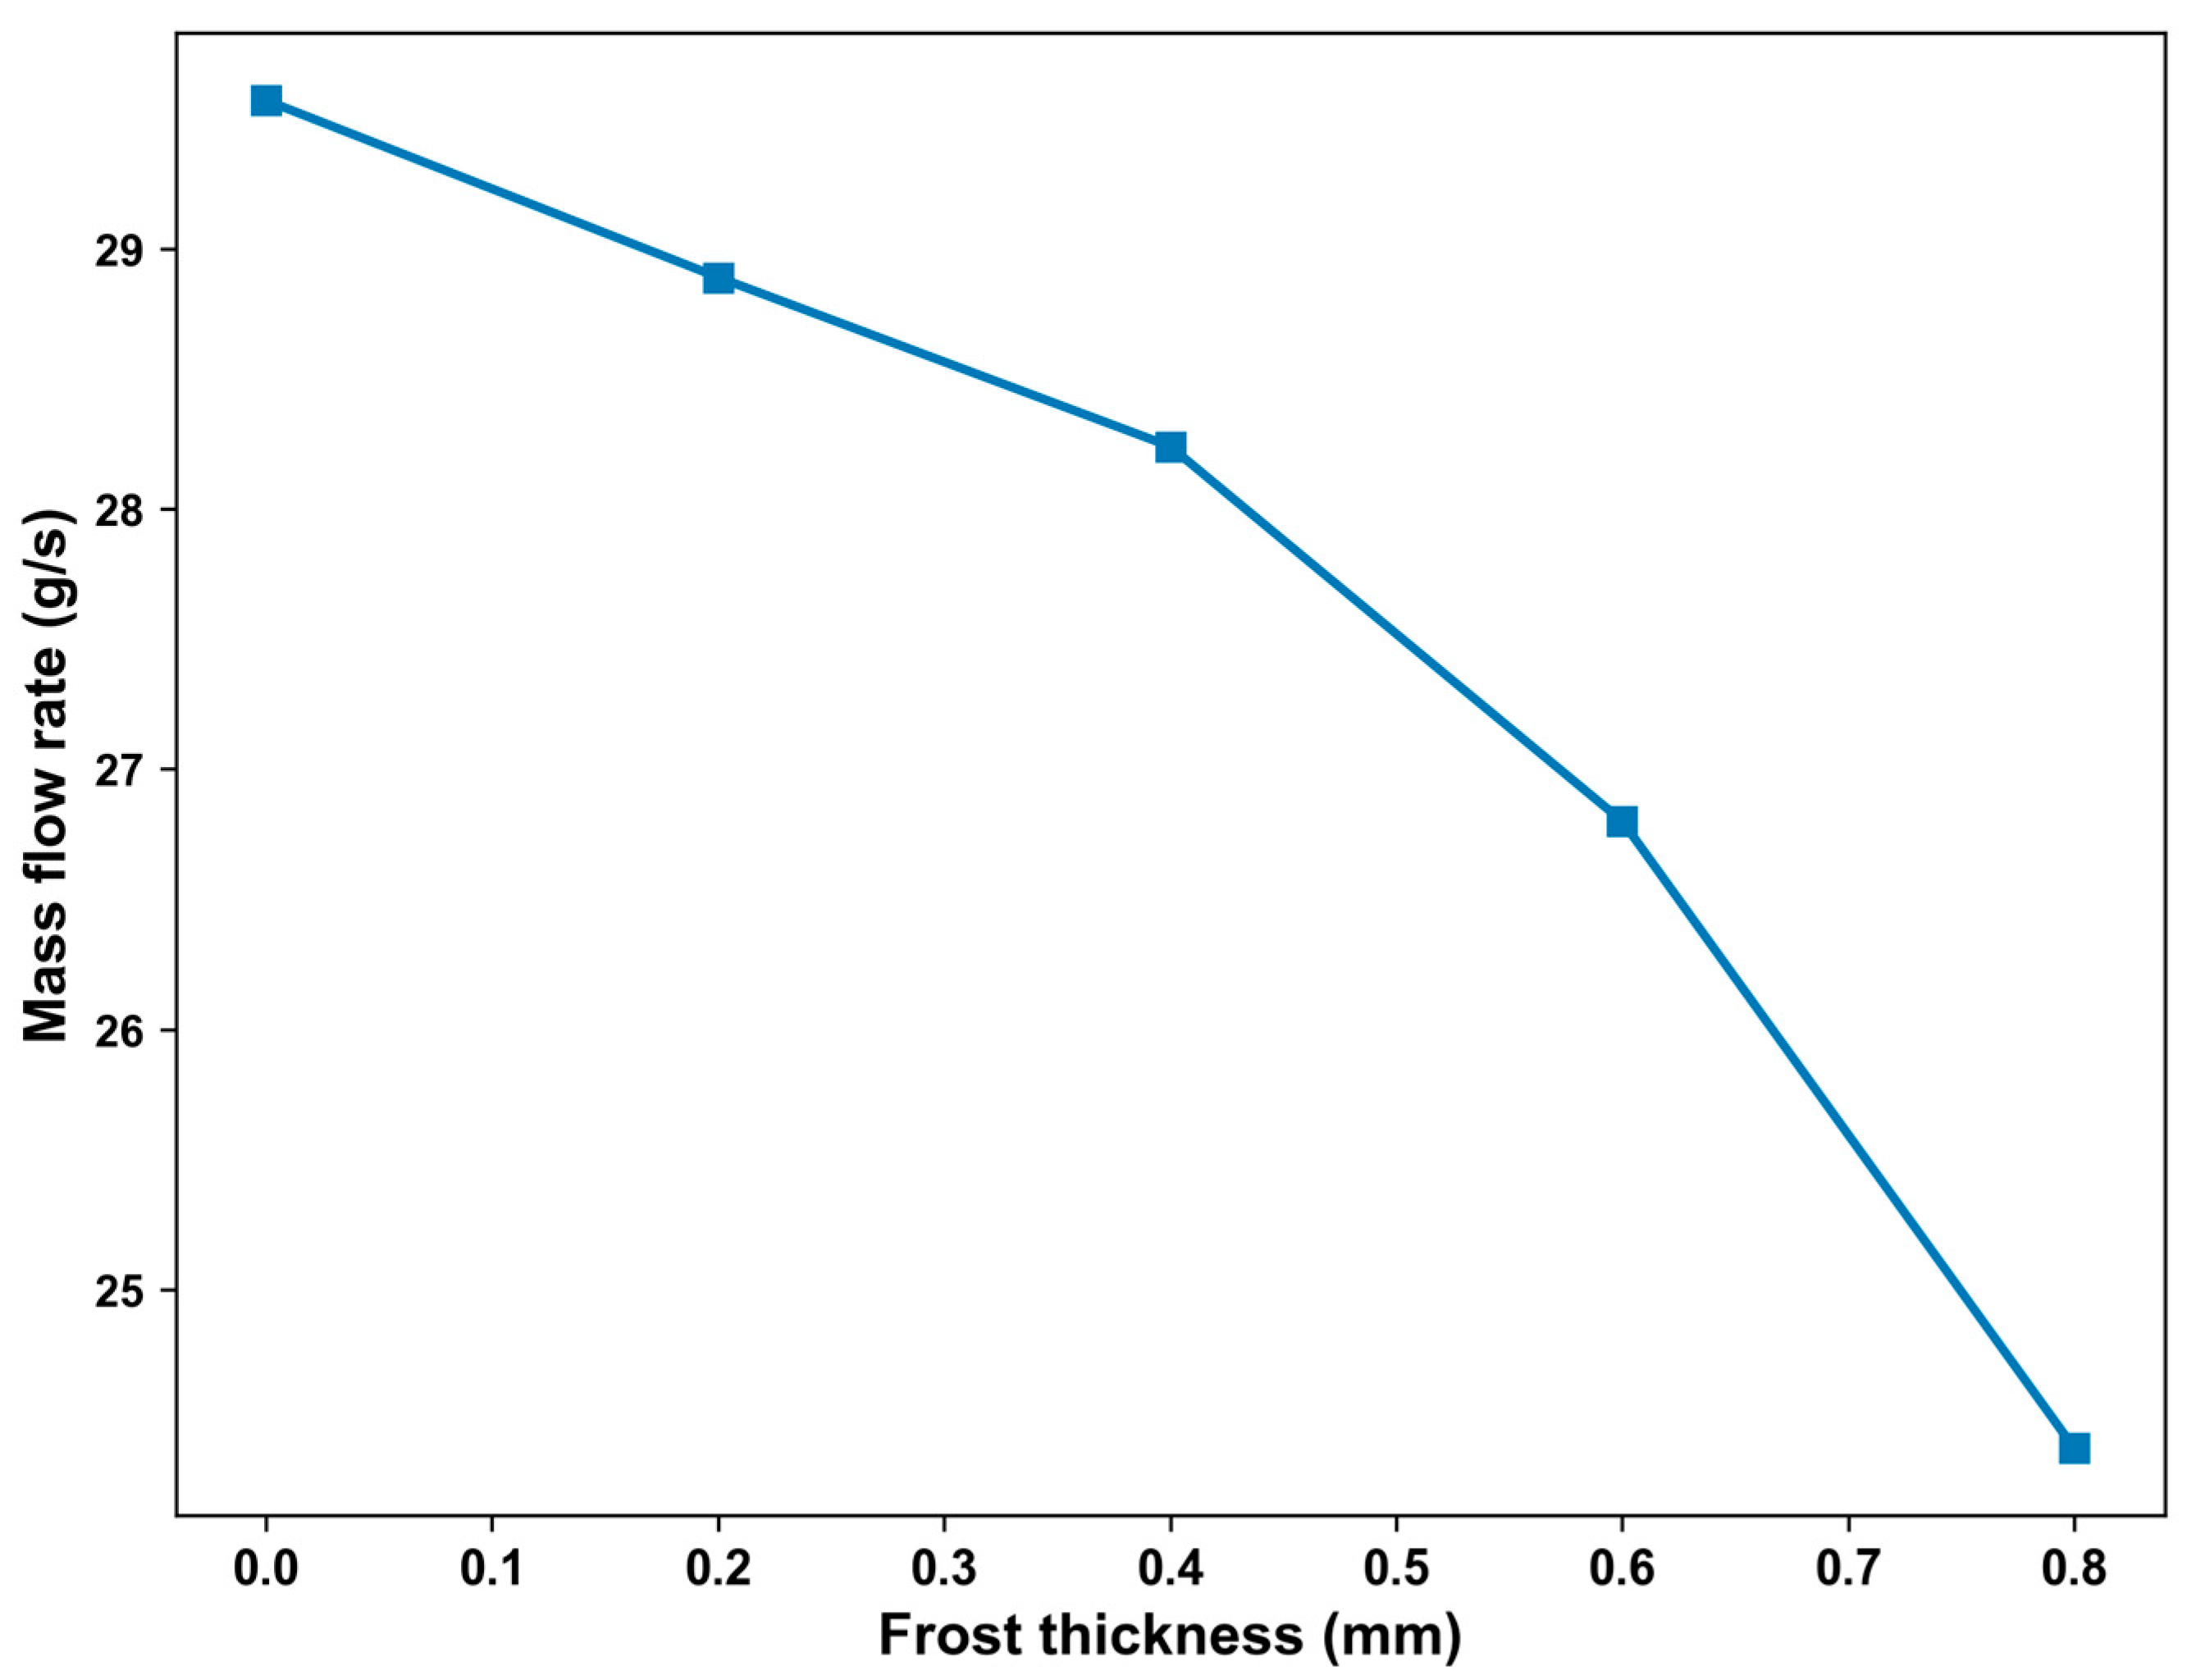
As the frost thickness increases from 0 to 0.8 mm, the heating output decreases from 3.97 to 1.82 kW, and the system COP declines from 3.17 to 2.30. When frost thickness exceeds 0.4 mm, both the heating output and COP decrease dramatically.
(3)
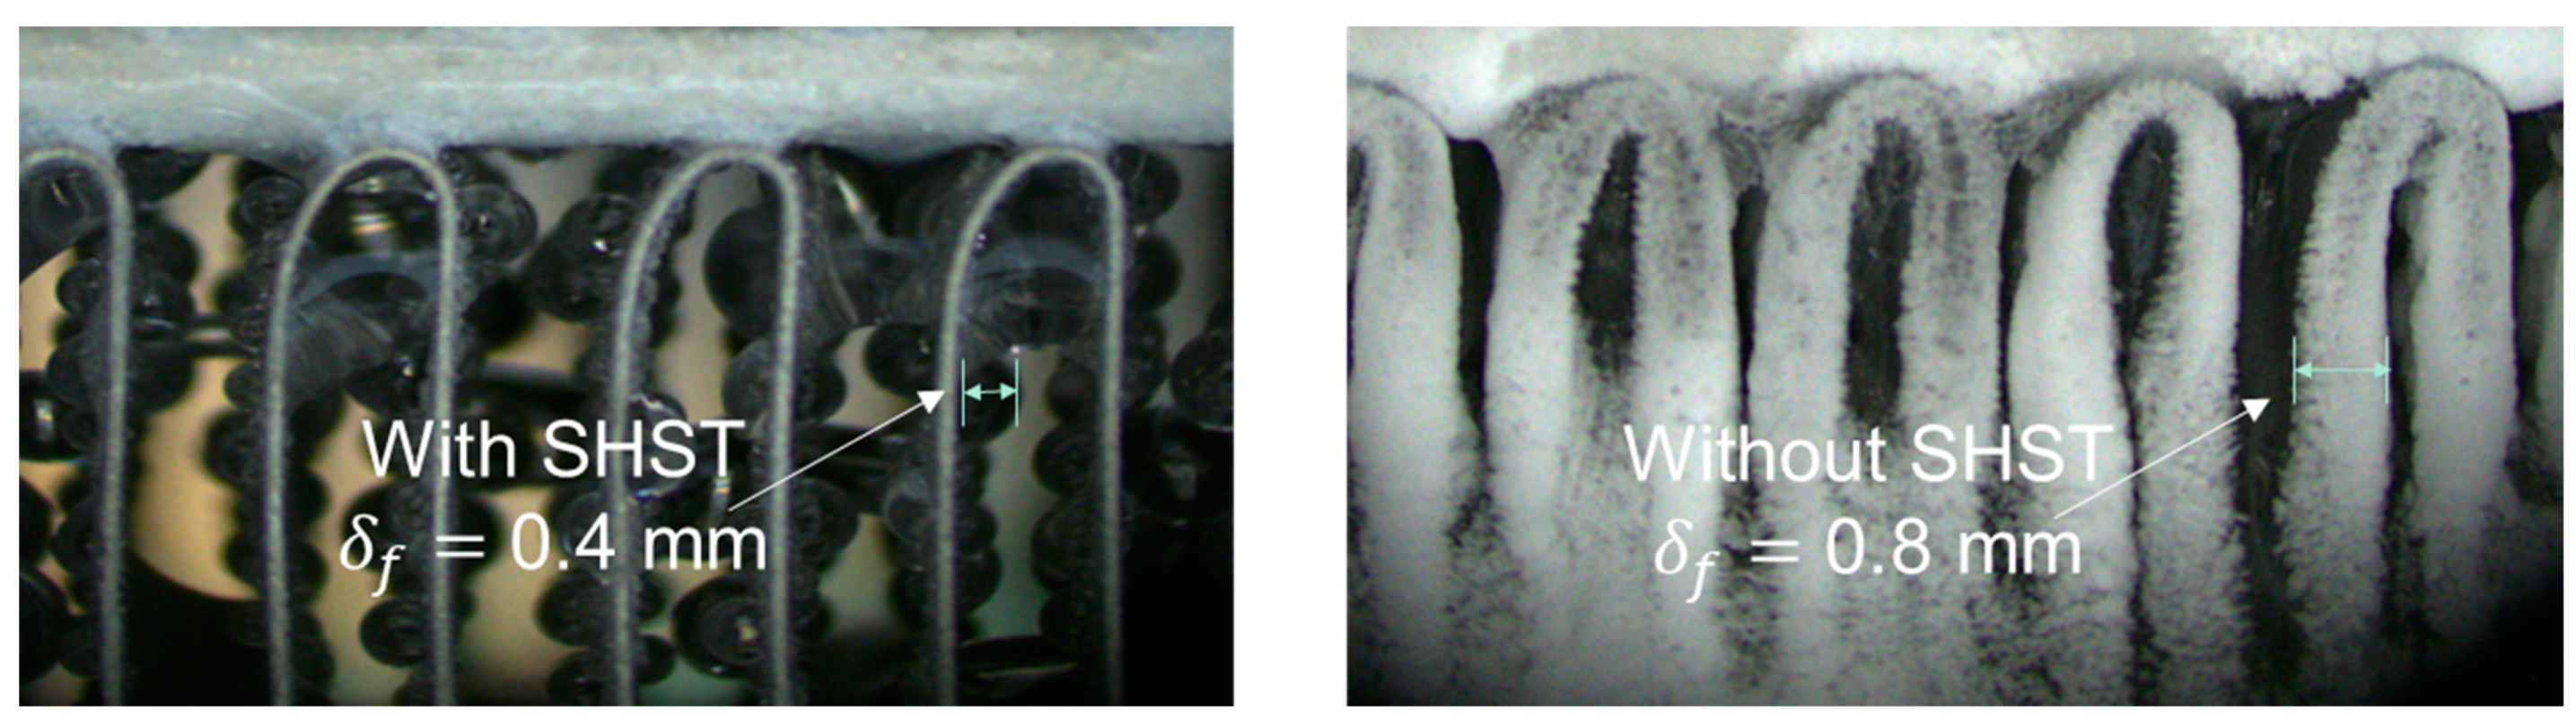
After 30 min of operation, the frost thickness on the MHE treated with SHST is approximately 0.4 mm, while the MHE without SHST attains a frost thickness of about 0.8 mm. These results confirm the defrosting capability of superhydrophobic coatings. Once the frost thickness reaches 0.8 mm, the frost can obstruct the flow areas of the MHE, leading to a rapid decrease in the air-side heat transfer coefficient and COP.
(4)
With the MHE using SHST, the heat pump system achieves a heating COP of 2.93 and a cooling COP of 2.72. Compared to an untreated MHE, the air-side flow resistance and heating power consumption of the proposed system are reduced by 90.1% and 48.7%, owing to the defrosting capability of the SHST. Additionally, the single-charge driving distance of the heat pump with SHST extends to 327.27 km, which is 8.99% longer than a heat pump without SHST and 28.0% longer than a traditional positive temperature coefficient heating.
This work is expected to explore new avenues for developing innovative heating solutions in winter conditions, which is a critical step toward facilitating more effective and sustainable electric vehicles in support of carbon neutrality. However, the frost formation mechanism and defrosting mechanism should be clarified in detail. Experimental and simulated works are planned to be conducted to investigate the frost formation mechanism on the MHE fin surface and the defrosting mechanism of SHST technology.

Author Contributions

Y.S.: conceptualization, methodology, software, writing—original draft; Z.S.: conceptualization, methodology, software, writing—original draft; G.L.: software, visualization, writing—review and editing; W.W.: conceptualization, methodology, writing—review and editing, supervision, resources, funding acquisition. All authors have read and agreed to the published version of the manuscript.

Funding

This research was funded by the Central Government Fund for Guiding Local Scientific and Technological Development under Shenzhen Virtual University Park, Shenzhen Science and Technology Innovation Committee (Project number: 2021Szvup125), and the Research Grants Council of Hong Kong (Project numbers: CityU 11212620, CityU 11215621).

Institutional Review Board Statement

Not applicable.

Informed Consent Statement

Not applicable.

Data Availability Statement

The data presented in this study are available on request from the corresponding author.

Acknowledgments

The authors extend their appreciation to the Central Government Fund for Guiding Local Scientific and Technological Development under Shenzhen Virtual University Park, Shenzhen Science and Technology Innovation Committee, and the Research Grants Council of Hong Kong.

Conflicts of Interest

The authors declare no conflict of interest.

Nomenclature

A area: m2
C p specific heat capacity, kJ/(kg · K)
D hydraulic diameter, m
H height, m
h specific enthalpies, kJ/kg
m ˙ mass flow rate, kg/s
P pressure, kPa
Q ˙ heat transfer rate, kW
ttemperature, °C
W ˙ power, kW
α convective heat transfer coefficient, W/(m2·K)
ρ density, kg/m3
μ dynamic viscosity, Pa·s
η efficiency
λ thermal conductivity, W/(m·K)
δ thickness, m
Abbreviations
COPcoefficient of performance
CFDcomputational fluid dynamics
EVelectric vehicle
MAPEmean absolute percentage error
MHEmicrochannel heat exchanger
PTCpositive temperature coefficient
SHSTsuperhydrophobic surface treatment
Subscripts
aair side
compcompressor
disdischarge
exexpansion valve
extexternal
fanfan
htcheat exchanger
ininlet
intinternal
isisentropic
memechanical
outoutlet
syssystem

References

  1. Li, Z.; Khajepour, A.; Song, J. A comprehensive review of the key technologies for pure electric vehicles. Energy 2019, 182, 824–839. [Google Scholar] [CrossRef]
  2. Rajper, S.Z.; Albrecht, J. Prospects of electric vehicles in the developing countries: A literature review. Sustainability 2020, 12, 1906. [Google Scholar] [CrossRef]
  3. Bode, F.; Burnete, N.V.; Fechete Tutunaru, L.; Nastase, I. Improving Electric Vehicle Range and Thermal Comfort through an Innovative Seat Heating System. Sustainability 2023, 15, 5534. [Google Scholar] [CrossRef]
  4. Zhang, Z.; Wang, J.; Feng, X.; Chang, L.; Chen, Y.; Wang, X. The solutions to electric vehicle air conditioning systems: A review. Renew. Sustain. Energy Rev. 2018, 91, 443–463. [Google Scholar] [CrossRef]
  5. Qi, Z. Advances on air conditioning and heat pump system in electric vehicles–A review. Renew. Sustain. Energy Rev. 2014, 38, 754–764. [Google Scholar] [CrossRef]
  6. Peng, Q.; Du, Q. Progress in heat pump air conditioning systems for electric vehicles—A review. Energies 2016, 9, 240. [Google Scholar] [CrossRef]
  7. Jakończuk, P.; Śmierciew, K.; Gagan, J.; Butrymowicz, D. Image-Analysis-Based Approach for Identification of Air Cooler Heat Transfer Degradation during Frosting Process. Sustainability 2022, 14, 13731. [Google Scholar] [CrossRef]
  8. Li, W.; Liu, Y.; Liu, R.; Wang, D.; Shi, J.; Yu, Z.; Cheng, L.; Chen, J. Performance evaluation of secondary loop low-temperature heat pump system for frost prevention in electric vehicles. Appl. Therm. Eng. 2021, 182, 115615. [Google Scholar] [CrossRef]
  9. Mahvi, A.J.; Boyina, K.; Musser, A.; Elbel, S.; Miljkovic, N. Superhydrophobic heat exchangers delay frost formation and enhance efficency of electric vehicle heat pumps. Int. J. Heat Mass Transf. 2021, 172, 121162. [Google Scholar] [CrossRef]
  10. Badri, D.; Toublanc, C.; Rouaud, O.; Havet, M. Review on frosting, defrosting and frost management techniques in industrial food freezers. Renew. Sustain. Energy Rev. 2021, 151, 111545. [Google Scholar] [CrossRef]
  11. Yang, B.; Zhu, X.; Liu, M.; Lv, Z. Review on the application of machine vision in defrosting and decondensation on the surface of heat exchanger. Sustainability 2022, 14, 11606. [Google Scholar] [CrossRef]
  12. Song, M.; Deng, S.; Dang, C.; Mao, N.; Wang, Z. Review on improvement for air source heat pump units during frosting and defrosting. Appl. Energy 2018, 211, 1150–1170. [Google Scholar] [CrossRef]
  13. Gurumukhi, Y.; Chavan, S.; Sett, S.; Boyina, K.; Ramesh, S.; Sokalski, P.; Fortelka, K.; Lira, M.; Park, D.; Chen, J.-Y. Dynamic defrosting on superhydrophobic and biphilic surfaces. Matter 2020, 3, 1178–1195. [Google Scholar] [CrossRef]
  14. Liu, J.; Kappl, M.; Butt, H.-J. Toward passive defrosting with heterogeneous coatings. Matter 2020, 3, 981–983. [Google Scholar] [CrossRef]
  15. Foster, A.; Campbell, R.; Davies, T.; Evans, J. A novel passive defrost system for a frozen retail display cabinet with a low evaporator. In Proceedings of the 24th IIR International Congress of Refrigeration, Yokohama, Japan, 16–22 August 2015; International Institute of Refrigeration: Paris, France, 2015. [Google Scholar]
  16. Amer, M.; Wang, C.-C. Review of defrosting methods. Renew. Sustain. Energy Rev. 2017, 73, 53–74. [Google Scholar] [CrossRef]
  17. Li, F.; Wu, S.; Ma, Z.; Zhao, R.; Huang, D. Effect of surface coating on defrosting water drainage characteristics of vertical-fin microchannel frosting evaporator. Appl. Therm. Eng. 2022, 208, 118220. [Google Scholar] [CrossRef]
  18. Boreyko, J.B.; Srijanto, B.R.; Nguyen, T.D.; Vega, C.; Fuentes-Cabrera, M.; Collier, C.P. Dynamic defrosting on nanostructured superhydrophobic surfaces. Langmuir 2013, 29, 9516–9524. [Google Scholar] [CrossRef]
  19. Shin, J.; Tikhonov, A.V.; Kim, C. Experimental study on frost structure on surfaces with different hydrophilicity: Density and thermal conductivity. J. Heat Transf. 2003, 125, 84–94. [Google Scholar] [CrossRef]
  20. Kadhim, M.A.; Kapur, N.; Summers, J.L.; Thompson, H. Experimental and theoretical investigation of droplet evaporation on heated hydrophilic and hydrophobic surfaces. Langmuir 2019, 35, 6256–6266. [Google Scholar] [CrossRef]
  21. Wang, F.; Liang, C.; Yang, M.; Fan, C.; Zhang, X. Effects of surface characteristic on frosting and defrosting behaviors of fin-tube heat exchangers. Appl. Therm. Eng. 2015, 75, 1126–1132. [Google Scholar] [CrossRef]
  22. Liu, Z.; Gou, Y.; Wang, J.; Cheng, S. Frost formation on a super-hydrophobic surface under natural convection conditions. Int. J. Heat Mass Transf. 2008, 51, 5975–5982. [Google Scholar] [CrossRef]
  23. Kim, A.; Lee, C.; Kim, H.; Kim, J. Simple approach to superhydrophobic nanostructured Al for practical antifrosting application based on enhanced self-propelled jumping droplets. ACS Appl. Mater. Interfaces 2015, 7, 7206–7213. [Google Scholar] [CrossRef] [PubMed]
  24. Khan, M.G.; Fartaj, A. A review on microchannel heat exchangers and potential applications. Int. J. Energy Res. 2011, 35, 553–582. [Google Scholar] [CrossRef]
  25. Wang, C.-N.; Yang, F.-C.; Nguyen, V.T.T.; Vo, N.T. CFD analysis and optimum design for a centrifugal pump using an effectively artificial intelligent algorithm. Micromachines 2022, 13, 1208. [Google Scholar] [CrossRef] [PubMed]
  26. VO, T.M.N. Centrifugal pump design: An optimization. Eurasia Proc. Sci. Technol. Eng. Math. 2022, 17, 136–151. [Google Scholar]
  27. Wu, X.; Ma, Q.; Chu, F.; Hu, S. Phase change mass transfer model for frost growth and densification. Int. J. Heat Mass Transf. 2016, 96, 11–19. [Google Scholar] [CrossRef]
  28. Sui, Z.G.; Wu, W. A comprehensive review of membrane-based absorbers/desorbers towards compact and efficient absorption refrigeration systems. Renew. Energy 2022, 201, 563–593. [Google Scholar] [CrossRef]
  29. Kim, M.-H.; Bullard, C.W. Air-side performance of brazed aluminum heat exchangers under dehumidifying conditions. Int. J. Refrig. 2002, 25, 924–934. [Google Scholar] [CrossRef]
  30. Qasem, N.A.; Zubair, S.M. Compact and microchannel heat exchangers: A comprehensive review of air-side friction factor and heat transfer correlations. Energy Convers. Manag. 2018, 173, 555–601. [Google Scholar] [CrossRef]
  31. Siddiqui, F.A.; Dasgupta, E.S.; Fartaj, A. Experimental investigation of air side heat transfer and fluid flow performances of multi-port serpentine cross-flow mesochannel heat exchanger. Int. J. Heat Fluid Flow 2012, 33, 207–219. [Google Scholar] [CrossRef]
  32. Boeng, J.; Marcon, A.A.; Hermes, C.J. Air-side heat transfer and pressure drop characteristics of microchannel evaporators for household refrigerators. Int. J. Heat Mass Transf. 2020, 147, 118913. [Google Scholar] [CrossRef]
  33. Yang, D.-K.; Lee, K.-S.; Song, S. Modeling for predicting frosting behavior of a fin–tube heat exchanger. Int. J. Heat Mass Transf. 2006, 49, 1472–1479. [Google Scholar] [CrossRef]
  34. Fluent, A. ANSYS Fluent Theory Guide, Release 18.0; Ansys. Inc.: Canonsburg, PA, USA, 2017. [Google Scholar]
  35. Ding, Z.; Wu, W.; Huang, S.-M.; Huang, H.; Bai, Y.; He, Z. A novel compression-assisted energy storage heat transformer for low-grade renewable energy utilization. Energy 2023, 263, 125681. [Google Scholar] [CrossRef]
  36. Sui, Y.; Ding, Z.; Zhai, C.; Lin, H.; Wu, W. Crystallization-free and low-cost deep eutectic solvents for absorption thermal battery utilizing ultra-low-grade energy. Energy Convers. Manag. 2023, 284, 116984. [Google Scholar] [CrossRef]
  37. Omidi, M.; Liu, S.-J.; Mohtaram, S.; Lu, H.-T.; Zhang, H.-C. Improving centrifugal compressor performance by optimizing the design of impellers using genetic algorithm and computational fluid dynamics methods. Sustainability 2019, 11, 5409. [Google Scholar] [CrossRef]
  38. Kitsopoulou, A.; Zacharis, A.; Ziozas, N.; Bellos, E.; Iliadis, P.; Lampropoulos, I.; Chatzigeorgiou, E.; Angelakoglou, K.; Nikolopoulos, N. Dynamic Energy Analysis of Different Heat Pump Heating Systems Exploiting Renewable Energy Sources. Sustainability 2023, 15, 11054. [Google Scholar] [CrossRef]
  39. Sui, Y.; Wu, W. Ionic liquid screening and performance optimization of transcritical carbon dioxide absorption heat pump enhanced by expander. Energy 2023, 263, 125689. [Google Scholar] [CrossRef]
  40. Shao, L.-L.; Yang, L.; Zhang, C.-L. Comparison of heat pump performance using fin-and-tube and microchannel heat exchangers under frost conditions. Appl. Energy 2010, 87, 1187–1197. [Google Scholar] [CrossRef]
Figure 1. Calculation flowchart of this work.
Sustainability 15 13998 g001
Figure 2. The detailed geometric structure of the microchannel heat exchanger.
Sustainability 15 13998 g002
Figure 3. (a) Computational domains, (b) computational meshes, (c) grid independence check.
Sustainability 15 13998 g003
Figure 4. Comparison between this work and reference: (a) Nusselt number; (b) pressure drop [31].
Sustainability 15 13998 g004
Figure 5. Variations in heat transfer coefficients with inlet velocity.
Sustainability 15 13998 g005
Figure 6. The effect of frost growth on the heat transfer coefficients.
Sustainability 15 13998 g006
Figure 7. Variations of air-side pressure drop with inlet velocity.
Sustainability 15 13998 g007
Figure 8. Variations in air-side streamlines at a given inlet velocity of 0.5 m/s.
Sustainability 15 13998 g008
Figure 9. The effect of the frost growth on the air-side pressure drop.
Sustainability 15 13998 g009
Figure 10. The contact angles of (a) surface with SHST and (b) surface with SHST.
Sustainability 15 13998 g010
Figure 11. The frost thickness of microchannel heat exchangers with and without SHST at an operating time of 30 min.
Sustainability 15 13998 g011
Figure 12. Variation in refrigerant mass flow rate with frost accumulation.
Sustainability 15 13998 g012
Figure 13. High-side pressure P h i g h and low-side pressure P l o w of the heat pump system with frost accumulation.
Sustainability 15 13998 g013
Figure 14. Variation in heating capacity, compressor power, and fan power with frost accumulation.
Sustainability 15 13998 g014
Figure 15. Variation in fan power and pressure drop with frost accumulation.
Sustainability 15 13998 g015
Figure 16. Variation in compressor COP and system COP with frost accumulation.
Sustainability 15 13998 g016
Figure 17. Performance comparison of EVs using different heating methods: (a) COP, (b) power consumed for heating, (c) power consumed by EV, and (d) single-charge driving distance.
Sustainability 15 13998 g017
Table 1. The geometric parameters of the studied microchannel heat exchanger.
SymbolMeaningValue
H f i n distance between flat tubes12 mm
H h o l e port height1.6 mm
w h o l e port width2.2 mm
F d distance between fins2 mm
δ f fin thickness0.15 mm
N h o l e number of ports per tube12
N t u b e number of tubes10
w h t c HTC width548 mm
H h t c HTC height258 mm
D e p h t c HTC depth31.2 mm
Table 2. Boundary conditions.
ParameterValue
Air-side inlet temperature, Ta7 °C
Air-side inlet velocity, va0.5–2.0 m/s
Wall temperature, Tw−5 °C
Operating pressure, P101 kPa
Frosting thickness, δf0.2–0.8 mm
Table 3. Parameter settings of the test conditions.
Cooling Test ConditionsHeating Test Conditions
Outdoor dry-bulb temperature (°C)357
Outdoor wet-bulb temperature (°C)246
Mass flow rate of outdoor air (kg/s)4.484.10
Indoor dry-bulb temperature (°C)2720
Indoor wet-bulb temperature (°C)19.515
Mass flow rate of indoor air (kg/s)1.621.42
Indoor humidity0.4920.584
Outdoor humidity0.3960.866
Table 4. Comparison of the cooling performance between the experiment and simulation.
ItemExperiment ResultsSimulation ResultsMAPE
Cooling capacity (kW)23.1823.080.43%
Total power consumption (kW)9.539.691.68%
Compressor power (kW)6.736.892.38%
COP2.432.382.08%
High-side pressure (MPa)2.922.971.71%
Low-side pressure (MPa)0.980.8711.22%
Table 5. Comparison of the heating performance between the experiment and simulation.
ItemExperiment ResultsSimulation ResultsMAPE
Heating capacity (kW)22.2323.385.17%
Total power consumption (kW)8.348.083.12%
Compressor power (kW)5.945.684.38%
COP2.672.898.56%
High-side pressure (MPa)2.582.5252.13%
Low-side pressure (MPa)0.980.8711.22%
Disclaimer/Publisher’s Note: The statements, opinions and data contained in all publications are solely those of the individual author(s) and contributor(s) and not of MDPI and/or the editor(s). MDPI and/or the editor(s) disclaim responsibility for any injury to people or property resulting from any ideas, methods, instructions or products referred to in the content.

