Article

A Non-Manipulated Variable Analysis of Solid-Phase Combustion in the Furnace of Municipal Solid-Waste Incineration Process Based on the Biorthogonal Numerical-Simulation Experiment

1
Faculty of Information Technology, Beijing University of Technology, Beijing 100124, China
2
Beijing Laboratory of Smart Environmental Protection, Beijing 100124, China
3
Beijing GaoAnTun Waste to Energy Co., Ltd., Beijing 100024, China
*
Author to whom correspondence should be addressed.
Sustainability 2023, 15(19), 14159; https://doi.org/10.3390/su151914159
Submission received: 16 August 2023 / Revised: 15 September 2023 / Accepted: 22 September 2023 / Published: 25 September 2023
(This article belongs to the Special Issue Editorial Board Members’ Collection Series: From Waste to Energy)

Abstract

:
The operating conditions of municipal solid waste incineration (MSWI) are influenced by manipulated variables, such as the feed rate, primary air, and grate speed, as well as non-manipulated variables, such as municipal solid waste (MSW) particle size, mixing coefficient, emissivity, moisture content, and the ratio of C to O. Based on the actual data of an MSWI plant in Beijing, a non-manipulated variable single-factor analysis of solid-phase combustion in the furnace was carried out based on the biorthogonal numerical simulation experiment. First, a solid-phase combustion analysis of the MSWI process was performed for non-manipulated variables, with the main non-manipulated variables determined. Then, based on FLIC 2.3c software, the numerical model was established under benchmark operating conditions. Based on the biorthogonal experiment, several groups of numerical model inputs were designed to generate mechanism data in multi-operating conditions. Finally, a multi-condition numerical simulation experiment was used to study solid-phase combustion under different conditions and analyze non-manipulated variables. The simulation results showed that the maximum solid temperature was 1360 K under the benchmark operating condition and ranged from 1120 to 1470 K under five conditions. Large-size particles and large emissivity were beneficial to solid-phase combustion, while high moisture content and a large mixing coefficient weakened combustion. The results provide support for the subsequent optimal control of the whole MSWI process.

1. Introduction

The quantity of municipal solid wastes (MSWs) has increased rapidly with the development of the economy and residents’ living standards [1]. According to statistics, the annual growth rate of MSWs in the world has reached 8%, and it is expected to reach 9.5 billion tons in 2050 [2]. This will put great pressure on the sustainable development of cities and the purification of the surrounding environment. At present, the treatment methods of MSWs include landfilling, composting, and incineration. MSWI is a mature waste-to-energy technology with waste reduction, resource utilization, and harmlessness [3]. MSWI has been widely used worldwide, especially in developing countries (e.g., China and India).
The MSWI process simulation includes the experimental method and the mathematical modeling method. The numerical simulation belongs to the latter. It is a flexible tool that can simulate various actual operating conditions. Shin [4] and Goh [5] used MSW combustion on grates as a 1D fixed bed, which was treated as a continuous porous medium to establish a mathematical model. Based on previous research, the research team at Sheffield University developed a solid-phase combustion model for grates (FLIC for short) [6]. The model reliably simulates the MSWI process and predicts velocity, pressure, temperature, and composition distribution. Later, FLIC is used to build various incineration plant models. Yang [7] and Yu [8] established a straw-burning model to analyze burning conditions under an oxygen-enriched atmosphere. A theoretical basis is provided for the structural design and optimized operation conditions. Ryu [9], Goddard [10], and Ismail [11] built a full-size FLIC model of the MSWI plant to predict gas temperature and composition distribution. A good agreement is found between predicted values and experimental data.
The parameter analysis and optimization are carried out based on the FLIC incineration model. Yang et al. [12,13,14,15] evaluated the influences of fuel moisture, fuel size, particle mixing level, volatile matter release rate, primary airflow, and feeding on combustion. Yan et al. [16,17] studied the influence of primary air temperature on MSW combustion. The release rate of volatile matter increases with the increased temperature, which increases the local maximum temperature in the furnace. It provides a theoretical foundation for controlling the local high temperature in the furnace within a reasonable range. The research of Alima et al. [18] showed that the low mixing degree between MSW and air leads to insufficient combustion. In addition, the solution to increase the stacking height of MSWs is put forward. Liang et al. [19] studied the influences of grate speed and oxygen concentration on pollutant emissions. NO emissions decrease, and CO emissions increase with the increased grate speed. Hu et al. [20] believed that the optimal NOx control method is the combination of 100% load and 31% excess air coefficient. Lin et al. [21] coupled FLIC with CFD to study the co-disposal of sludges and MSWs. The suitable maximum sludge-mixing rate is 13% for the incinerator. Chen et al. [22] divided the temperature field into furnaces. Feeding, grate speed, and primary air are the key manipulated variables influencing temperature distribution.
The above research shows that FLIC is widely used in MSWI combustion modeling. However, few studies have analyzed non-manipulated variable parameters [13,15]. The actual specific incinerator should be modeled due to the difference in the incinerator structure and industrial parameters. The influence of different operating conditions and non-manipulated variable parameters on the combustion effect ought to be studied in terms of low pollution-emission robust control. This work establishes a solid-phase combustion-simulation incineration model in the furnace for an actual running MSWI plant in Beijing by FLIC. The main novelty of this work is as follows.
(1) The solid phase combustion numerical model was constructed and verified in terms of the actual benchmark working condition of an actual running MSWI plant in Beijing, China.
(2) A multi-condition data-generation method based on the simulation model was proposed using a biorthogonal experiment.
(3) The law of non-manipulated variables affecting solid-phase combustion in the furnace was discussed. These results provide a theoretical basis for robust control of the MSWI process in terms of low pollution emissions.

2. Solid-Phase Combustion Analysis of the MSWI Process for Non-Manipulated Variables

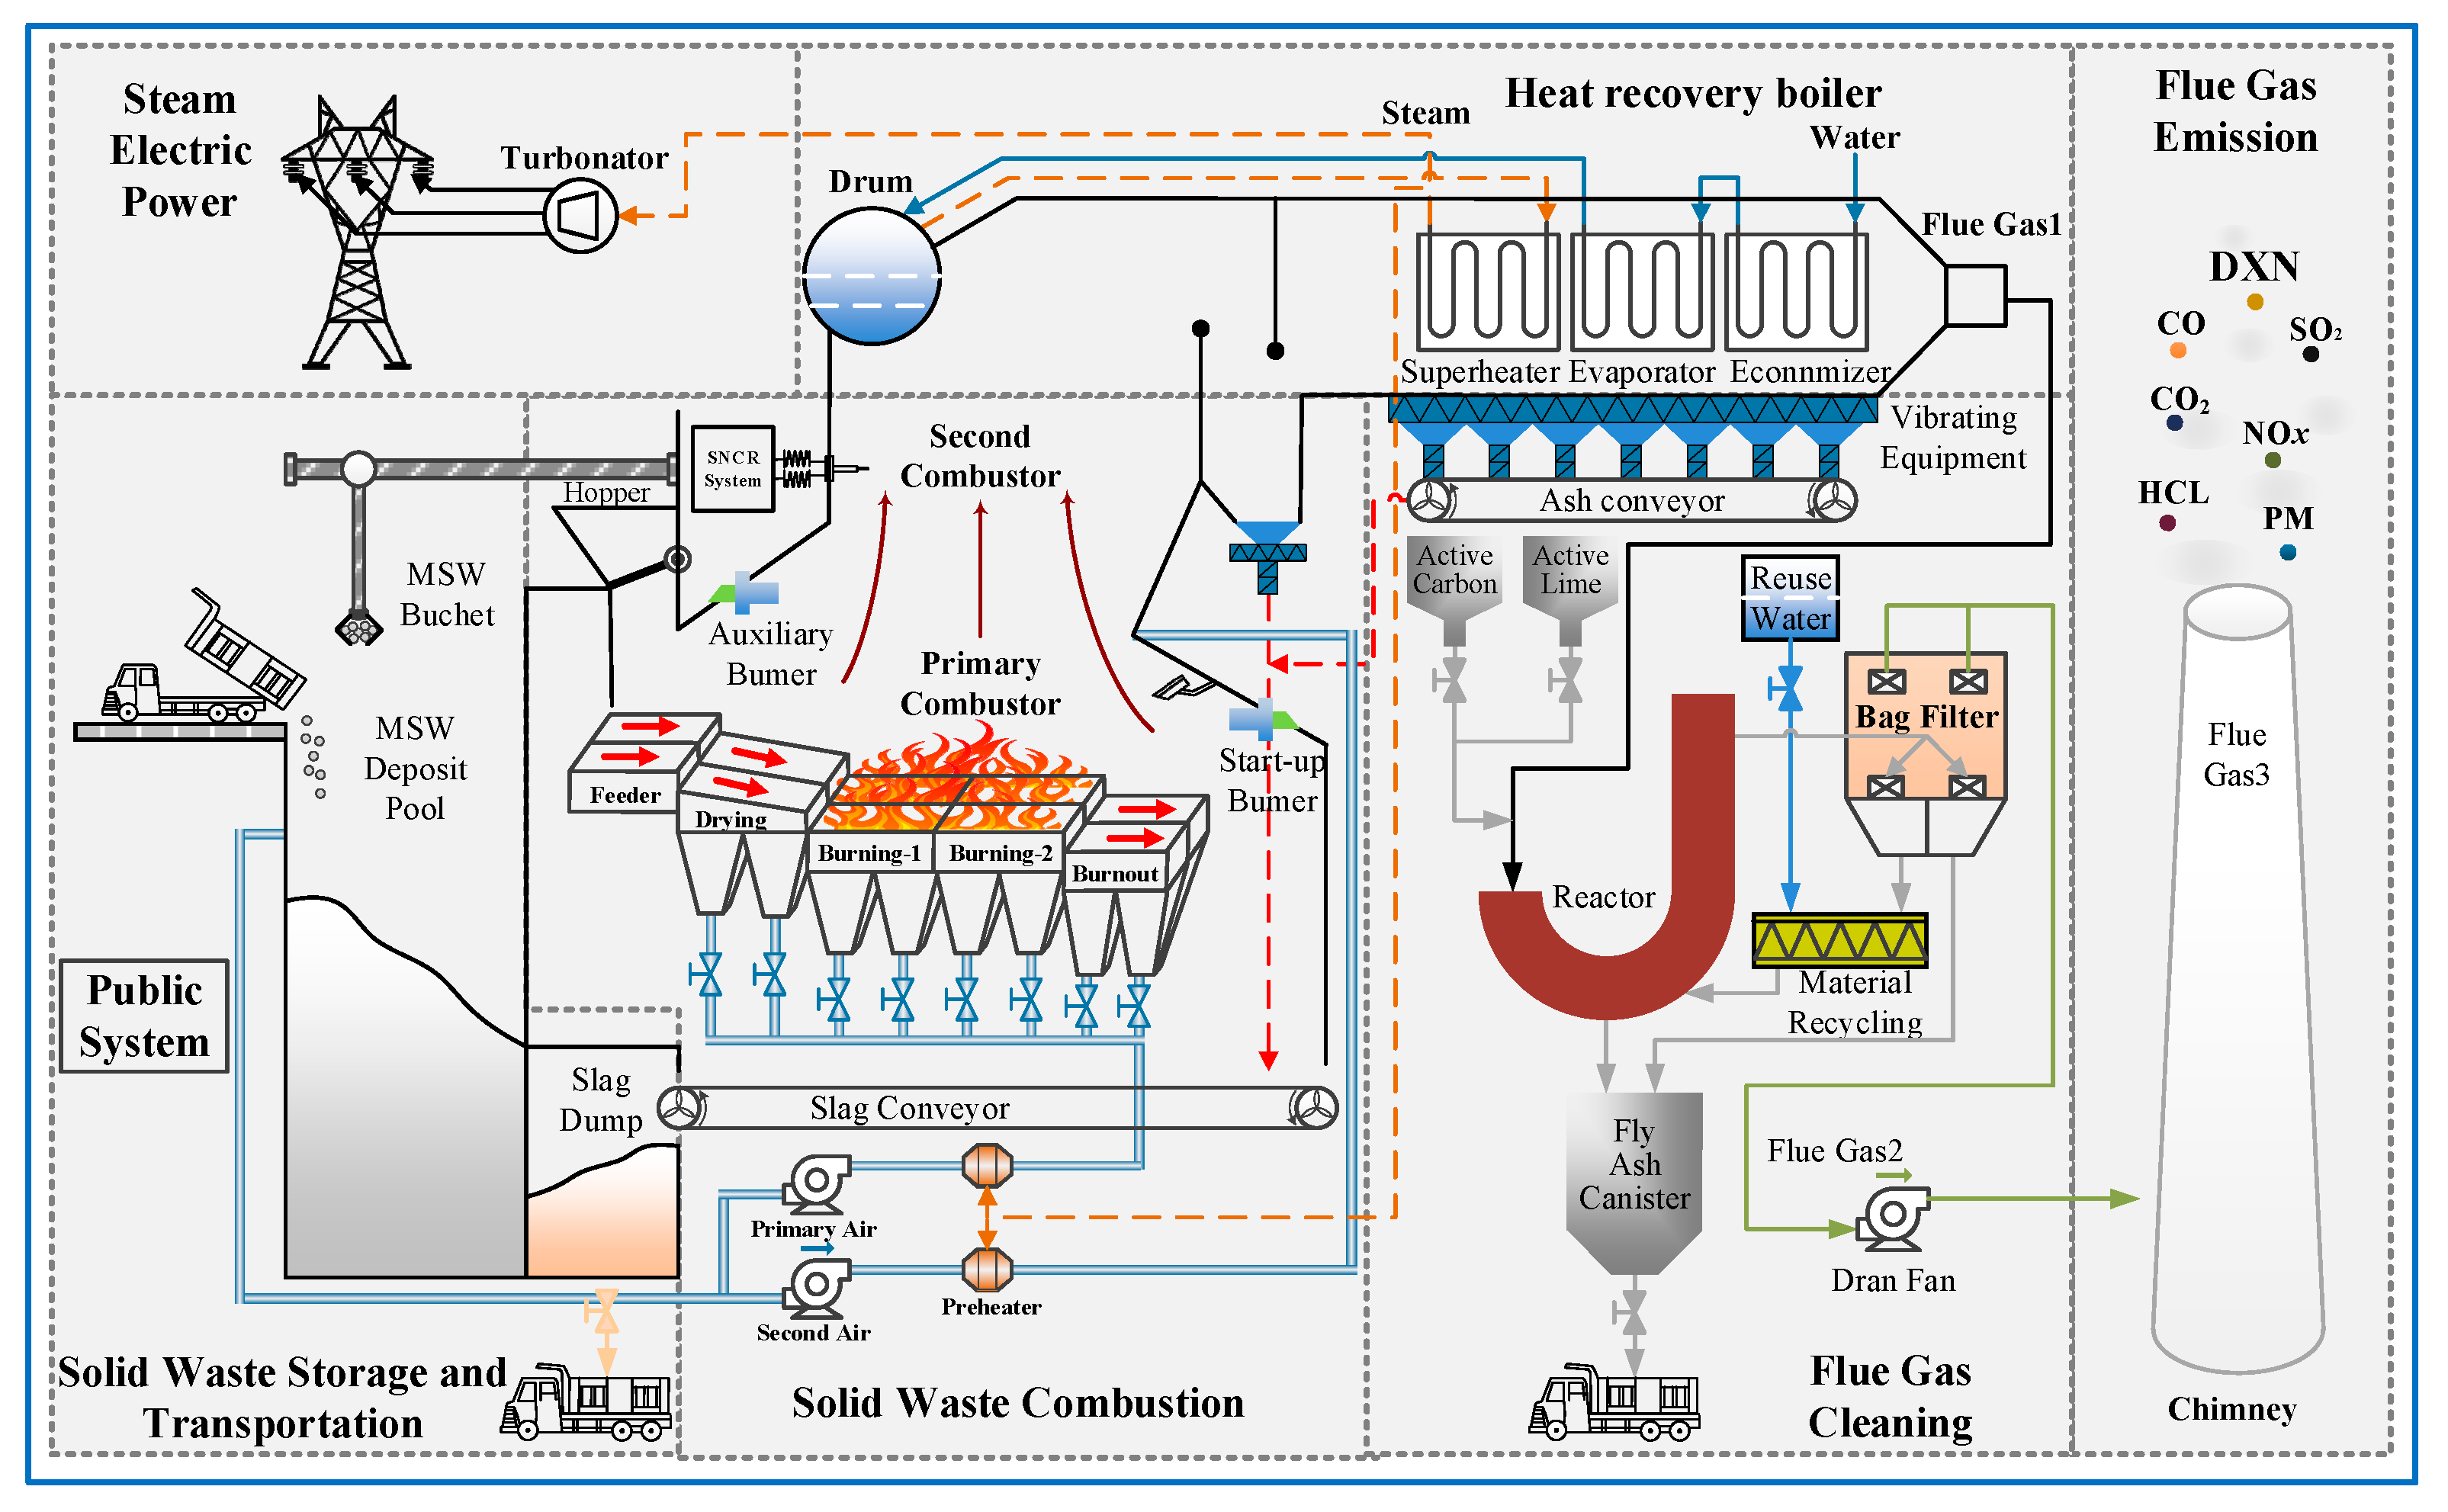
2.1. Description of Solid Phase Combustion in the Furnace

Figure 1 shows the process flow of the grate-type MSWI in Beijing.
The MSWI process is divided into six stages: solid waste storage and transportation, solid waste combustion, heat recovery boiler, steam electric power, flue gas cleaning, and flue gas emission (Figure 1). The details are as follows: MSWs are collected and transported by vehicles to the MSWI plant, where they undergo fermentation and dehydration processes to ensure their attainment of a low calorific value. MSWs are hoisted and put into the feed hopper of the incinerator and then pushed into the incinerator by the feeder, which passes through drying, burning 1 and 2, and the burnout grate. The flue gas is pumped into the waste heat recovery system by the induced draft fan, which generates high-temperature steam after heat exchange with liquid water in the boiler drum. The flue gas at the outlet of the boiler enters the reactor and the bag filter in turn, where acidic gas, particles, and active carbon adsorbates are removed from the flue gas. The induced draft fan discharges the flue gas from the stack into the environment. The tail gas contains HCl, SO2, NOx, dioxins, and other substances.
Solid-state combustion in the furnace refers to the process of MSW combustion on the grate. MSWs are assumed to be spherical particles, which eventually transform into ashes through processes such as drying, release of volatile matter, combustion, and char oxidation [23]. Figure 2 presents the combustion process of the MSW particles.
Figure 2 shows that the drying process is mainly moisture evaporation in the first stage, which can be attributed to the radiation heating of the furnace wall and the convection heat transfer of primary air. The second stage is volatile release, which occurs in the front section of the burning 1 grate. Organic matter in MSWs is decomposed and released as gases (CmHn and CO). Volatile matter reacts violently with O2, and the remaining MSWs gradually form char at the third stage. It occurs at the back section of burning 1 and 2 grate, which is the main combustion area on the grate. The fourth stage occurs in the burnout grate. The remaining MSWs (char) continue to react with O2, and carbon is oxidized to produce CO and CO2. As char is exhausted, the flame goes out with only ashes remaining.

2.2. Non-Manipulated Variable Analysis of Influencing the MSWI Process

Manipulated variables pertain to controllable factors within the operational MSWI plant, encompassing feedstock, grate speed adjustment, and primary air regulation. Non-manipulated variables cannot be directly manipulated by experts in terms of the distributed control system in the operating process. Some non-manipulated variables affecting solid-phase combustion are as follows.
(1) When MSWs are assumed to be spherical particles, large-size particles reduce heat transfer radiation and lead to a low thermal effect [24]. More voids are produced, which increases the air amount around MSW particles. This makes gas flow more easily, with increased disturbance and combustion speed.
(2) Particle mixing means that MSW particles on the bed vibrate, exchange positions with neighboring particles and change shapes. Figure 3 shows the relationship between oxygen and temperature fluctuations measured at the outlet of the furnace and the grate movement [25]. The particle’s mixing degree is changed by the grate movement, which has a distinguished impact on combustion.
(3) The radiation source in the furnace generally comes from the furnace wall, and emissivity reflects the ability of the furnace wall to radiate energy.
(4) Moisture content mainly affects the moisture evaporation process in the first stage. MSWs with high water content have a long drying period, which weakens the combustion process and leads to low temperatures [26].
(5) C, H, O, and N are abundant in MSWs. Theoretically, the higher the C content, the larger the calorific value of MSWs, and the better the combustion performance.
To sum up, the particle size, mixing coefficient, emissivity, moisture content, and C:O ratio are the key factors affecting solid-phase combustion.

3. Materials and Methods

3.1. Materials

According to the actual MSWI process design, the incineration operation is stable, and the furnace temperature is kept above 850 °C when a set of operating parameters (e.g., the feed rate, grate speed, and primary air) are given. It is called the benchmark operating condition for the studied MSWI plant in Beijing. Table 1 and Table 2 list the MSW properties and the operating condition benchmark of an incineration power plant in Beijing.
The MSW capacity is 628.8 t/d, with a grate length of 11 m and a width of 12.9 m (Table 2). The primary airflow is 67,500 Nm3/h, and the air temperature is 200 °C. Primary air enters the bed from four independent parts below grate, and the flow rate of each part accounts for 24.31, 43.35, 19.27, and 13.07% of primary air, respectively.

3.2. Methods

The orthogonal experiment can be used to study multi-factor and multi-level experiments. According to the principle of orthogonality, a subset of representative points is selected from the comprehensive experiments for further investigation, and the experimental results are typically regarded as consistent with those obtained from comprehensive experiments [27]. Based on a biorthogonal numerical simulation experiment, a non-manipulated variable single-factor analysis method of solid-phase combustion in the MSWI process is proposed to obtain a considerable number of combustion conditions. Figure 4 presents the specific implementation process.

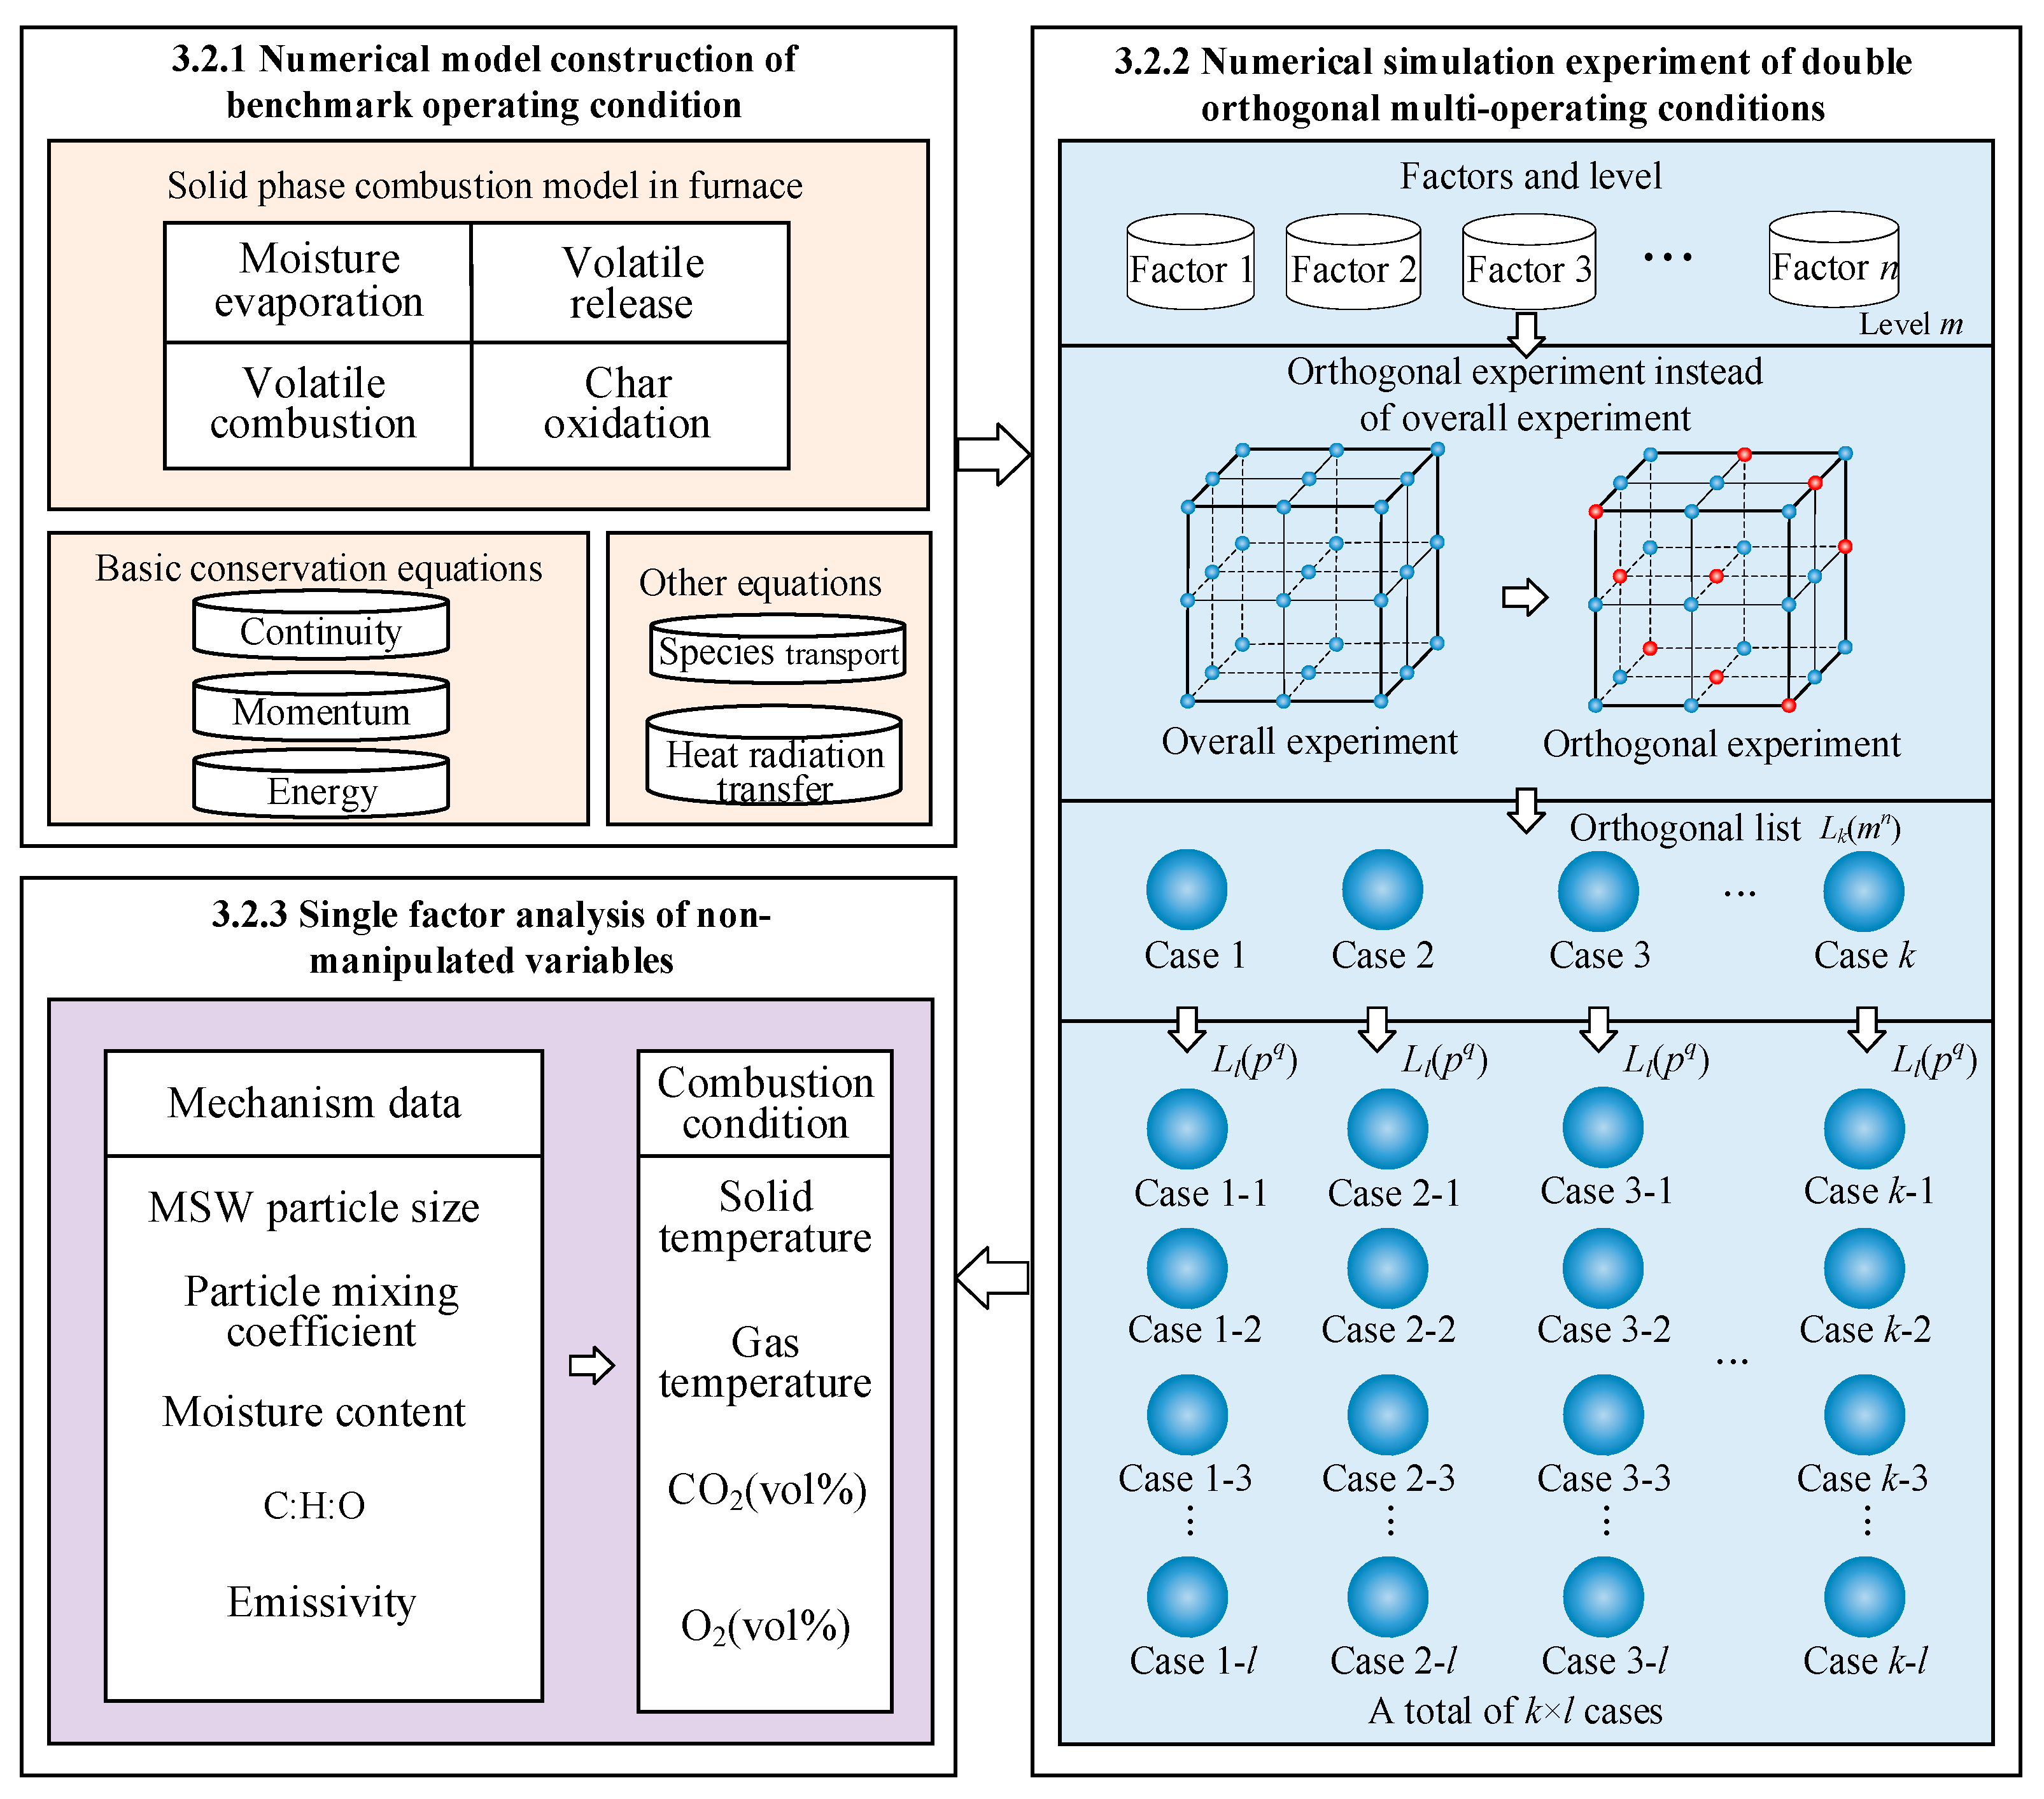
3.2.1. Numerical Model Construction of the Benchmark Operating Condition

Software FLIC was used to establish a numerical model of the benchmark operating condition of an actual incineration plant in Beijing. The model for solid-phase combustion, along with the fundamental conservation equations and other relevant equations, is presented below.

Solid Phase Combustion Model in the Furnace

Figure 2 shows a numerical model of the MSW combustion process, which is called the solid-phase combustion model. This model contains four sub-models: moisture evaporation, volatile release, volatile combustion, and char oxidation [6].
(1) Evaporation of the moisture sub-model
MSWs are heated to release moisture due to radiation from the flame and furnace walls. Meanwhile, the convection of primary air at the bottom of the grate carries away some moisture. The evaporation rate [6,28] is defined by:
R evp = S a h s ( C w , s C w , g ) ,   T s < 100   ° C Q cr / H evp , T s = 100   ° C
where R evp is the rate of water evaporation; S a is the particle surface area; h s is the convective mass transfer coefficient with MSWs when the gas flows; T s is the MSW temperature; C w , s and C w , g are water content in MSWs and the mixed gas, respectively; H evp is the heat of water evaporation; Q cr is the heat that MSWs absorb during radiative and convective heat transfer.
(2) Sub-model of the volatiles’ release
The MSW temperature quickly reaches the temperature of releasing volatiles after water evaporation, and char is generated slowly by the rest of the MSWs. The release process of the main volatile matter (CmHn, H2O, CO2, and CO) [6] in MSWs is defined by:
MSW Volatile C m H n , CO , CO 2 , H 2 O + Char
The one-step global reaction model [29] is used because of its simplicity and accuracy. The reaction rate is directly proportional to the temperature and residual volatile in the model (Equation (3)).
R V = ρ sb ( v v ) A V exp E V R T s
where R V is the release rate of volatiles; v is the final production of the gas released; v is the amount of the gas released at time t; R is the ideal gas constant; A V is the pre-exponential factor in devolatilization; E V is the active state energy of the chemical reaction.
(3) Sub-model of volatiles’ combustion
The gas released in the previous stage burns immediately after mixing with air. The combustion reactions of CmHn and CO are defined by:
C m H n + m / 2 + n / 4 O 2 m CO + n / 2 H 2 O
CO + 1 / 2 O 2 CO 2
Equations (6) and (7) show the kinetic rates of CmHn and CO, respectively [30].
R C m H n = 59.8 T g P 0.3 C C m H n 0 . 5 C O 2 exp 12200 / T g
R CO = 1.3 × 10 11 C CO C H 2 O 0.5 C O 2 0.5 exp ( 62700 / T g )
where T g represents the MSW temperature.
The eddy-break-up concept assumes that the mixing rate of volatiles with air is proportional to the pressure drop of the MSW bed. Therefore, the mixing rate based on the Ergun equation [11] is defined by:
R mix = C mix ρ g 150 D g ( 1 ϕ ) 2 / 3 d p 2 ϕ + 1.75 V g ( 1 ϕ ) 1 / 3 d p ϕ min C fuel S fuel , C O 2 S O 2
where C mix is the empirical constant; ρ g is the gas density; C is the mass fraction of the participating mixtures; D g is the mass diffusion coefficient of the gas; d p is the MSW particle size; ϕ is the bed void; S is the coefficient of the combustion reaction.
The minimum kinetic rate and mixing rate are taken as the combustion rate of volatile matter (Equation (9)).
R = min R kinetics , R mix
(4) Sub-model of char oxidation
MSWs gradually form char with the release of volatiles. The carbon further reacts with air and generates CO and CO2 according to the amount of O2 during combustion (Equation (10)) [31].
C s + α O 2 2 1 α CO + 2 α 1 CO 2
where the stoichiometric coefficient α ranges from 0.5 to 1 according to Arthur’s law [31].
The oxidation rate of char [28] is defined by:
R C = P O 2 1 k r + 1 k d
where R C is the oxidation rate of char; P O 2 is the pressure at which O2 is divided during combustion; k r is the rate of chemical kinetics; k d is the diffusion rate.

Basic Conservation Equation

There is an exchange of reaction heat and mass between MSWs and gases in the bed, considering porous media. Therefore, it is necessary to establish a conservation equation of continuity, momentum, and energy using the MSW bed.
The mass continuity of the gas and solid phases [26] is defined by:
ρ g ϕ t + · ρ g ϕ V g V B = S sg
ρ sb t + · ρ sb V s V B = S s
where V g and V s are the gas velocity and MSW particle velocity, respectively; V B is the speed of moving the boundary; S sg is the rate at which MSWs are converted into gases due to water evaporation, devolatilization, and char oxidation; S s is the source term of MSW particle mass.
The accumulation of MSW forms numerous irregular and narrow gaps. As a result, there is no large-scale turbulence in the MSW bed. The momentums of the gas and solid phases [32] are defined by:
ρ g ϕ V g t + · ρ g ϕ V g V B V g = p g + F v
ρ sb V s t + · ρ sb V s V B V s = · σ · τ + ρ sb g + A
where ρ g is the pressure of the mixed gas in the MSW bed; F v is the resistance of MSWs to gas flow in the gap; σ and τ are the normal stress tensor and tangential stress tensor, respectively; A is the random motion of MSW particles.
The energy of the gas and solid phases [6] is defined by:
ρ g ϕ H g + · ρ g ϕ V g V B H g = · λ g T g + S a h s T s T g + Q h
ρ sb H s t + · ρ sb V s V B H s = · λ s T s S a h s T s T g + · q r + Q sh
where H g is gas enthalpy; H s is solid phase enthalpy; Q h is the heat gain or loss of the gas; Q sh is the source term of the MSW particles’ heat; q r is the radiant heat flux; λ g is the heat dispersion coefficient consisting of turbulence and diffusion; λ s indicates is the thermal conductivity of the MSW bed.

Equations of Species Transport and Heat Radiation Transfers

The species transport equations [6] used to simulate the interaction between the mixtures are shown as follows after the conservation equation is established.
ρ g Y i , g ϕ t + · ρ g ϕ V g V B Y i , g = · D i g ρ g Y i , g + S Y i , g
ρ sb Y i , s t + · ρ sb V s V B Y i , s = · D s ρ sb Y i , s + S Y i , s
where Y i , g is the mass fraction of a single component (CmHn, CO, CO2, H2, and H2O); Source term S Y i , g shows the mass source of volatile gases and char during evaporation, devolatilization, and combustion; Y i , s is the mass fractions of MSW particle compositions; S Y i , s is the mass source of MSW particle compositions; D i g is the fluid dispersion coefficient composed of diffusion and turbulence contributions; D s , the mixing coefficient of particles in the bed, depends on the grate’s motion frequency.
The radiation source in the furnace generally comes from the wall. Radiant heat transfer transports the heat generated by the combustion reaction to the top layer of the bed. Energy is provided for moisture evaporation, MSW pyrolysis, and other endothermic solid-phase reactions in the top layer [33]. Generally, it is expressed by a four-way radiation model [34].
d I x + d x = k a + k s I x + + 1 4 k a E b + 1 4 k s I x + + I x + I z + + I z
d I x d x = k a + k s I x + 1 4 k a E b + 1 4 k s I x + + I x + I z + + I z
d I z + d z = k a + k s I z + + 1 4 k a E b + 1 4 k s I x + + I x + I z + + I z
d I z d z = k a + k s I z + 1 4 k a E b + 1 4 k s I x + + I x + I z + + I z
where I x + , I x , I z + , and I z are radiation intensity in four directions, respectively; k a and k s are the coefficients of absorption and scattering for the radiation process, respectively; E b is the radiation of the blackbody; k s is approximately zero; k a [12] is defined by:
k a = 1 d p ln ϕ

3.2.2. Numerical Simulation Experiment of Biorthogonal Multi-Operating Conditions

The design process of the orthogonal experiment with double coupling is as follows (Figure 4). (1) Determine the experimental factor n and its level number m. Orthogonal experiment table Lk(mn) can be obtained by replacing the comprehensive experiment with the orthogonal experiment. According to this orthogonal table, k experimental cases can be obtained. (2) Based on the k cases of the first orthogonal experiment, their experimental factors p and their level numbers q are re-determined to obtain k orthogonal experimental tables (Ll(pq)). (3) Finally, k × l experimental cases are obtained by the orthogonal table.
The orthogonal experimental method of double coupling is applied to design the multi-operating conditions of solid-phase combustion. Table 3 and Table 4 list the orthogonal experimental settings in the first and second stages.
Table 3 shows that 10 parameters are selected as the factors of the orthogonal experiment. Feeding, grate speed, and primary air reflect changes in operating conditions. The moisture content and the mass ratio of C to O reflect that the compositions of MSWs fluctuate within a certain range. The MSW particle size and mixing coefficient can reflect the accumulation and movement of particles when the grate moves. The parameter range is determined by experience, and five levels are taken at equal intervals within the parameter range. The factors and levels in Table 3 are set as the first-stage orthogonal experiment in Figure 4, that is, m = 10 and n = 5. The orthogonal design tool is used to generate an orthogonal list that can automatically match the most consistent orthogonal list (L49(510)). Therefore, k = 49. Similarly, the factors and levels in Table 4 are set as the second-stage orthogonal experiment. Therefore, p = 6 and q = 5. Orthogonal experiment list L42(56) is obtained and designed l = 42 by the orthogonal design tool. To sum up, a total of 2058 (49 × 42) operating conditions are designed.

3.2.3. Single Factor Analysis of Non-Manipulated Variables

The work studied the influences of non-manipulation parameters on solid-phase combustion, including the MSW particle size, particle mixing coefficient, moisture content, ratio of C to O, and emissivity. Mechanism data have been obtained by the biorthogonal numerical simulation experiment. Therefore, the analysis of the first four factors can be directly used by the mechanism data. That is, each factor is grouped according to 5 levels. Then, a working condition is selected in each group according to the principle of similar operating conditions. Combustion conditions are characterized by temperature and gas concentration. However, the biorthogonal experiment does not consider emissivity; the emissivity analysis requires additional simulations. That is, five emissivity values are assigned for conducting additional simulations. The single-factor analysis in this work reflects the influences of non-manipulated variables on solid-phase combustion under complex and changeable operating conditions.

4. Simulation Results and Discussion

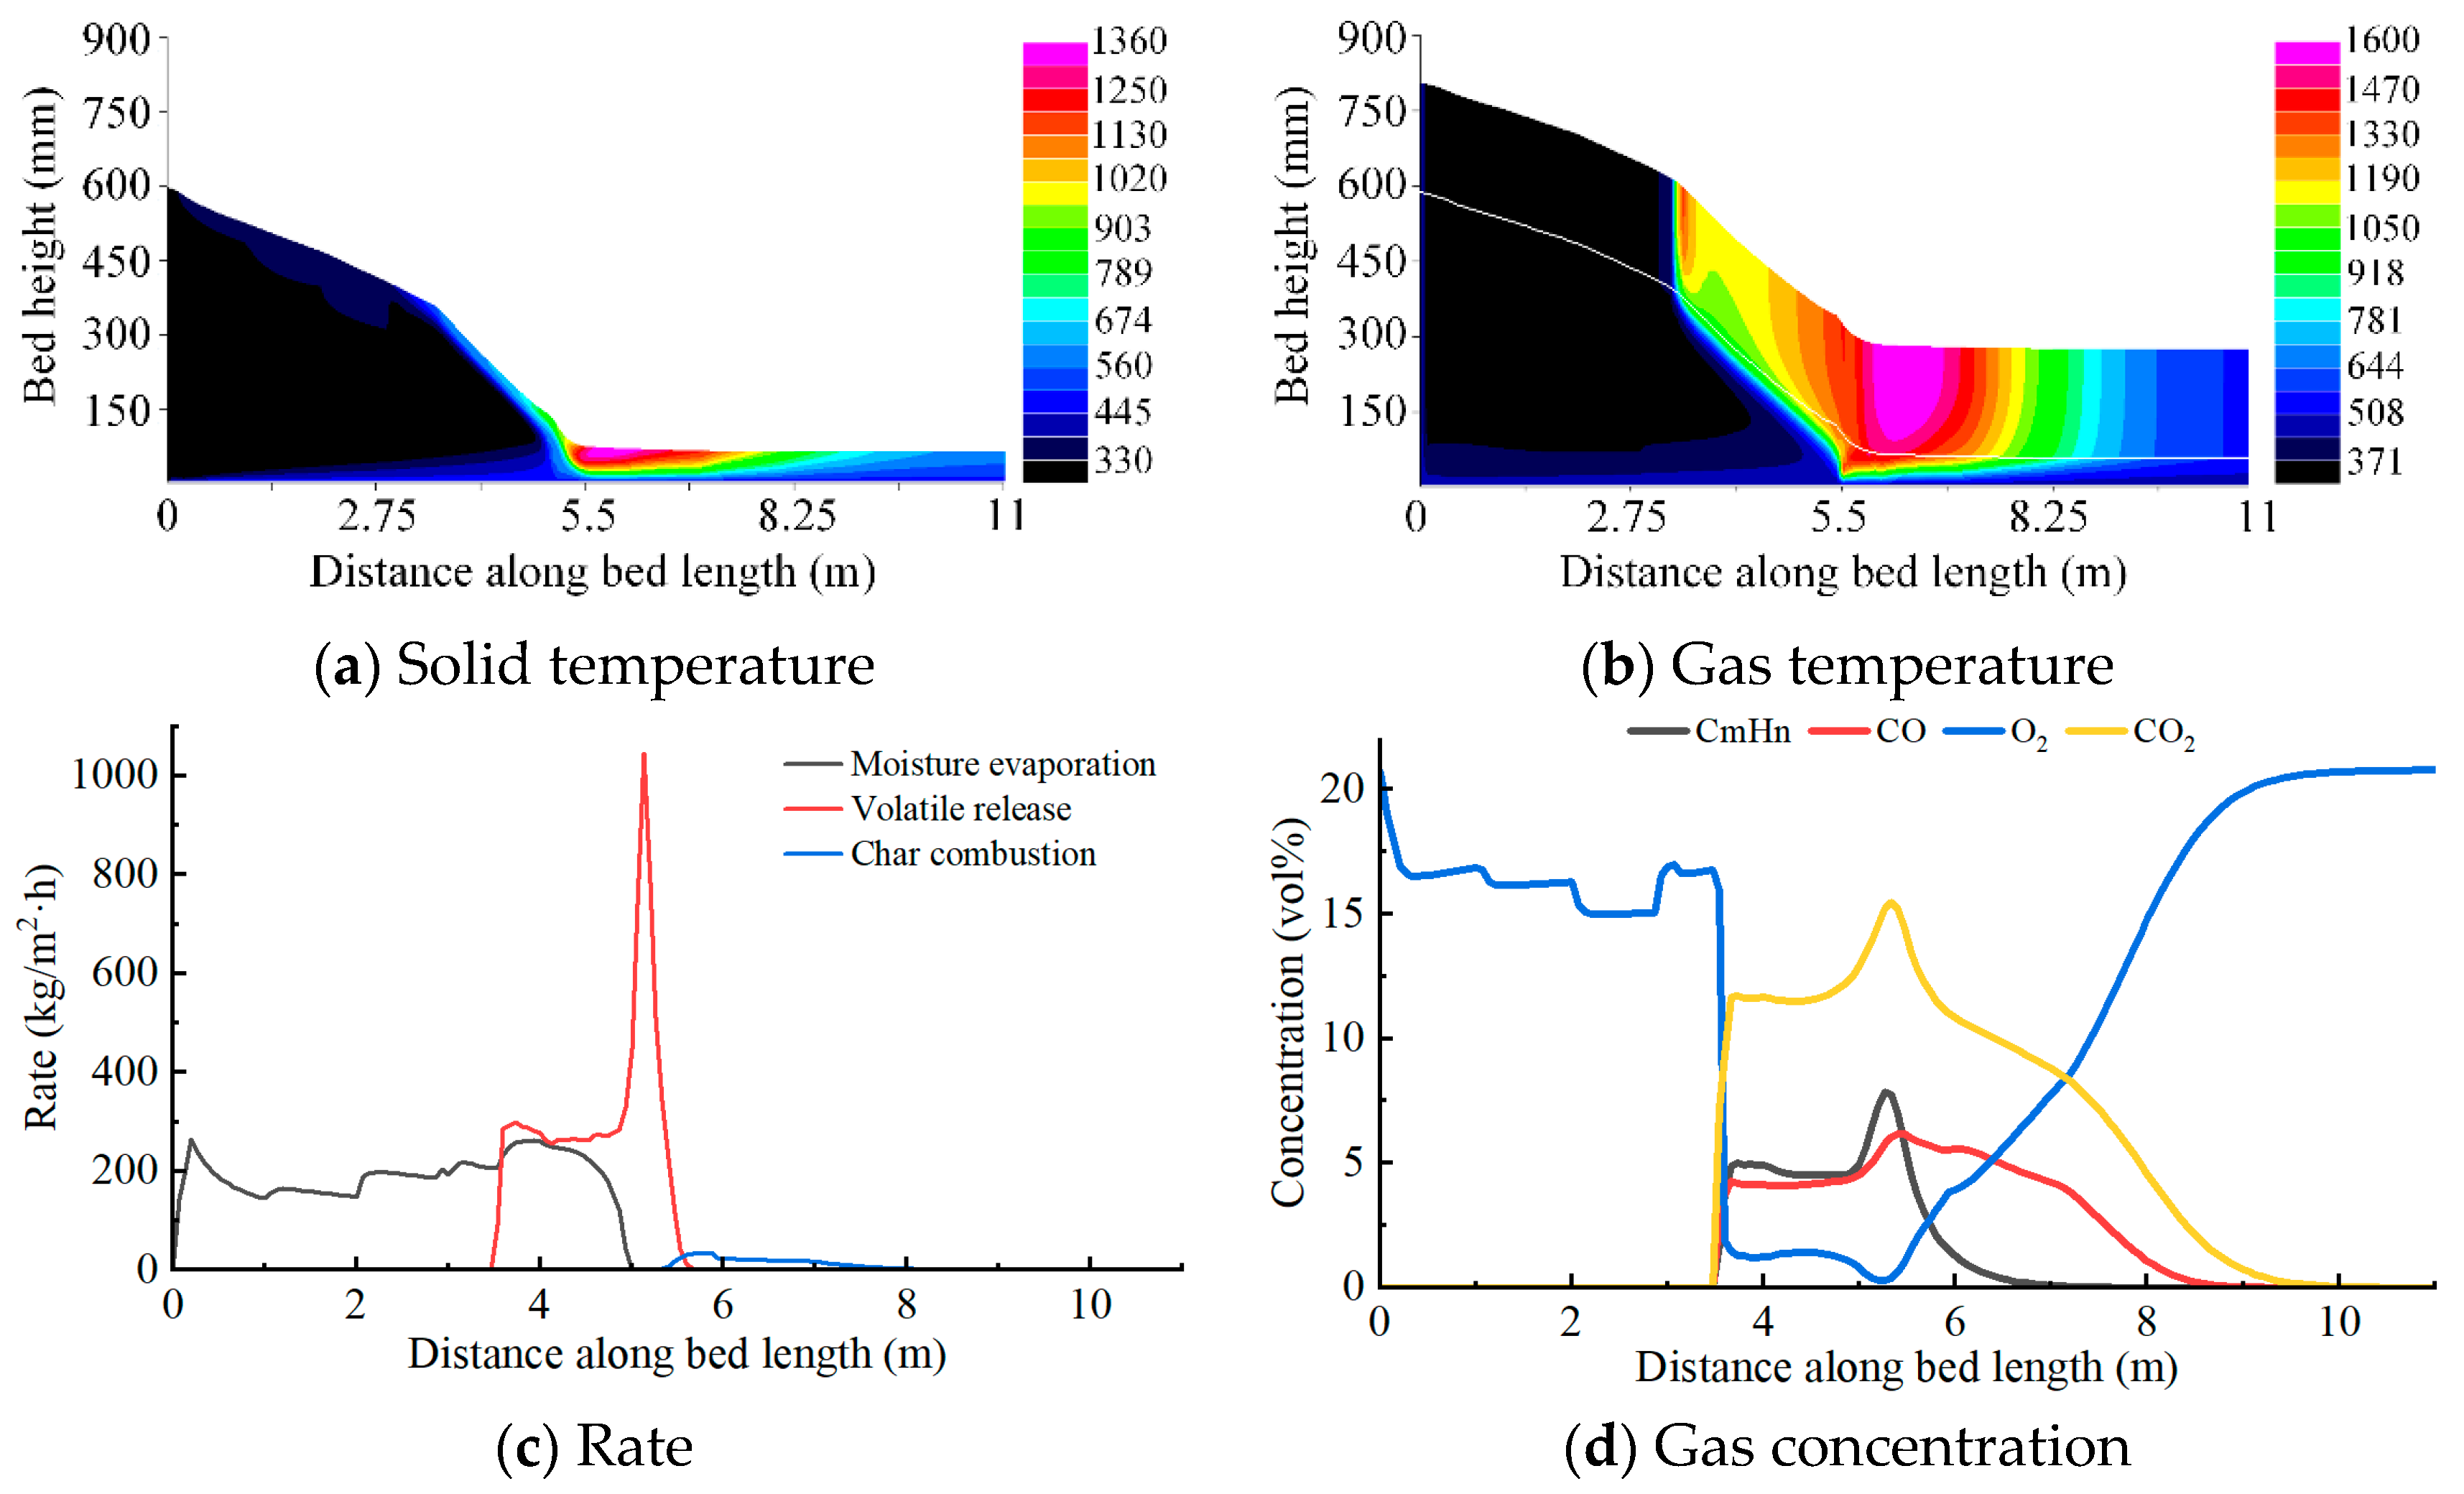
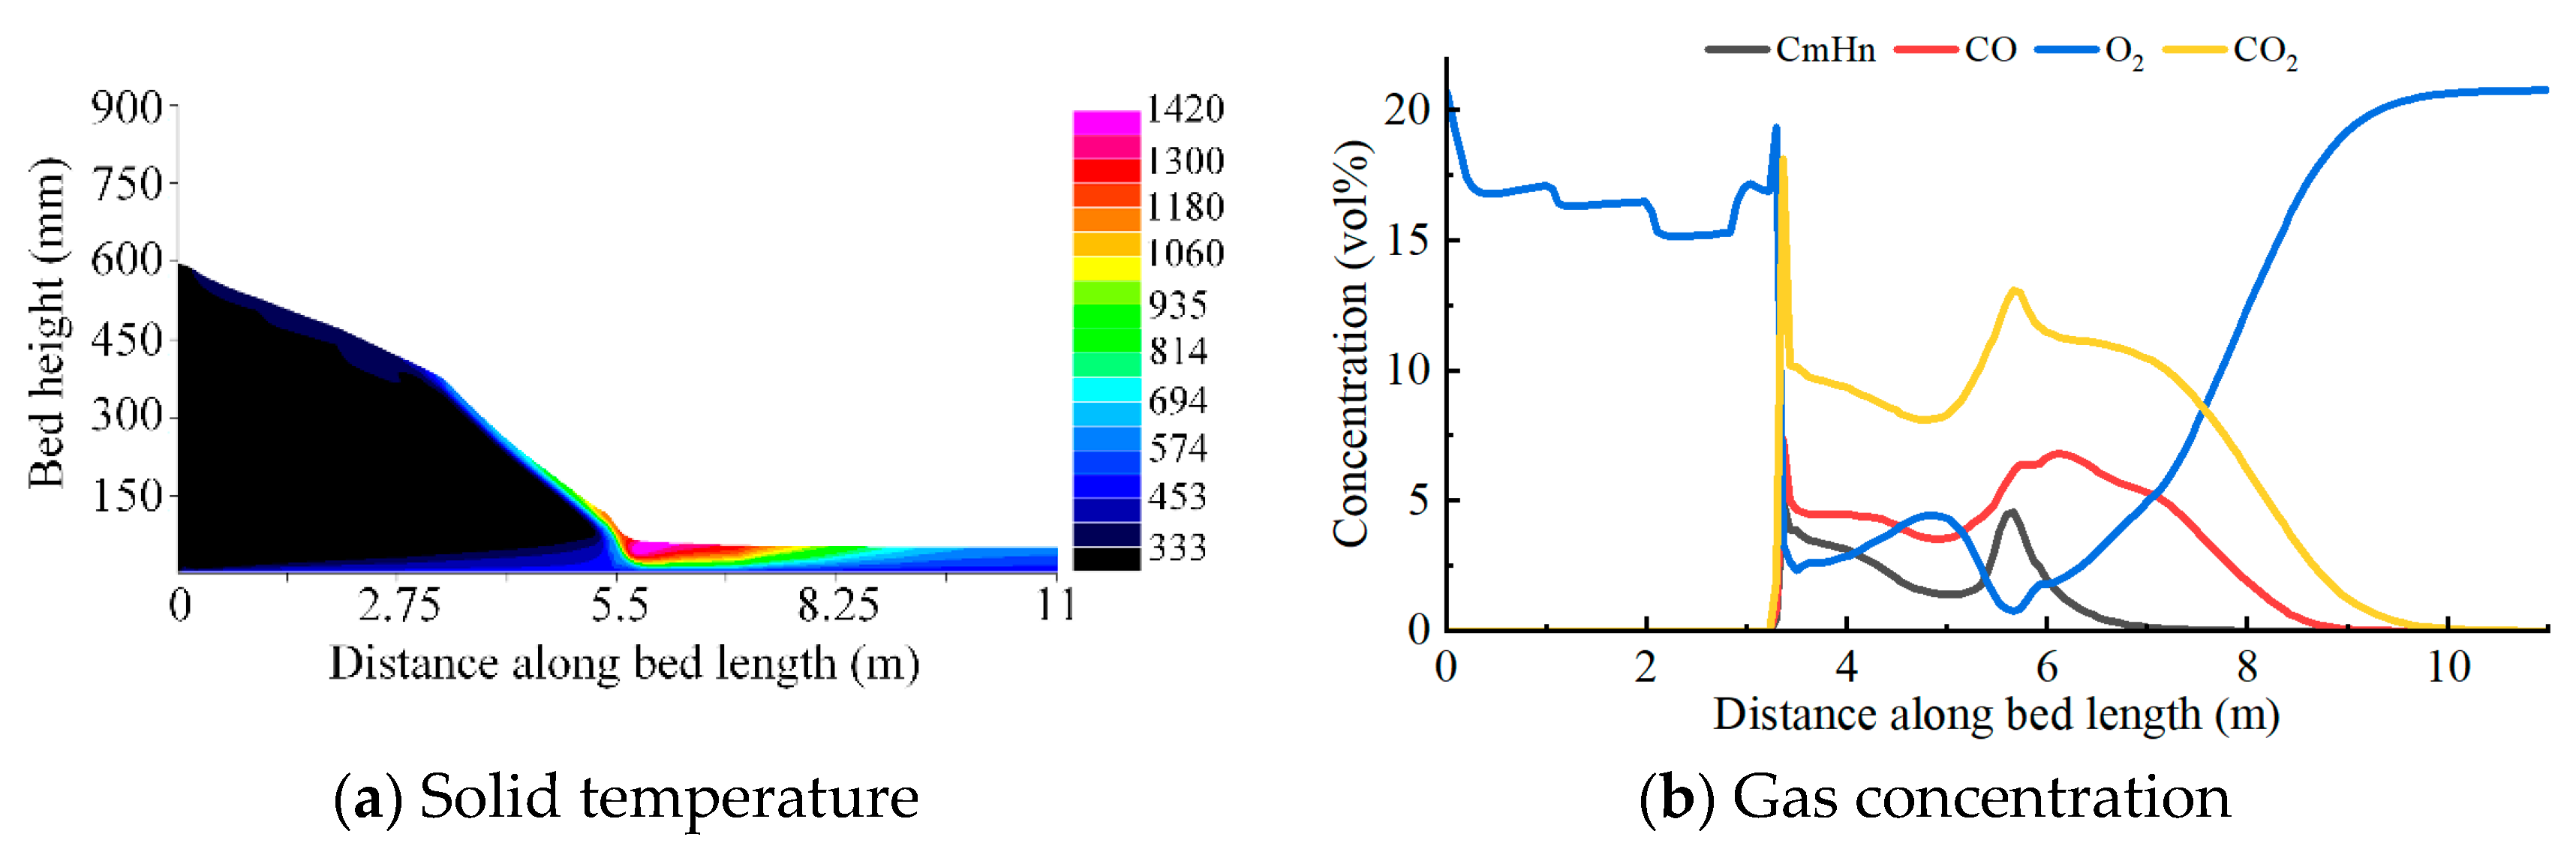
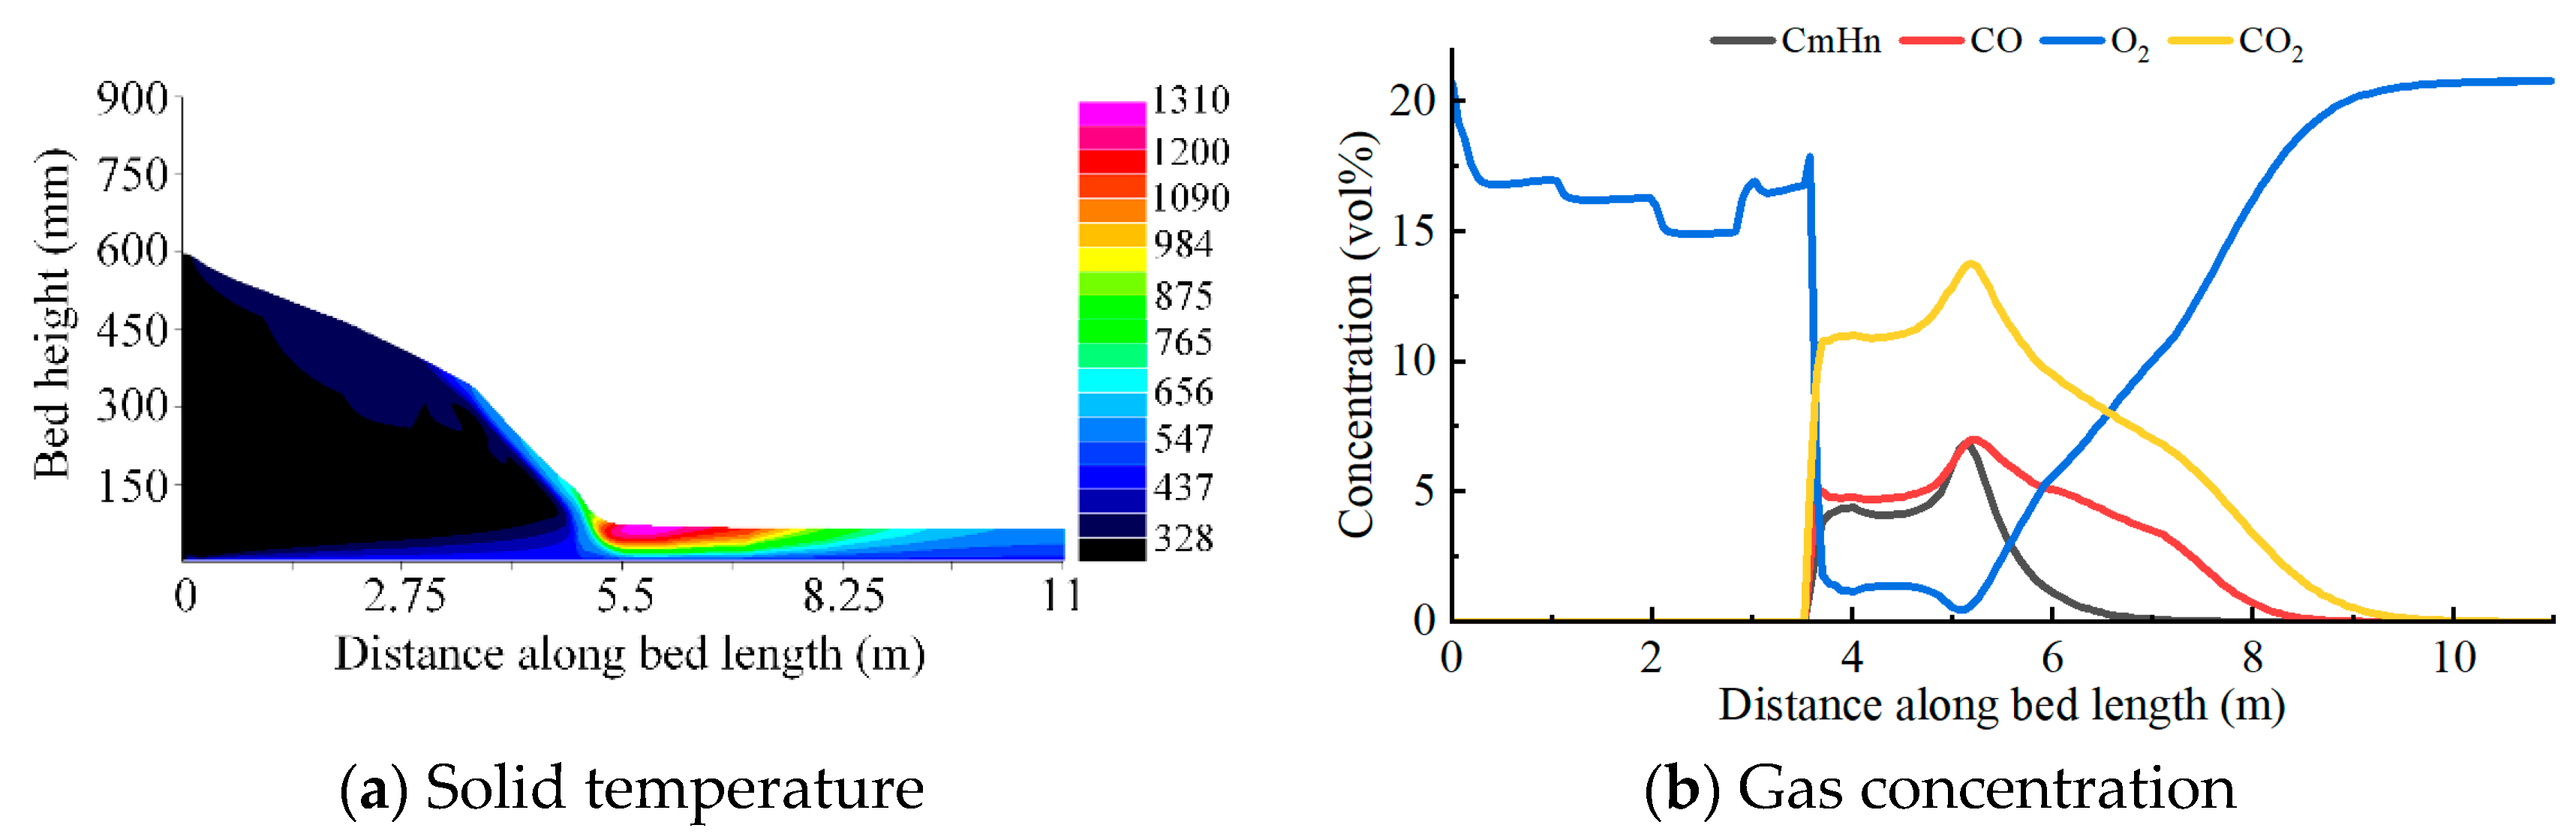
4.1. Simulation Results and Discussion of the Benchmark Operating Condition

Figure 5 shows the simulation results of the benchmark operating condition of an incineration plant in Beijing.
(1) Radiated energy from the flame and wall is used to heat the top layer of the MSW bed in the drying grate, and a large amount of moisture evaporates. Water vapor is the main gas at the top of the MSW bed, with a temperature of 373 K. Meanwhile, primary air passes through the grate and enters the MSW gap. The bed bottom is heated by primary air.
(2) The bed temperature reaches 533 K (the initial temperature) at 3.3 m, indicating the initiation of volatile matter release and subsequent ignition of MSWs. The solid temperature rises instantly, which increases the release rate of volatile matter to 1046 kg/m2·h instantly.
(3) The grate center is the main combustion area, and O2 is consumed in large quantities. The highest solid temperature reaches 1360 K, and the highest gas temperature reaches 1597 K.
(4) The release of volatile substances ends at the burnout stage, and the burning speed of char increases rapidly. The solid temperature gradually decreases to 550 K after char combustion. O2 content increases rapidly—reaching 23% at about 9m.

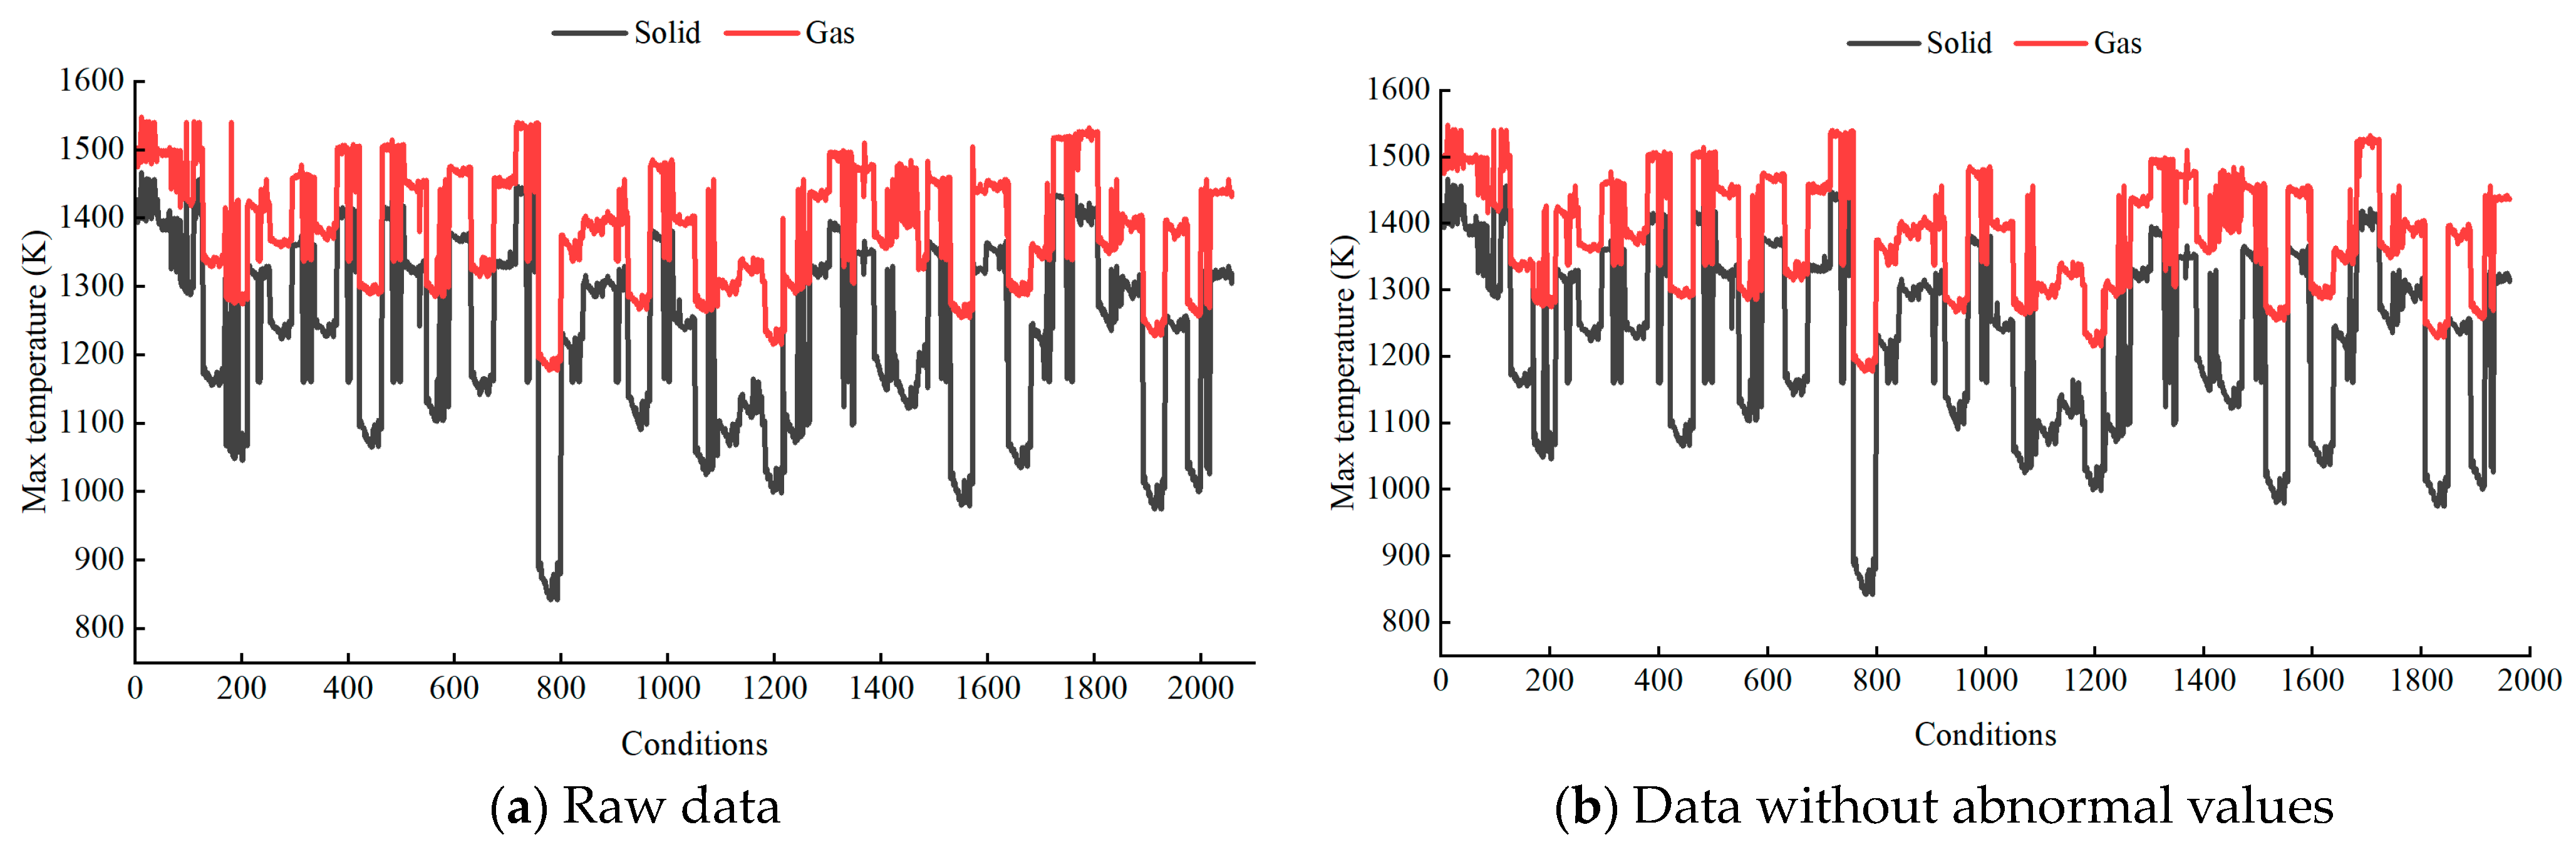
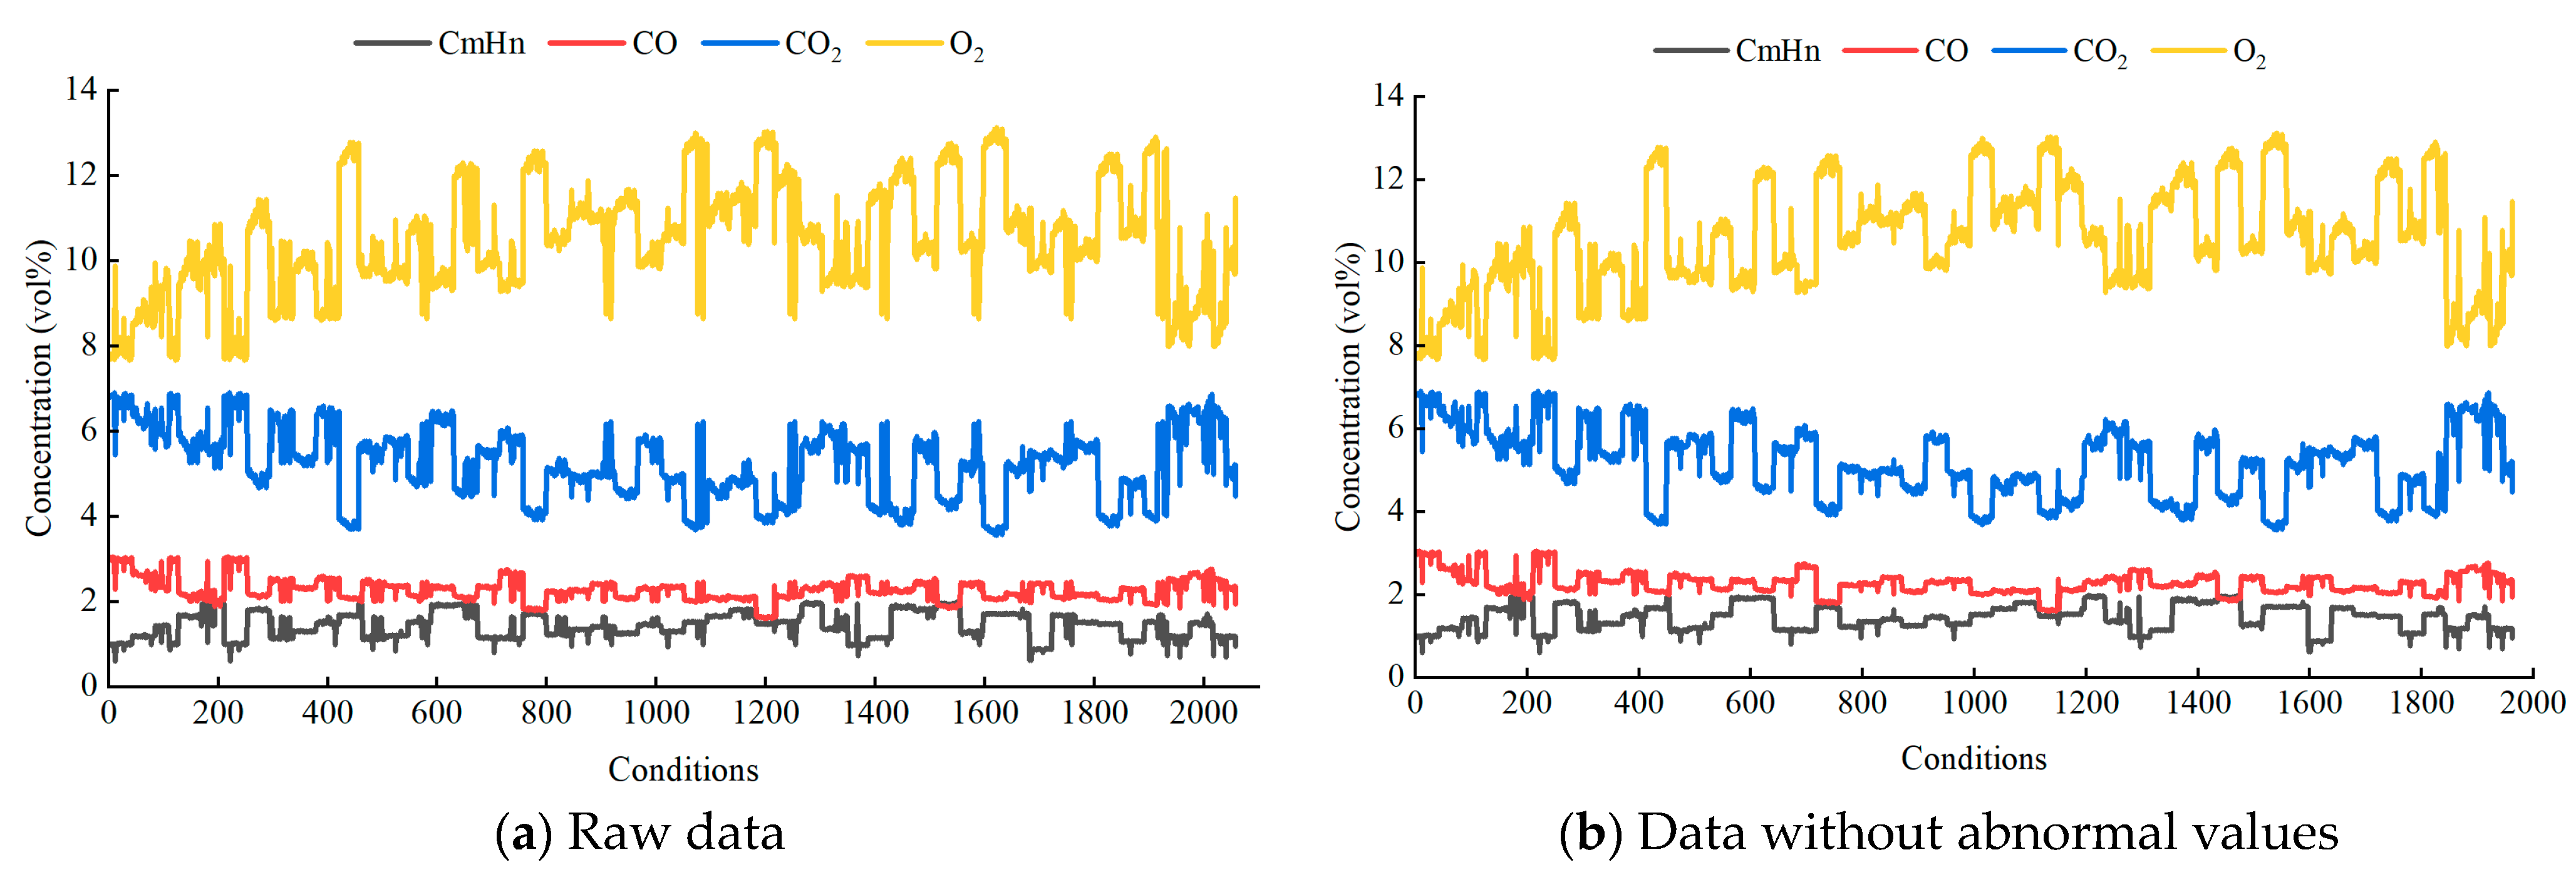
4.2. Simulation Results and Discussion of Biorthogonal Multi-Conditions

The multi-operating conditions designed by the biorthogonal experiment method are numerically simulated (Figure 6 and Figure 7).
Figure 6 and Figure 7 show some spikes in the raw data, which are abnormal values. The maximum solid temperature ranges from 842 to 1467 K after removing them, and the maximum gas temperature ranges from 1177 to 1548 K. The CmHn, CO, CO2, and O2 concentrations are within 0.603–1.989%, 1.61–3.054%, 3.559–6.911%, and 7.671–13.13%, respectively. Mechanism data cover the incineration situation under different operating conditions using the biorthogonal experiment method.
Temperature can be used to judge the quality of combustion conditions. Five operating conditions above and below the referenced temperature benchmark are selected from mechanism data for the analysis. Table 5 lists the parameter settings. Figure 8, Figure 9, Figure 10, Figure 11 and Figure 12 present the solid temperature and gas concentration.
(1) The feed rate is 24.3 t/h in condition 1, with a grate speed of 7 m/h and primary air of 1069.6 Nm3/min. These are the minimum values among the five conditions. The slow grate speed leads to more complete MSW combustion, which makes the CmHn, CO, and CO2 concentrations higher than the benchmark operating condition. The solid temperature is the highest among the five conditions, reaching 1466 K.
(2) The grate speed is 7.9 m/h in condition 2, which is close to the benchmark condition. Reducing feeding and increasing primary air can also make MSWs burn fully. On the one hand, reduced feeding decreases bed thickness, and increasing the primary air properly is more conducive to combustion. This makes the solid temperature higher than the benchmark condition.
(3) The maximum solid temperature is only 1120 K in condition 5. The increased grate speed directly results in incomplete combustion of MSWs.
(4) Compared with condition 1, condition 3 increases the grate speed and primary air, which results in a 160 K drop in the solid temperature. This phenomenon shows that the grate speed and primary air volume cannot be increased simultaneously.
(5) Compared with condition 4 and condition 3, the solid temperature decreases by 60 K, and there will be more unburned CmHm by comparing conditions 3 and 4. This phenomenon shows that increasing the ratio of feeding to primary air is not conducive to combustion.

4.3. Results and Discussion of Non-Manipulated Variables in Single-Factor Analysis

Non-manipulated variables in the simulation model also affect the results. Single-factor analysis should be performed to explore the law of these parameters affecting solid-phase combustion.

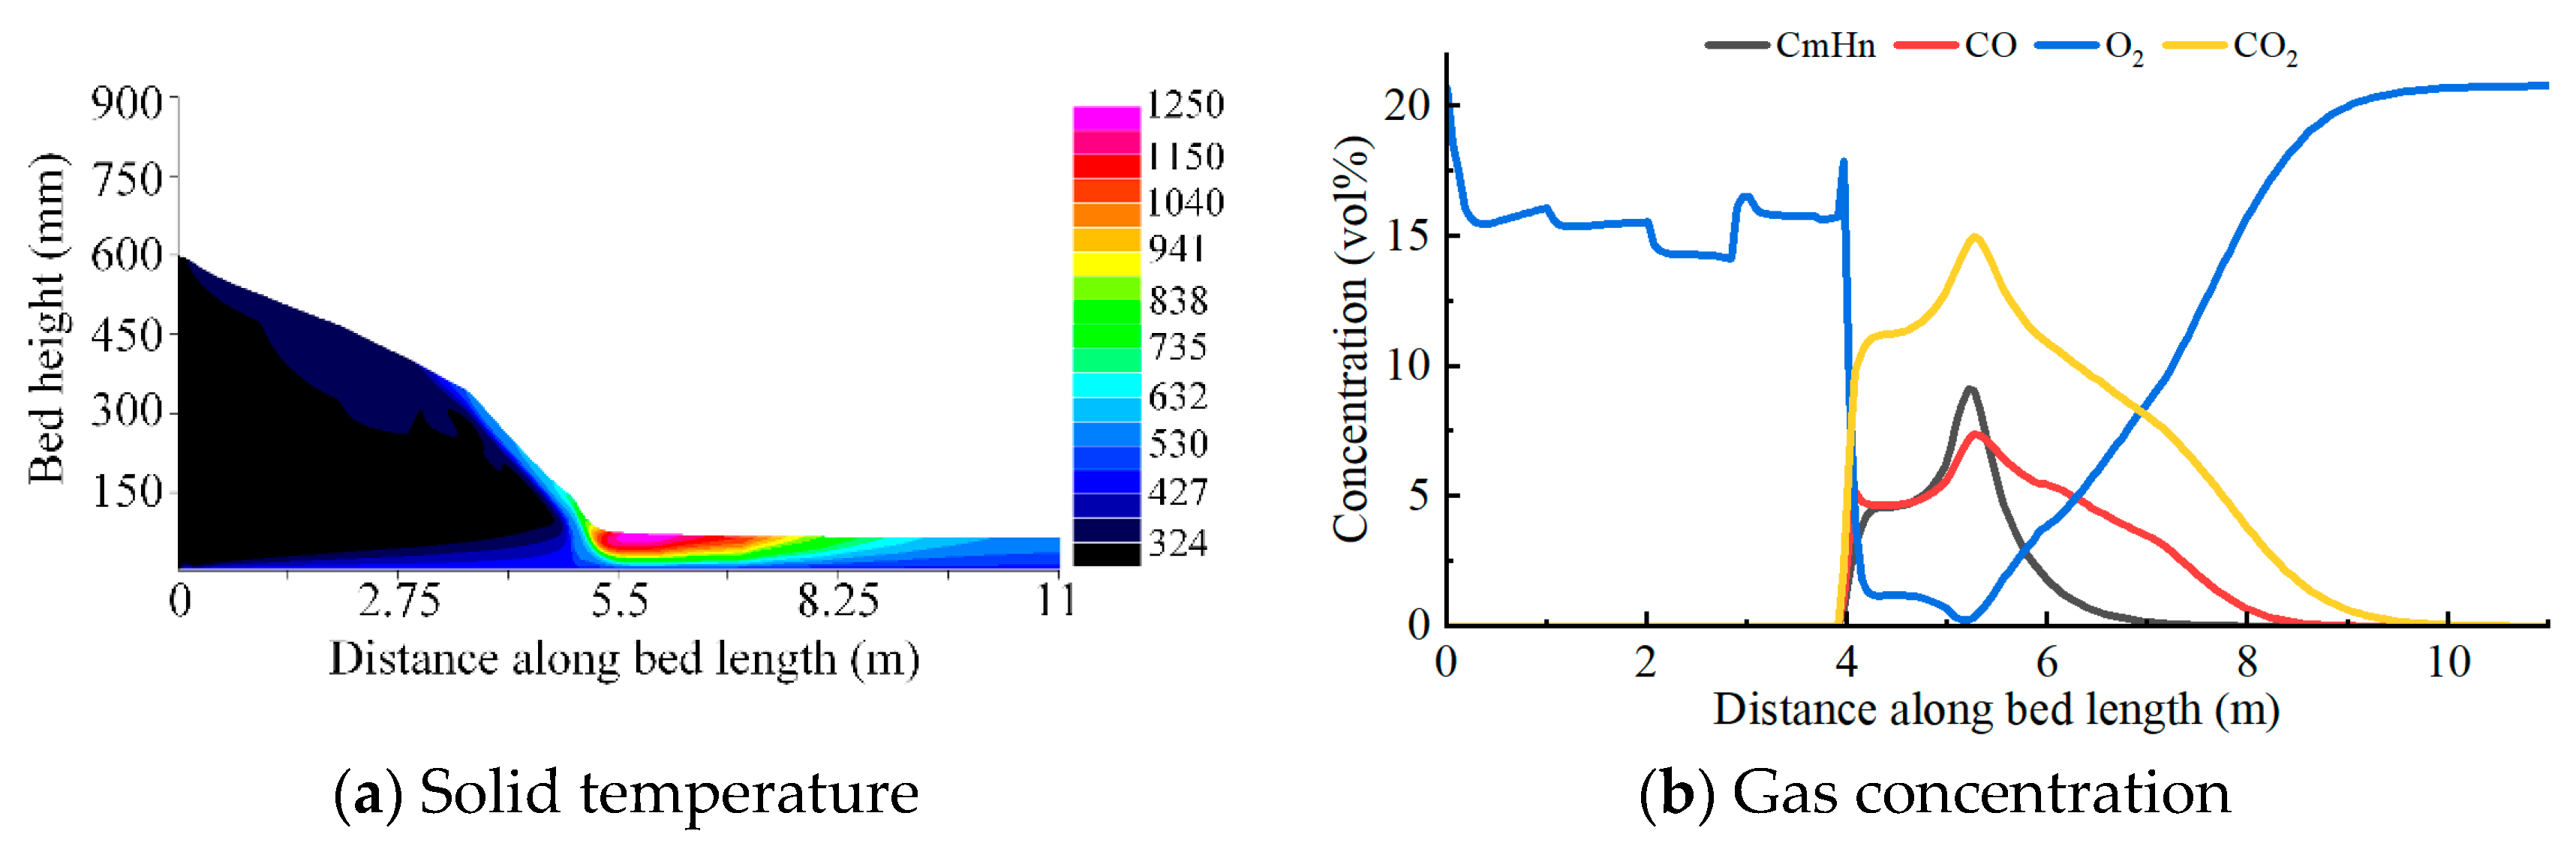
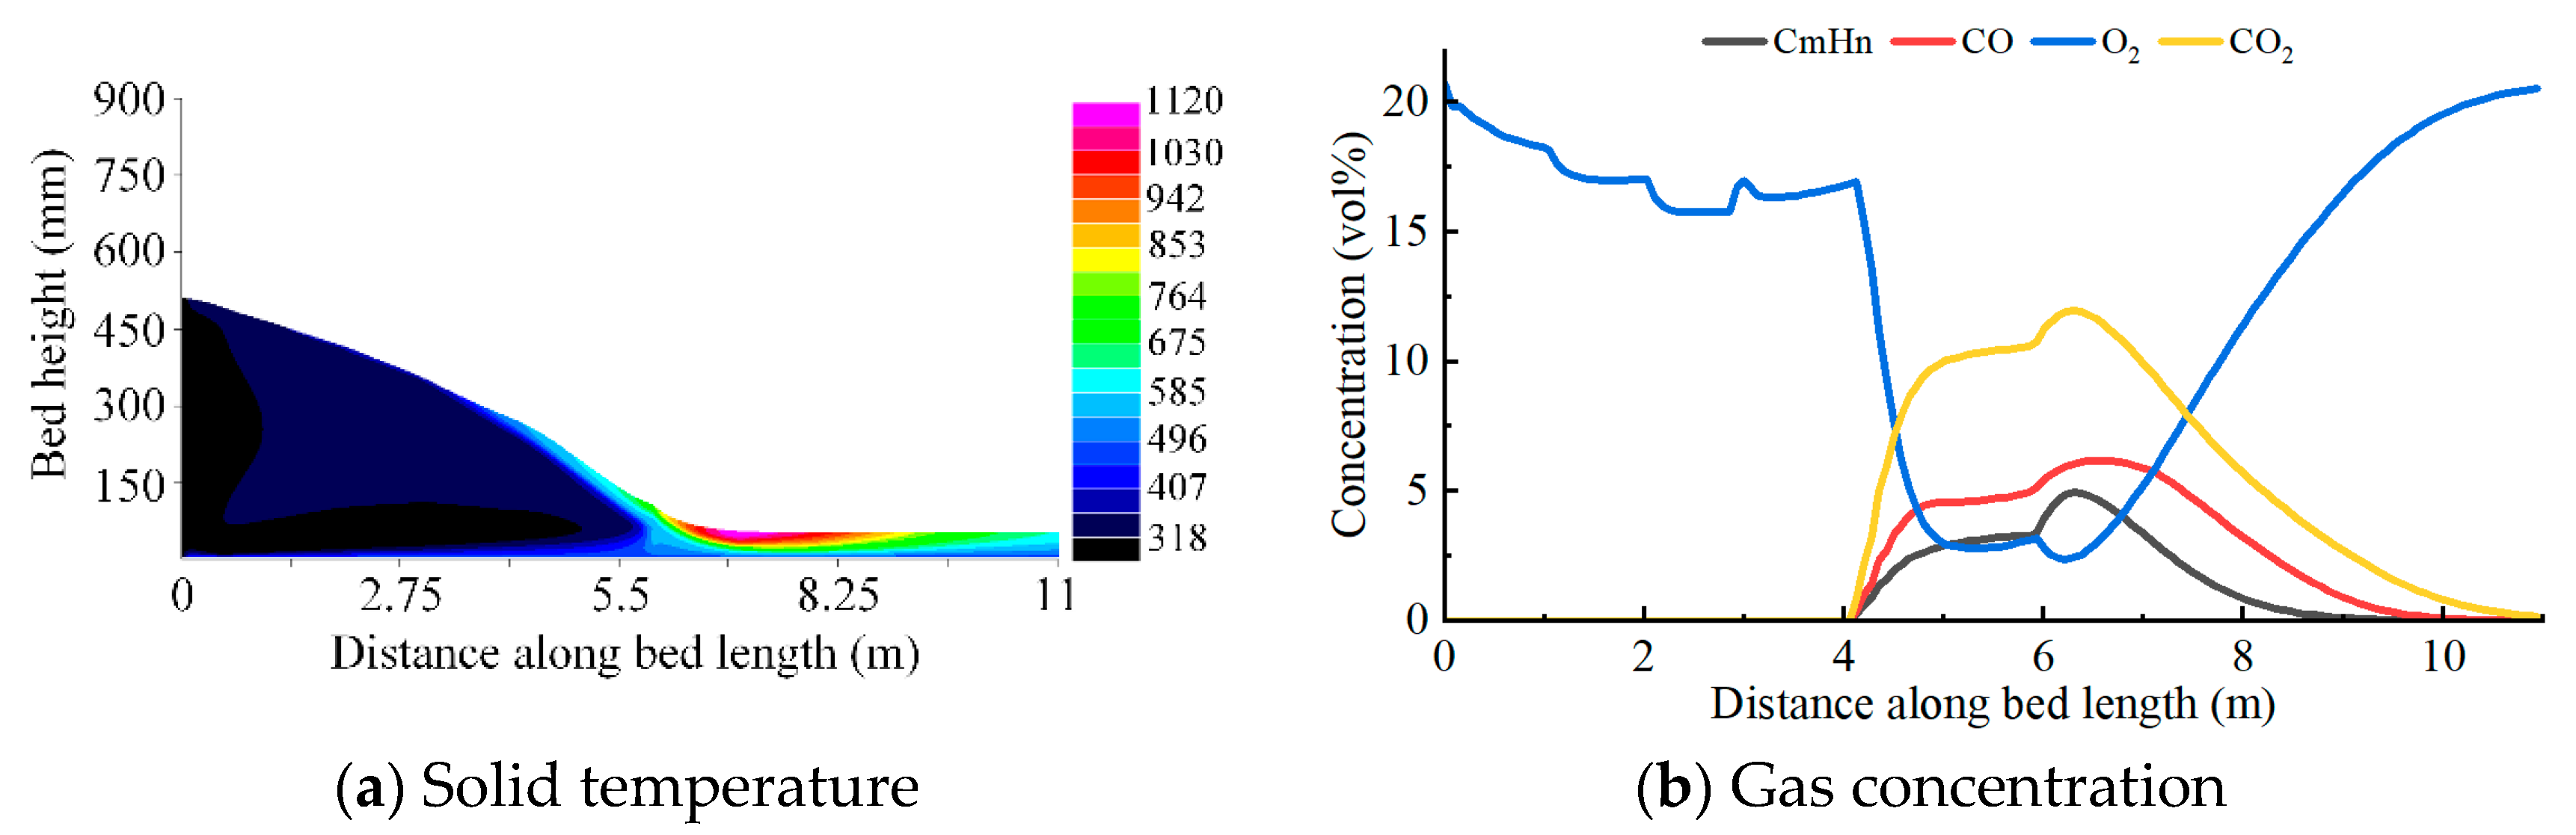
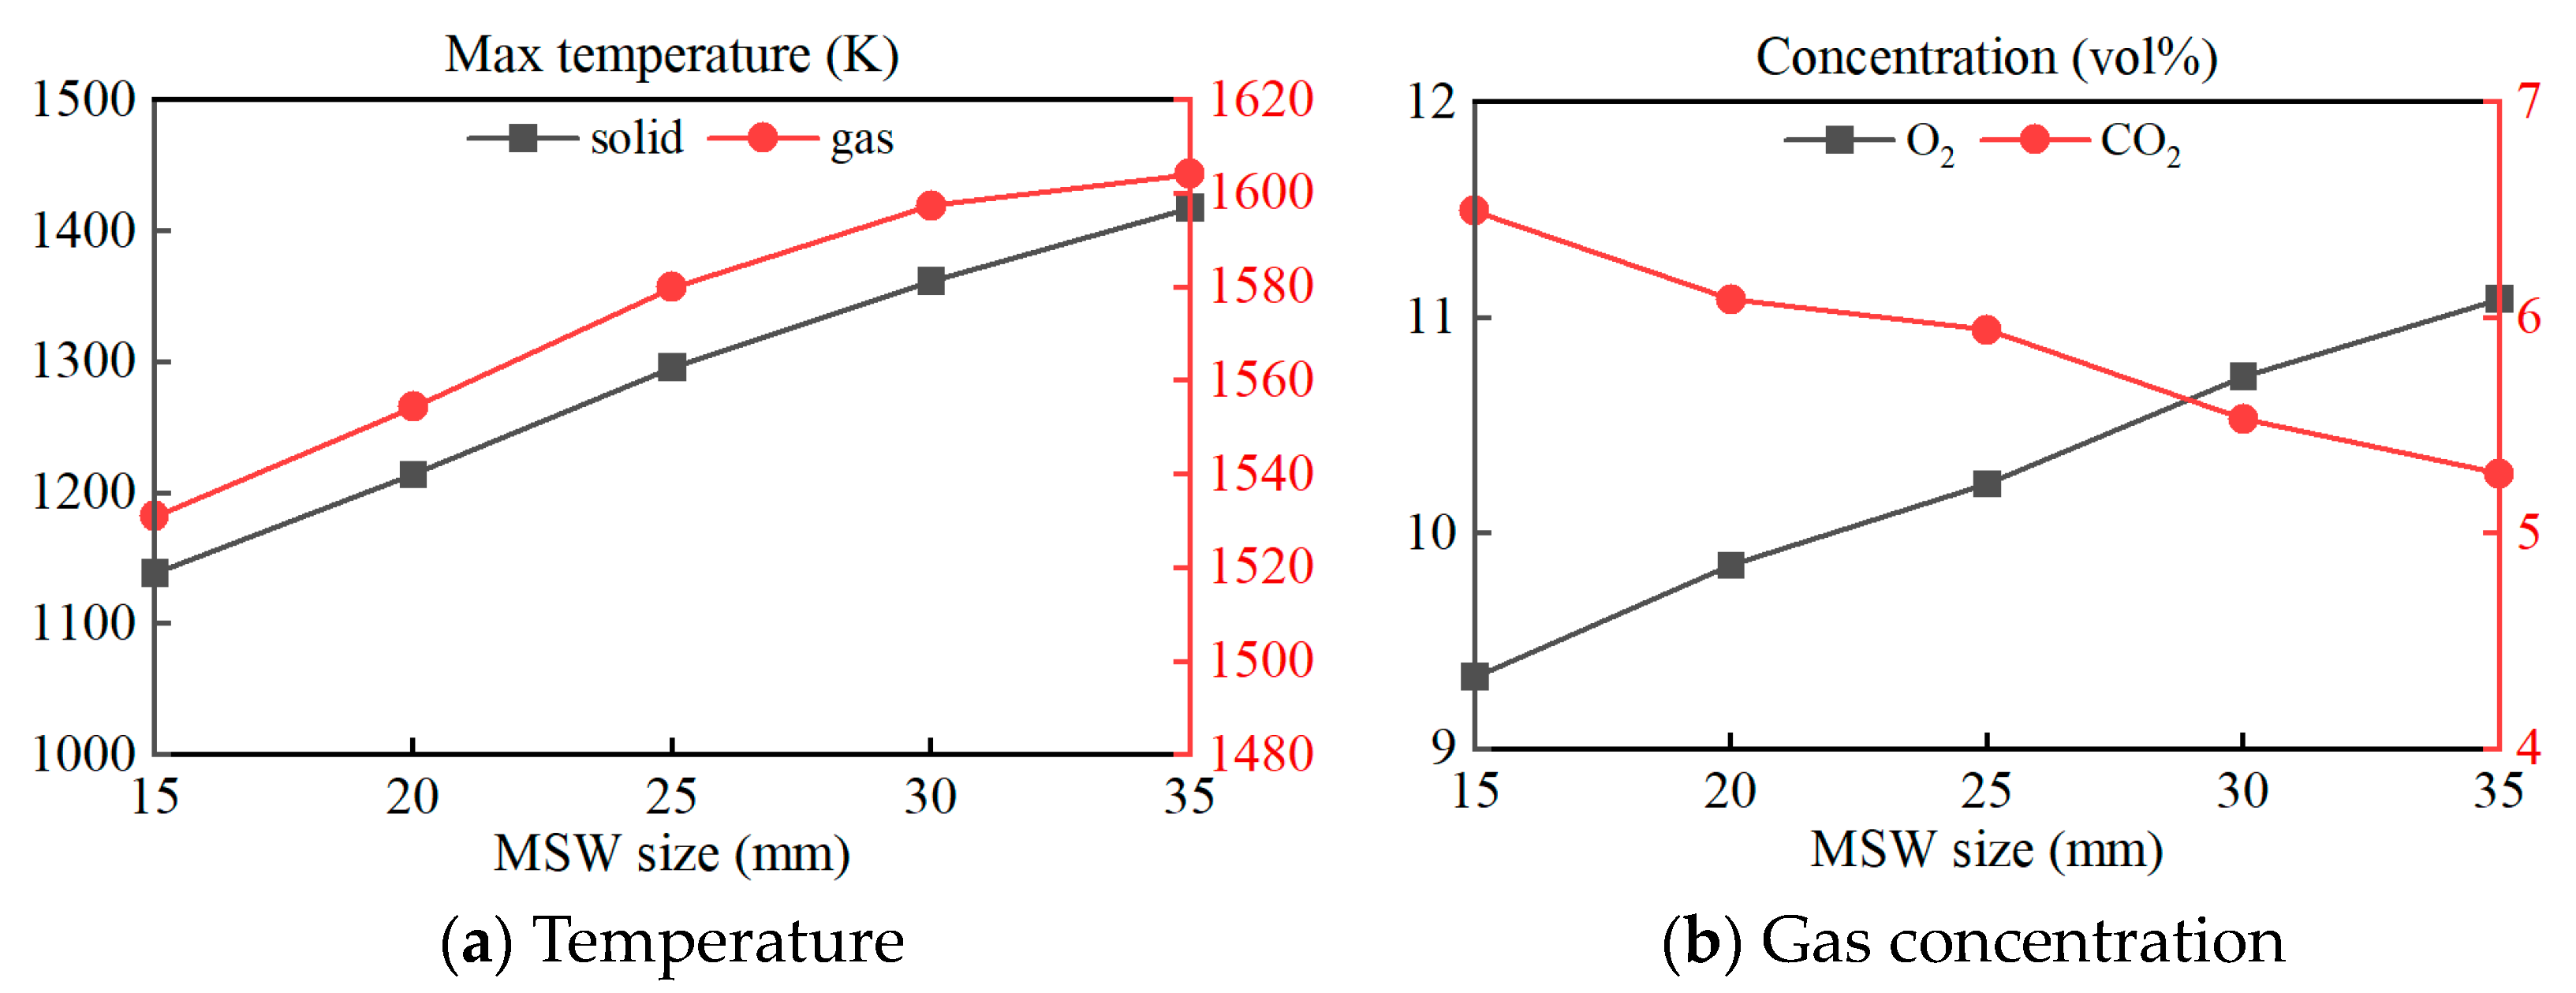
4.3.1. MSW Particle Size

The simulation assumes that MSWs are spherical particles. Figure 13 shows the influence of MSW particle size on solid-phase combustion.
The solid temperature and gas temperature increase with the increased MSW particle size (Figure 13). When the particle size is 35 mm, the solid temperature is 1417 K, and the gas temperature is 1604 K. Large-sized particles are more conducive to combustion, which is consistent with Ref. [13]. The accumulation of large-sized MSW particles produces more gaps, which makes it easy for primary air to enter. Furthermore, full contact between MSWs and primary air is beneficial to combustion, which leads to decreased O2 and increased CO2.

4.3.2. Particle Mixing Coefficient
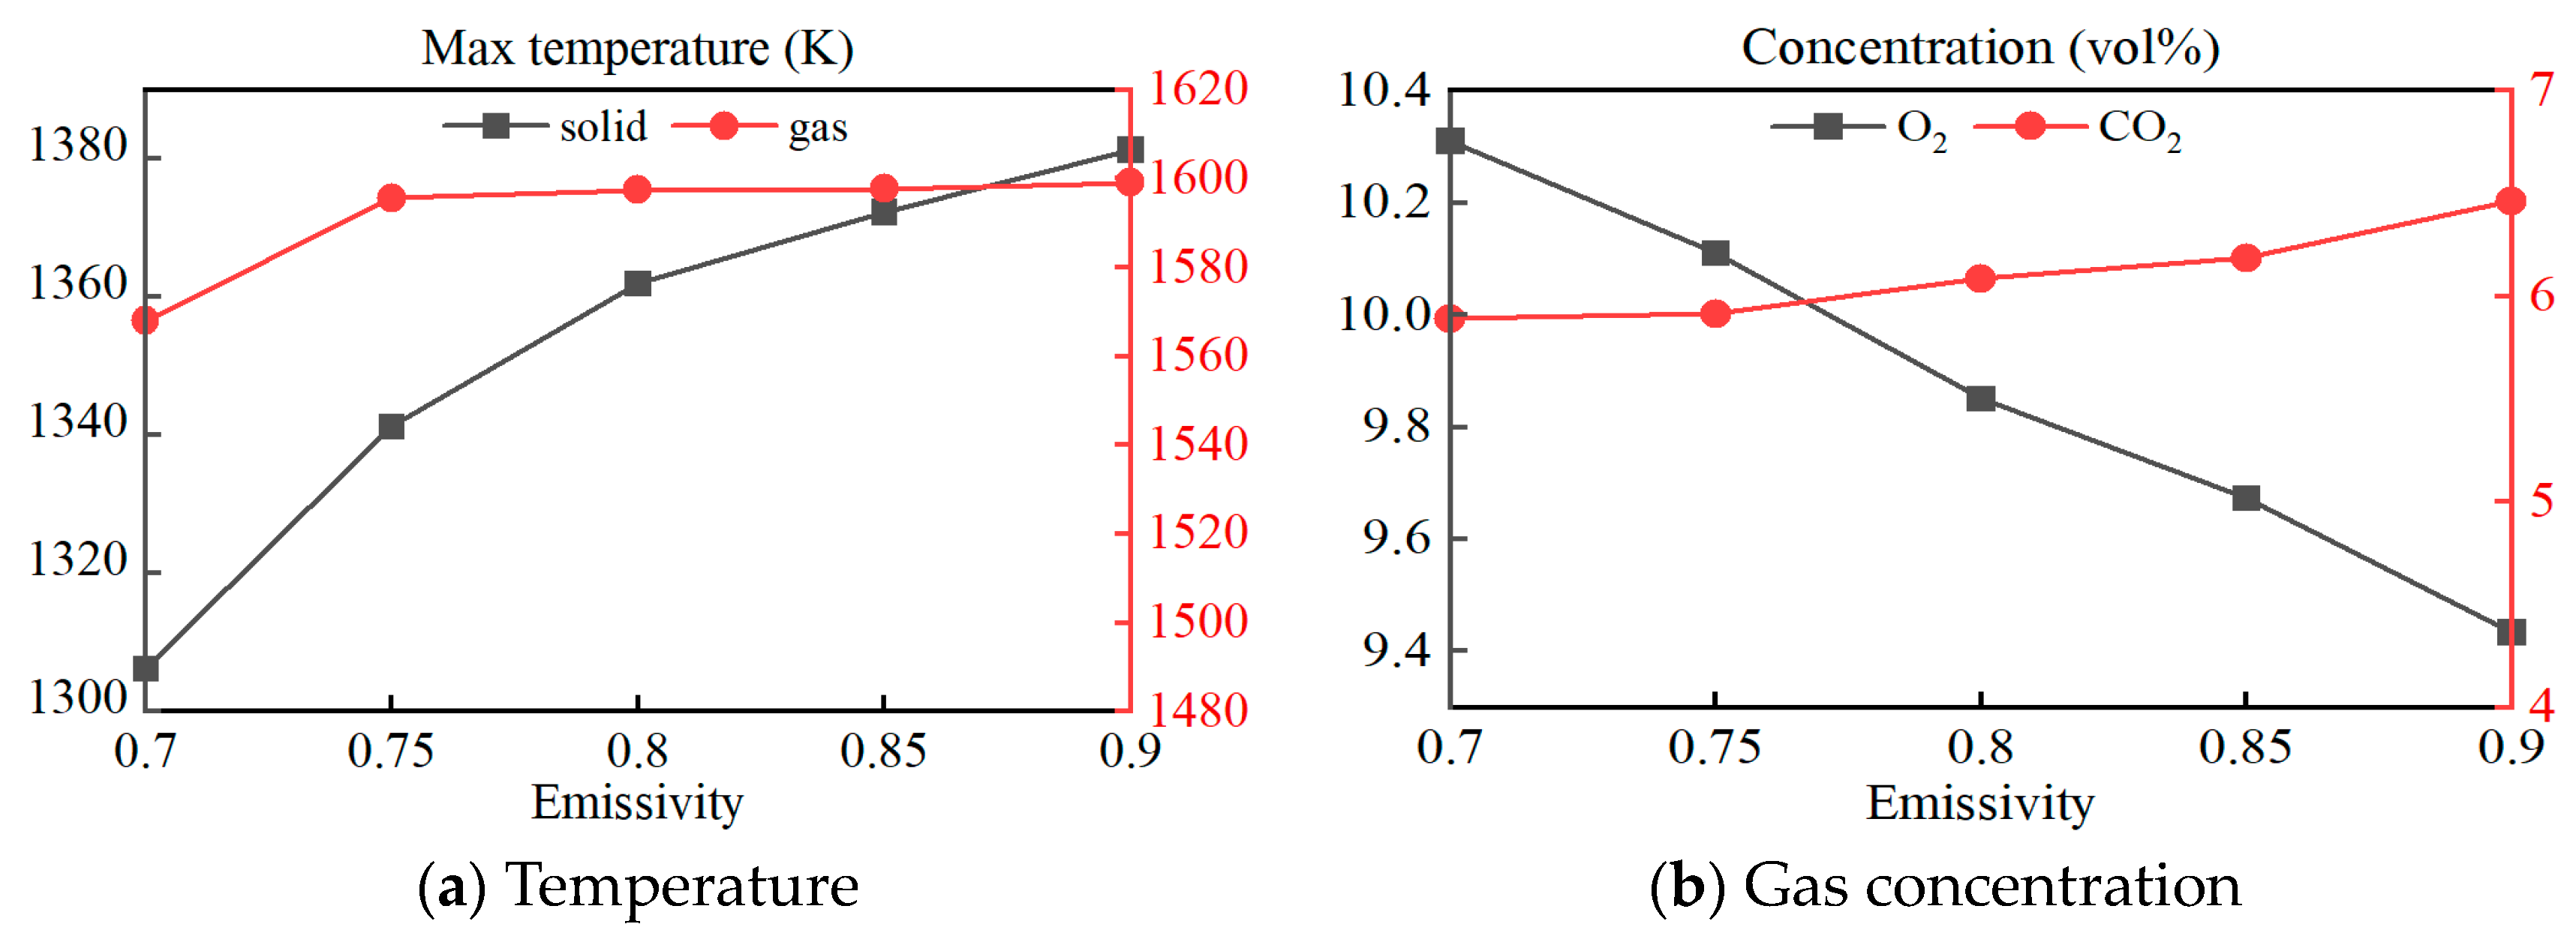
The intensity of particle mixing depends on the designed grate-moving frequency. Figure 14 shows the influence of the particle mixing coefficient on solid-phase combustion.
When the particle mixing coefficient increases, there is a decreased solid temperature and gas temperature, increased O2 concentration, and decreased CO2 concentration (Figure 14). A high mixing coefficient can result in short-term and intense combustion; however, our experimental findings indicate that temperature and CO2 do not exhibit violent combustion [25]. The particle mixing coefficient may be highly mixing under our grate design, and it is possible to over-mix with the continuous increase.

4.3.3. Emissivity

Emissivity reflects the ability of the material to radiate energy, and Figure 15 presents its influence on solid-phase combustion.
The solid and gas temperatures gradually increase with increased emissivity (Figure 15). The O2 concentration decreases gradually with increased CO2 concentration. The flame and the wall mainly radiate to the solid, with a minimum effect on the gas temperature. The violent combustion of solids increases CO2 due to strong radiation. In a word, the simulation should choose appropriate emissivity according to the furnace structure, furnace material, and actual combustion conditions.

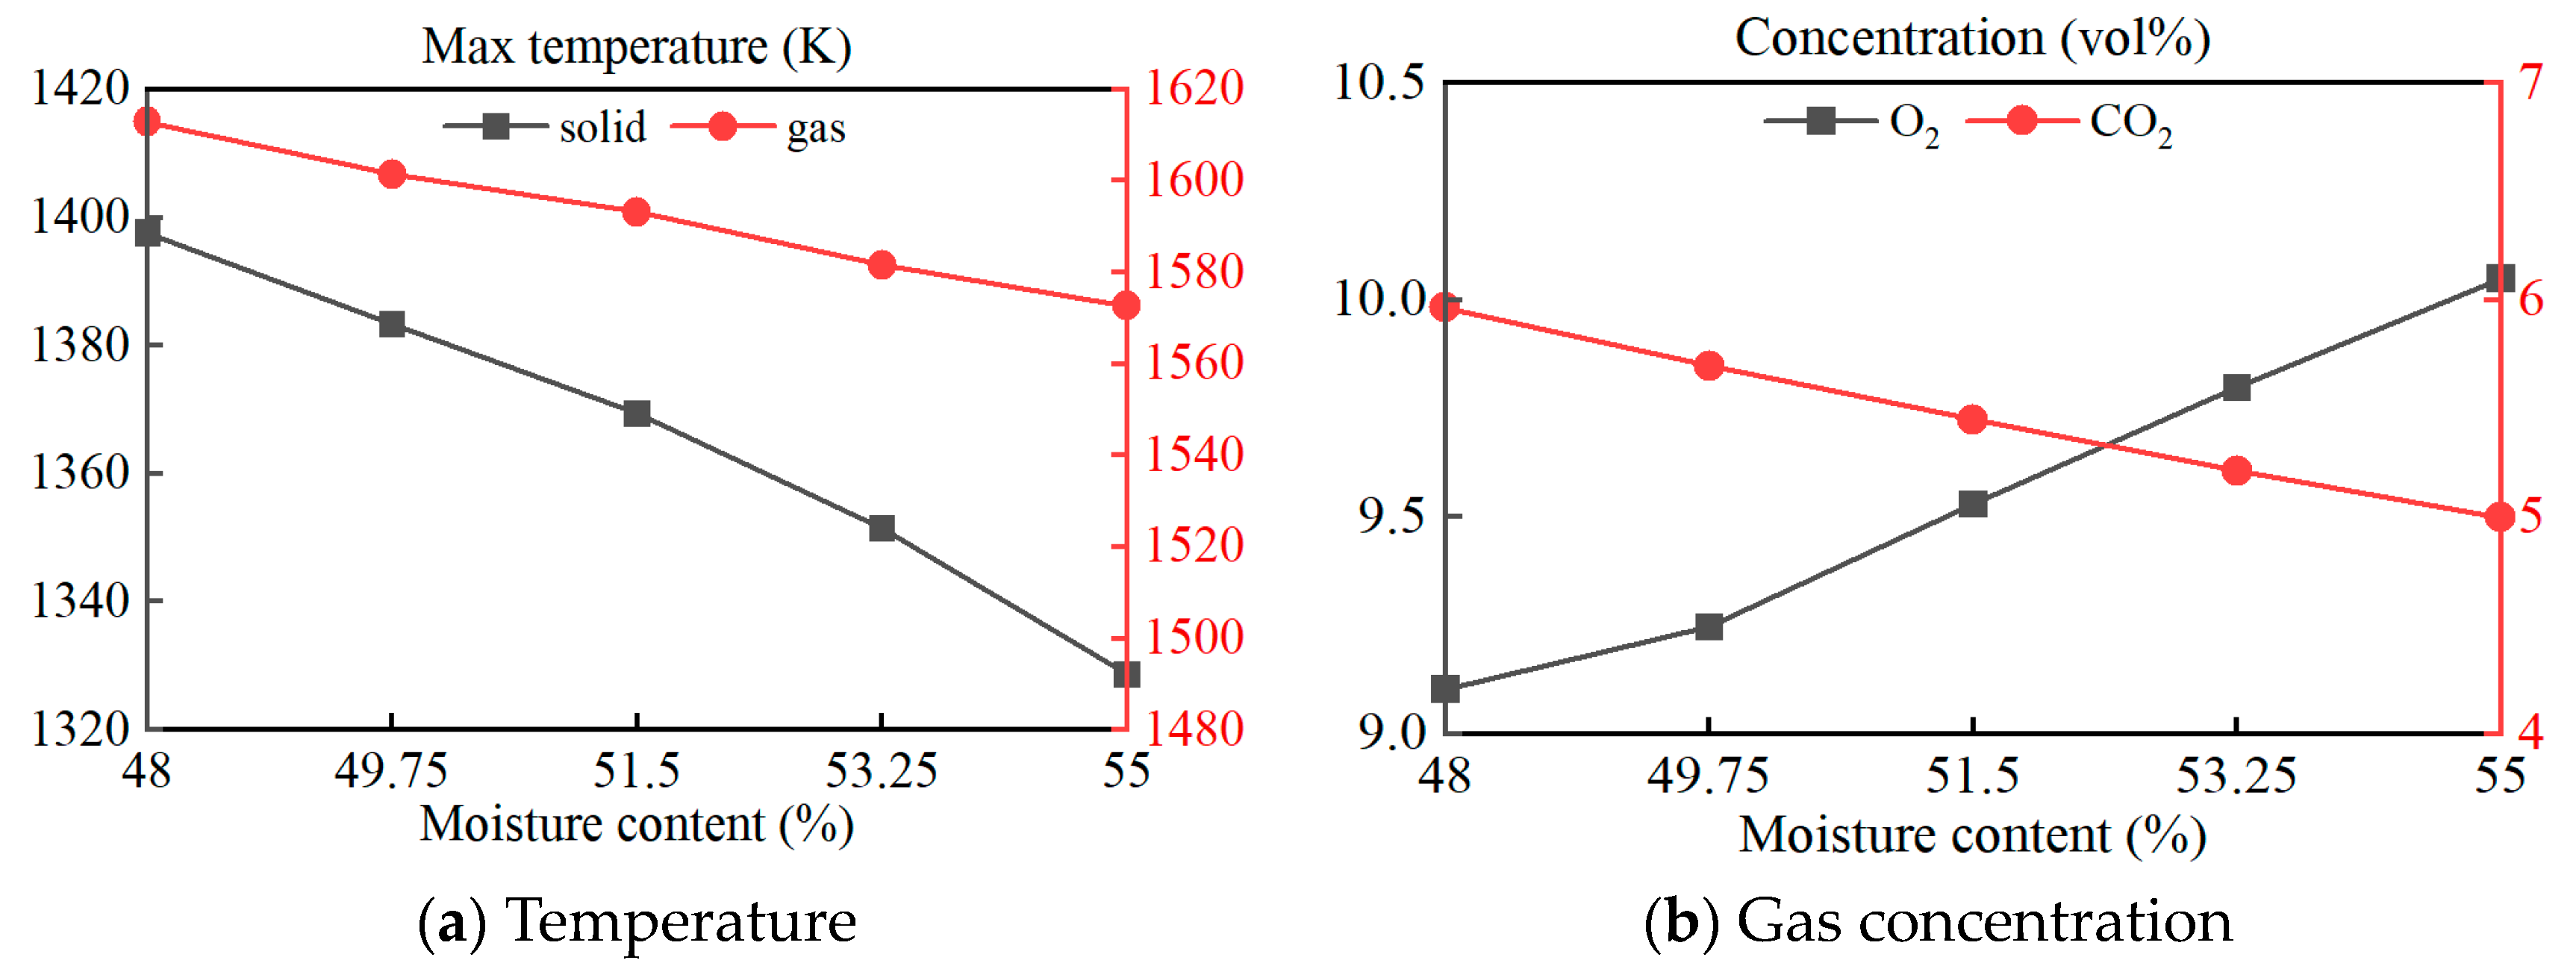
4.3.4. Moisture content

Figure 16 shows the influence of moisture content on solid-phase combustion.
The temperatures of solids and gases gradually decrease with increased moisture content (Figure 16), which is similar to the experimental curves in Refs. [26,30]. Moisture content is not conducive to MSW combustion. Insufficient combustion produces less CO2, with increasing O2 content. Therefore, it is necessary to ferment and dehydrate in the MSWI process to ensure that it can reach a low calorific value.

4.3.5. C:O Ratio

Figure 17 shows the influence of the C:O ratio on solid-phase combustion.
The C:O ratio has the minimum influence on the temperature (Figure 17). However, the CO2 concentration is directly proportional to C, and the O2 concentration is directly proportional to O. According to the compositions of MSWs, the proportion of elements in MSWs in the actual field is different, while C and O do not change widely in the work. Therefore, the influence on the results is limited.

4.4. Comprehensive Analysis

The benchmark operating condition demonstrates the combustion state in the furnace of the MSWI plant during stable operation, which serves as a reference for analyzing various operating parameters individually. Multi-operating conditions reflect the influences of different manipulated variables, indicating possible combustion changes. Therefore, based on the simulation model incorporating various operational modifications, it is feasible to adjust the manipulated variable using theoretical knowledge and empirical expertise to achieve a stable state of normal combustion.
Non-manipulated variables are uncontrollable from the operating action of the distributed control system. Among these non-manipulated variables, the particle size and mixing coefficient reflect the accumulation of garbage on the grate, and emissivity reflects the wall’s radiation ability. They affect the reaction results from a microscopic point of view. The moisture content and the C:O ratio reflect the differences in the MSWs of actual incineration, which affect the reaction results from the source of incineration. Thus, the understanding of non-manipulated variables is helpful for the subsequent optimal control in terms of low pollution emissions.

5. Conclusions

The solid-phase numerical model of the actual MSWI process was established using FLIC software. A method for generating multi-operating condition mechanism data of the MSWI process was proposed based on a double orthogonal numerical simulation experiment. The solid-phase combustion conditions in the furnace were analyzed under the benchmark operating condition and different multi-operating conditions. The effects of changes in the non-manipulated variables were studied.
(1) The maximum solid temperature was 1360 K, and the gas temperature was 1600 K in the main combustion zone under the benchmark operating condition of the studied MSWI plant. Water evaporation and volatile release were fast, and combustion ended before 10 m. O2 and CO2 were generated at 2.8–10 m at a high solid temperature. The condition of a low solid temperature did not achieve a good combustion effect.
(2) The mechanism data of multi-operating conditions fluctuated; for example, the maximum solid temperature ranged from 842 to 1467 K, and the maximum gas temperature ranged from 1177 to 1548 K. Mechanism data covered the incineration situation under different operating conditions, proving that it was correct to design multi-operating conditions based on the biorthogonal experiment method.
(3) Large-sized particles were more conducive to combustion for the studied non-manipulated variables. The particle mixing coefficient and emissivity should be selected according to the actual situation. However, a high moisture content was not conducive to combustion, and the C:O ratio had the minimum effect on combustion.
The studied solid-phase combustion model will be coupled with Aspen Plus. That is, the model inputs (feeding and primary air) and simulation results (temperature and gas concentration) will be input to Aspen Plus to simulate the whole MSWI process. Thus, the generated whole process data can provide theoretical support for the low-pollution-emission robust control of the MSWI process.

Author Contributions

Methodology, J.T.; Resources, B.G.; Data curation, T.W.; Writing—original draft, J.C.; Writing—review & editing, H.X. All authors have read and agreed to the published version of the manuscript.

Funding

This research received no external funding.

Institutional Review Board Statement

Not applicable.

Informed Consent Statement

Not applicable.

Data Availability Statement

The data presented in this study are available on request from the corresponding author.

Conflicts of Interest

The authors declare that they have no known competing financial interest or personal relationship that could have appeared to influence the work reported in this article.

References

  1. Tang, J.; Xia, H.; Yu, W.; Qian, J.F. Research status and prospects of intelligent optimization control for municipal solid waste incineration process. Acta Autom. Sin. 2023; accept. [Google Scholar] [CrossRef]
  2. Pham, T.P.T.; Kaushik, R.; Parshetti, G.K.; Mahmood, R.; Balasubramanian, R. Food waste-to-energy conversion technologies: Current status and future directions. Waste Manag. 2015, 38, 399–408. [Google Scholar] [CrossRef] [PubMed]
  3. Alao, M.A.; Popoola, O.M.; Ayodele, T.R. Waste-to-energy nexus: An overview of technologies and implementation for sustainable development. Clean. Energy Syst. 2022, 3, 100034. [Google Scholar] [CrossRef]
  4. Shin, D.; Choi, S. The combustion of simulated waste particles in a fixed bed. Combust. Flame 2000, 121, 167–180. [Google Scholar] [CrossRef]
  5. Goh, Y.R.; Yang, Y.B.; Zakaria, R.; Siddall, R.G.; Nasserzadeh, V.; Swithenbank, J. Development of an Incinerator Bed Model for Municipal Solid Waste Incineration. Combust. Sci. Technol. 2001, 162, 37–58. [Google Scholar] [CrossRef]
  6. Yang, Y.B.; Goh, Y.R.; Zakaria, R.; Nasserzadeh, V.; Swithenbank, J. Mathematical modelling of MSW incineration on a travelling bed. Waste Manag. 2002, 22, 369–380. [Google Scholar] [CrossRef] [PubMed]
  7. Yang, Y.B.; Newman, R.; Sharifi, V.; Swithenbank, J.; Aris, J. Mathematical modelling of straw combustion in a 38 MWe power plant furnace and effect of operating conditions. Fuel 2007, 86, 129–142. [Google Scholar] [CrossRef]
  8. Yu, Z.; Ma, X.; Liao, Y. Mathematical modeling of combustion in a grate-fired boiler burning straw and effect of operating conditions under air- and oxygen-enriched atmospheres. Renew. Energy 2010, 35, 895–903. [Google Scholar] [CrossRef]
  9. Ryu, C.; Yang, Y.B.; Nasserzadeh, V.; Swithenbank, J. Thermal reaction modeling of a large municipal solid waste incinerator. Combust. Sci. Technol. 2004, 176, 1891–1907. [Google Scholar] [CrossRef]
  10. Goddard, C.D.; Yang, Y.B.; Goodfellow, J.; Sharifi, V.N.; Swithenbank, J.; Chartier, J.; Mouquet, D.; Kirkman, R.; Barlow, D.; Moseley, S. Optimisation study of a large waste-to-energy plant using computational modelling and experimental measurements. J. Energy Inst. 2005, 78, 106–116. [Google Scholar] [CrossRef]
  11. Ismail, T.M.; Abd EL-Salam, M.; El-Kady, M.A.; El-Haggar, S.M. Three dimensional model of transport and chemical late phenomena on a MSW incinerator. Int. J. Therm. Sci. 2014, 77, 139–157. [Google Scholar] [CrossRef]
  12. Yang, Y.B.; Lim, C.N.; Goodfellow, J.; Sharifi, V.N.; Swithenbank, J. A diffusion model for particle mixing in a packed bed of burning solids. Fuel 2005, 84, 213–225. [Google Scholar] [CrossRef]
  13. Yang, Y.B.; Ryu, C.; Khor, A.; Sharifi, V.N.; Swithenbank, J. Fuel size effect on pinewood combustion in a packed bed. Fuel 2005, 84, 2026–2038. [Google Scholar] [CrossRef]
  14. Yang, Y.B.; Yamauchi, H.; Nasserzadeh, V.; Swithenbank, J. Effects of fuel devolatilisation on the combustion of wood chips and incineration of simulated municipal solid wastes in a packed bed. Fuel 2003, 82, 2205–2221. [Google Scholar] [CrossRef]
  15. Yang, Y.B.; Sharifi, V.N.; Swithenbank, J. Effect of air flow rate and fuel moisture on the burning behaviours of biomass and simulated municipal solid wastes in packed beds. Fuel 2004, 83, 1553–1562. [Google Scholar] [CrossRef]
  16. Yan, M.; Tian, X.; Antoni; Yu, C.; Zhou, Z.; Hantoko, D.; Kanchanatip, E.; Khan, M.S. Influence of multi-temperature primary air on the characteristics of MSW combustion in a moving grate incinerator. J. Environ. Chem. Eng. 2021, 9, 106690. [Google Scholar] [CrossRef]
  17. Yan, M.; Antoni; Wang, J.; Hantoko, D.; Kanchanatip, E. Numerical investigation of MSW combustion influenced by air preheating in a full-scale moving grate incinerator. Fuel 2021, 285, 119193. [Google Scholar] [CrossRef]
  18. Aliman, I.; Pasek, A.D. The evaluation of experimental and numerical study of combustion process on mini traveling chain grate furnace (incinerator) by computational fluid dynamics method. In Proceedings of the International Conference on Thermal Science & Technology, Helsinki, Finland, 19–20 July 2018. [Google Scholar]
  19. Liang, Z.; Ma, X. Mathematical modeling of MSW combustion and SNCR in a full-scale municipal incinerator and effects of grate speed and oxygen-enriched atmospheres on operating conditions. Waste Manag. 2010, 30, 2520–2529. [Google Scholar] [CrossRef]
  20. Hu, Z.; Jiang, E.; Ma, X. Numerical simulation on NOx emissions in a municipal solid waste incinerator. J. Clean. Prod. 2019, 233, 650–664. [Google Scholar] [CrossRef]
  21. Lin, T.; Liao, Y.; Dai, T.; Ma, X. Investigation on co-disposal technology of sludge and municipal solid waste based on numerical simulation. Fuel 2023, 343, 127882. [Google Scholar] [CrossRef]
  22. Chen, J.; Tang, J.; Xia, H.; Yu, W.; Qiao, J. Modelling the furnace temperature field of a municipal solid waste incinerator using the numerical simulation and the deep forest regression algorithm. Fuel 2023, 347, 128511. [Google Scholar] [CrossRef]
  23. Gu, T.; Yin, C.; Ma, W.; Chen, G. Municipal solid waste incineration in a packed bed: A comprehensive modeling study with experimental validation. Appl. Energy 2019, 247, 127–139. [Google Scholar] [CrossRef]
  24. Sun, R.; Ismail, T.M.; Ren, X.; El-Salam, M.A. Influence of simulated MSW sizes on the combustion process in a fixed bed: CFD and experimental approaches. Waste Manag. 2016, 49, 272–286. [Google Scholar] [CrossRef] [PubMed]
  25. Yang, Y.B.; Swithenbank, J. Mathematical modelling of particle mixing effect on the combustion of municipal solid wastes in a packed-bed furnace. Waste Manag 2008, 28, 1290–1300. [Google Scholar] [CrossRef] [PubMed]
  26. Sun, R.; Ismail, T.M.; Ren, X.; El-Salam, M.A. Numerical and experimental studies on effects of moisture content on combustion characteristics of simulated municipal solid wastes in a fixed bed. Waste Manag. 2015, 39, 166–178. [Google Scholar] [CrossRef] [PubMed]
  27. Meng, H.; Li, Y.-F.; Zhang, C. Modeling of discharge voltage for lithium-ion batteries through orthogonal experiments at subzero environment. J. Energy Storage 2022, 52, 105058. [Google Scholar] [CrossRef]
  28. Zhuang, J.; Tang, J.; Aljerf, L. Comprehensive review on mechanism analysis and numerical simulation of municipal solid waste incineration process based on mechanical grate. Fuel 2022, 320, 123826. [Google Scholar] [CrossRef]
  29. Yang, Y.B.; Sharifi, V.N.; Swithenbank, J. Converting moving-grate incineration from combustion to gasification—Numerical simulation of the burning characteristics. Waste Manag. 2007, 27, 645–655. [Google Scholar] [CrossRef]
  30. Yang, Y.B.; Sharifi, V.N.; Swithenbank, J. Numerical simulation of Municipal Solid Waste incineration in a moving-grate furnace and the effect of waste moisture content. Prog. Comput. Fluid Dyn. Int. J. 2007, 7, 261–273. [Google Scholar] [CrossRef]
  31. Arthur, J.R. Reactions between carbon and oxygen. Trans. Faraday Soc. 1951, 47, 164–178. [Google Scholar] [CrossRef]
  32. Yang, Y.B.; Goodfellow, J.; Sharifi, V.N.; Swithenbank, J. Investigation of biomass combustion systems using CFD techniques: A parametric study of packed-bed burning characteristics. Prog. Comput. Fluid Dyn. 2006, 6, 262–271. [Google Scholar] [CrossRef]
  33. Fernando, N.; Narayana, M. A comprehensive two dimensional Computational Fluid Dynamics model for an updraft biomass gasifier. Renew. Energy 2016, 99, 698–710. [Google Scholar] [CrossRef]
  34. Smoot, L.D.; Pratt, D.T. Pulverized-Coal Combustion and Gasification; Springer: Berlin/Heidelberg, Germany, 1979. [Google Scholar]
Figure 1. Process flow of an MSWI plant in Beijing.
Sustainability 15 14159 g001
Figure 2. Combustion process and changes in MSW particles.
Sustainability 15 14159 g002
Figure 3. Relationship among oxygen, temperature, and grate movements.
Sustainability 15 14159 g003
Figure 4. Orthogonal experimental method based on double coupling.
Sustainability 15 14159 g004
Figure 5. Benchmark operating condition.
Sustainability 15 14159 g005
Figure 6. Maximum temperature under multi-operating conditions.
Sustainability 15 14159 g006
Figure 7. Gas concentration under multi-operating conditions.
Sustainability 15 14159 g007
Figure 8. Condition 1.
Sustainability 15 14159 g008
Figure 9. Condition 2.
Sustainability 15 14159 g009
Figure 10. Condition 3.
Sustainability 15 14159 g010
Figure 11. Condition 4.
Sustainability 15 14159 g011
Figure 12. Condition 5.
Sustainability 15 14159 g012
Figure 13. Effect of MSW particle size on solid-phase combustion.
Sustainability 15 14159 g013
Figure 14. Effect of the particle mixing coefficient on solid-phase combustion.
Sustainability 15 14159 g014
Figure 15. Effect of emissivity on solid-phase combustion.
Sustainability 15 14159 g015
Figure 16. Effect of moisture content on solid-phase combustion.
Sustainability 15 14159 g016
Figure 17. Effect of the C:O ratio on solid-phase combustion.
Sustainability 15 14159 g017
Table 1. MSW properties.
Proximate
(as a Received Basis, wt%)
Ultimate
(as a Dry Ash-Free Basis, wt%)
Moisture48C65.2
Volatile matter33.31H8.09
Fixed carbon;8.08O24.93
Ash10.61N1.12
S0.24
Table 2. Specifications and operating parameters of incinerators.
ParameterValue
Capacity, t/d628.8
Type of grateReciprocating grate
Grate length × width, m11 × 12.9
Grate speed, m/h8
Primary airflow, Nm3/h67,500
Air temperature, °C200
Air distribution, %24.31, 43.35, 19.27, and 13.07
Table 3. Orthogonal experiment settings in the first stage.
FactorLevel Value
Manipulated variablesFeeding, m/h7, 7.5, 8, 8.5, and 9
Grate speed, t/h24.2, 24.7, 25.2, 25.7, and 26.2
Primary air in drying, Nm3/min268, 274, 280, 286, and 292
Primary air in burning 1, Nm3/min477, 488, 499, 510, and 521
Primary air in burning 2, Nm3/min211, 216, 221, 226, and 231
Primary air in burnout, Nm3/min144, 147, 150, 153, and 156
Non-manipulated variablesParticle size, mm15, 20, 25, 30, and 35
Particle mixing coefficient2 × 10−6, 3 × 10⁻⁶, 4 × 10⁻⁶, 5 × 10⁻⁶, and 6 × 10⁻⁶
Moisture content, %48, 49.75, 51.5, 53.25, and 55
C:O (58:33), (59:32), (60:31), (61:30), and (62:29)
Table 4. Orthogonal experiment settings in the second stage.
FactorLevel ValueFactorLevel Value
Grate speed, m/h6.6, 6.7, 6.8, 6.9, and 7Feeding, t/h24.2, 24.3, 24.4, 24.5, and 24.6
7.1, 7.2, 7.3, 7.4, and 7.524.7, 27.8, 24.9, 25, and 25.1
7.6, 7.7,7.8, 7.9, and 825.2, 25.3, 25.4, 25.5, and 25.6
8.1, 8.2, 8.3, 8.4, and 8.525.7, 25.8, 25.9, 26, and 26.1
8.6, 8.7, 8.8, 8.9, and 926.2, 26.3, 26.4, 26.5, and 26.6
Primary air in drying, Nm3/min255, 256.8, 258.6, 260.4, and 262.2Primary air in burning 1, Nm3/min455, 458.2, 461.4, 464.6, and 467.8
264, 265.8, 267.6, 269.4, and 271.2471, 474.2, 477.4, 480.6, and 483.8
273, 274.8, 276.6, 278.4, and 280.2487, 490.2, 493.4, 496.6, and 499.8
282, 283.8, 285.6, 287.4, and 289.2503, 506.2, 509, 513, and 515.8
291, 292.8, 294.6, 296.4, and 298.2519, 522.2, 525.4, 528.6, and 531.8
Primary air in burning 2, Nm3/min203, 204.4, 205.8, 207.2, and 208.6Primary air in burnout, Nm3/min137, 138, 139, 140, and 141
210, 211.4, 212.8, 214.2, and 215.6142, 143,144, 145, and 146
217, 218.4, 219.8, 221.2, and 222.6147, 148, 149, 150, and 151
224, 225.4, 227, 228, and 229.6152, 153, 154, 155, and 156
231, 232.4, 233.8, 235.2, and 236.6157,158, 159, 160, and 161
Table 5. Multi-conditions parameters.
Feeding
t/d
Grate
m/h
Primary Air
Nm3/min
Condition benchmark 26.281125
Condition 124.371069.6
Condition 2257.91140.8
Condition 324.37.41139.8
Condition 424.97.11126.4
Condition 525.291144
Disclaimer/Publisher’s Note: The statements, opinions and data contained in all publications are solely those of the individual author(s) and contributor(s) and not of MDPI and/or the editor(s). MDPI and/or the editor(s) disclaim responsibility for any injury to people or property resulting from any ideas, methods, instructions or products referred to in the content.

