Article

The Nitrate Fate Tool: A Decision Support System for the Assessment of the Groundwater Vulnerability to Nitrate in Support of Sustainable Development Goals

1
Institute for Mediterranean Agricultural and Forestry Systems (ISAFOM), National Research Council (CNR), Piazzale E. Fermi, 1, 80055 Portici, Italy
2
CRISP Research Center, University of Naples Federico II, Via Università, 100, 80055 Portici, Italy
3
Department of Agricultural and Environmental Sciences, University of Milan, Via Celoria, 2, 20133 Milan, Italy
4
Department of Agriculture, University of Napoli Federico II, Via Università, 100, 80055 Portici, Italy
5
EMM S.r.l., Via Vicinale S. Maria del Pianto snc Centro Polifunzionale INAIL Torre 5, 80143 Naples, Italy
*
Author to whom correspondence should be addressed.
Sustainability 2023, 15(19), 14164; https://doi.org/10.3390/su151914164
Submission received: 3 August 2023 / Revised: 4 September 2023 / Accepted: 6 September 2023 / Published: 25 September 2023

Abstract

:
This article introduces a new web-based and freely accessible tool, the Nitrate Fate tool (NFt), for the assessment of groundwater vulnerability to nitrate pollution in a variety of pedoclimatic conditions. The contamination of water resources by nitrate, in fact, represents a growing and persistent global environmental problem, and the utilization of practical tools to assist personnel working in the agricultural sector is key for mitigating the impact on land use, while maintaining farmers’ incomes. The (NFt) has been developed and integrated into the geospatial decision support system, LandSupport, as a way to support multiple stakeholders in conducting the so-called what-if scenario analysis (e.g., what would happen to the crop production if I substitute a quote of inorganic fertilizer with the same quote of an organic one?). The tool couples a state-of-art crop-growth model—which simulates crop growth dynamics, the nitrogen and carbon cycles—with a novel transfer function model in order to assess the transport of nitrate through the unsaturated zone to the groundwater table. Within the LandSupport platform, the results are shown both as coloured maps and as cumulative charts representing the travel times and the concentrations of root leachate to groundwater table depths. This work details the tool’s rationale, the coupling of the models, and their implementation. Moreover, this article shows examples of applications supporting several public authorities and end-users, underlining that, by combining all of the information on soils, groundwater table depths, management and climates, it is possible to obtain a comprehensive understanding of nitrogen transport dynamics. Two case studies are presented: the Piana del Sele and the eastern plain of Naples, both located in the Campania region of Italy. The results of the tool’s applications reveal significant groundwater vulnerability in both plains, mainly due to the shallow groundwater table depths, resulting in remarkably fast mean nitrate travel times ranging from 0 to 6 years. Finally, the tool provides a reproducible and replicable solution, and future implementation is foreseen for additional case studies all over the world.

1. Introduction

The contamination of surface water and groundwater by nitrate represents a growing and persistent global environmental problem [1,2]. The main source of nitrate is considered to be agricultural land use [3], besides civil, industrial and zootechnical sources. This problem has been recognized and was included in the 2030 Agenda for Sustainable Development, adopted by all United Nations Member States in 2015. Is is specifically addressed in the Sustainable Development Goal (SDG) 6, which aims to enhance water quality, particularly under target 6.3 (https://sdgs.un.org/goals/goal6, accessed on 7 September 2023).
In Europe, the European Nitrates Directive (ND; Directive 91/676/EEC; EU Commission, 1991) was promulgated more than 30 years ago, with one of its primary objectives being the reduction of nitrate leaching from agricultural sources by limiting the use of inorganic and organic fertilisers to crop requirements. Moreover, the ND mandates the identification of areas where the concentrations of nitrate in water exceed, or are likely to exceed, the levels set in the Directive, designated as Nitrate Vulnerable Zones (NVZs). The later Water Framework Directive (Directive 2000/60/EC) and Groundwater Directive (Directive 2006/118/EC) tried to overcome the poor implementation of the ND across Member States. Nevertheless, nitrate remains the primary pollutant in European groundwater resources, with agriculture as its primary source [4]. One of the reasons these directives have only partially reached their goals is the difficulties the Member States and territorial governing entities (e.g., environmental agencies, regions, etc.) face in transferring and effectively applying new knowledge, such as efficient fertiliser use, the impact of land use and on efficient water supply. In fact, if properly managed, agriculture is also capable of preserving and safeguarding the environment. A good example is represented by Denmark, where targeted guidance to farmers on efficient fertiliser use, primarily in terms of quantity, resulted in a substantial reduction of nitrate leaching (https://www.eea.europa.eu/archived/archived-content-water-topic/water-pollution/prevention-strategies/nitrate-directive, accessed on 7 September 2023).
Hence, the use of practical tools to support personnel working in the agricultural sector (e.g., public authorities, agricultural extensionists, advisers and farmers) is essential to mitigate the impact on land use while ensuring farmers’ incomes. In this context, the coupling of process-based models and operational tools within decision support systems (DSSs) represents a potent approach, especially for planning, accounting for the spatial variability of climate, morphology, soils, groundwater and agricultural practices. Due to their peculiar technical characteristics [5], the application of these tools has steadily increased over time [5,6,7].
This work presents the Nitrate Fate tool (NFt), which was incorporated into the LandSupport (LS) S-DSS H2020 project (www.landsupport.eu, accessed on 7 September 2023) to assess specific groundwater vulnerability to nitrate. For more detailed information on groundwater vulnerability assessment methods, interested readers can refer to Appendix A.
To ensure effectiveness, the NFt was designed with a sufficient scope to allow the end-user to run the what-if scenario analysis and explore the effect of multiple viable solutions for potential application in agricultural areas (e.g., what would happen to the crop production if I reduced the total amount of inorganic fertilizer by 10% and/or the irrigation amount?). This freely available web-based tool can be used to develop better spatial identification of NVZs across different European climates, soils and land uses. It meets multiple end-user needs with dynamic links to simulation models, eliminating the need for pre-loaded information or scenarios. Moreover, its implementation within the LS infrastructure makes it a flexible, reproducible and replicable solution that easily integrates with other solutions obtained by many other tools.
Examples of similar tools include the EU-Project MoNit [8], a simulation tool enabling nitrate load assessment by considering plot-scale conditions, socioeconomic aspects and macro-scale transport processes. The NGAUGE DSS [9] proposed to study the economic and environmental implications of changing N inputs to dairy farms within UK NVZs. The DEMETRA-DSS system designed for regional-level risk area identification, monitors physiochemical and biomolecular properties related to the nitrogen cycle, collects data and integrates them into a gesospatial database for the mapping and management of contamination sources [10].
Table 1 facilitates a quick comparison between the above-mentioned Nitrate DSS and the NFt, considering case studies, types, applied models and availability to end-users.
The novelties of the NFt are defined by its dynamic and real-time features, its web-based and freely available nature, in addition to its core, which is based on the coupling of two process-based crop-growth and nitrate transfer models.
The NFt overcomes the major limitations of Monit and NGAUGE, which are based on a static approach, as well as DEMETRA, which solely focuses on monitoring without considering the dynamic modelling of processes related to the N-cycle. All these features make it a unique instrument, flexible, replicable and accessible for several end-users, ranging from researchers to farmers to environmental agencies, across diverse spatial contexts.

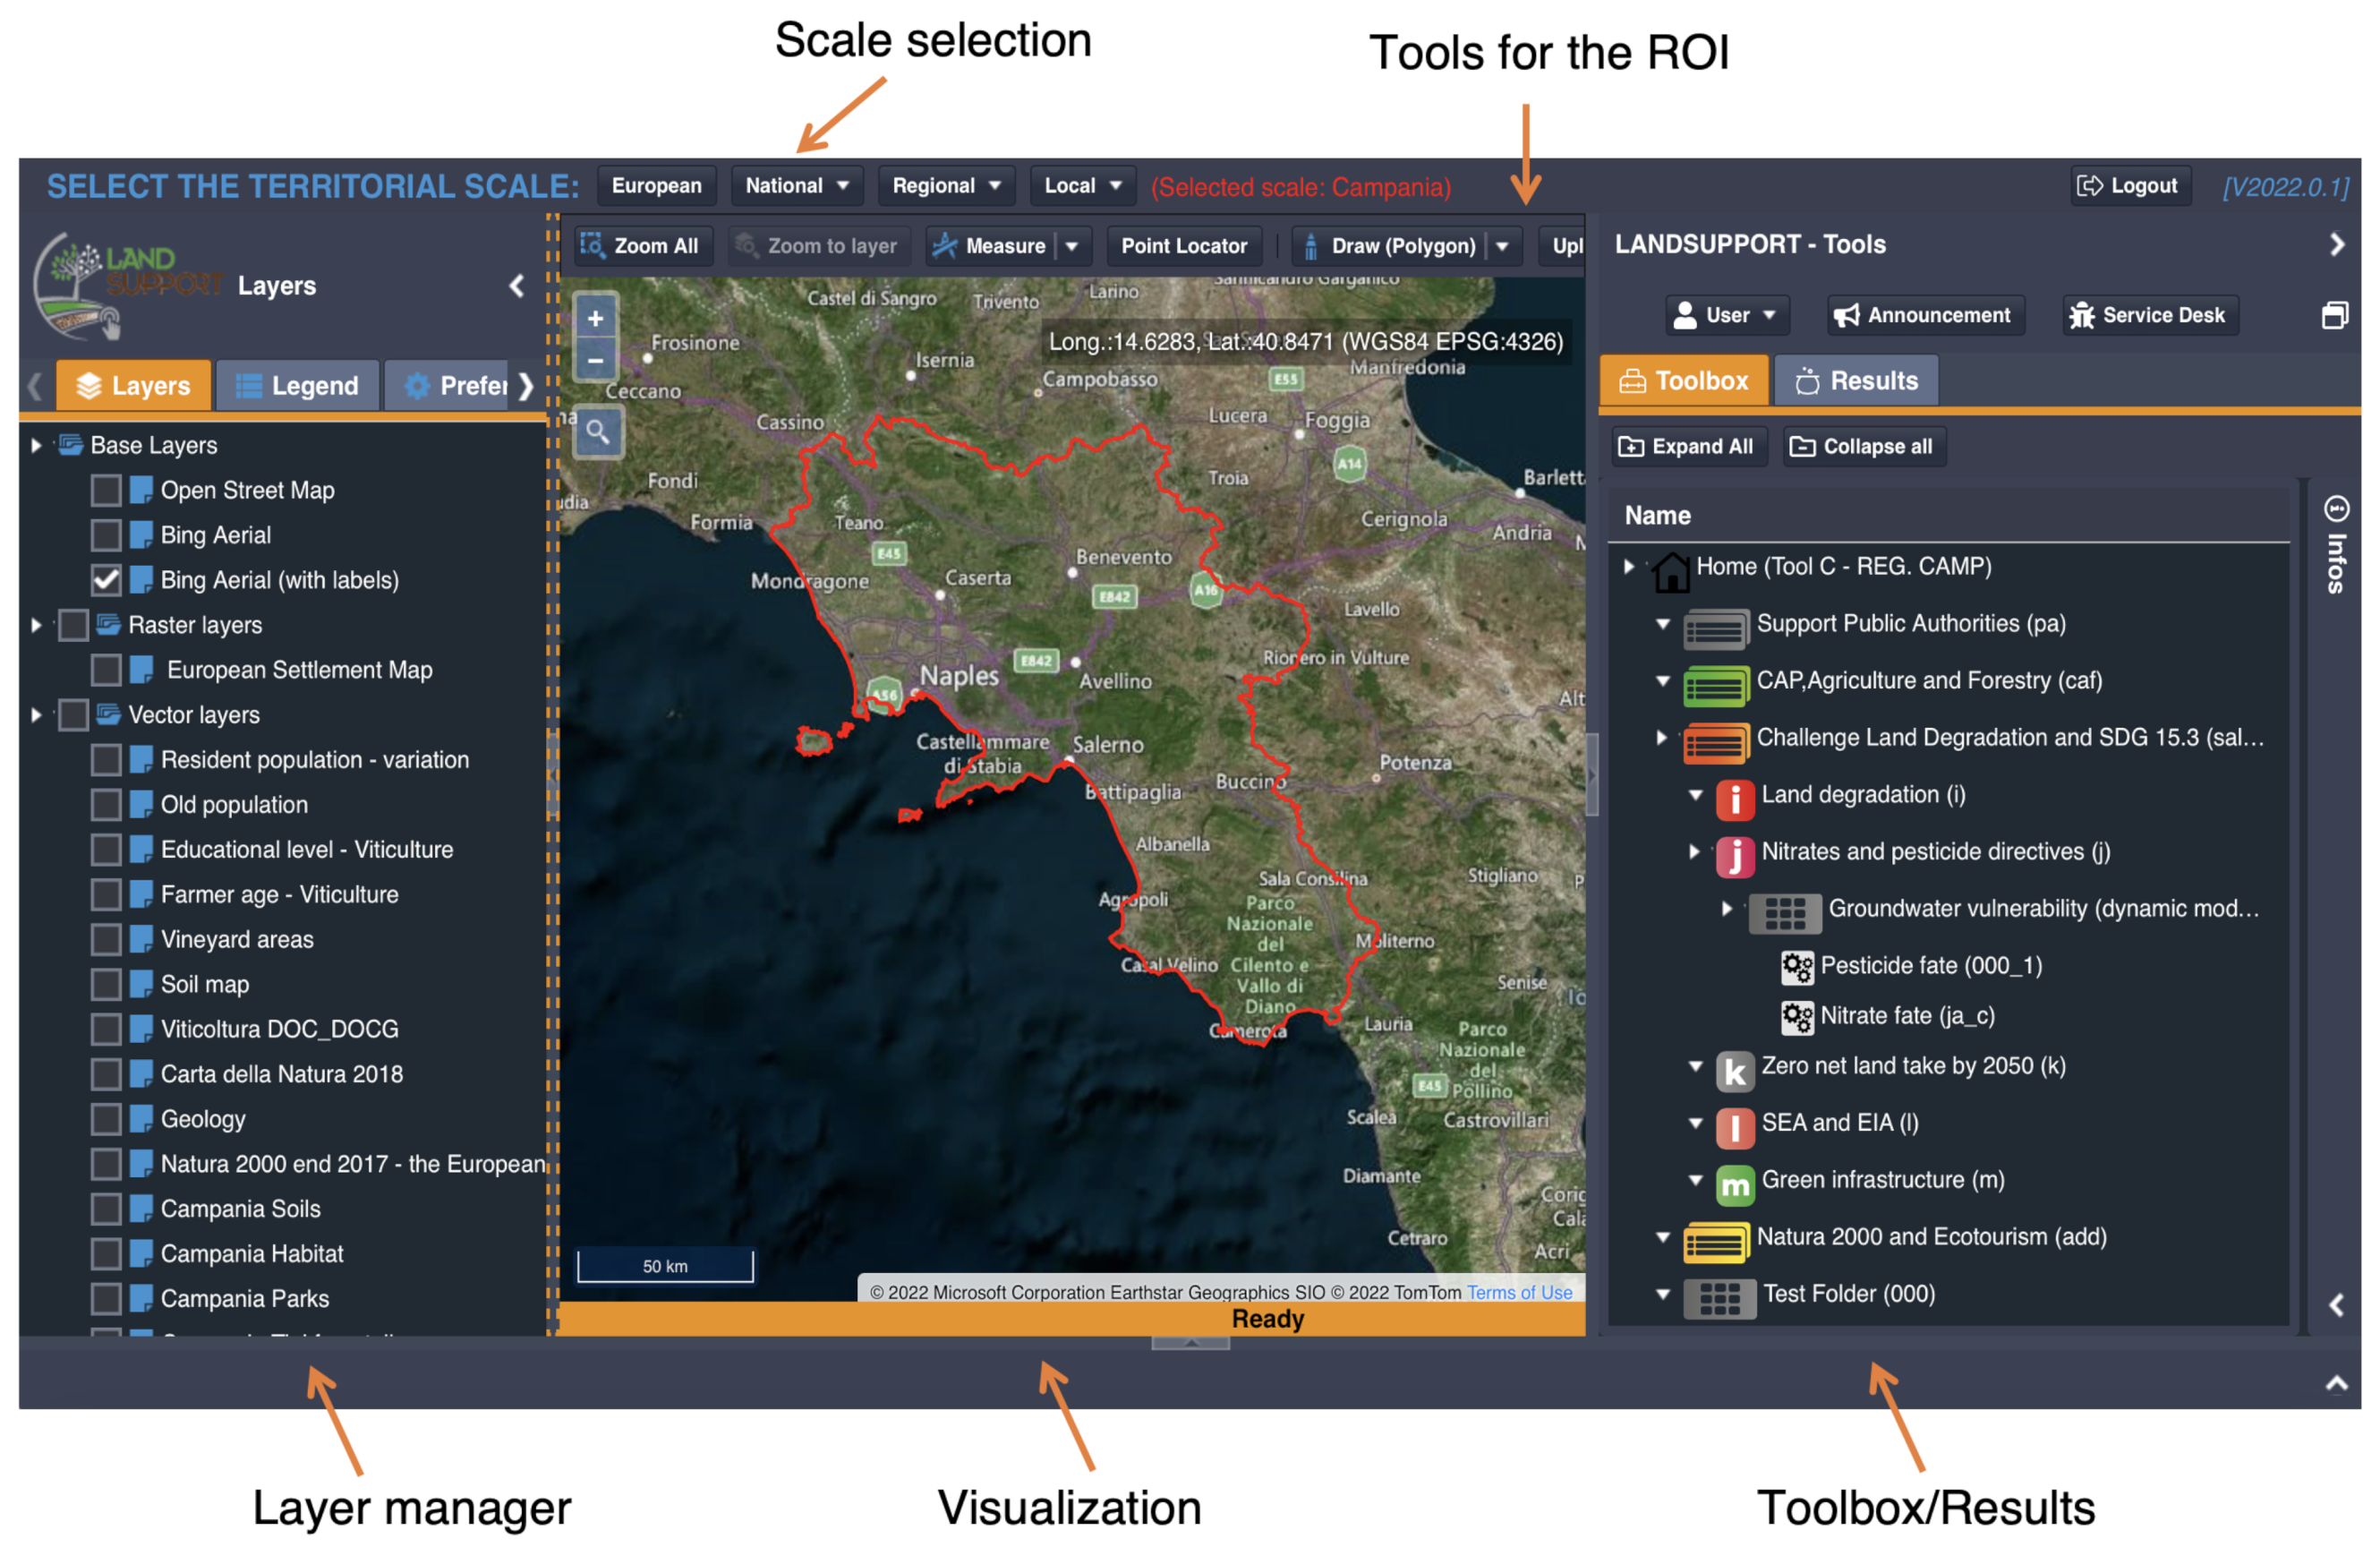
2. The LandSupport Platform and the Nitrate Fate Tool Implementation

During the H2020 LandSupport project, successfully concluded in 2022, a freely available and open-source web-based geoSpatial DSS was developed. Interested users, spanning from researchers to public bodies, can interact in real-time with digital maps and geo-spatial data, with the aim of promoting sustainable agriculture and forestry while evaluating potential trade-offs between different land uses at multiple different spatial scales (European, national, regional and local). End-users can operate using more than 100 S-DSS tools, covering areas such as ecotourism, land degradation, climate change and viticulture, tailored to their specifics, objectives and Region of Interest (ROI).
At the core of the LandSupport system is the Geospatial Cyber-Infrastructure (GCI), enabling the acquisition, storage, management and visualization of both static (e.g., land use, elevation) and dynamical data (e.g., climate). This flexible infrastructure makes possible on-the-fly modelling applications for conducting what-if-scenario analysis: interested end-users, by varying some parameters, can obtain customized results in multiple output formats (e.g., graphs, maps, reports). Further details on the functionalities and methodological issues can be found in [5,7].
Users can access the LS platform through the project’s web page (www.landsupport.eu, accessed on 7 September 2023). The dashboard is a friendly GIS-like Graphical User Interface (GUI), shown in Figure 1, and consists of five sections:
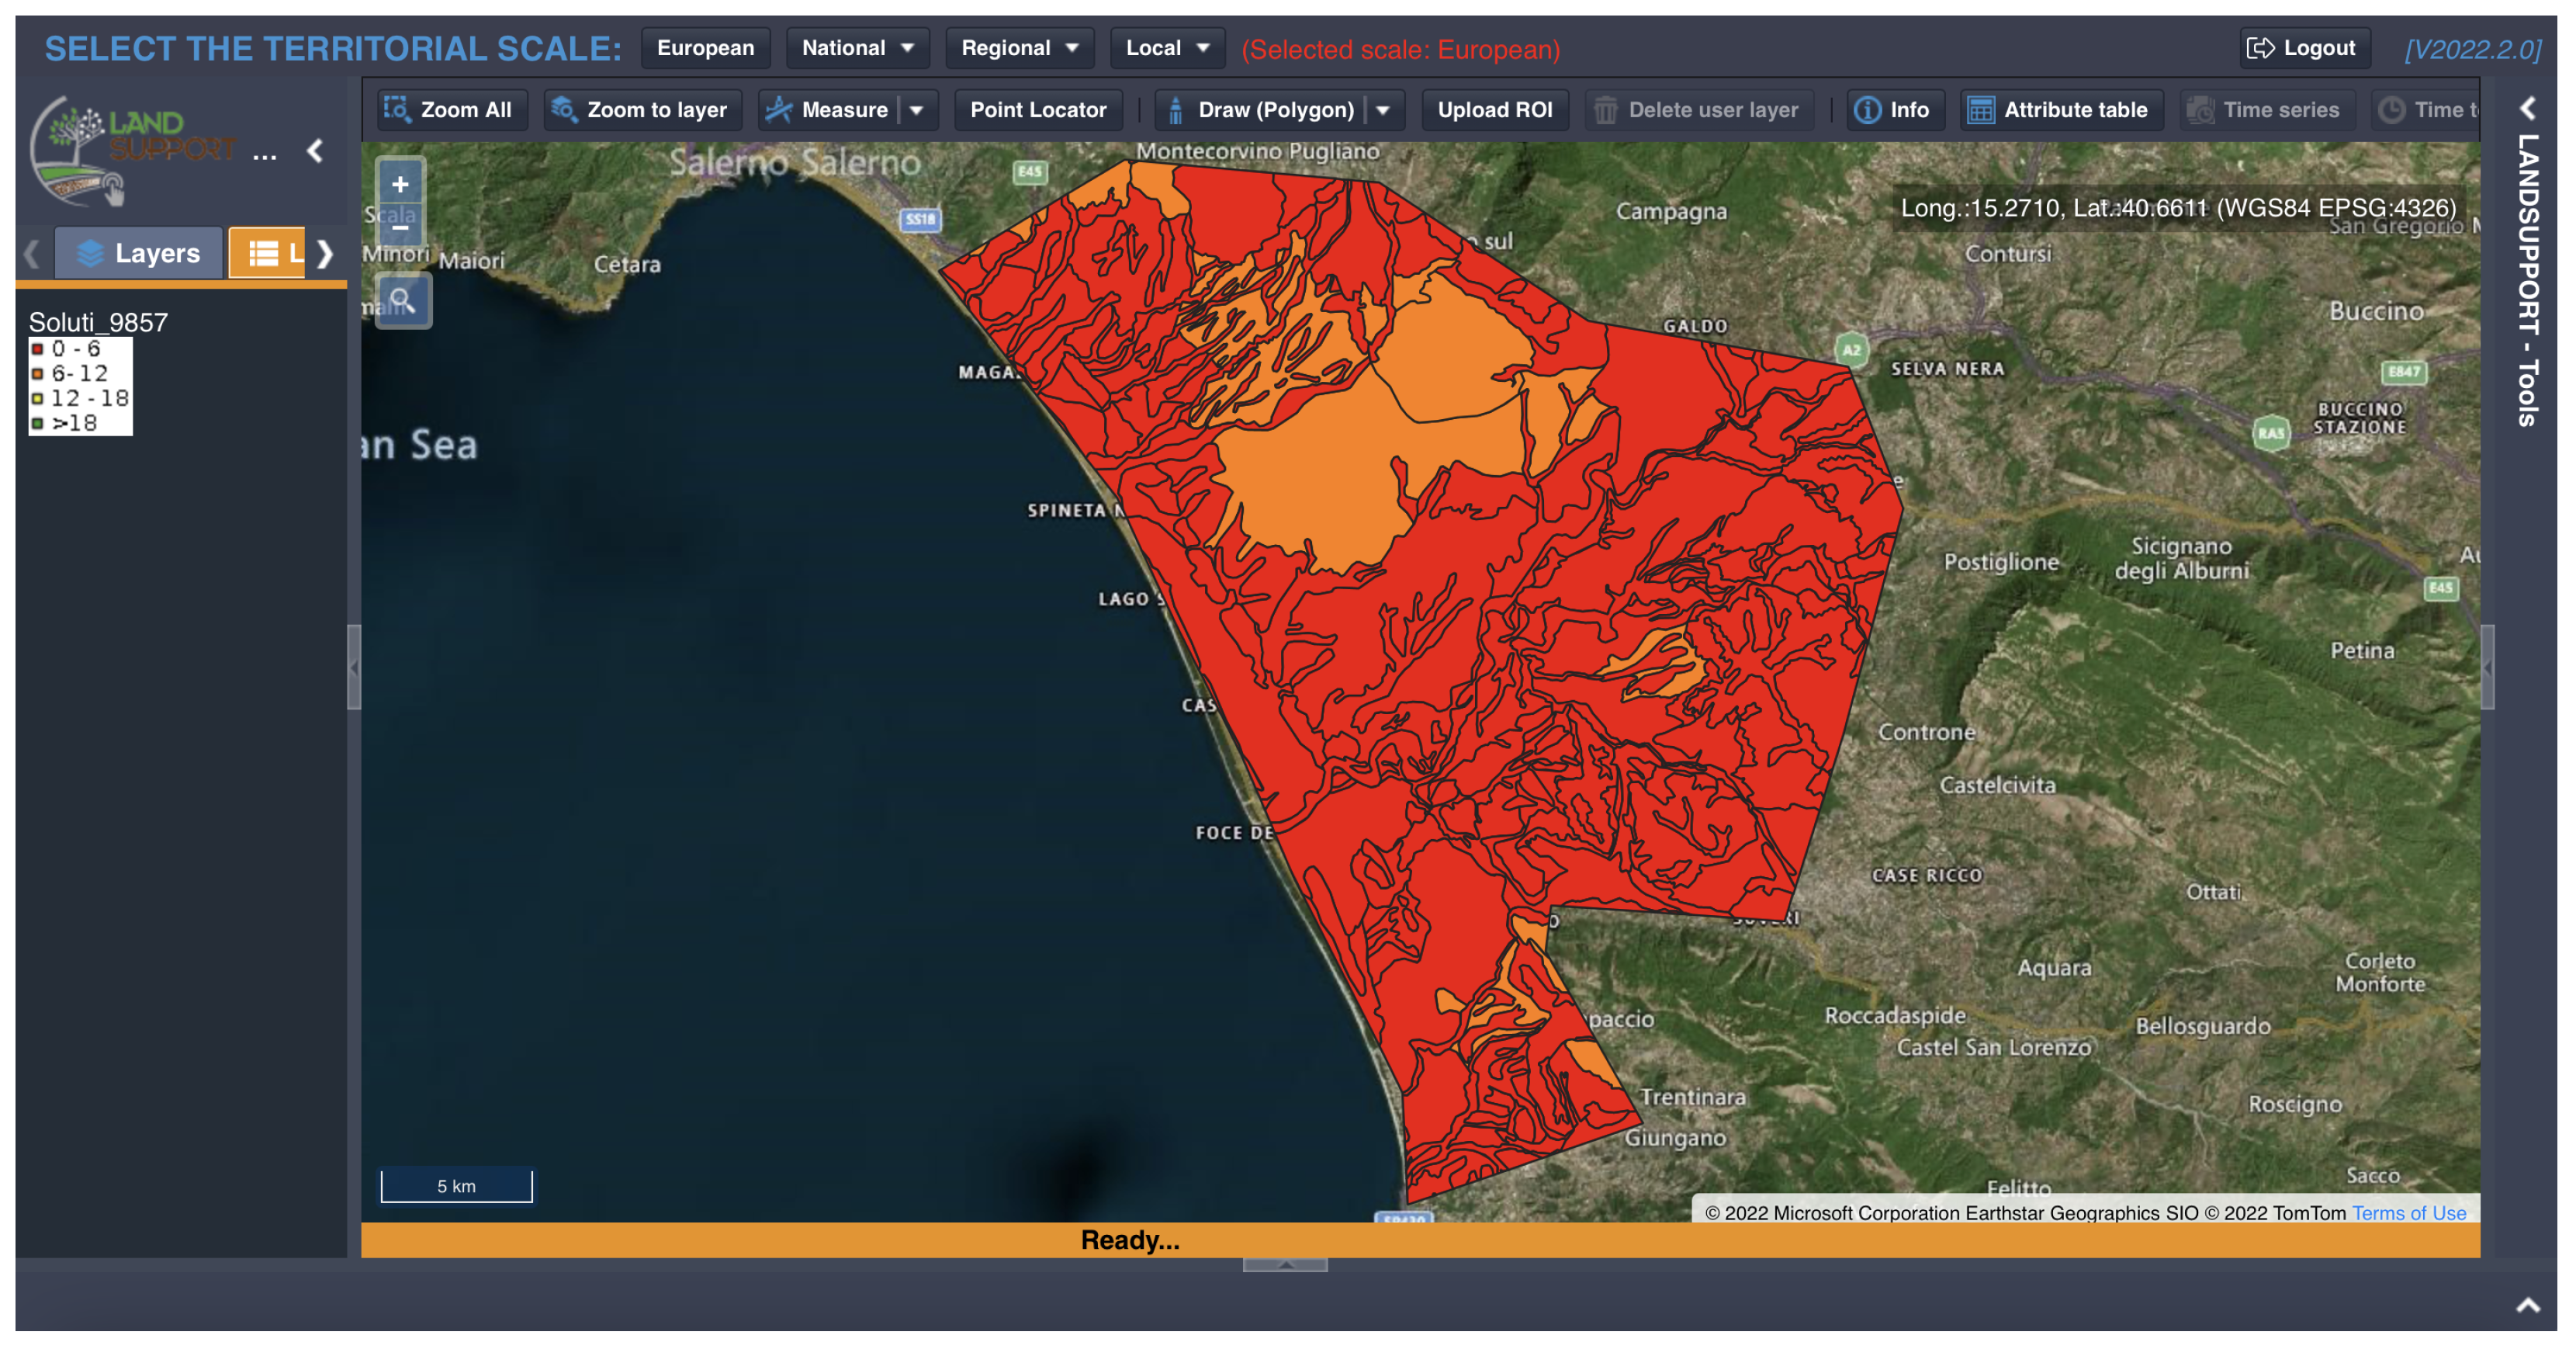
  • Selection of the scale, which directs users to their area of interest. This choice automatically activates/deactivates available tools in the toolbox and shows/hides scale-dependent informative layers.
  • Tools for drawing/selecting/measuring the ROI.
  • Toolbox/results tabs, to navigate through tools and through results of runs.
  • Visualization of pre-loaded layers and simulation results.
  • Layer manager, to activate/deactivate pre-loaded layers and output maps.
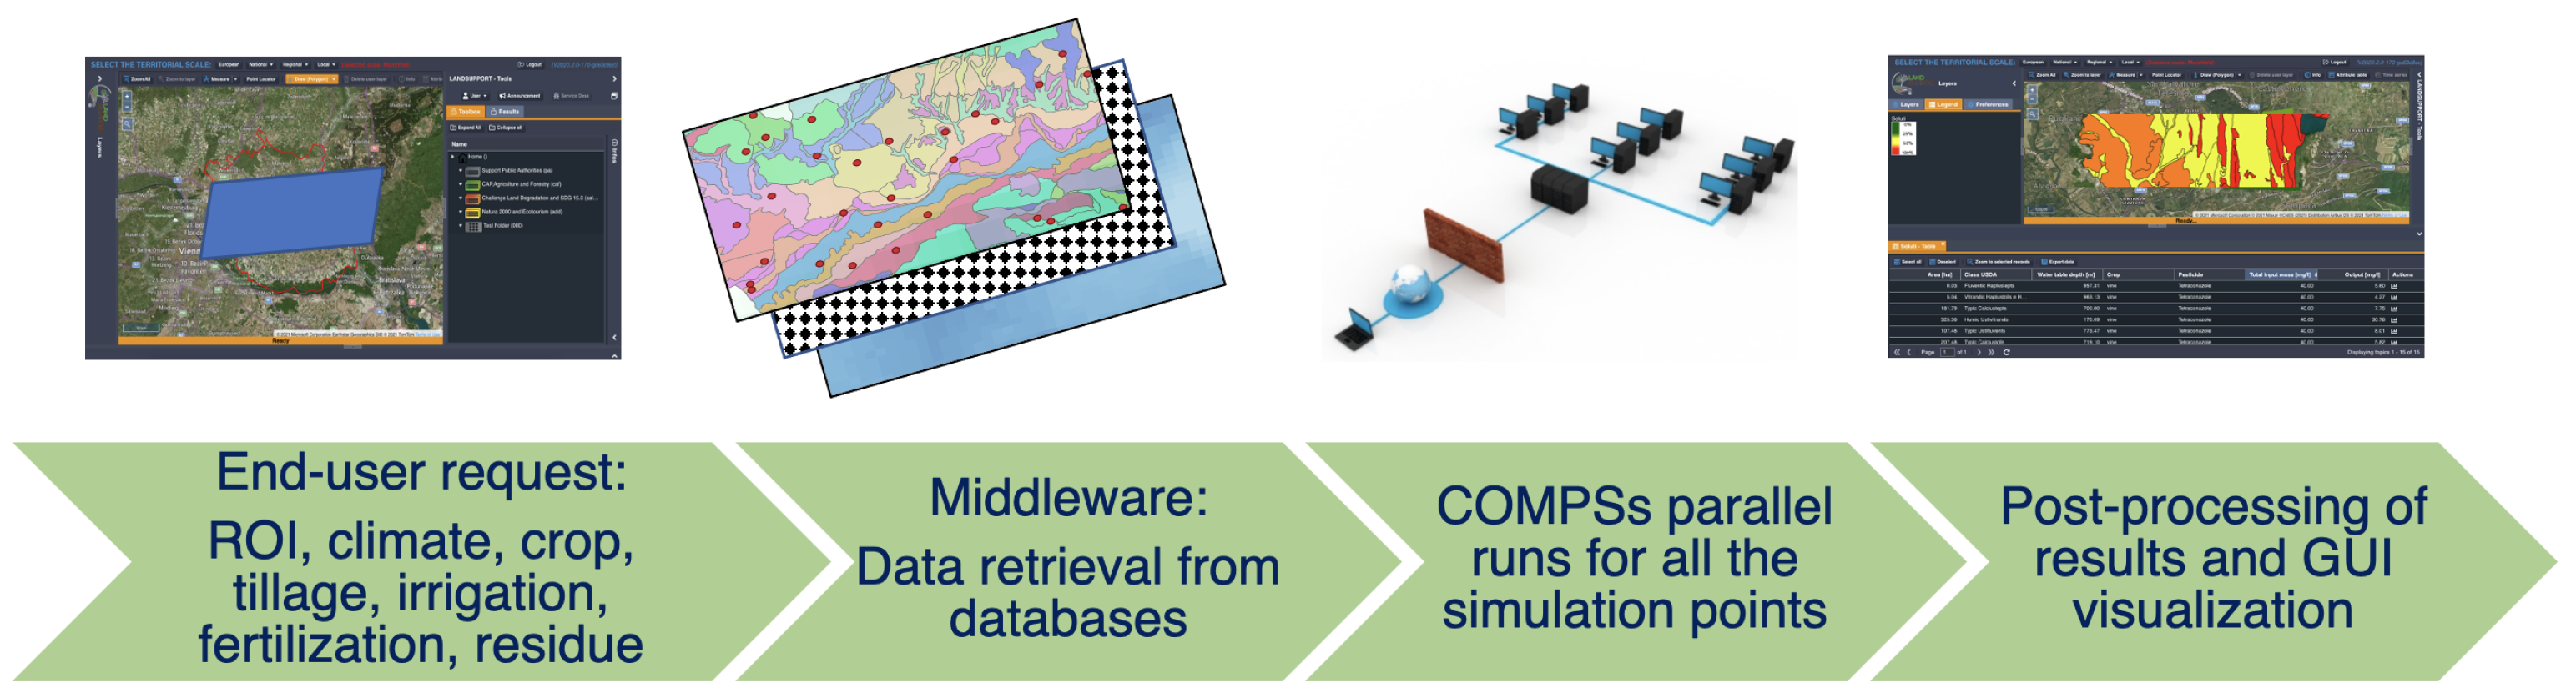
The NFt can be found under the Challenge Land Degradation and SDG 15.3/ Nitrates and Pesticide Directives menu, once the desired regional scale (Marchfeld (AT), Campania Region (IT) and Zala County (HU)) in the upper part of the dashboard is selected.
After clicking on the tool button, a pop-up panel (i.e., the model requester in the upper part of Figure 2) opens and the end-user should follow these steps to perform their on-the-fly simulations:
1.
choose a predefined area or draw a new Region Of Interest (ROI);
2.
select the crop or crop rotation, between the long list, available for each area;
3.
choose the type of irrigation (100% or 80% of the maximum crop request);
4.
choose the type of fertilization (inorganic or organic or both);
5.
choose the tillage operations (conventional, minimum and SOD-seeding);
6.
choose if retain the crop residues or not.
Site-specific management configurations were defined based on information gathered from local surveys conducted by experts in the fields, as well as input from stakeholders, including farmers, associations, and public authorities. Additionally, extensive bibliography studies were conducted. All the data were then populated into two databases: the Rasdaman datacube (where raster data are managed) and PostgreSQL/PostGIS (where vector data are stored and managed).
To obtain fast and real-time results, the tool leverages the COMPSs programming framework [11]. This framework enables the parallel execution of multiple model runs for all combinations of soils–climates–water table depths within the ROI, as shown in Figure 2. To stress the importance of the parallel execution of the runs, consider the following example: a ROI has been drowned in a pediment area, where six soil types are distinguished. Furthermore, two climates can also be distinguished, besides four classes of groundwater table depth. By combining this information, we could potentially have 48 runs of the tool. Thanks to COMPSs and to the GCI, these runs are executed in parallel, resulting in real-time outputs in approximately 30 s.
Three implementations of the NFt were made in the platform: Campania Region, in Italy, Marchfeld region, in Austria and Zala County in Hungary. These three case studies were chosen since they are representative of a variety of different climates, soils, vadose zone types and depths, and land use.

3. Materials and Methods

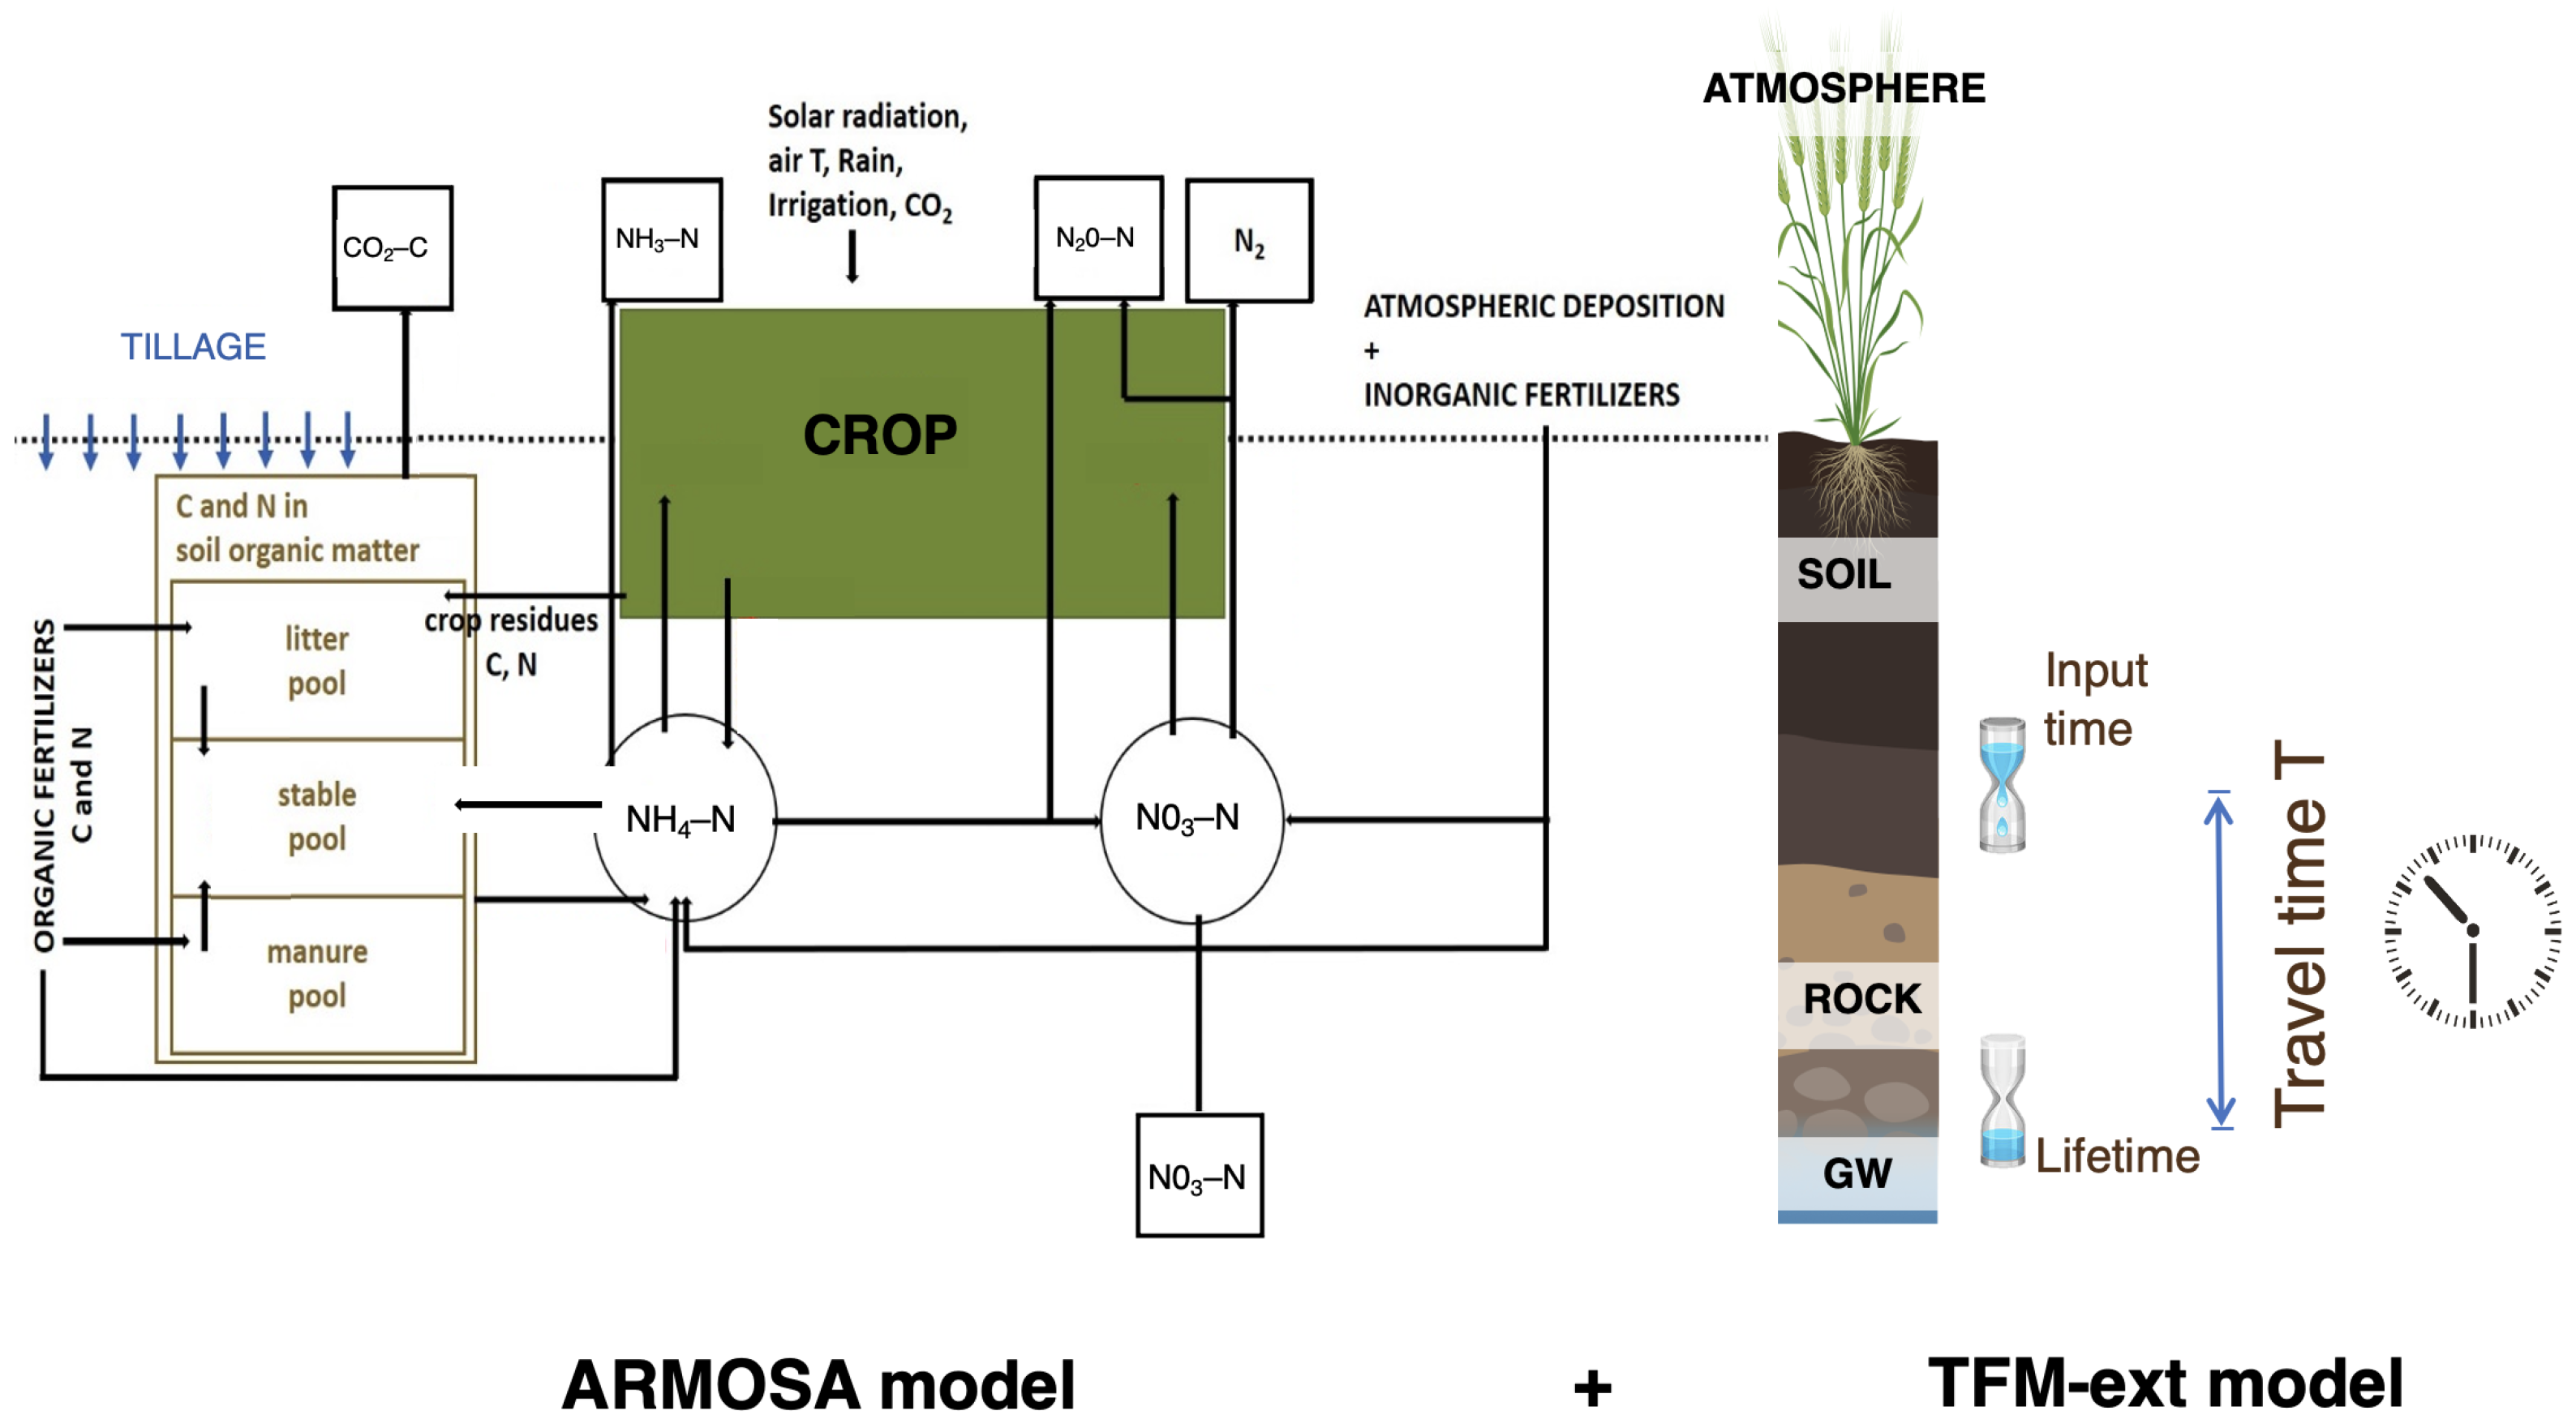
3.1. The Nitrate Fate Model

The process-based cropping system ARMOSA model [12] simulates the effect of agronomic practices on a wide range of crops, crop rotations and on soil-related variables. The model considers four principal modules simulating evapotranspiration, crop growth and development, water dynamics and carbon and nitrogen cycling, as depicted in a simplified scheme on the left part of Figure 3. The reference evapotranspiration (ET 0 ) can be estimated using multiple methods, such as the Penman-Monteith, Priestley-Taylor, or Hargreaves equations. Potential crop evapotranspiration (ET P ) is estimated using the FAO 56 approach [13], while actual evapotranspiration (ETa) is calculated using a water stress factor, influencing the crop-related processes like carbohydrate production and photosynthate partitioning.
Crop growth and development follow an enhanced WOFOST approach [14], including (i) 5 layers within the canopy with distinct light interception, and (ii) the crop development described by the BBCH scale (Biologische Bundesanstalt, Bundessortenamt and Chemische Industrie). This allows for a detailed representation of phenology and the thermal time required to reach each stage.
Water dynamics are simulated using the bucket approach. The soil characteristics required for each pedological horizon include sand, silt and clay percentages, bulk density, soil organic carbon and nitrogen contents in stable, litter and manure fractions.
Carbon and nitrogen-related processes are implemented following the approach of the SOILN model [15], independently considering each input of nitrogen (either organic or inorganic form), each with its own decomposition rate and fate. This also applies to the application of organic matter inputs (e.g., manure, crop residues), which are described by their carbon and nitrogen content, decomposition rate and burial depth.
Tillage operations are simulated as a function of tillage depth, timing, degree of soil layers mixing and perturbation. The mixing of two or more consecutive soil layers (e.g., the first two in the topsoil, involved in the tillage operation) determines pool mixing and the recalculation of pools (e.g., mass or volumetric variables, such as C-litter and soil water content). After this, the model estimates the daily bulk density change as a function of the soil organic carbon content and due to tillage. Parameters of the water retention curve, expressed by the van Genuchten Equation [16], are then recalculated daily according to bulk density and soil organic carbon.
The ARMOSA model has been applied and validated in numerous studies worldwide [12]. Recently, in [17], the model was used to perform an assessment of tillage and no-tillage practices of durum-wheat-cropping systems in the Campania Region under current and future climate scenarios, proving to be a state-of-the-art crop-growth model.
The Extended Transfer Function Model (TFM-ext) [5] represents an extension of the transfer function approach [18], detailing leaching behaviour in a soil profile and along the vadose zone to the groundwater table through TT probability density functions (TT pdfs). The output solute concentration C z ( z , t ) (i.e., the breakthrough curve), at a given time (t) and depth of interest (z), is computed as the convolution of the TT pdfs, f f ( z , t t ) with the solute input concentration to the system, C 0 ( 0 , t ) , according to Equation (1) [18]:
C z ( z , t ) = 0 T C o ( 0 , t ) f f ( z , t t ) d t
where t is a dummy variable and t t represents the TT. Assuming gravity-induced water flow and disregarding the convective mixing of tracer flowing at different velocities, in this approach the TT pdfs are calculated as functions of the unsaturated hydraulic conductivity K ( θ ) , according to [19]:
f f ( z , t t ) = 1 q d K ( θ ) d t
where q [L T 1 ] is the steady-state flow rate, which, in this case, is the constant mean daily water flow at the bottom of the root zone depth. In cases where information on the unsaturated hydraulic conductivity function is lacking, e.g., in the vadose zone below the soil, the model assumes that travel times can be described by a log-normal distribution, according to the Generalized Transfer Function [20].
The TFM-ext model was validated in [5] against concentration experiments carried out on four large soil columns. Moreover, outputs obtained by applying the model to 46 soil profiles sampled in the Valle Telesina, in the Campania Region, were compared with those obtained from the Richard-based model Hydrus 1D, yielding highly satisfactory results.
Figure 3 represents a schematization of the two models and their coupling, considering that the interface between the two is represented by the root zone depth:
1.
The ARMOSA model simulates nitrate leaching and water balance within the rooting depth of the soil;
2.
The constant mean daily water flow, input of Equation (2), is computed by averaging the variable daily water fluxes simulated in step 1;
3.
The nitrate leaching simulated in step 1 is properly handled and serves as the solute input concentration, C 0 ( 0 , t ) in Equation (1);
4.
The output nitrate concentration C z ( z , t ) at the groundwater table depth is produced and opportunely managed, as reported in the previous section.
Within the LS-GCI, after the user has made the desired choices through the model requester, the models coupling, from the IT-point-of-view, is made in the following way: (i) the GCI manages the data retrieval and launches the crop-growth ARMOSA model; (ii) leachate and water fluxes in output from the root zone are modelled and opportunely managed to feed the TFM transport model. Additionally, the GCI manages the data retrieval for the TFM-ext model (e.g., the water table depths, the stratification and the corresponding hydraulic characteristics of the vadose zone) and the (iii) TFM-ext model is launched to estimate the mean nitrate travel times and cumulated output concentration at the groundwater table depth; eventually, (iv) the number of years for the arrival of the 50% of root leachate at the groundwater table depth is extracted and is associated with each soil polygon involved in the ROI. The latter outputs are classified, according to the selected scale, to obtain the coloured maps indicating the vulnerability classes. As an example, the workflow reported in Figure 4 shows that from the cumulative chart of nitrate arrival, expressed as a % respect to the total input, the number of years (e.g., 8 years) is extracted by entering at the 50% on the y-axis.

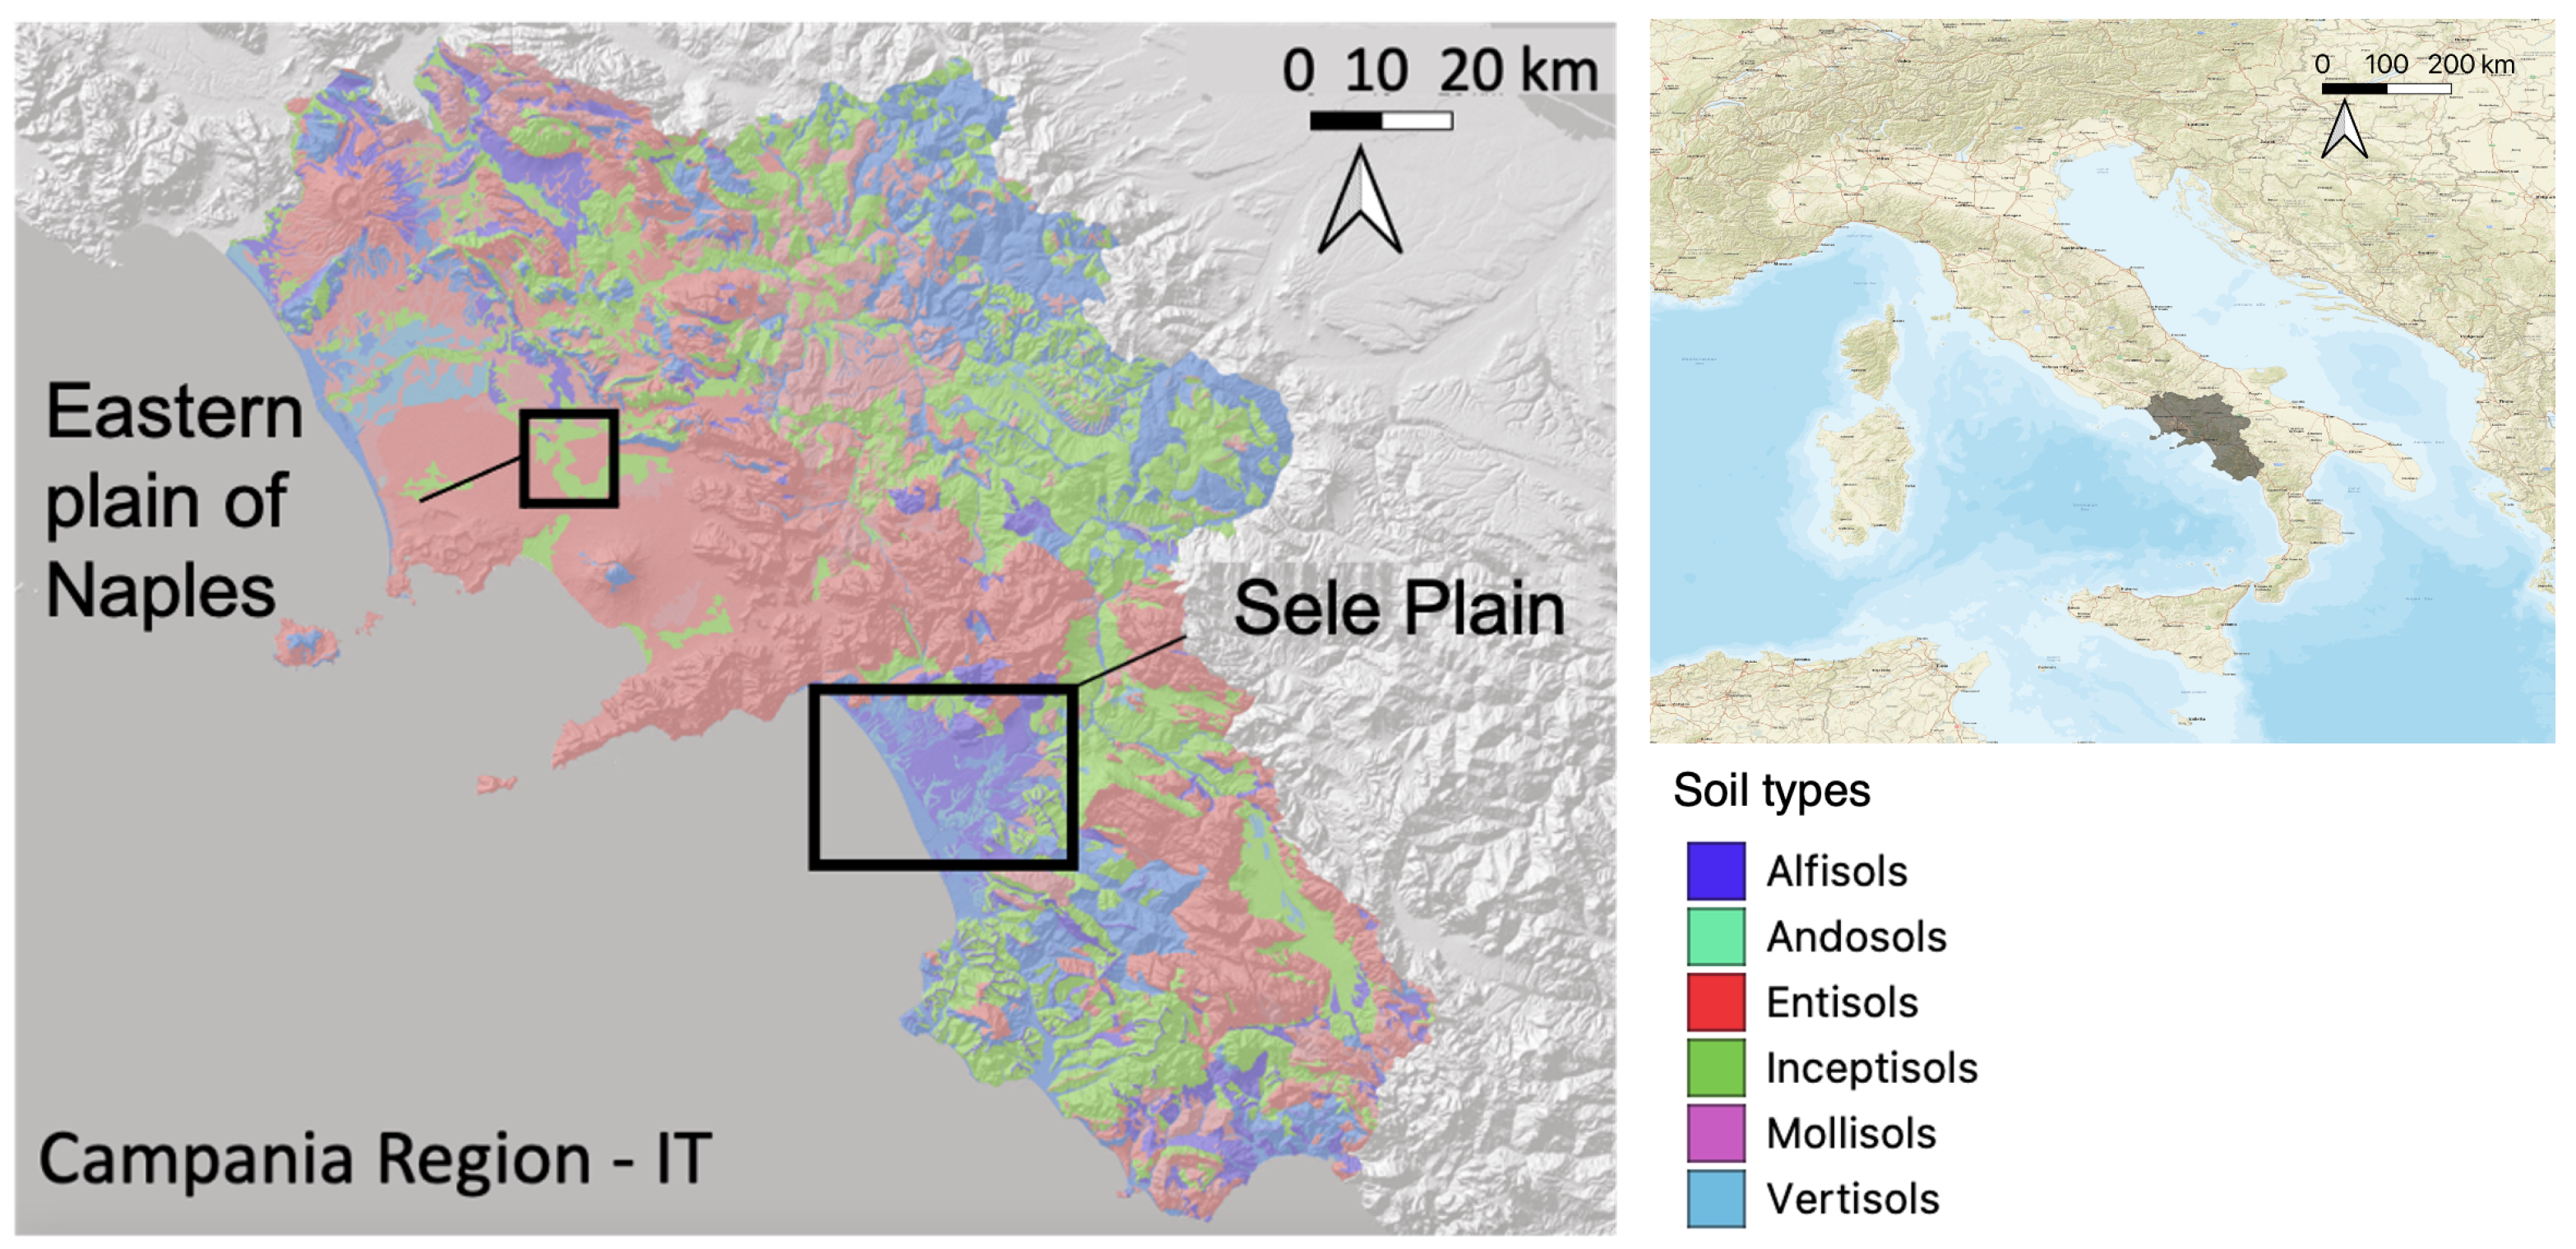
3.2. Study Site and Input Data

Among the many areas available on the platform, this study focuses on presenting details and results of the NFt tool applications to two case studies located in the Campania Region: the Sele Plain and a small area in the eastern plain of Naples, see Figure 5. Both areas were chosen as they are detected as NVZs.
The Piana del Sele extends over an area of about 550 km 2 , bounded seawards by a narrow sandy coastal strip and landwards by the Lattari and Picentini Mountains (on the N) and by the Cilento Mountains (on the SE). The climate, with a mean annual temperature of 10–12 °C and a mean annual rainfall of 1050 mm, can be described as Mediterranean, with hot dry summers and moderately cool–rainy winters. The area is particularly impacted by intensive agriculture, mainly vegetable crops, both in open air and greenhouses and forage for the presence of water buffalo breeding. Notably, the area exhibits considerable variability both in terms of groundwater table depth (between 0 m b.g.l. and more than 20 m b.g.l.) and pedoclimatic conditions (six different soil types, according to the 1:250,000 soil map of the Campania Region).
The area selected in the eastern plain of Naples is an extension of around 14 km 2 and corresponds to the adjoining municipalities of Casalnuovo di Napoli and Volla. The climate can be described as Mediterranean, with hot dry summers and moderately cool–rainy winters, a mean annual temperature of 10–12 C and a mean annual rainfall of 850 mm. The groundwater table depth varies between 0 m b.g.l. and more than 40 m b.g.l., while, according to the 1:250,000 soil map, we can recognize 3 different soil types. This area was considered representative of the anomalous high concentrations of nitrate in groundwater, resulting from hydro-chemical studies carried out in the plain area surrounding the city of Naples [21].
The input database of the nitrate fate model runs is composed of the following:
  • The soil dataset (table and geo-referenced file): it contains information about representative soil profiles for each soil unit, such as horizons depth, parameters describing water retention and hydraulic conductivity curves according to the van Genuchten–Mualem Equations [16], saturated hydraulic conductivity, textures, organic matter content, bulk density and their geographical locations. Soils’ pedological and hydrological characteristics are essential for the model to evaluate how different crops grow and develop in different soils and how they act as a filter toward nitrate leaching;
  • The climate dataset (table): it contains data from the reanalysis model, which combines past observations with models to generate consistent time series of multiple climate variables (https://climate.copernicus.eu/climate-reanalysis, accessed on 7 September 2023). Available variables are wind, temperature, relative humidity, solar radiation, precipitation;
  • The crop dataset (table): it contains parameters and information about the most commonly cultivated crops and related management practices, such as sowing and harvesting dates, fertilization rate and timing. Data were collected through local surveys involving farmers and experts from the Agricultural Department of Campania Region;
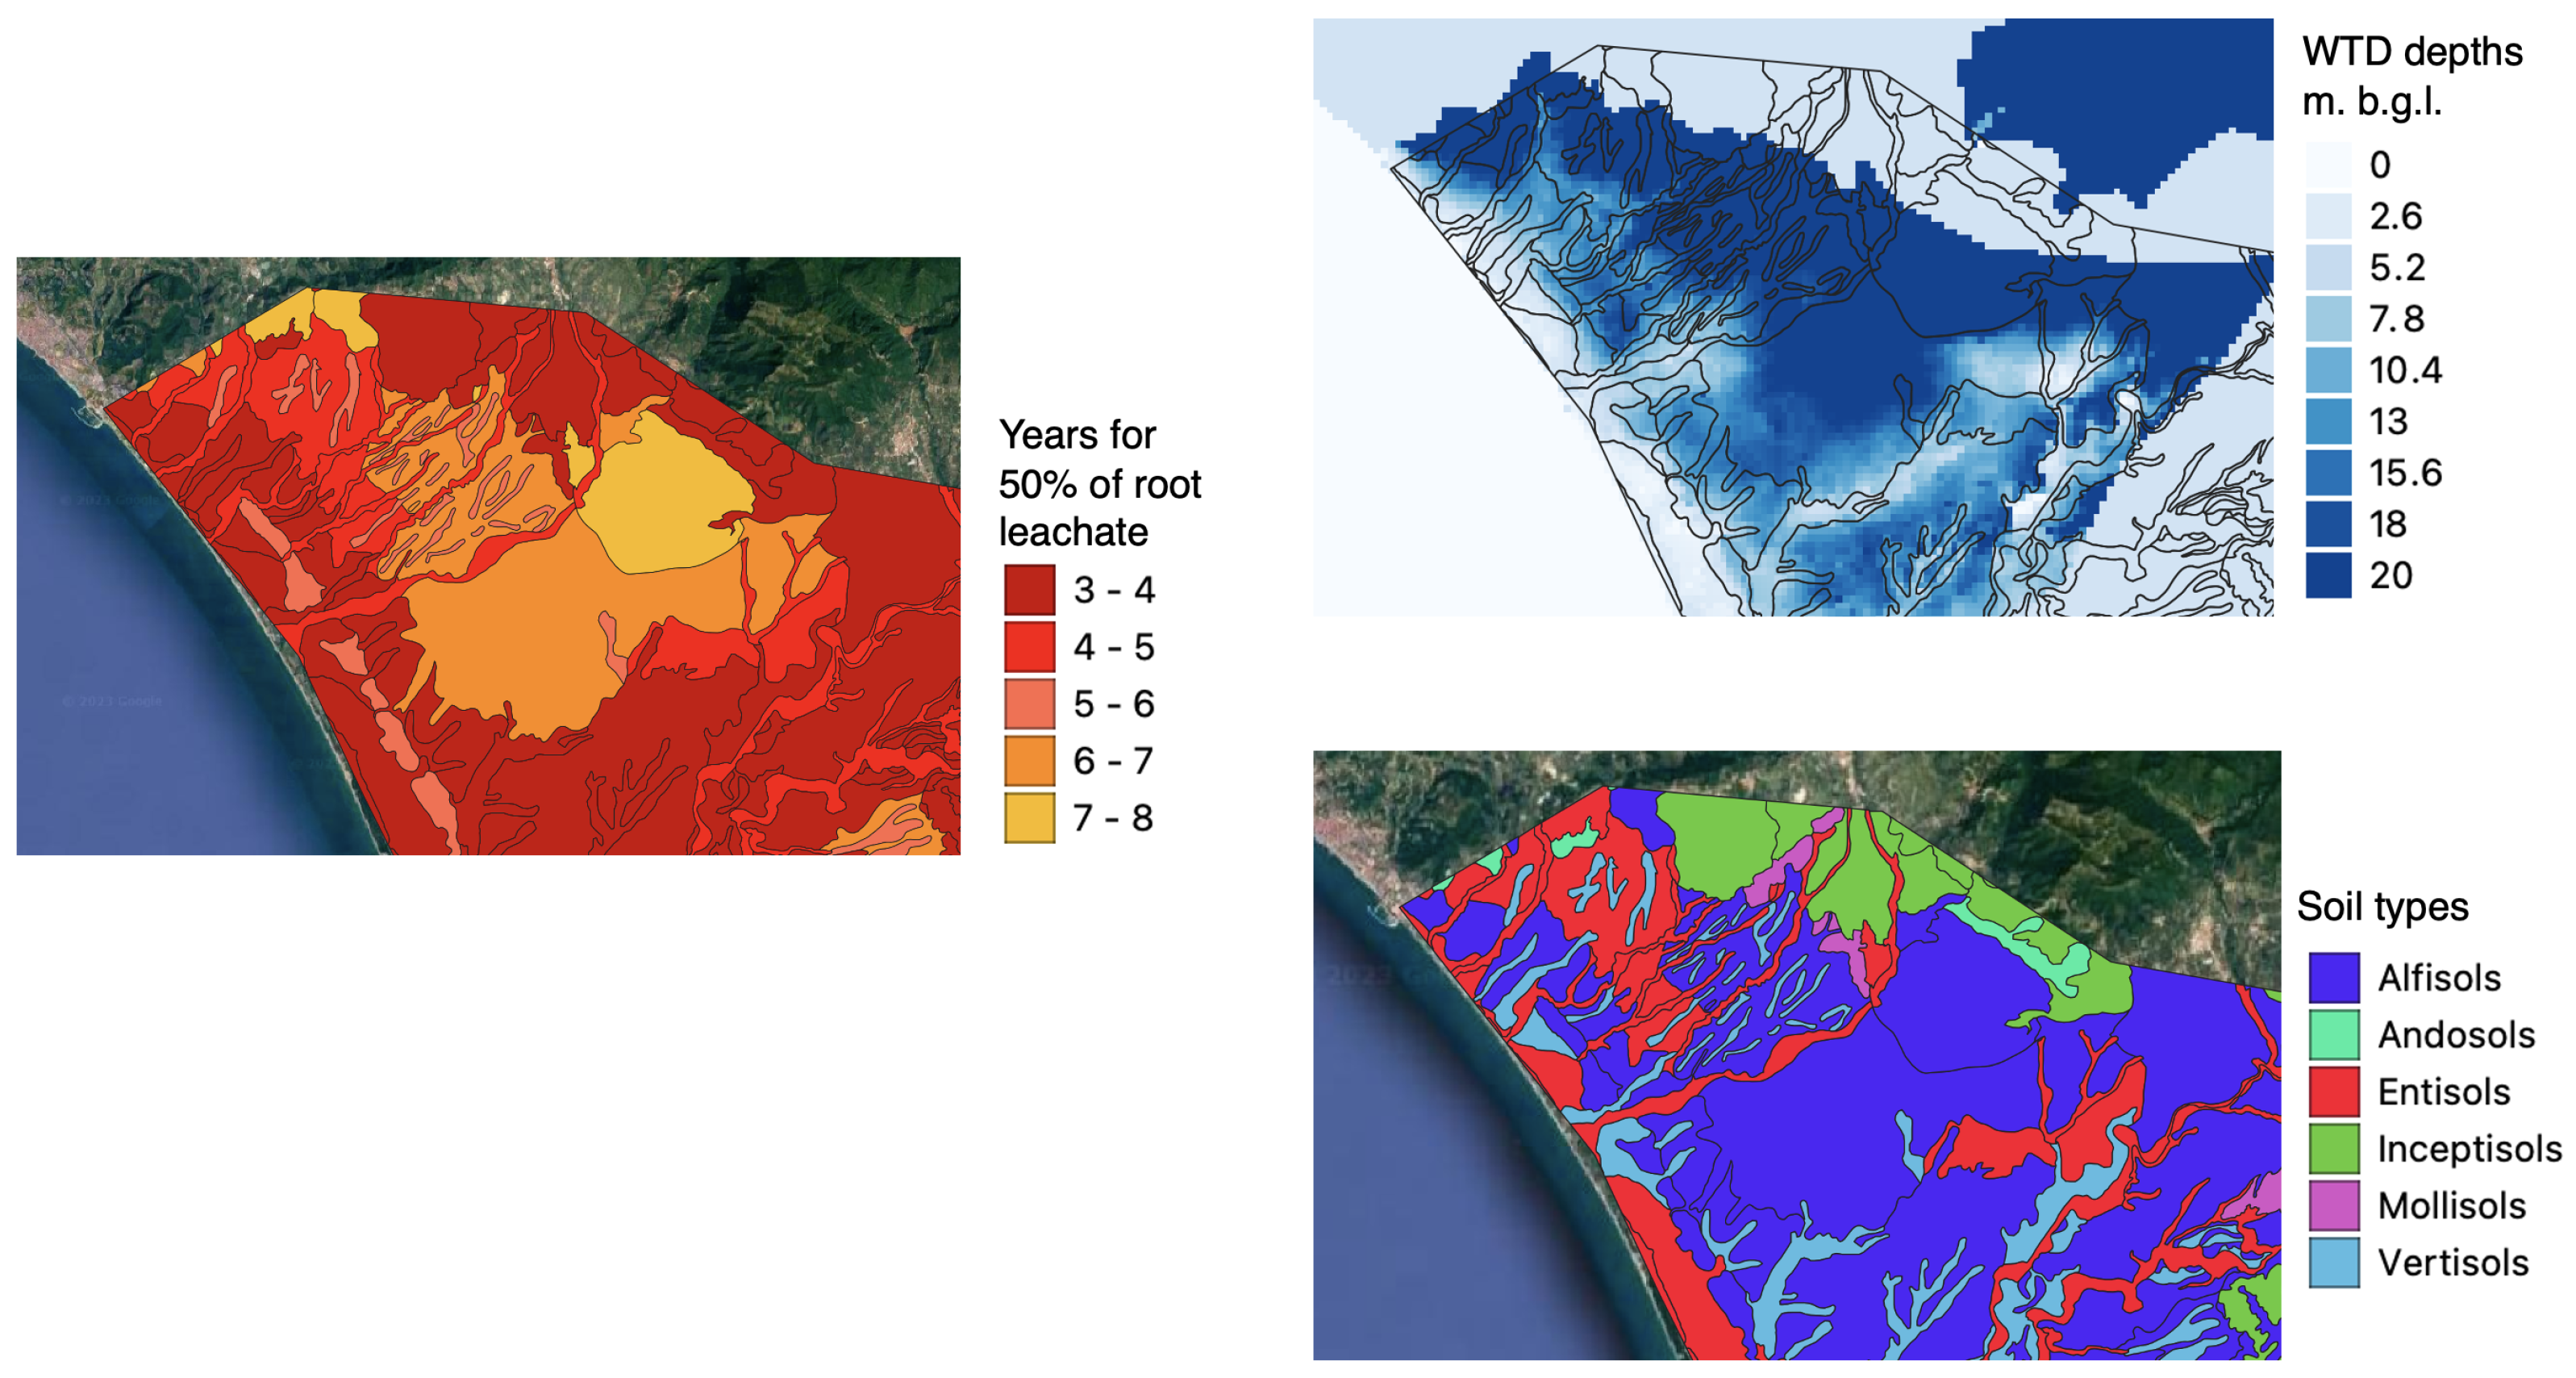
  • The groundwater table depth (GWTD) (map): raster maps were reconstructed considering piezometric data of existing boreholes and wells [22].
All the above information was gathered through field campaigns, laboratories analysis conducted during the LS project (soil dataset), local surveys made with farmers and stakeholders, (crop dataset), environmental agencies and bibliographic studies (GWTD dataset). Eventually, all the above data were opportunely validated by researchers and organized to feed the LS databases.

4. Results

This section explores and discusses some examples of what-if scenario analysis possible with the NFt for the Campania Region. They represent only a few of the many possibilities offered by the LS S-DSS. To comprehensively analyse and better understand all the results, the following steps were taken, leveraging all the LS features:
1.
The obtained maps with the classified vulnerability were inspected through the platform, using the GIS tools for the ROI available in the GUI;
2.
The full table accompanying the resulting maps, containing information about soil polygons, groundwater table depth and selected crop was accessed, to quickly identify the soil polygons requiring further analysis;
3.
By clicking on the “Action” button in the last column of the full table, the graphs depicting the time evolution of nitrate arrival concentration (mg L 1 ) at the groundwater depth, were visualized and downloaded;
4.
The vulnerability maps were downloaded and simply imported in a GIS environment as an ESRI shapefile. The attribute table supplemented the run information with details about soil profile pedological characteristics (USDA classification, depths and more), the input and output nitrate masses and the number of years for the 50% arrival;
5.
From the Rasdaman service (https://rasdaman.landsupport.eu/rasdaman/ows#/services, accessed on 7 September 2023)—a software for managing rasters in a data cube—the map of the groundwater table depth and climate information were downloaded.
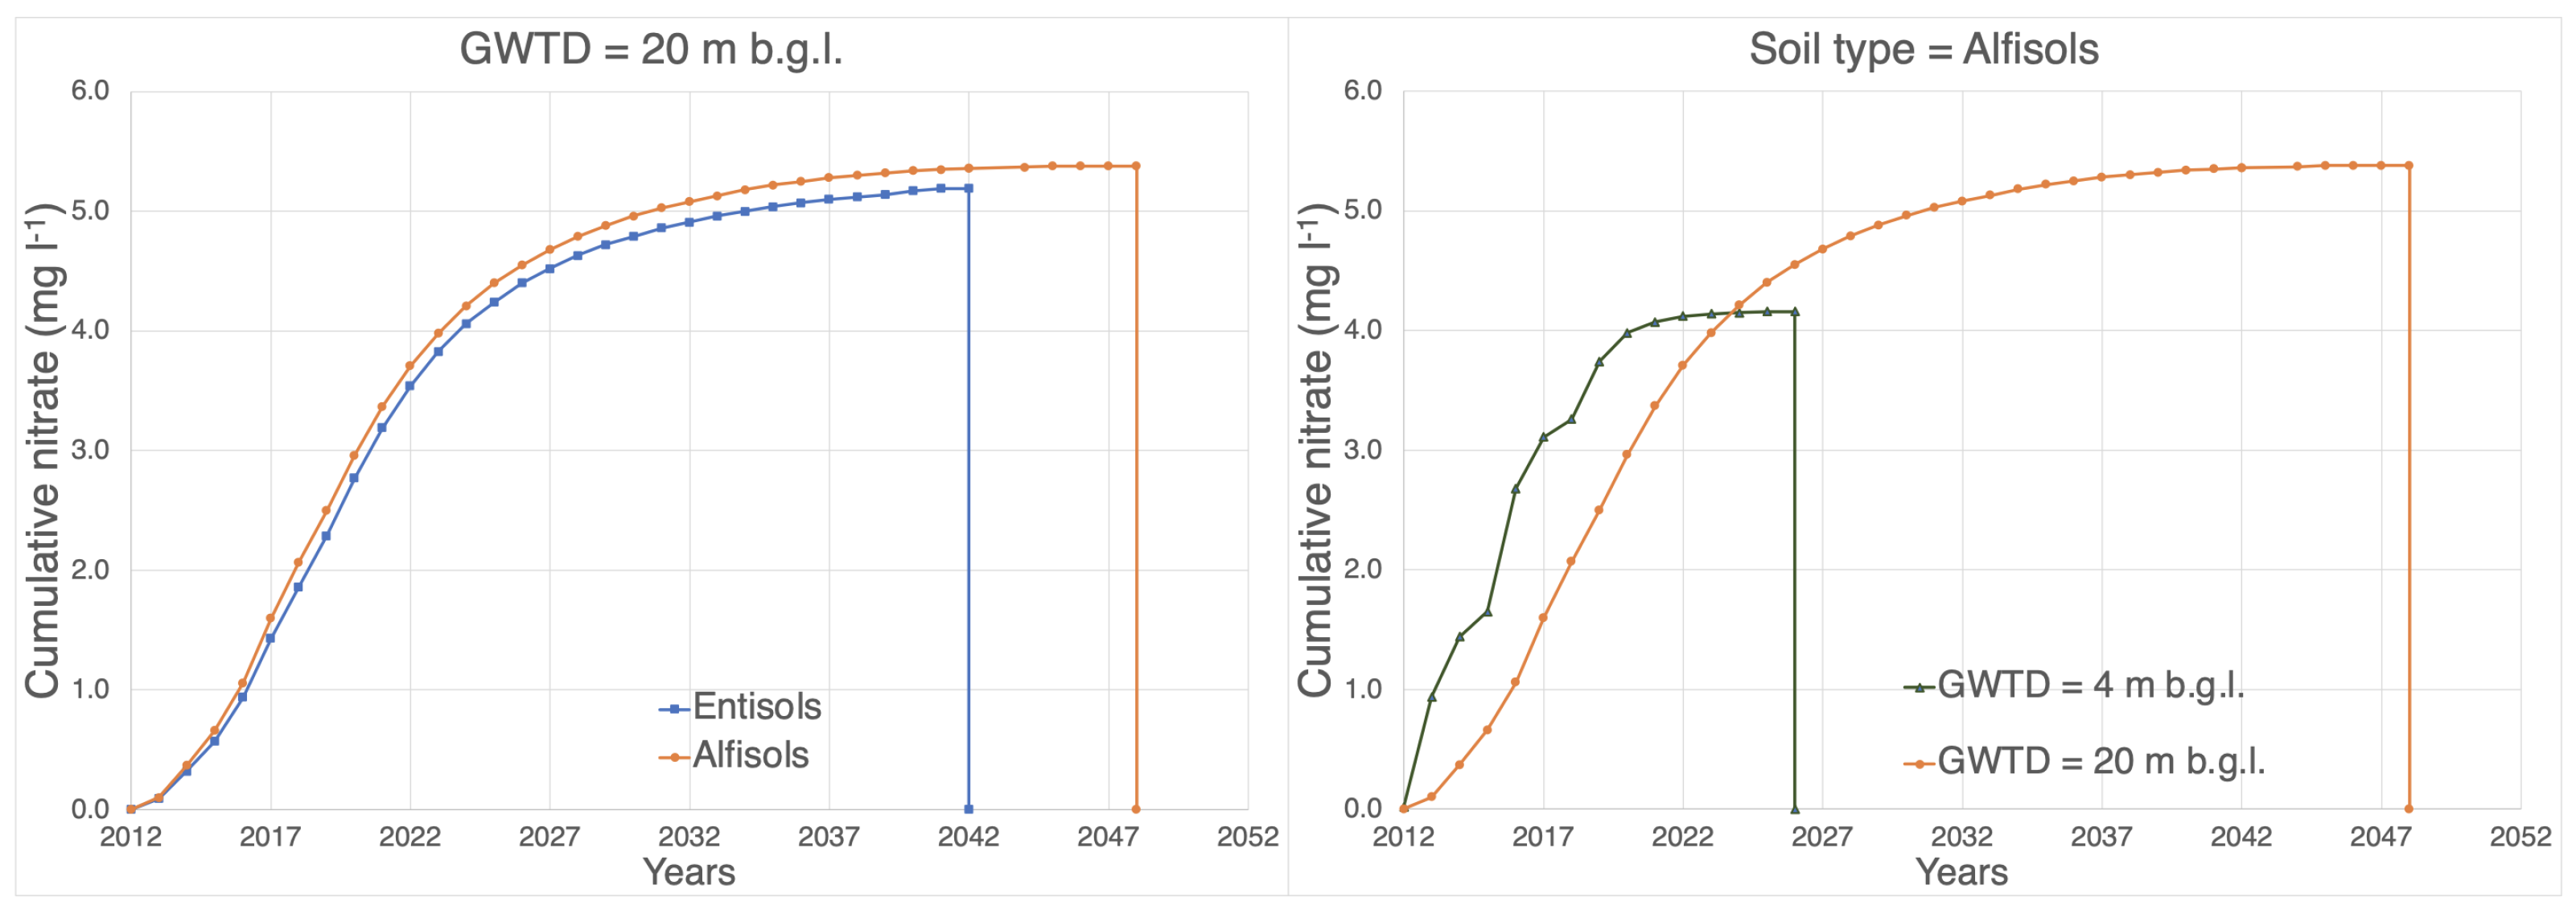
The previous procedure was applied for all the results discussed in the following sections.
For the first example, within the ROI in the Piana del Sele area we simulated, among the many alternatives, the crop rotation tomato–alfalfa, with inorganic fertilization of 140 kg ha 1 , defined according to the local standard practices, irrigation at 100% of the water consumption of the two crops, minimum tillage and the retention of crop residues after harvesting.
Figure 6 shows the map of the years for the arrival at the groundwater table depth of the 50% root leachate, which is one of the tool’s outputs. Green colours are associated with low vulnerability (above 18 years for the 50% arrival), yellow colours are associated with medium vulnerability (12–18 years), orange colours are associated with high vulnerability (6–12 years) and red colours are associated with very high vulnerability (0–6 years). These class definitions and the related time intervals were chosen according to the needs of the Campania Regional Agency for the Protection of the Environment. What is immediately evident is that almost the entire area is characterized by a very high groundwater vulnerability (red colour), with some exceptions in the central-upper part, which is characterized by a high groundwater vulnerability (orange colour).
In general, since the area is particularly rainy, with a mean annual precipitation between 1000 and 1100 mm and reference evapotranspiration (ET 0 ) between 800 and 900 mm, for this simulation, a quantity of nitrate up to 12 mg L 1 leaches toward the groundwater very rapidly, between 0 and 6 years.
The possibility of downloading all the used maps in ESRI format from the platform allowed us to further analyse the obtained results, further discretizing the time interval of the years for 50% of root leachate, as shown in Figure 7.
The areas characterized by a very high groundwater vulnerability (between 3 and 4 years) are those with shallowest groundwater table depths (between 0 and 2.6 m b.g.l.), while the orange to yellow areas (between 6 and 8 years) are characterized by deeper groundwater table depths (between 15 and 20 m b.g.l.), which determines that the nitrate leachate takes more time to travel across the soil and the vadose zone.
By analysing the map of soil types, it is evident that for the same type of soil (e.g., the dark violet polygons, classified as Alfisols), different time arrivals were obtained based on the groundwater table depths. Similarly, at the same groundwater table depths, different time arrivals can be obtained due the strong dependence of the transport processes on the hydraulic properties of each soil horizon.
In support of the previous analysis, the cumulative charts, obtained by downloading the results from the LS GUI and shown in Figure 8, complete the information with the time evolution of the cumulative nitrate arrival expressed in mg L 1 under two conditions:
1.
Two different soils with same groundwater table depth;
2.
Two different groundwater table depths with the same soil.
In the first case, the groundwater table depth was at 20 m b.g.l. and two different soils were selected: Entisols and Alfisols. Both soils exhibit very long mean travel times since the GWTD is very deep. However, their different hydraulic properties lead to differences in responses, with approximately 31 years for the Entisols and 37 years for the Alfisols. In fact, the first soils, primarly distributed along the coast and in riverbeds, are soils of recent origin, not developed and sandy and show faster arrivals of around 5.4 mg L 1 . Conversely, the Alfisols, are moderately leached soils with a subsurface horizon where clays have accumulated. They are predominant in the Sele plain and showing later arrivals of around 5.7 mg L 1 .
In the second case, the soil type was Alfisols while two different GWTD were considered: 4 m b.g.l. and 20 m b.g.l. The arrivals are different both in terms of travel times and of leached quantities. The Alfisol with the shallowest GWTD clearly demonstrates faster arrivals (mean travel times of 14 years) and, depending on its hydraulic and pedological properties, lower leached quantities (around 4 mg L 1 ). The Alfisols with the deeper GWTD showed longer mean travel times (37 years) and a bigger quantity of around 5.7 mg L 1 . These latter examples demonstrate that only by integrating all the information on soils, GWTD, managements and climates is it possible to gain a comprehensive understanding of the nitrogen and transport dynamics. This, in turn, enables the implementation of coherent actions at a local scale.
Additionally, the type of crop-management combination determines the lower vulnerability of the investigated area. In fact, as shown in Figure 9, by changing the type of rotation from tomato–alfalfa to tomato–fennel, the situation becomes worse. With the exception of a few soil polygons, vulnerability is very high across the area.
Eventually, the interested end-user can leverage the best practice tool, available in the LS platform, to conduct a comprehensive analysis in the area. For example, in the case of Entisols from the previous example, the best option for minimising the leaching is to reduce the N fertilizer rate by 30%, while considering the SOD-seeding and retaining the crop residues.
It is worth noticing that the obtained classification is in line with the vulnerability class obtained using the SINTACS method, as reported in [22], where the Sele alluvial plain is classified with a high to elevated vulnerability. Moreover, the annual classification of the groundwater bodies from the Campania Region measurements, for the investigated years, classifies the status of the Piana del Sele for 2015, 2016 and 2018 as “bad”, in accordance with the WFD standards.
The second example of the area in the eastern plain of Naples is shown as a comparison of the results obtained with the NFt and the VS2DTI model, a physically-based finite differences model, as applied in [21]. In the latter, simulations were conducted considering 10 years of rainfall, ET and common local farming management practices for N fertilizers. Results were presented in terms of Unsaturated Zone travel Time (UZT), detected from the breakthrough curve as the time starting from the nitrate input at the ground surface, at which C i / C 0 is greater than 1%, at different depths. It is important to stress that the latter approach is considered precautionary compared to those estimating the arrival time of 50% [23], such as the nitrate fate model.
By mean of the NFt, after having drawn a ROI in the same area, 10 years of crop rotation tomato–alfalfa were simulated with inorganic fertilizer at a dose of 140 kg ha 1 , defined according to the local standard practices. The included irrigation at 100% of the water consumption for the two crops and minimum tillage. Sectors characterized by shallower water table depths (0–10 m b.g.l.) are identified as highly vulnerable (red spots). Soils in these areas are classified as Inceptisols. The central sector, where GWTD vary between 10 and 20 m b.g.l., is identified as low vulnerability (light orange). Soils in these areas are classified as Andosols. Eventually, the green spot in the upper western part of the area is characterized by water table depths deeper than 20 m b.g.l., with a very low vulnerability. Soils in these areas are classified as Andosols. In such scenarios, it is evident that the depth of groundwater plays a key role in determining vulnerability. The type of soil is less significant in this environment, as the Andosols formed in this area are Vitric (https://www.fao.org/3/i3794en/I3794en.pdf, accessed on 7 Septemeber 2023) with moderately expressed andic features.
Upon comparing the time arrival maps obtained in [21], shown in the left plot, and in this study, shown in the right plot of Figure 10, it is clear that there is a good agreement between the outcomes:
  • Areas where UZT exceeds 2000 days can be compared to areas where the years for the 50% root leachate are around 11;
  • Areas where UZT range between 1000 and 2000 days can be compared to areas where the years for the 50% root leachate are around 7;
  • Areas where UZT are less than 1000 days can be compared to areas where the years for the 50% root leachate are around 6.
The main differences between the outputs are due to the spatial resolution of the input maps underlying the two approaches, since the one presented in [21] considers a 5 × 5 m raster data, while the soil polygon in the core of the NFt are extracted from 1:50,000 map. However, the great flexibility of the LS-GCI, enables easy incorporation of new detailed data layers, enhancing the spatial resolution of the tool results.
The preceding results serve as an illustrative example for the local public authorities who can use the tool for a detailed definition of the NVZ. This physically-based tool, freely accessible and web-based, supports what-if scenario analyse for areas both small and large, utilizing continuously updated dataset (e.g., climate data or soil dataset). Conducting what-if scenario analyses on a local level for nitrate vulnerability assessment also aids in identifying zone prone to become more or less vulnerable under specific conditions of climate–crop–soil–groundwater depth.

5. Discussion and Conclusions

To grasp the full scope of this work, it is essential to place it within a broader context, considering its underlying rationale, research endeavours and potential impacts. As outlined in Section 1 and detailed in Appendix A, there are already several existing alternatives for assessing groundwater vulnerability to nitrate, encompassing both modelling and DSS perspectives. At the same time, bridging the gap between the huge amount of data produced (e.g., remotes sensing, modelling, IoT, etc.) and practical, science-based operational tools remains a pertinent challenge in current research [24]. The uniqueness of the proposed approach and its rationale lay in the transdisciplinarity and integration of multiple state-of-art data, technologies and models.
The term “transdisciplinarity” is not only frequently used but also notoriously difficult to achieve. This work, however, centred precisely on this aspect. It involved the integration of multiple datasets, each with different spatial and temporal resolutions, across numerous case studies. This integration extended to different modelling solutions, encompassing both from the conceptual and from the IT aspects. Testing these modelling solutions, devising an interface and tailoring outputs to meet the requirements of both researchers and end-users were just some of the challenges tackled during the development of the tool. Moreover, it is worth noticing that every aspect of the tool can be changed and improved easily upon request.
The following list can help the reader to better understand the tangible impacts of the proposed approach:
  • New data from land use, spatial modelling and enhanced connections between different datasets will improve the knowledge of land resource availability. For instance, new maps of land use and soil types will allow for the best land management possible, at the local scale;
  • The possibility of alternative scenarios to be chosen by a large set of users gives both the knowledge and the quantification of trade-off between alternative use of the land;
  • The climate change datasets, available in the LandSupport database and which are going to feed the modelling engines of the NFt, enable the evaluation of climate resilience in agriculture. This, in turn, allows for the assessment of various mitigation and adaptation strategies;
  • The NFt resulted from multiple interactions with several project partners and stakeholders, in the view of increasing impact of science on sociatal policies, as outlined in the European competence framework of researcher https://research-and-innovation.ec.europa.eu/jobs-research/researchcomp-european-competence-framework-researchers_en, accessed on 7 Septemeber 2023.
Under the perspective of the previous points, it is also important to stress how the tool can contribute to the achievement of multiple SDGs. For instance:
  • SDG 3.9, which targets a substantial reduction in deaths and illnesses caused by hazardous chemicals and air, water, and soil pollution and contamination, can benefit from the NFt to evaluate how to diminish the fertilizers—maintaining a good level of income for farmers—taking into account the climate, soils and crop types.
  • SDG 6.3, aimed at improving water quality by reducing pollution, is addressed by the NFt’s consideration of the hydrological properties of soils, subsoils and the groundwater table depths in assessing land use impact on the water resources.
  • SDG 12.2, focusing on sustainable and efficient natural resources management, can utilize the NFt to evaluate the trade-off between the crop production and crop management practices (irrigation, fertilization, tillage and residue).
  • SDG 15.3, centred on the restoration of degraded land and soil, benefits the NFt’s incorporation of spatial variability of soils, land use and pedoclimatic conditions, allowing for the evaluation of their diverse responses to the multiple management practices.
Future development and implementations of the NFt are foreseen for new areas, crop rotations and types of management, as soon as a new dataset for new areas will be available. This expansion is made feasible by the remarkable flexibility of the LandSupport infrastructure and the robust coupling of the two state-of-the-art models: the crop-growth ARMOSA model and the transport TFM-ext model.

Author Contributions

M.B. (Marialaura Bancheri): conceptualization, methodology, software, data curation, Writing—original draft, writing—review and editing. A.B. (Angelo Basile): conceptualization, methodology, supervision, writing—review and editing, visualization, funding acquisition. M.B. (Marco Botta): software, data curation. G.L.: software, data curation and writing—review. F.C.: software, data curation. A.B. (Antonello Bonfante): writing—review and editing. G.F.: data curation. M.A.: conceptualization, software, supervision. A.P.: conceptualization, methodology, software, data curation, supervision, writing—original draft, writing—review and editing. All authors have read and agreed to the published version of the manuscript.

Funding

This research was funded by the EC H2020 LANDSUPPORT project, grant number 774234.

Institutional Review Board Statement

Not applicable.

Informed Consent Statement

Not applicable.

Data Availability Statement

The datasets generated during and/or analysed during the current study are available from the corresponding author upon reasonable request.

Conflicts of Interest

The authors declare no conflict of interest.

Appendix A

Groundwater vulnerability is commonly defined as the susceptibility of groundwater to be negatively affected by a contaminant injected from the land surface [25] and transported across the unsaturated and saturated zones. Vulnerability can be distinguished in [26]:
  • “vulnerability to a contaminant arrival” as the likelihood of a generic contaminant arriving in groundwater;
  • “vulnerability to pollution” as the likelihood of exceeding a contaminant threshold concentration in groundwater.
Both these aspects are essential to local managers and stakeholders, as they consider all the land pressures, pedological and hydro-geological conditions of the unsaturated and saturated zone.
The assessment of vulnerability, encompassing both intrinsic, i.e., the vulnerability due to the physical properties of the system and independent from the type of contaminants [27], and the specific, related to particular contaminants, can be made through different methods: qualitative [28], parametric [22,29] and numerical. In the latter categories, the travel time of a pollutant through the unsaturated zone is among the most used indicators, which can be estimated by analytical advective–dispersive transport models [30], finite element models [21,31] or type transfer functions (TTFs) [5].
A more comprehensive insight into specific vulnerability to nitrate pollution can be obtained by coupling multiple models and approaches. For example, in [32], the hydrological models HYDRUS-2D and crop-growth DSSAT were used to simulate water flow and nutrient leaching in potato farms [33], coupling with Geographic Information System (GIS), statistics and machine learning methods for both water quality assessment and prediction for the Eocene Aquifer, Palestine.

References

  1. Harrison, S.; McAree, C.; Mulville, W.; Sullivan, T. The problem of agricultural ‘diffuse’ pollution: Getting to the point. Sci. Total Environ. 2019, 677, 700–717. [Google Scholar] [CrossRef]
  2. Reinhard, S.; Linderhof, V. Convergence of EU nitrogen surplus, the RDP indicator of water quality. Ecol. Indic. 2015, 59, 19–26. [Google Scholar] [CrossRef]
  3. Biernat, L.; Taube, F.; Vogeler, I.; Reinsch, T.; Kluß, C.; Loges, R. Is organic agriculture in line with the EU-Nitrate directive? On-farm nitrate leaching from organic and conventional arable crop rotations. Agric. Ecosyst. Environ. 2020, 298, 106964. [Google Scholar] [CrossRef]
  4. Musacchio, A.; Mas-Pla, J.; Soana, E.; Re, V.; Sacchi, E. Governance and groundwater modelling: Hints to boost the implementation of the EU Nitrate Directive. The Lombardy Plain case, N Italy. Sci. Total Environ. 2021, 782, 146800. [Google Scholar] [CrossRef]
  5. Bancheri, M.; Fusco, F.; Dalla Torre, D.; Terribile, F.; Manna, P.; Langella, G.; De Vita, P.; Allocca, V.; Loishandl-Weisz, H.; Hermann, T.; et al. The pesticide fate tool for groundwater vulnerability assessment within the geospatial decision support system LandSupport. Sci. Total Environ. 2022, 807, 150793. [Google Scholar] [CrossRef]
  6. Zhai, Z.; Martínez, J.F.; Beltran, V.; Martínez, N.L. Decision support systems for agriculture 4.0: Survey and challenges. Comput. Electron. Agric. 2020, 170, 105256. [Google Scholar] [CrossRef]
  7. Manna, P.; Bonfante, A.; Colandrea, M.; Di Vaio, C.; Langella, G.; Marotta, L.; Mileti, F.A.; Minieri, L.; Terribile, F.; Vingiani, S.; et al. A geospatial decision support system to assist olive growing at the landscape scale. Comput. Electron. Agric. 2020, 168, 105143. [Google Scholar] [CrossRef]
  8. Casper, M.; Grimm-Strele, J.; Lambrecht, H.; Finck, M.; Graveline, N.; Gudera, T.; Korte, S.; Schneider, B.; van Dijk, P. EU-Project MoNit: A DSS to assess the impact of actions and changing frameworks on the nitrate load in the Upper Rhine Valley aquifer. IAHS Publ.-Ser. Proc. Rep. 2007, 317, 96–101. [Google Scholar]
  9. Brown, L.; Scholefield, D.; Jewkes, E.; Lockyer, D.; Del Prado, A. NGAUGE: A decision support system to optimise N fertilisation of British grassland for economic and environmental goals. Agric. Ecosyst. Environ. 2005, 109, 20–39. [Google Scholar] [CrossRef]
  10. Calabrese, A.; Blonda, M.; Mandrelli, L.; Loi, E.; Barca, E.; Pappagallo, G.; Buono, V.; Toriello, M.; Riezzo, E.E. DEMETRA-DSS: New Technologies for the Protection of Water from Nitrate Pollution of Agricultural Origin. Environ. Sci. Proc. 2022, 21, 46. [Google Scholar]
  11. Ramon-Cortes, C.; Serven, A.; Ejarque, J.; Lezzi, D.; Badia, R.M. Transparent Orchestration of Task-based Parallel Applications in Containers Platforms. J. Grid Comput. 2018, 16, 137–160. [Google Scholar] [CrossRef]
  12. Perego, A.; Giussani, A.; Sanna, M.; Fumagalli, M.; Carozzi, M.; Alfieri, L.; Brenna, S.; Acutis, M. The ARMOSA simulation crop model: Overall features, calibration and validation results. Ital. J. Agrometeorol. 2013, 3, 23–38. [Google Scholar]
  13. Allen, R.G.; Pereira, L.S.; Raes, D.; Smith, M. Crop evapotranspiration-Guidelines for computing crop water requirements-FAO Irrigation and drainage paper 56. Fao Rome 1998, 300, D05109. [Google Scholar]
  14. Van Diepen, C.V.; Wolf, J.V.; Van Keulen, H.; Rappoldt, C. WOFOST: A simulation model of crop production. Soil Use Manag. 1989, 5, 16–24. [Google Scholar] [CrossRef]
  15. Johnsson, H.; Bergstrom, L.; Jansson, P.E.; Paustian, K. Simulated nitrogen dynamics and losses in a layered agricultural soil. Agric. Ecosyst. Environ. 1987, 18, 333–356. [Google Scholar] [CrossRef]
  16. Van Genuchten, M.T. A closed-form equation for predicting the hydraulic conductivity of unsaturated soils. Soil Sci. Soc. Am. J. 1980, 44, 892–898. [Google Scholar] [CrossRef]
  17. Puig-Sirera, À.; Acutis, M.; Bancheri, M.; Bonfante, A.; Botta, M.; De Mascellis, R.; Orefice, N.; Perego, A.; Russo, M.; Tedeschi, A.; et al. Zero-Tillage Effects on Durum Wheat Productivity and Soil-Related Variables in Future Climate Scenarios: A Modeling Analysis. Agronomy 2022, 12, 331. [Google Scholar] [CrossRef]
  18. Jury, W.A.; Roth, K. Transfer Functions and Solute Movement through Soil: Theory and Applications; Birkhäuser Verlag: Basel, Switzerlands; Boston, MA, USA, 1990; ISBN 37643250970817625097. [Google Scholar]
  19. Scotter, D.; Ross, P. The upper limit of solute dispersion and soil hydraulic properties. Soil Sci. Soc. Am. J. 1994, 58, 659–663. [Google Scholar] [CrossRef]
  20. Zhang, R. Generalized transfer function model for solute transport in heterogeneous soils. Soil Sci. Soc. Am. J. 2000, 64, 1595–1602. [Google Scholar] [CrossRef]
  21. Fusco, F.; Allocca, V.; Coda, S.; Cusano, D.; Tufano, R.; De Vita, P. Quantitative assessment of specific vulnerability to nitrate pollution of shallow alluvial aquifers by process-based and empirical approaches. Water 2020, 12, 269. [Google Scholar] [CrossRef]
  22. Tufano, R.; Allocca, V.; Coda, S.; Cusano, D.; Fusco, F.; Nicodemo, F.; Pizzolante, A.; De Vita, P. Groundwater vulnerability of principal aquifers of the Campania region (southern Italy). J. Maps 2020, 16, 565–576. [Google Scholar] [CrossRef]
  23. Neukum, C.; Azzam, R. Quantitative assessment of intrinsic groundwater vulnerability to contamination using numerical simulations. Sci. Total Environ. 2009, 408, 245–254. [Google Scholar] [CrossRef] [PubMed]
  24. Gandomi, A.; Haider, M. Beyond the hype: Big data concepts, methods, and analytics. Int. J. Inf. Manag. 2015, 35, 137–144. [Google Scholar] [CrossRef]
  25. Foster, S.; Hirata, R.; Andreo, B. The aquifer pollution vulnerability concept: Aid or impediment in promoting groundwater protection? Hydrogeol. J. 2013, 21, 1389. [Google Scholar] [CrossRef]
  26. Lasagna, M.; De Luca, D.A.; Franchino, E. Intrinsic groundwater vulnerability assessment: Issues, comparison of different methodologies and correlation with nitrate concentrations in NW Italy. Environ. Earth Sci. 2018, 77, 277. [Google Scholar] [CrossRef]
  27. Gogu, R.C.; Dassargues, A. Current trends and future challenges in groundwater vulnerability assessment using overlay and index methods. Environ. Geol. 2000, 39, 549–559. [Google Scholar] [CrossRef]
  28. Albinet, M.; Margat, J. Cartographie de la Vulnérabilité à la Pollution des Nappes d’eau Souterraine. Bull. BRGM 1970, 3, 13–22. [Google Scholar]
  29. Civita, M. The combined approach when assessing and mapping groundwater vulnerability to contamination. J. Water Resour. Prot. 2010, 2010, 1185. [Google Scholar] [CrossRef]
  30. Connell, L.; Van den Daele, G. A quantitative approach to aquifer vulnerability mapping. J. Hydrol. 2003, 276, 71–88. [Google Scholar] [CrossRef]
  31. Holman, I.P.; Dubus, I.G.; Hollis, J.; Brown, C.D. Using a linked soil model emulator and unsaturated zone leaching model to account for preferential flow when assessing the spatially distributed risk of pesticide leaching to groundwater in England and Wales. Sci. Total Environ. 2004, 318, 73–88. [Google Scholar] [CrossRef]
  32. McKinnie, F.W.; Graham, W.D.; Jones, J.W.; Graetz, D.A. Modeling and Monitoring the Water and Nitrate Transport and Potato Growth at a Vegetable Farm in the Suwannee River Basin, FL. In Proceedings of the 2003 ASAE Annual Meeting, Las Vegas, NV, USA, 27–30 July 2003; American Society of Agricultural and Biological Engineers: St. Joseph, MI, USA, 2003; p. 1. [Google Scholar]
  33. Judeh, T.; Almasri, M.N.; Shadeed, S.M.; Bian, H.; Shahrour, I. Use of GIS, Statistics and Machine Learning for Groundwater Quality Management: Application to Nitrate Contamination. Water Resour. 2022, 49, 503–514. [Google Scholar] [CrossRef]
Figure 1. View of the LS graphical user interface and its main parts: layer manager, visualization area, scale selection, Tool for the ROI and Toolbox/Results tabs where, under the Challenge Land Degradation and SDG 15.3/ Nitrates and Pesticide Directives menu, the NFt can be found.
Sustainability 15 14164 g001
Figure 2. Implementation of the nitrate fate tool within the LandSupport GCI.
Sustainability 15 14164 g002
Figure 3. Coupling of the crop-growth ARMOSA model, on the left, and of the Extended Transfer Function Model, on the right.
Sustainability 15 14164 g003
Figure 4. Workflow of the coupling of the ARMOSA and TFM-ext models, starting from the end-user requests. The out-to-in connections allow the evaluation of the cumulative nitrate leachate at the groundwater table depth and the time for the 50% arrival.
Sustainability 15 14164 g004
Figure 5. Localization of the area in the eastern plain of Naples and of the Sele Plain, south of Italy. The coloured polygons represent the soil units.
Sustainability 15 14164 g005
Figure 6. Nitrate fate tool application in a ROI drawn in the Piana del Sele, simulating the rotation tomato–alfalfa, with inorganic fertilization, irrigation at 100% of the crop demand, minimum tillage and retained residue. The legend, in the left panel of the LS GUI, helps with the interpretation of the map colours.
Sustainability 15 14164 g006
Figure 7. The map of the groundwater vulnerability is compared to the map of the water table depths and soil types, in a sub-region of the ROI, for a more comprehensive analysis of the simulation results.
Sustainability 15 14164 g007
Figure 8. Time evolution of the arrival at the GWT depth of the cumulative root leachate for two cases: two different soils, Entisols (blue line) and Alfisols (orange line) and same GWTD at 20 m b.g.l.; two different depths, 4 m b.g.l. (green line) and 20 m b.g.l. (orange line) and the same type of soil.
Sustainability 15 14164 g008
Figure 9. Comparison of the groundwater vulnerability for a sub-region of the ROI, considering different crop rotations: tomato–alfalfa vs. tomato–fennel.
Sustainability 15 14164 g009
Figure 10. The left plot, adapted from [21], shows the UZT obtained using the VS2DTI model. The right plot shows the number of years for the arrival of the 50% root leachate, obtained from a NFt simulation, launched through the LS-GCI.
Sustainability 15 14164 g010
Table 1. Example of alternative DSS tools for the assessment of specific groundwater vulnerability to nitrate pollution.
NameCase StudiesTypeApplied MethodsAvailability
LS-NFt (v 1.0)Campania (IT), Marchfeld (AT) and Zala (HU)dynamical, real-timecrop-growth and nitrate transfer modelweb-based, free and open-source
MoNit (v 1.0)Upper Rhine Valleystatic scenarioscrop-growth, nitrate transfer, GW flow and socio-economic models-
NGAUGE (v 1.0)UKstatic scenariosempirically-based model of N cyclingdesktop software
DEMETRA (v 1.0)Dresaim basin (DE)dynamicalmonitoring physico-chemical and biomolecular propertiesWEB-GIS, inter-operational geo-database
Disclaimer/Publisher’s Note: The statements, opinions and data contained in all publications are solely those of the individual author(s) and contributor(s) and not of MDPI and/or the editor(s). MDPI and/or the editor(s) disclaim responsibility for any injury to people or property resulting from any ideas, methods, instructions or products referred to in the content.

