
A Learning Progression for Understanding Interdependent Relationships in Ecosystems


Abstract
:1. Introduction
1.1. The Value of Learning Progressions
1.2. Review of Prior Learning Progression Research in Ecosystems
1.3. Research Question
2. Materials and Methods
2.1. Sample
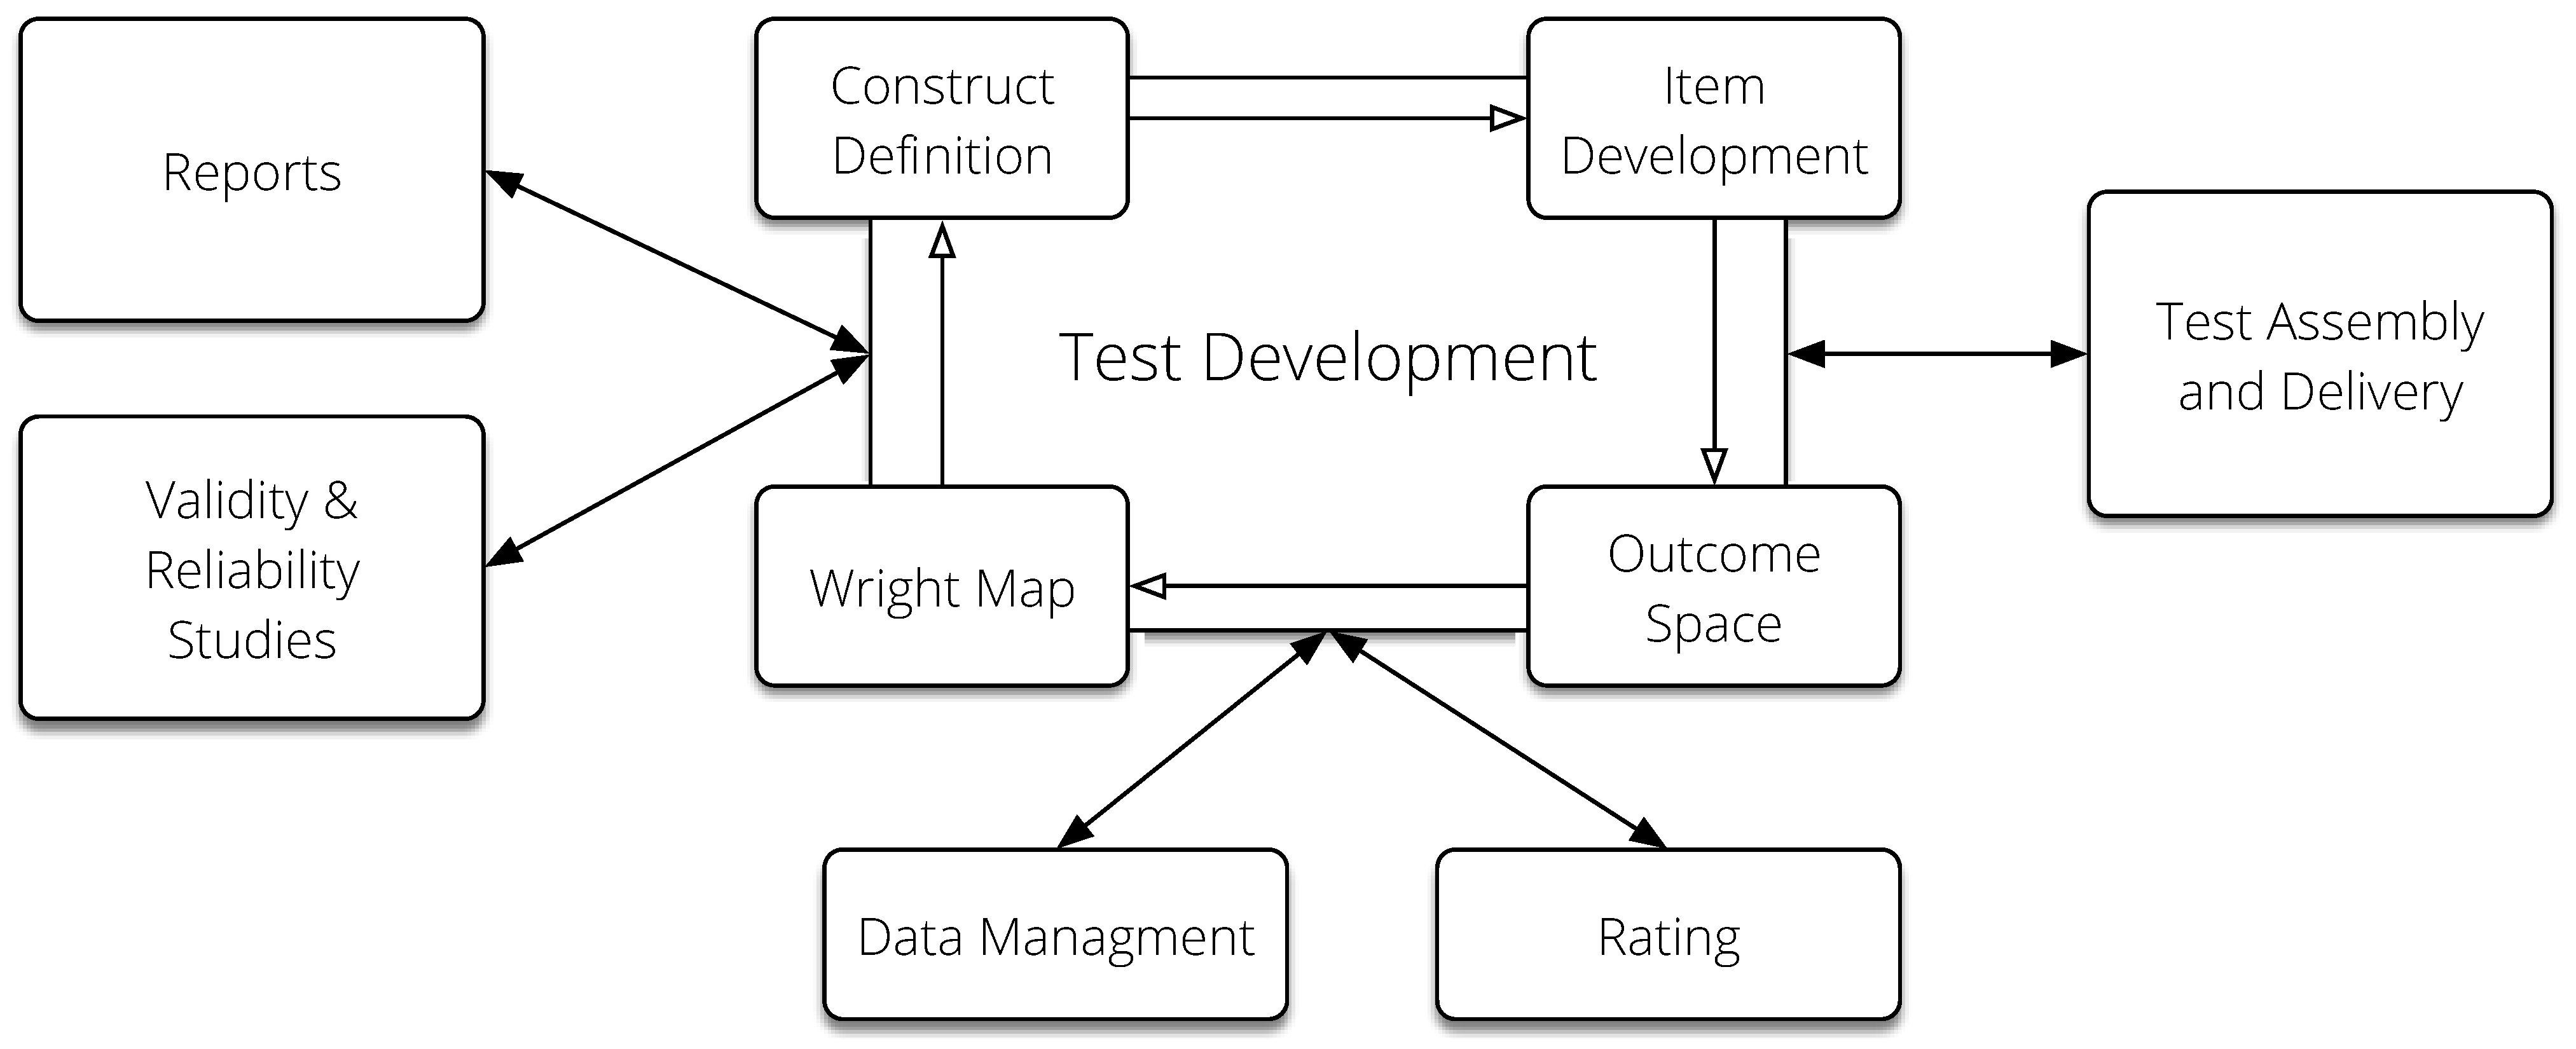
2.2. Overview of Procedure
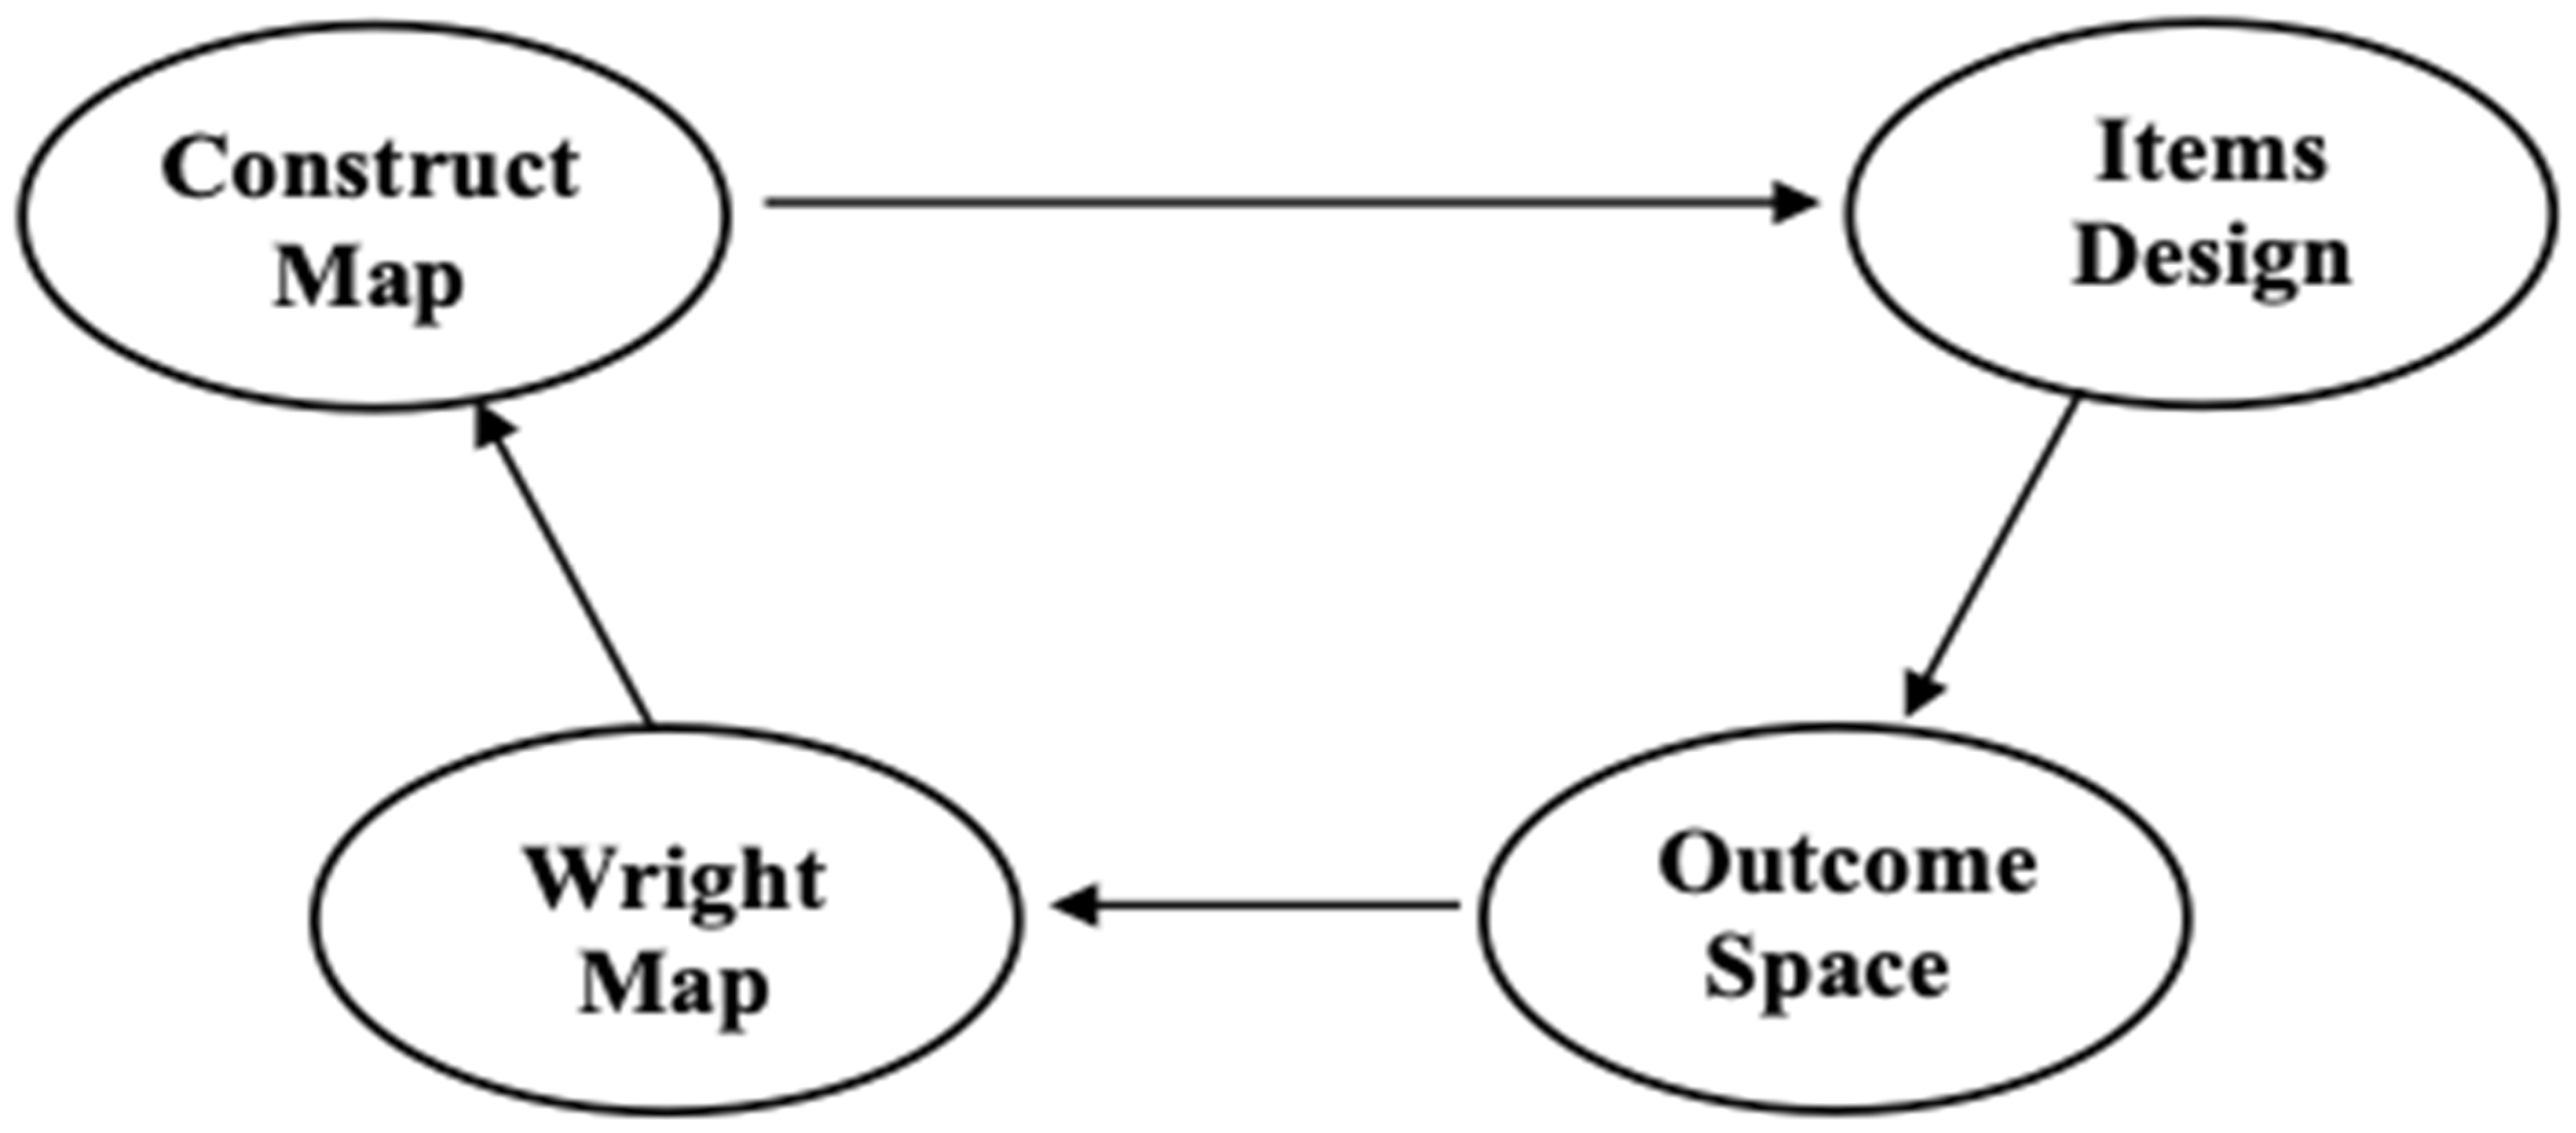
2.3. Construct Map/Learning Progression
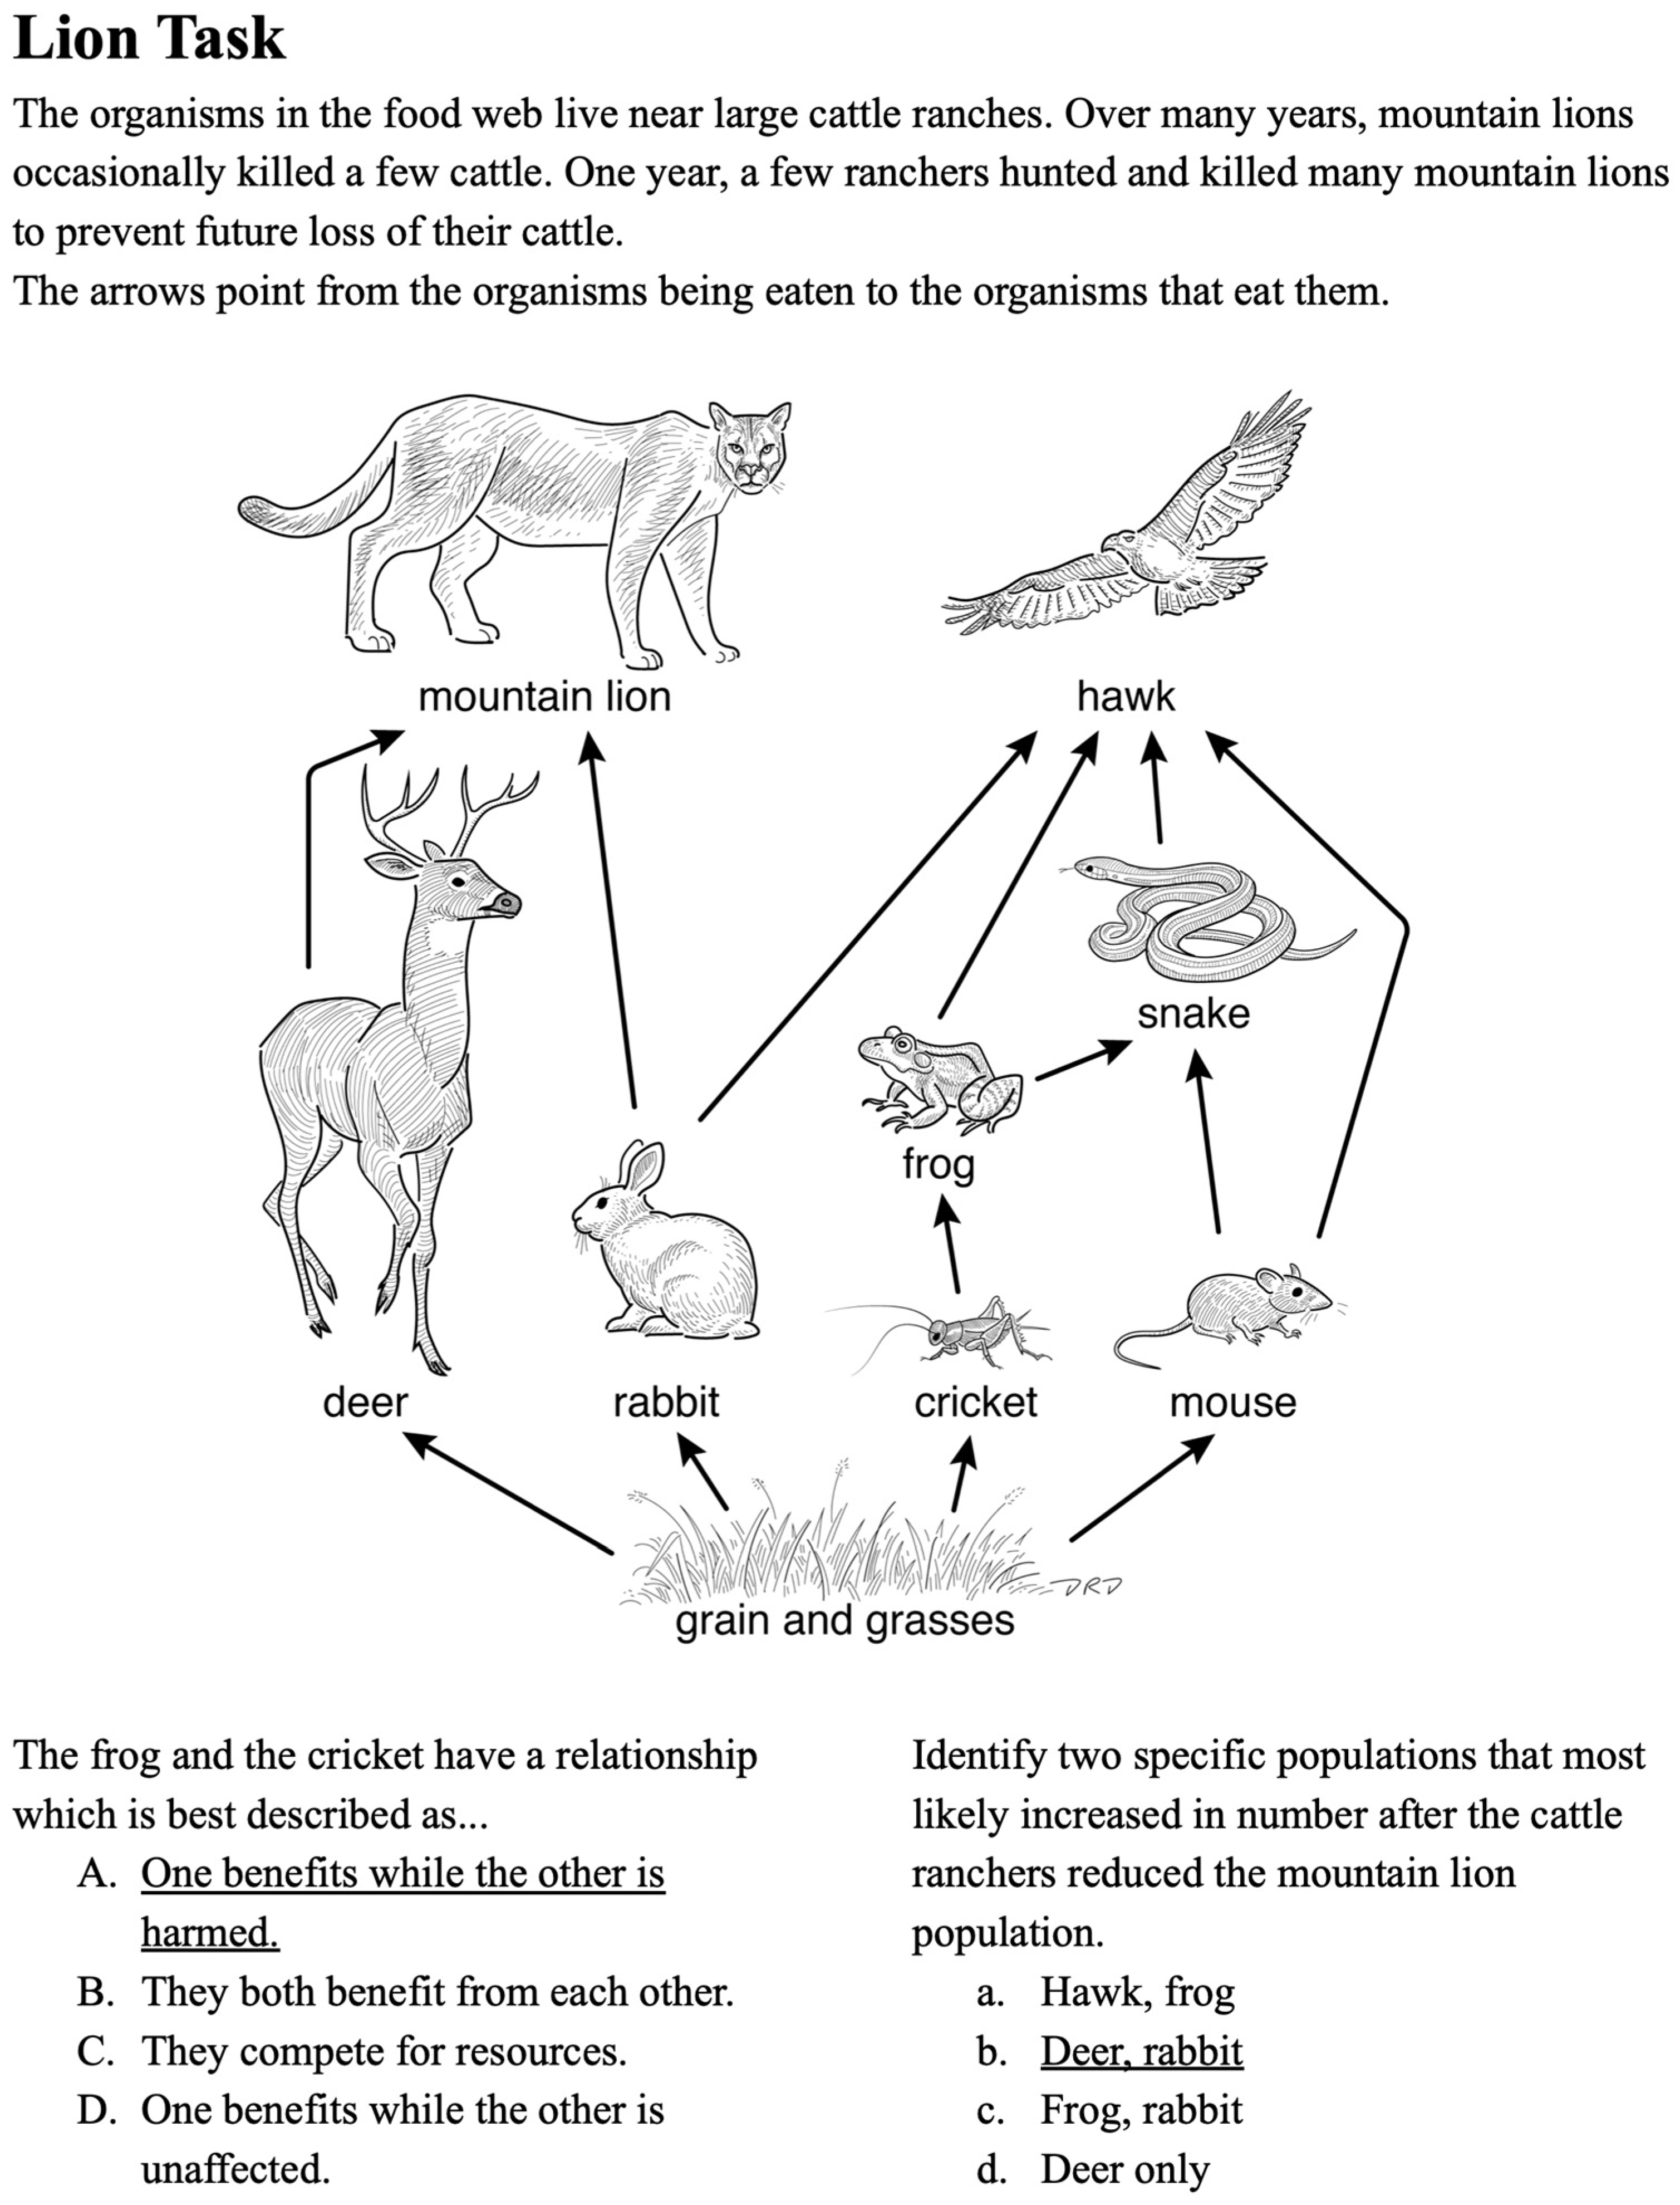
2.4. Items Design
2.5. Outcome Space
2.6. Wright Map
2.7. Test Administrations and Revisions
3. Results
3.1. Rasch Modeling
3.2. Reliability
3.3. Differential Item Functioning
3.4. Validated Learning Progression
4. Discussion
4.1. Implications for Practice
4.2. Limitations and Implications for Future Research and Theory
5. Conclusions
Supplementary Materials
Author Contributions
Funding
Institutional Review Board Statement
Informed Consent Statement
Data Availability Statement
Acknowledgments
Conflicts of Interest
References
- Berkes, F.; Colding, J.; Folke, C. Rediscovery of Traditional Ecological Knowledge as Adaptive Management. Ecol. Appl. 2000, 10, 1251–1262. [Google Scholar] [CrossRef]
- Hoagland, S.J. Integrating Traditional Ecological Knowledge with Western Science for Optimal Natural Resource Management. IK Other Ways Knowing 2017, 3, 1–15. [Google Scholar]
- Merritt, E.G.; Bowers, N. Missed Opportunities for Observation-Based Ecology in the Next Generation Science Standards. Sci. Educ. 2020, 104, 619–640. [Google Scholar] [CrossRef]
- Egerton, F.N. A History of the Ecological Sciences: Early Greek Origins. Bull. Ecol. Soc. Am. 2001, 82, 93–97. [Google Scholar]
- Banilower, E.R.; Smith, P.S.; Malzahn, K.A.; Plumley, C.L.; Gordon, E.M.; Hayes, M.L. Report of the 2018 NSSME+; Horizon Research, Inc.: Chapel Hill, NC, USA, 2018. [Google Scholar]
- Scott, E.E.; Wenderoth, M.P.; Doherty, J.H. Learning Progressions: An Empirically Grounded, Learner-Centered Framework to Guide Biology Instruction. CBE Life Sci. Educ. 2019, 18, es5. [Google Scholar] [CrossRef]
- Duschl, R.A.; Maeng, S.; Sezen, A. Learning Progressions and Teaching Sequences: A Review and Analysis. Stud. Sci. Educ. 2011, 47, 123–182. [Google Scholar] [CrossRef]
- National Research Council. Taking Science to School: Learning and Teaching Science in Grades K-8; National Academies Press: Washington, DC, USA, 2007. [Google Scholar]
- Sikorski, T.-R. Context-Dependent “Upper Anchors” for Learning Progressions. Sci. Educ. 2019, 28, 957–981. [Google Scholar] [CrossRef]
- Furtak, E.M.; Morrison, D.; Kroog, H. Investigating the Link between Learning Progressions and Classroom Assessment. Sci. Educ. 2014, 98, 640–673. [Google Scholar] [CrossRef]
- Baxter, G.P.; Glaser, R. Investigating the Cognitive Complexity of Science Assessments. Educ. Meas. Issues Pract. 1998, 17, 37–45. [Google Scholar] [CrossRef]
- Alonzo, A.C.; Wooten, M.M.; Christensen, J. Learning Progressions as a Simplified Model: Examining Teachers’ Reported Uses to Inform Classroom Assessment Practices. Sci. Educ. 2022, 106, 852–889. [Google Scholar] [CrossRef]
- Rasch, G. Probabilistic Models for Some Intelligence and Attainment Tests; Expanded Ed.; University of Chicago Press: Chicago, IL, USA, 1980. [Google Scholar]
- Corcoran, T.B.; Mosher, F.A.; Rogat, A. Learning Progressions in Science: An Evidence-Based Approach to Reform; CPRE Research Reports; Columbia University: New York, NY, USA, 2009. [Google Scholar]
- Wiser, M.; Smith, C.L.; Doubler, S. Learning Progressions as Tools. In Learning Progressions in Science: Current Challenges and Future Directions; Alonzo, A.C., Gotwals, A.W., Eds.; Brill|Sense: Rotterdam, The Netherlands, 2012; pp. 359–403. ISBN 9789460918247. [Google Scholar]
- Alonzo, A.C.; Elby, A. Beyond Empirical Adequacy: Learning Progressions as Models and Their Value for Teachers. Cogn. Instr. 2019, 37, 1–37. [Google Scholar] [CrossRef]
- Furtak, E.M. Linking a Learning Progression for Natural Selection to Teachers’ Enactment of Formative Assessment. J. Res. Sci. Teach. 2012, 49, 1181–1210. [Google Scholar] [CrossRef]
- Shepard, L.A. Learning Progressions as Tools for Assessment and Learning. Appl. Meas. Educ. 2018, 31, 165–174. [Google Scholar] [CrossRef]
- Gotwals, A.W.; Songer, N.B. Validity Evidence for Learning Progression-Based Assessment Items That Fuse Core Disciplinary Ideas and Science Practices. J. Res. Sci. Teach. 2013, 50, 597–626. [Google Scholar] [CrossRef]
- Gotwals, A.W.; Songer, N.B. Reasoning up and down a Food Chain: Using an Assessment Framework to Investigate Students’ Middle Knowledge. Sci. Educ. 2010, 94, 259–281. [Google Scholar] [CrossRef]
- Hokayem, H.; Gotwals, A.W. Early Elementary Students’ Understanding of Complex Ecosystems: A Learning Progression Approach. J. Res. Sci. Teach. 2016, 53, 1524–1545. [Google Scholar] [CrossRef]
- Hovardas, T. A Learning Progression Should Address Regression: Insights from Developing Non-Linear Reasoning in Ecology. J. Res. Sci. Teach. 2016, 53, 1447–1470. [Google Scholar] [CrossRef]
- Songer, N.B.; Kelcey, B.; Gotwals, A.W. How and When Does Complex Reasoning Occur? Empirically Driven Development of a Learning Progression Focused on Complex Reasoning about Biodiversity. J. Res. Sci. Teach. 2009, 46, 610–631. [Google Scholar] [CrossRef]
- Board on Science Education; Division of Behavioral and Social Sciences and Education; Committee on Conceptual Framework for the New K-12 Science Education Standards; National Research Council. A Framework for K-12 Science Education: Practices, Crosscutting Concepts, and Core Ideas; Quinn, H., Schweingruber, H.A., Keller, T., Eds.; National Academies Press: Washington, DC, USA, 2012; ISBN 9780309217422. [Google Scholar]
- NGSS Lead States. Next Generation Science Standards: For States, By States; The National Academies Press: Washington, DC, USA, 2013. [Google Scholar]
- Morell, L.; Suksiri, W.; Dozier, S.; Osborne, J.; Wilson, M. An Exploration of Selected-Response Items Compared to Constructed-Response Item Types in Science Education. In Proceedings of the National Council on Measurement in Education Conference, Online, 9–11 September 2020. [Google Scholar]
- Osborne, J.F.; Henderson, J.B.; MacPherson, A.C.; Szu, E.; Wild, A.; Yao, S.Y. The Development and Validation of a Learning Progression for Argumentation in Science. J. Res. Sci. Teach. 2016, 53, 821–846. [Google Scholar] [CrossRef]
- Jin, H.; Shin, H.J.; Hokayem, H.; Qureshi, F.; Jenkins, T. Secondary Students’ Understanding of Ecosystems: A Learning Progression Approach. Int. J. Sci. Math. Educ. 2017, 17, 217–235. [Google Scholar] [CrossRef]
- Jin, H.; Mikeska, J.N.; Hokayem, H.; Mavronikolas, E. Toward Coherence in Curriculum, Instruction, and Assessment: A Review of Learning Progression Literature. Sci. Educ. 2019, 103, 1206–1234. [Google Scholar] [CrossRef]
- Duncan, R.G.; Gotwals, A.W. A Tale of Two Progressions: On the Benefits of Careful Comparisons. Sci. Educ. 2015, 99, 410–416. [Google Scholar] [CrossRef]
- Chandler, M.J. The Development of Dynamic System Reasoning. Hum. Dev. 1992, 35, 121–137. [Google Scholar] [CrossRef]
- Eilam, B. System Thinking and Feeding Relations: Learning with a Live Ecosystem Model. Instr. Sci. 2012, 40, 213–239. [Google Scholar] [CrossRef]
- Hogan, K. Assessing Students Systems Reasoning in Ecology. J. Biol. Educ. 2000, 35, 22–28. [Google Scholar] [CrossRef]
- Hokayem, H.; Ma, J.; Jin, H. A Learning Progression for Feedback Loop Reasoning at Lower Elementary Level. J. Biol. Educ. 2015, 49, 246–260. [Google Scholar] [CrossRef]
- Mambrey, S.; Schreiber, N.; Schmiemann, P. Young Students’ Reasoning about Ecosystems: The Role of Systems Thinking, Knowledge, Conceptions, and Representation. Res. Sci. Educ. 2022, 52, 79–98. [Google Scholar] [CrossRef]
- American Educational Research Association; American Psychological Association; National Council on Measurement in Education. Standards for Educational and Psychological Testing; American Education Research Association: Washington, DC, USA, 2014. [Google Scholar]
- National Research Council. Developing Assessments for the Next Generation Science Standards; The National Academies Press: Washington, DC, USA, 2014. [Google Scholar]
- Wilson, M. Constructing Measures, 2nd ed.; Routledge: New York, NY, USA, 2023. [Google Scholar]
- Mislevy, R.J.; Almond, R.G.; Lukas, J.F. A Brief Introduction to Evidence-Centered Design; Educational Testing Service: Princeton, NJ, USA, 2003. [Google Scholar]
- Mislevy, R.J.; Steinberg, L.S.; Almond, R.G. On the Structure of Educational Assessments. Measurement 2003, 1, 3–62. [Google Scholar]
- Pellegrino, W.; Chudowsky, N.; Glaser, R. Knowing What Students Know: The Science and Design of Educational Assessment; National Academies Press: Washington, DC, USA, 2001. [Google Scholar]
- MacPherson, A.C. A Comparison of Scientists’ Arguments and School Argumentation Tasks. Sci. Educ. 2016, 100, 1062–1091. [Google Scholar] [CrossRef]
- American Association for the Advancement of Science. Atlas of Science Literacy; National Academies Press: Washington, DC, USA, 2001; Volume 1. [Google Scholar]
- Shea, N.A.; Duncan, R.G. From Theory to Data: The Process of Refining Learning Progressions. J. Learn. Sci. 2013, 22, 7–32. [Google Scholar] [CrossRef]
- Hayes, M.L.; Plumley, C.L.; Smith, P.S.; Esch, R.K. A Review of the Research Literature on Teaching about Interdependent Relationships in Ecosystems to Elementary Students; Horizon Research: Chapel Hill, NC, USA, 2017. [Google Scholar]
- Parker, A.; Tritter, J. Focus Group Method and Methodology: Current Practice and Recent Debate. Int. J. Res. Method Educ. 2006, 29, 23–37. [Google Scholar] [CrossRef]
- Duncker, K. On Problem-Solving. Psychol. Monogr. 1945, 58, 1–113. [Google Scholar] [CrossRef]
- Ericsson, A.K.; Simon, H.A. Protocol Analysis: Verbal Reports as Data; Revised edition; MIT Press: Cambridge, MA, USA, 1993. [Google Scholar]
- Birks, M.; Chapman, Y.; Francis, K. Memoing in Qualitative Research: Probing Data and Processes. J. Res. Nurs. 2008, 13, 68–75. [Google Scholar] [CrossRef]
- Saldaña, J.; Omasta, M. Qualitative Research: Analyzing Life; SAGE Publications: Thousand Oaks, CA, USA, 2017; ISBN 9781506305493. [Google Scholar]
- De Ayala, R.J. The Theory and Practice of Item Response Theory; Guilford Press: New York, NY, USA, 2009. [Google Scholar]
- Wright, B.D.; Masters, G.N. Rating Scale Analysis; MESA Press: Chicago, IL, USA, 1982; ISBN 9780941938013. [Google Scholar]
- Mari, L.; Wilson, M.; Maul, A. Measurement Across the Sciences: Developing a Shared Concept System for Measurement, 2nd ed.; Springer: New York, NY, USA, 2023; ISBN 9783031224508. [Google Scholar]
- Adams, R.J.; Wu, M.; Wilson, M. ConQuest 5.0; ACER: Hawthorn, Australia, 2021. [Google Scholar]
- Paek, I. Three Statistical Testing Procedures in Logistic Regression: Their Performance in Differential Item Functioning (DIF) Investigation; ETS: Princeton, NJ, USA, 2009; Volume 2009, pp. 1–29. [Google Scholar]
- Lord, F.M.; Novick, M.R. Statistical Theories of Mental Test Scores; Addison-Wesley: Reading, MA, USA, 1968. [Google Scholar]
- Field, A. Discovering Statistics Using SPSS, 3rd ed.; SAGE: London, UK, 2009; ISBN 9781847879066. [Google Scholar]
- Amprazis, A.; Papadopoulou, P.; Malandrakis, G. Plant Blindness and Children’s Recognition of Plants as Living Things: A Research in the Primary Schools Context. J. Biol. Educ. 2021, 55, 139–154. [Google Scholar] [CrossRef]
- Melis, C.; Wold, P.A.; Billing, A.M.; Bjørgen, K.; Moe, B. Kindergarten Children’s Perception about the Ecological Roles of Living Organisms. Sustainability 2020, 12, 9565. [Google Scholar] [CrossRef]
- Wandersee, J.H.; Schussler, E.E. Preventing Plant Blindness. Am. Biol. Teach. 1999, 61, 84–86. [Google Scholar] [CrossRef]
- Lehalle, H. Cognitive Development in Adolescence: Thinking Freed from Concrete Constraints. In Handbook of Adolescent Development; Jackson, S., Ed.; Psychology Press: Seattle, WA, USA, 2007; pp. 71–89. ISBN 9781841692005. [Google Scholar]
- Shepard, L.A. Classroom Assessment to Support Teaching and Learning. Ann. Am. Acad. Pol. Soc. Sci. 2019, 683, 183–200. [Google Scholar] [CrossRef]
- Shavelson, R.J.; Kurpius, A. Reflections on Learning Progressions; Alonzo, A.C., Gotwals, A.W., Eds.; Sense Publishers: Rotterdam, The Netherlands; Boston, MA, USA; Taipei, Taiwan, 2012; pp. 13–26. [Google Scholar]
- Hammer, D.; Sikorski, T.-R. Implications of Complexity for Research on Learning Progressions. Sci. Educ. 2015, 99, 242–431. [Google Scholar] [CrossRef]
- Gunckel, K.L.; Covitt, B.A.; Salinas, I.; Anderson, C.W. A Learning Progression for Water in Socio-Ecological Systems. J. Res. Sci. Teach. 2012, 49, 843–868. [Google Scholar] [CrossRef]
- Covitt, B.A.; Gunckel, K.L.; Caplan, B.; Syswerda, S. Teachers’ Use of Learning Progression-Based Formative Assessment in Water Instruction. Appl. Meas. Educ. 2018, 31, 128–142. [Google Scholar] [CrossRef]
- Gotwals, A.W. Where Are We Now? Learning Progressions and Formative Assessment. Appl. Meas. Educ. 2018, 31, 157–164. [Google Scholar] [CrossRef]
- Debarger, A.H.; Penuel, W.R.; Harris, C.J. Designing NGSS Assessments to Evaluate the Efficacy of Curriculum Interventions; Educational Testing Service: Princeton, NJ, USA, 2013. [Google Scholar]
- Yao, S.-Y.; Wilson, M.; Henderson, J.B.; Osborne, J.; Henderson, B. Investigating the Function of Content and Argumentation Items in a Science Test: A Multidimensional Approach. J. Appl. Meas. 2013, 16, 171–192. [Google Scholar]
- Wertheim, J.; Osborne, J.F.; Quinn, H.; Pecheone, R.; Schultz, S.; Holthuis, N.; Martin, P. An Analysis of Existing Science Assessments and the Implications for Developing Assessment Tasks for the NGSS; Stanford Center for Assessment, Learning, and Equity: Stanford, CA, USA, 2016. [Google Scholar]
- Badrinarayan, A.; Wertheim, J. Reconceptualizing Alignment for NGSS Assessments. In Proceedings of the National Association for Research in Science Teaching (NARST) Annual International Conference, Baltimore, MD, USA, 31 March–3 April 2019. [Google Scholar]
- Wiggins, G. Seven Keys to Effective Feedback. Educ. Leadersh. 2012, 70, 10–16. [Google Scholar]
- Shin, J.; Guo, Q.; Gierl, M.J. Multiple-Choice Item Distractor Development Using Topic Modeling Approaches. Front. Psychol. 2019, 10, 825. [Google Scholar] [CrossRef] [PubMed]

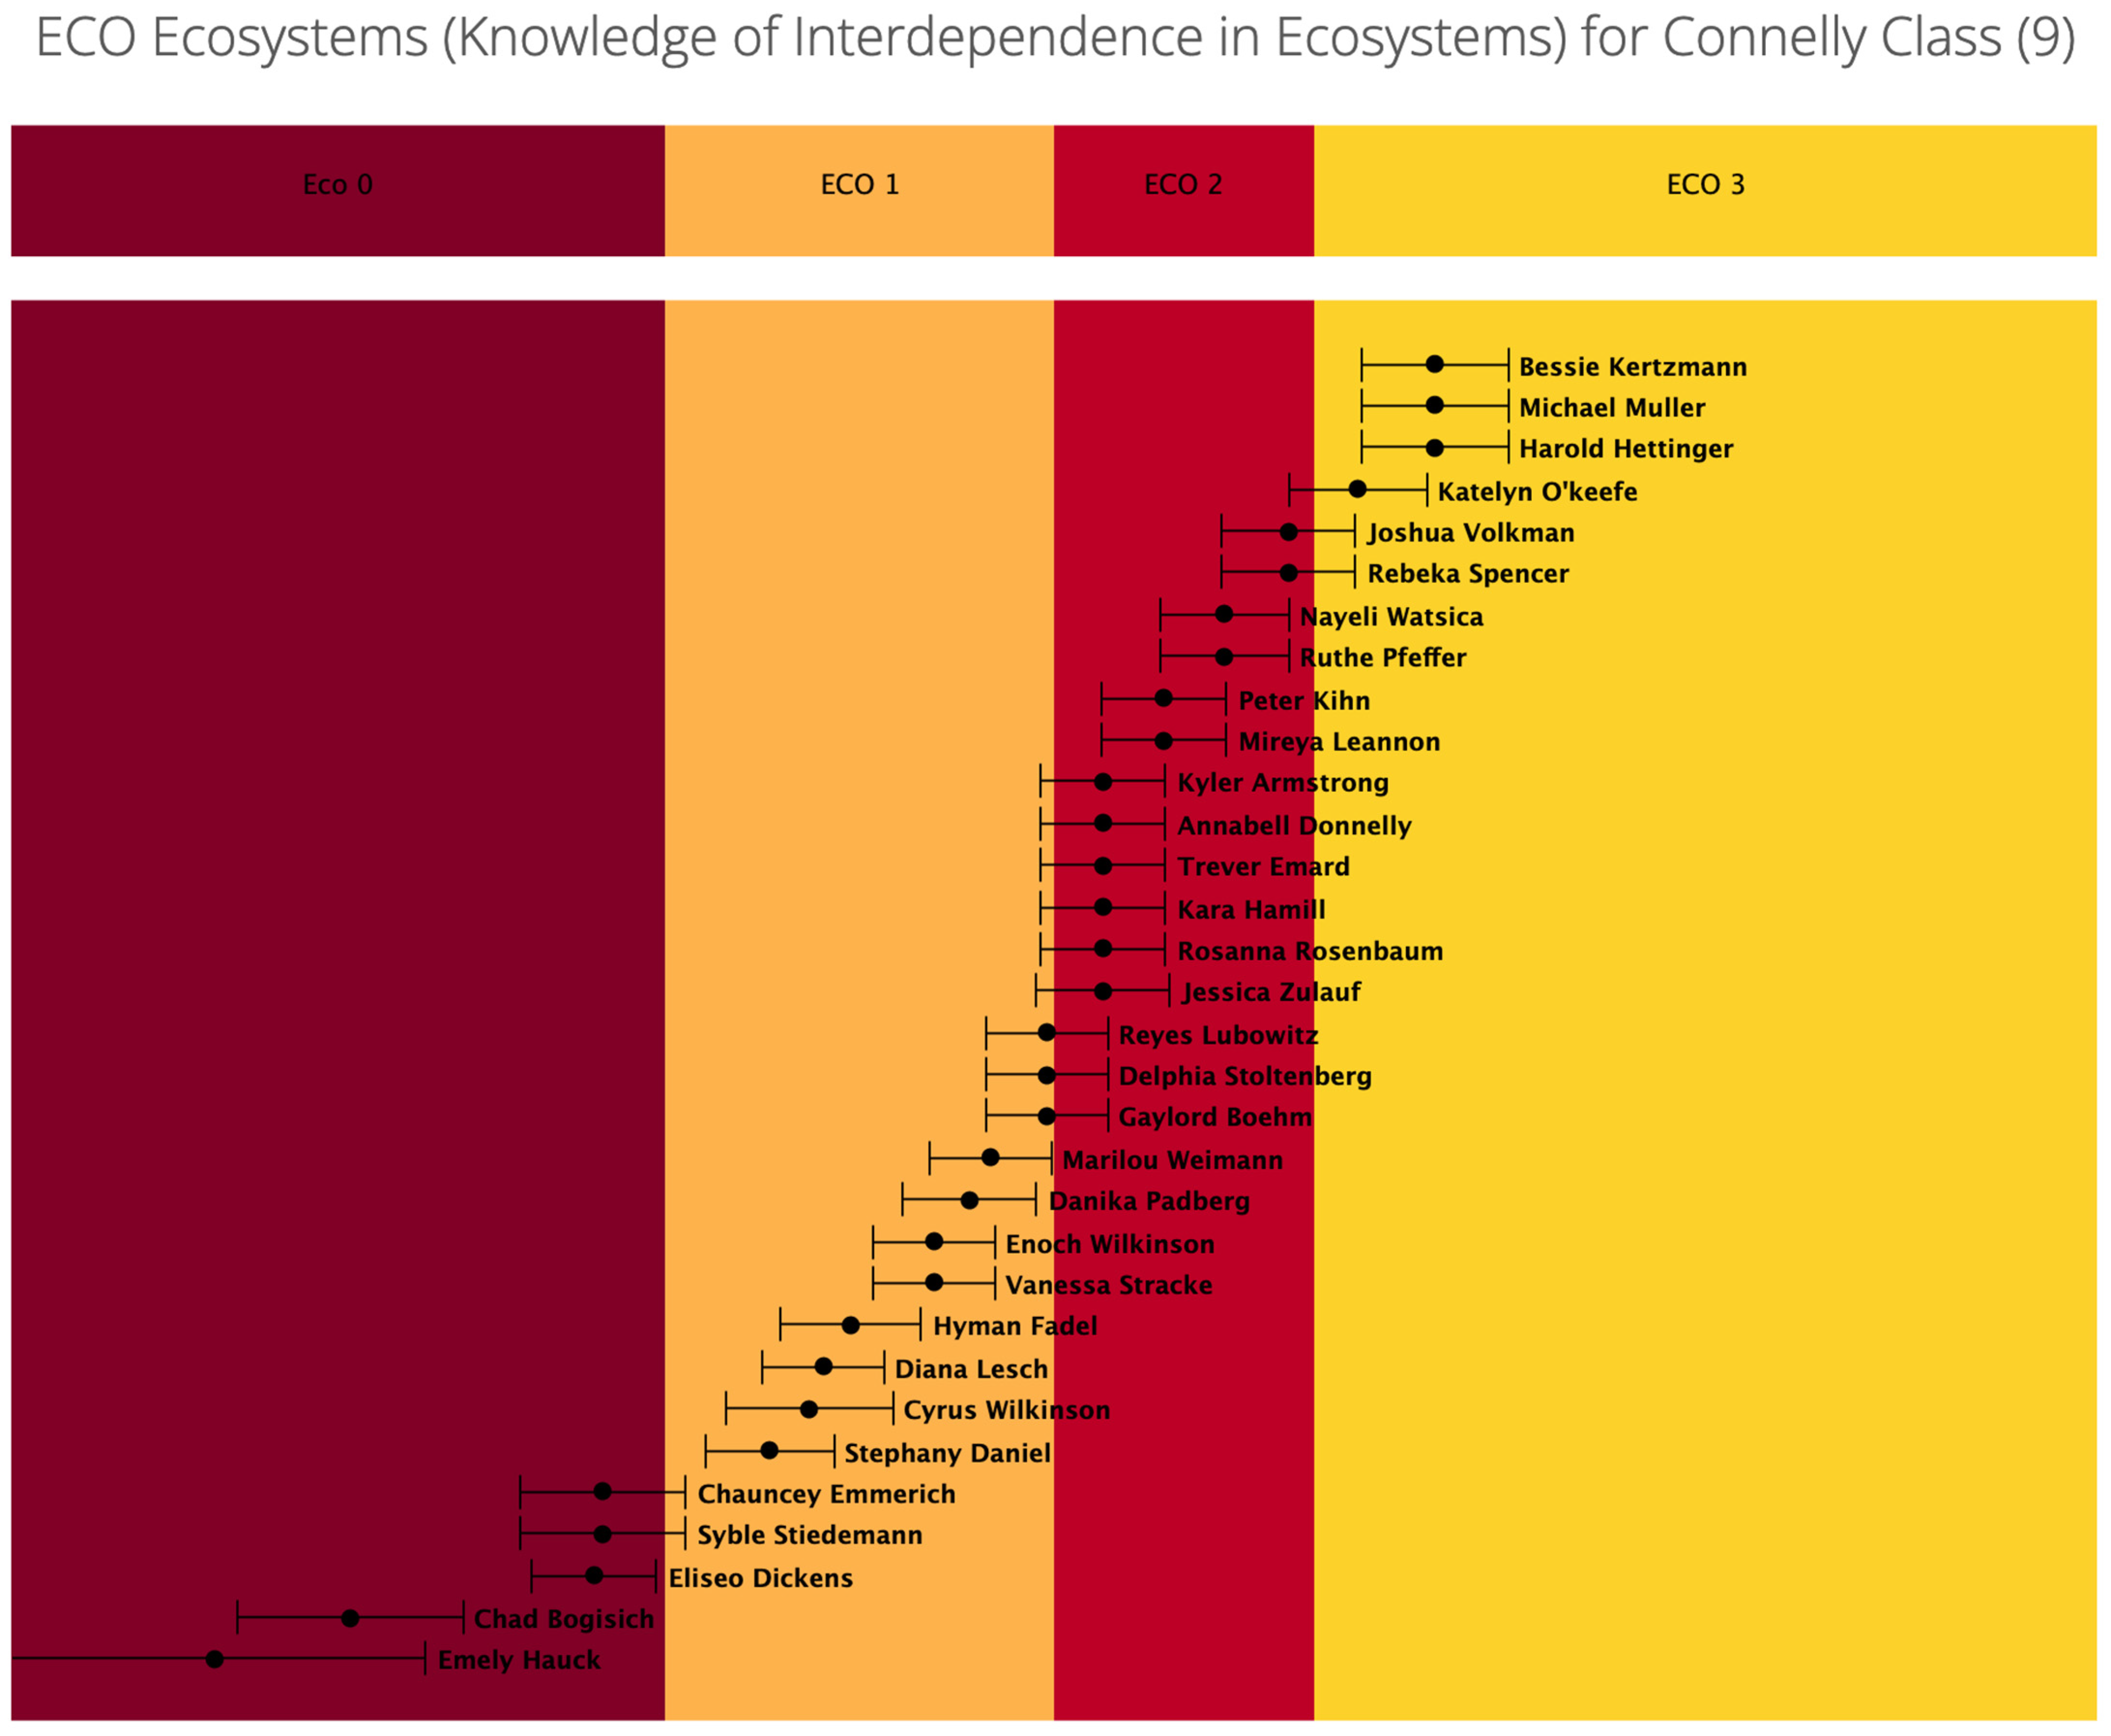
 represents one student. Each colored box represents an item with the number corresponding to the difficulty estimates shown in Table 2. The colored bands show the relationship between student ability estimates, item difficulties, and learning progression levels. The gray band represents level 0. The yellow band represents level 1. The pink band represents level 2. The blue band represents level 3.
represents one student. Each colored box represents an item with the number corresponding to the difficulty estimates shown in Table 2. The colored bands show the relationship between student ability estimates, item difficulties, and learning progression levels. The gray band represents level 0. The yellow band represents level 1. The pink band represents level 2. The blue band represents level 3.
represents one student. Each colored box represents an item with the number corresponding to the difficulty estimates shown in Table 2. The colored bands show the relationship between student ability estimates, item difficulties, and learning progression levels. The gray band represents level 0. The yellow band represents level 1. The pink band represents level 2. The blue band represents level 3.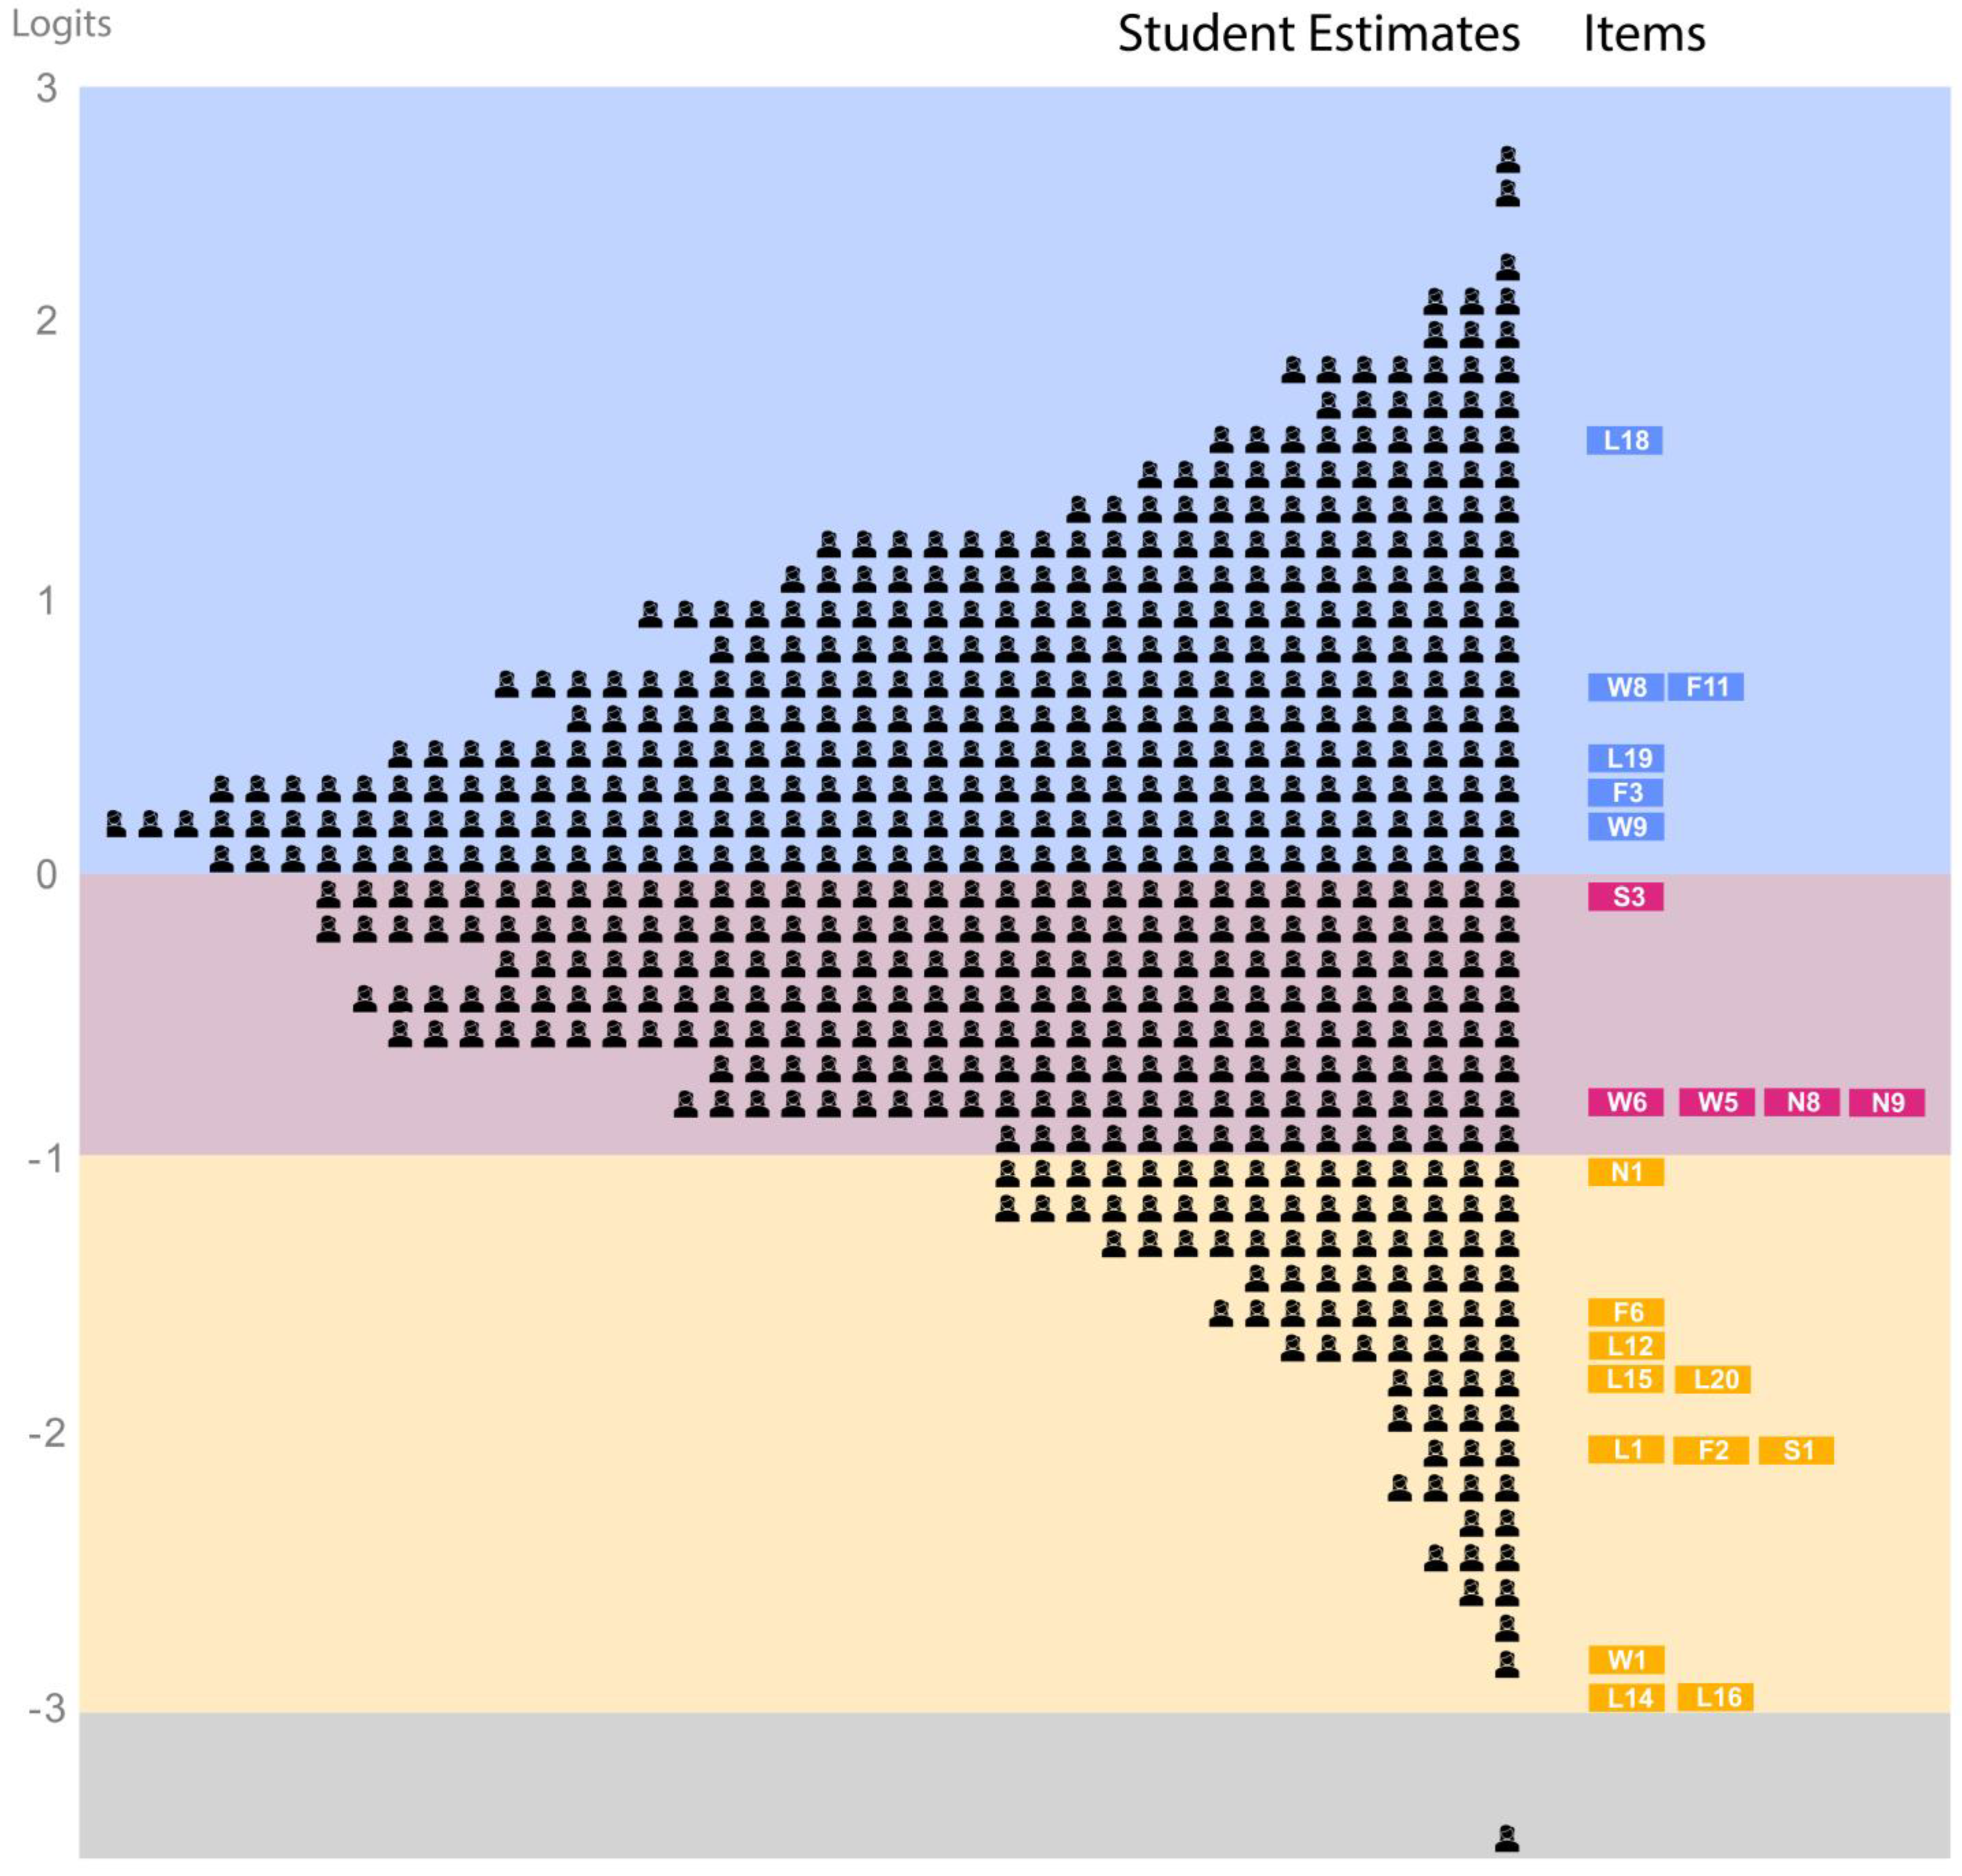

| Level | Description |
|---|---|
| Complex Relationships | |
| 3 | Students predict changes in more than two components in an ecosystem based on changes in microscopic or macroscopic populations or the availability of non-living resources [31]. |
| Indirect Relationships | |
| 2 | Students predict the effects of change in one population on another population with an indirect relationship [21,43]. |
| Students predict the effects of the availability of and competition for resources (e.g., food, space, water, shelter, and light) on populations [43]. | |
| Direct Relationships | |
| 1 | Students predict the effect of a change in the size of one population on the size of another population in mutual, commensal, or parasitic relationships [19,20,43,45]. |
| Students predict the effect of a change in the size of one population on the size of another population in a predator-prey relationship [19,20,21,43,45]. | |
| Students predict the effects of changes in plant populations throughout the food web using the knowledge that plants form the base of the food web and are living organisms [19,20,43,45]. | |
| Notions | |
| 0 | Students express naive knowledge about ecosystems. |
| Task | Item Name | Construct Map Level | Difficulty Estimate (Logits) | Standard Error of the Estimate | Weighted Fit MNSQ | t |
|---|---|---|---|---|---|---|
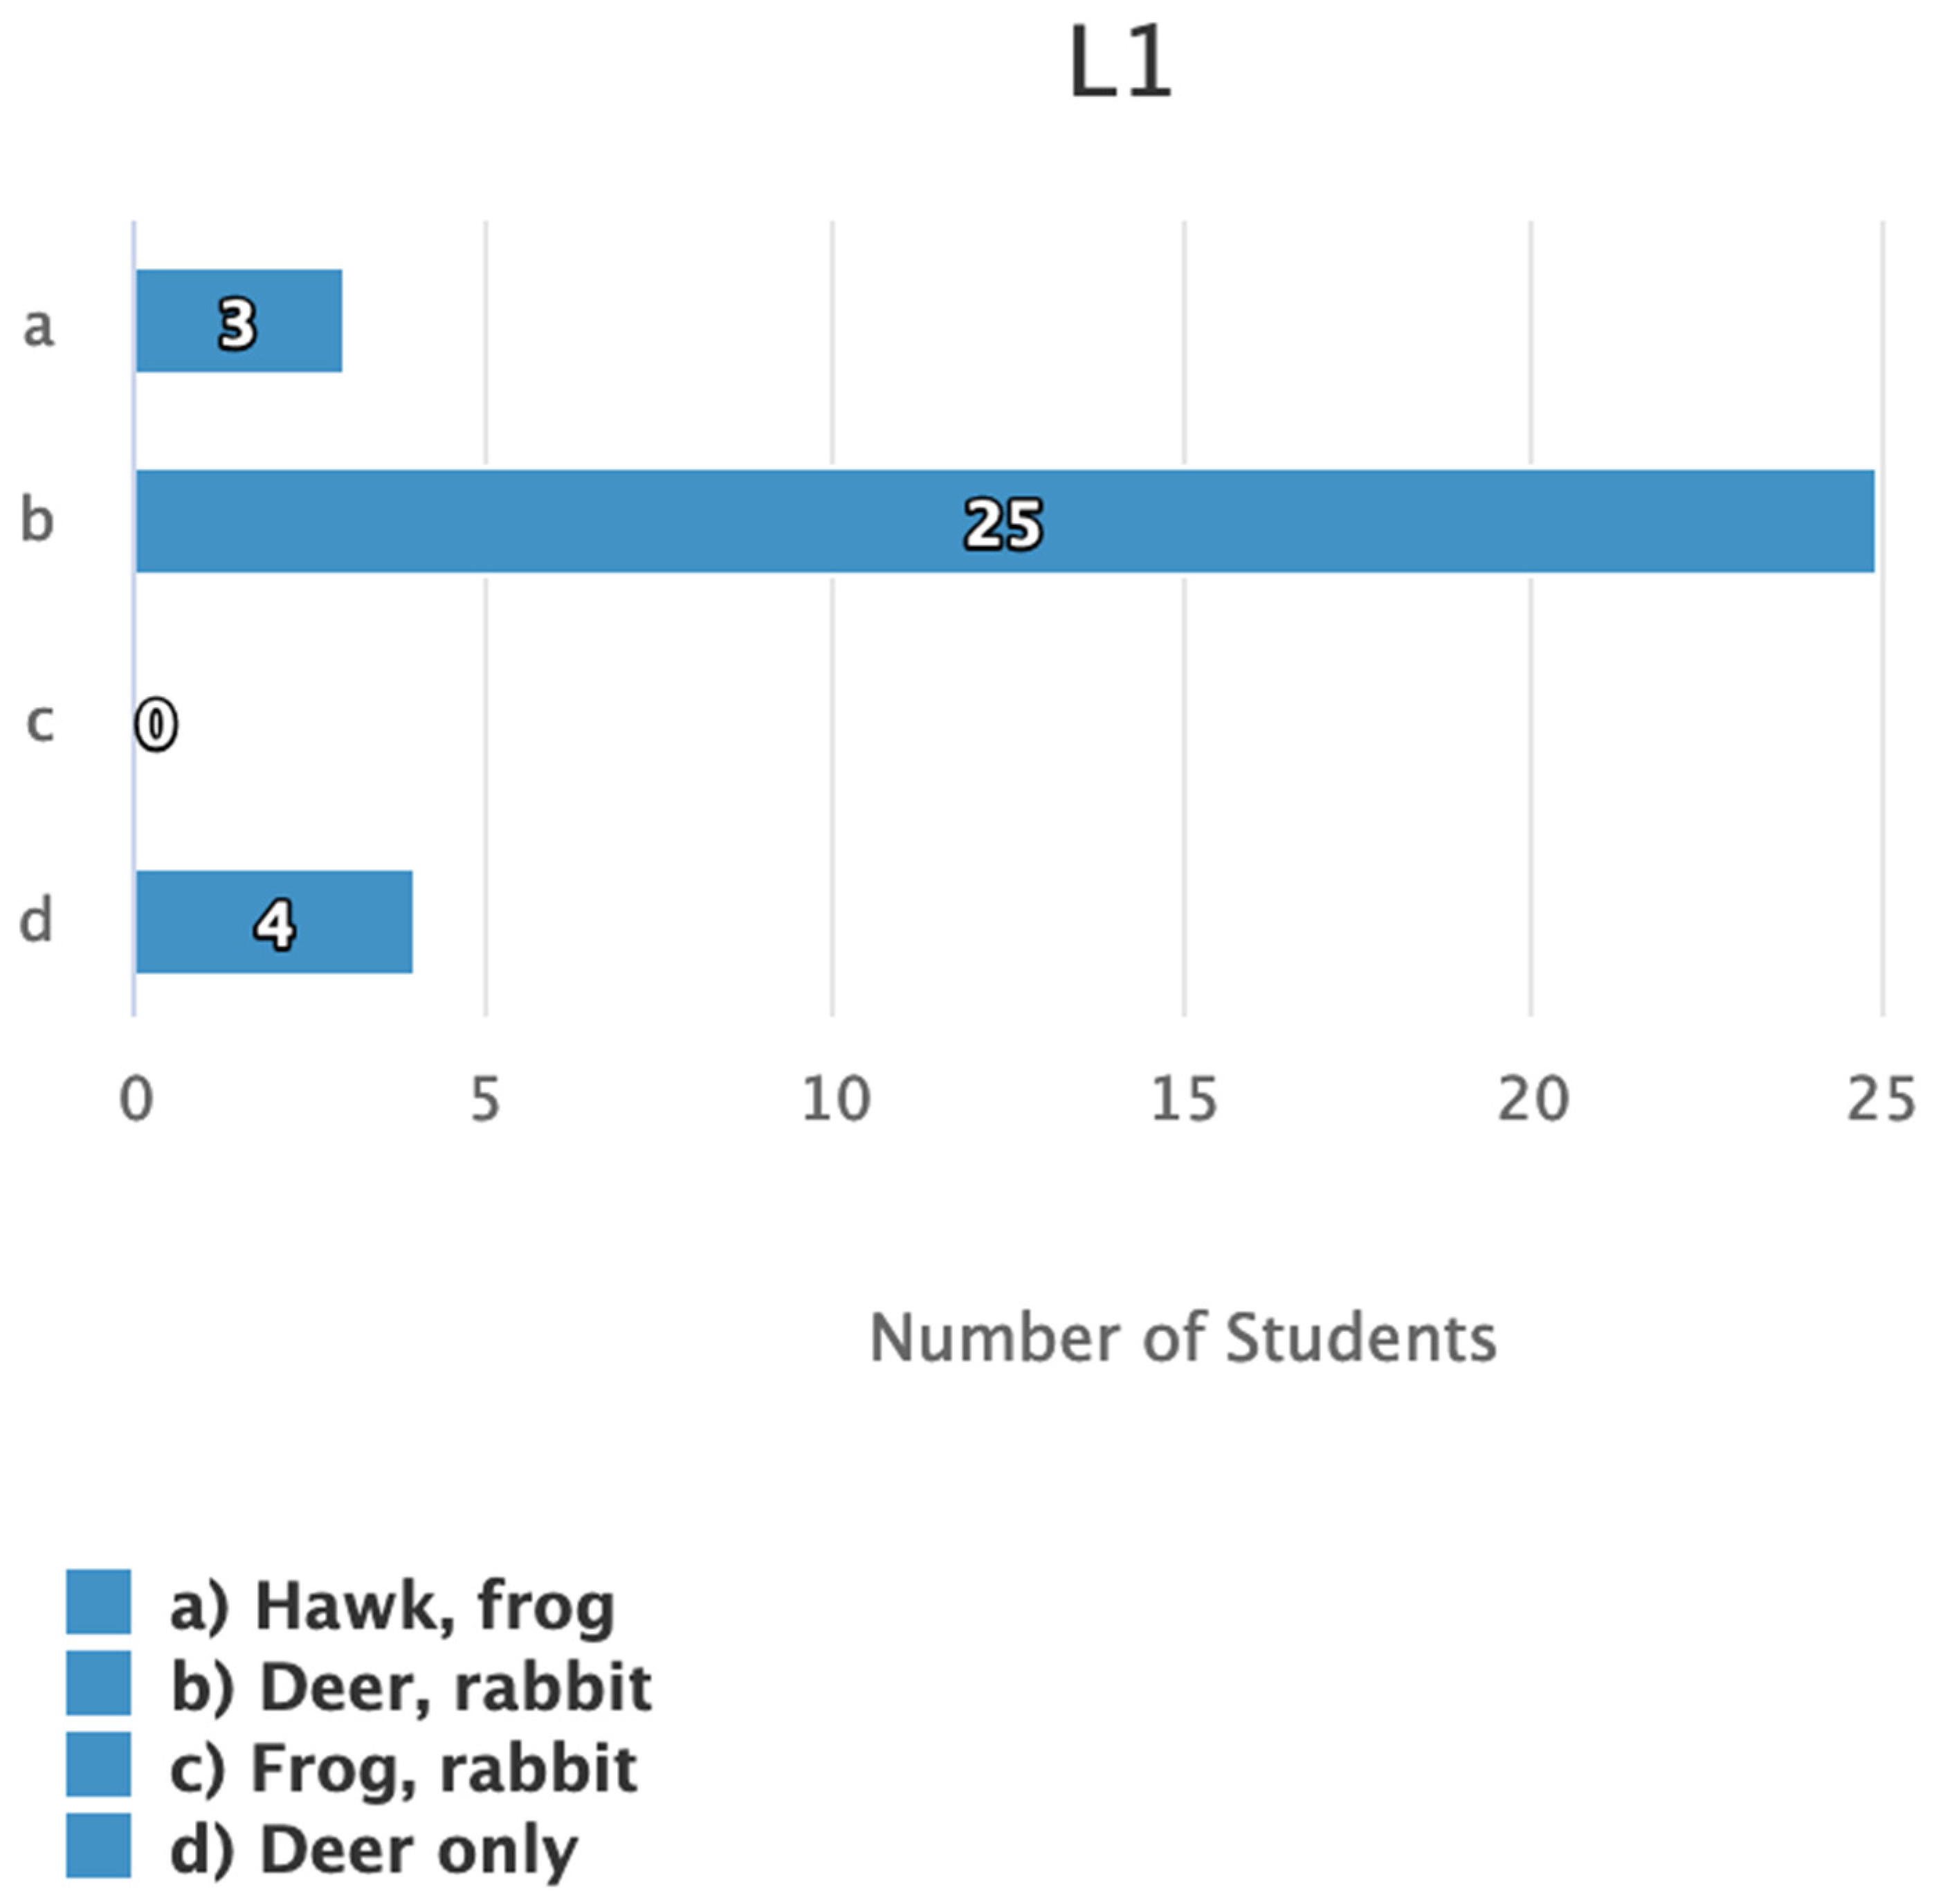
| Lion | L1 | 1 | −2.008 | 0.115 | 0.99 | −0.1 |
| Lion | L12 | 1 | −1.615 | 0.104 | 0.99 | −0.2 |
| Lion | L14 | 1 | −2.85 | 0.153 | 0.98 | −0.1 |
| Lion | L15 | 1 | −1.725 | 0.107 | 0.93 | −1.1 |
| Lion | L16 | 1 | −2.804 | 0.15 | 0.93 | −0.6 |
| Lion | L18 | 3 | 1.724 | 0.106 | 1.02 | 0.3 |
| Lion | L19 | 3 | 0.417 | 0.085 | 1.19 | 5.9 |
| Lion | L20 | 1 | −1.795 | 0.109 | 0.94 | −0.9 |
| Whales | W1 | 1 | −2.752 | 0.153 | 0.92 | −0.7 |
| Whales | W5 | 2 | −0.832 | 0.093 | 0.97 | −0.8 |
| Whales | W6 | 2 | −0.772 | 0.092 | 1.04 | 1.1 |
| Whales | W8 | 3 | 0.652 | 0.091 | 1.13 | 3.7 |
| Whales | W9 | 3 | 0.159 | 0.089 | 1.06 | 2.0 |
| Foxes | F2 | 1 | −2.027 | 0.127 | 0.90 | −1.2 |
| Foxes | F3 | 3 | 0.272 | 0.091 | 1.02 | 0.6 |
| Foxes | F6 | 1 | −1.493 | 0.112 | 0.98 | −0.4 |
| Foxes | F11 | 3 | 0.62 | 0.095 | 1.12 | 3.4 |
| Succession | S1 | 1 | −2.041 | 0.135 | 0.96 | −0.4 |
| Succession | S3 | 2 | −0.007 | 0.096 | 1.02 | 0.5 |
| Invasive | N1 | 1 | −1.029 | 0.115 | 0.85 | −2.8 |
| Invasive | N8 | 2 | −0.79 | 0.112 | 0.88 | −2.5 |
| Invasive | N9 | 2 | −0.844 | 0.114 | 0.96 | −0.8 |
Disclaimer/Publisher’s Note: The statements, opinions and data contained in all publications are solely those of the individual author(s) and contributor(s) and not of MDPI and/or the editor(s). MDPI and/or the editor(s) disclaim responsibility for any injury to people or property resulting from any ideas, methods, instructions or products referred to in the content. |
© 2023 by the authors. Licensee MDPI, Basel, Switzerland. This article is an open access article distributed under the terms and conditions of the Creative Commons Attribution (CC BY) license (https://creativecommons.org/licenses/by/4.0/).
Share and Cite
Dozier, S.J.; MacPherson, A.; Morell, L.; Gochyyev, P.; Wilson, M. A Learning Progression for Understanding Interdependent Relationships in Ecosystems. Sustainability 2023, 15, 14212. https://doi.org/10.3390/su151914212
Dozier SJ, MacPherson A, Morell L, Gochyyev P, Wilson M. A Learning Progression for Understanding Interdependent Relationships in Ecosystems. Sustainability. 2023; 15(19):14212. https://doi.org/10.3390/su151914212
Chicago/Turabian StyleDozier, Sara J., Anna MacPherson, Linda Morell, Perman Gochyyev, and Mark Wilson. 2023. "A Learning Progression for Understanding Interdependent Relationships in Ecosystems" Sustainability 15, no. 19: 14212. https://doi.org/10.3390/su151914212
APA StyleDozier, S. J., MacPherson, A., Morell, L., Gochyyev, P., & Wilson, M. (2023). A Learning Progression for Understanding Interdependent Relationships in Ecosystems. Sustainability, 15(19), 14212. https://doi.org/10.3390/su151914212