Abstract
In recent years, with the encouragement of national and international authorities, researchers on plastic levels in aquaculture have begun to assess consumer health risks as well as ecological monitoring. Based on this guidance, the aim of this study is to determine the microplastic load of rainbow trout raised under routine breeding conditions without an external treatment in all developmental stages from egg to +1 year of age. Sperm, egg, fertilized egg, eyed egg, alevin or such fry, and swimming fry on growing stock (1-year-old) stages of cultured fish and commercial feeds were used for the following stages: 300–500 µm, 500–800 µm, 800–1200 µm, 1 mm, 2 mm, 3 mm, 4 mm, and 5 mm. The samples were collected to determine the presence of microplastic (MP) and at which stage of this life cycle the MP has entered into the system intensively. The obtained findings showed that the total amount of MP determined in the stages without feed intake was 14 pieces, and this value increased by 557% (total of 92-piece MP) in fish that started external feeding. While no significant difference was found between the MP amounts in different feed groups, the dominant microplastic color in the feed groups was black and blue, and the polymer type was polyethylene. This general modelling, in which MP concentrations are determined in all life cycles from egg to adult in a cultured fish species, including in the given feeds, will encourage further research. Current findings have shown that any outsourced input used during growing periods can cause MP contamination to the end of fish production, processing, and storage.
1. Introduction
Plastics are divided into various groups (megaplastics, macroplastics, mesoplastics, microplastics, and nanoplastics) according to their size (mm, µm) [1]. In addition, depending on the way they are produced, these microplastics (MPs) can be grouped into primary and secondary MPs and come in different sizes and forms. Primary MPs are intentionally produced for specific purposes, including the production of plastic products or applications such as personal care products [2]. Secondary MPs are formed as a result of physical, chemical, and biological degradation of larger plastics. The breakdown of large plastic fragments into smaller particles through various forces results in the formation of secondary microplastics [3].
These pollutants, which persist in the environment for long periods of time, are considered a major global problem that transcends geographical boundaries and affects aquatic ecosystems worldwide.
Many aquaculture products are produced from freshwater environments (i.e., freshwater culture). It is emphasized that this sector is the main source of fish production in the world [4]. Today, the world’s annual fish production has exceeded 100 million tons, of which about 80% is from the sea and 20% is from fresh water. With its high nutritional value in this production, rainbow trout (Oncorhynchus mykiss) is an important cold-water and widely cultivated fish species worldwide and in Türkiye [5]. Rainbow trout is one of the most widely consumed farmed fish. In recent years, fish producers have turned to intensive and super-intensive rainbow trout breeding systems for a variety of reasons, such as reduced water resources and more income [6].
Aquaculture is an increasingly important supplier of food worldwide [7]. However, due to its high dependence on agricultural and fisheries resources, the sector’s growth is constantly constrained by environmental impacts beyond aquaculture production systems [4]. Although the life history and ecological characteristics of freshwater fish are known, it is necessary to lay the groundwork to establish basic theories of toxicity potential, and others, by testing applicable models against different conditions that freshwater fish will face in the future [8]. Aquaculture environments are contaminated with numerous contaminants, including microplastics, which will enter/adsorb on the aquaculture environments and pose health risks when consumed by humans. Due to the widespread use of plastic products and the ubiquity of microplastics, there is no doubt that all aquaculture systems are contaminated with MPs [9,10].
While aquatic environments are important for aquaculture production, most of these studies have only considered aquaculture activities as sources of microplastics in aquatic environments, without actually investigating microplastics in aquatic ecosystems. Studies reporting the detection of microplastics in aquaculture environments and products have been limited in number. It is important to reveal the pollution in aquaculture environments and products, as well as their negative effects on people [9].
Today, MP particles have been detected in a wide variety of shapes, polymers, sizes, and concentrations in marine freshwater, agroecosystems, atmosphere, food, drinking water, biota, and other remote locations [11]. MPs are commonly found in river water, beaches, sediments, ocean and aquatic areas, and rarely in polar regions.
In recent years, aquatic flora and fauna have been found to be affected in different ways when in contact with MPs. It has been reported that MPs can be bound and physically digested by almost all aquatic taxa, and that MPs can affect biota through surface leachates or pathogens [12].
The aim of this research is to analyze the MP pollution in the stages of rainbow trout (which is an important economic species and high consumption) sperm, egg, fertilized egg, eyed egg, alevin or such fry, and swimming fry on growing stock (1 year old). The found plastics were identified using a classification and detection system based on MP shape, color, and size (mm). Since the fish examined in this study are at different vital stages, it is assumed that the evidence for plastic pollution will be important for the sector and scientists.
2. Material and Methods
2.1. Taking Samples from Different Stages of O. mykiss and Feed
For determining the MP loadings in standard rainbow trout pond farming (hatchery and breeding) process, the sperm, egg, fertilized egg, eyed egg, alevin or such fry, and swimming fry samples on growing stock (1 year old) in the life cycle of rainbow trout were placed in glass jars. Separate samples were also made from the same company’s commercial feeds (300–500 µm, 500–800 µm, 800–1200 µm, 1 mm, 2 mm, 3 mm, 4 mm, and 5 mm) which were produced in the same season. The feeds’ sizes of the relevant fish stages, and the sample amounts are shown in Table 1. All feed samples were placed in glass jars and sealed with aluminum foil and the following procedures were followed.

Table 1.
The feeds’ sizes and fish stages.
2.2. Microplastic Isolation Procedures
2.2.1. MP Isolation from Fish Feed
In order to determine the MP amount in feeds (300–500 µm, 500–800 µm, 800–1200 µm, 1 mm, 2 mm, 3 mm, 4 mm, and 5 mm) given according to the development periods from the time the fish started to external feed, 5 g samples from each feed were obtained with 4 replications. For MP isolation in feeds, the methods of previous studies were used [13,14].
Weighed (5 g) feeds were placed in an 800 mL glass beaker. Approximately 20 mL of 30% H2O2 and 180 mL of 10% (m/v) KOH were added to each beaker. The upside of the beakers was covered with aluminum foil and incubated in an oven at 75 °C for 6 h. After incubation, the solutions (supernatant) were filtered through 1.2 µm glass microfiber filters (Whatman: Cytiva, Marlborough, MA, USA). The completely undigested part (dross) under the solution was filtered through a steel sieve with a larger mesh size and this part was placed in glass Petri dishes and dried in an oven for 24 h. Afterwards, the filters were examined with a microscope to determine the size, color, and shape of the MP. The MP amount in the feeds was calculated as items/g.
2.2.2. MP Isolation from Fish Life Stages and Feeds
Sperm (20 mL), egg (20 mL), fertilized egg (20 mL), and alevin (20 mL) samples were used for MP isolation as 6 replications. In fish samples, weighing 10 g (n = 10) and 20–50 g (n = 10) were obtained as whole fish and MP isolation was performed. However, the samples from the different fish stages (51–100 g, 150 g, and 200 g) were obtained from the gills, gastrointestinal tract (GIT), and muscles (5 g from each fish), 10 fish for each period, and MP isolation was carried out. Microplastic isolation from fish tissues was performed according to the method of Clere et al. (2022) [15]. In small fish (10 g and 20–50 g) whole body samples, and in other growing stock fish (51–100, 150, and 200 g), samples were made from the gill, gastrointestinal tract, and muscle tissues, and 10% KOH solution was added into the glass beaker (30 mL for 1 g tissue) and then incubated in an oven at 40 °C for 48–72 h or until the organic matter dissolved and left the inorganic material. After the digestion period, the residue was filtered through glass fiber filters using a vacuum pump. The filters were placed in a glass petri dish and incubated at 60 °C for 24 h.
As a control group in this study, filtered paper in 2 open glass Petri dishes, 2 pieces of 20 mL H2O2, and 2 pieces of 180 mL KOH were filtered and examined. The MP amounts determined in the 6 samples used as the controls were subtracted from the other samples and the MP amounts in the samples were calculated.
The dried filters were examined under a stereomicroscope at 40× magnification. MPs were characterized by color (black, blue, grey/white, red/pink, green, and yellow) and shape (fiber, fragment, and film). The hot needle technique was used to confirm microplastic formation in cases where the visual evaluation was not sufficient. MP dimensions (50–100 µm, 101–300 µm, 301–500 µm, 501–1000 µm, 1001–3000 µm, and 3001–5000 µm) were recorded under the microscope and measured via an online software (ImageJ, FIJI version 2.3.051, NIH, Bethesda, MD, USA) program. MP amount was calculated as MP/20 mL for sperm, egg, fertilized eye, eyed egg, and alevin, for whole fish MP/fish (10 g, 20–50 g), MP/g for muscle, gill, and GIT as MP/individual.
2.3. MP Characterization
More than 10% of the identified MPs was used in Fourier transform infrared spectroscopy (Agilent Cary 630 FTIR Spectrometer, Agilent, Santa Clara, CA, USA) to investigate the spectral signal exchange of polymers in the wavelength range of 4000 to 650 cm−1. MP polymer types were obtained from the Agilent MicroLab FTIR software library. The samples’ spectra were compared with library data, and samples having more than 70% spectral similarity were accepted [10].
2.4. Quality Control and Contamination Prevention
All materials, equipment, and laboratory surfaces were washed with distilled water and ethanol to prevent contamination. All materials were then stored and covered with aluminum foil when not in use. Processing was performed in a laminar flow cabinet to minimize airborne contamination during the sampling and analysis process. The samples were processed as soon as possible. Cotton laboratory coats were worn throughout the study to avoid contamination. All windows, doors, and air conditioning systems of the laboratory were closed during the analyses.
3. Statistical Analyzes
The homogeneity (Levene test) and normality tests of the groups were checked for each variable, and the nonparametric Kruskal–Wallis test was conducted. The Mann–Whitney U test was used to compare the life stages of fish with no external feed and with external feed (SPSS 18). The data were given as mean ± SD and statistical analysis was conducted with SPSS. MP color, size and shape graphs, polymer percentage graphs, and FTIR spectrum graphs were prepared with the OriginPro 8.5 software program and Microsoft Excel program. A value of p < 0.05 was accepted for the significance of statistical analysis.
4. Results
In this study, six samples considered as controls were determined as 1.3 ± 1.5 MP/sample. In the control samples, the dominant shape was fiber and the dominant color was black.
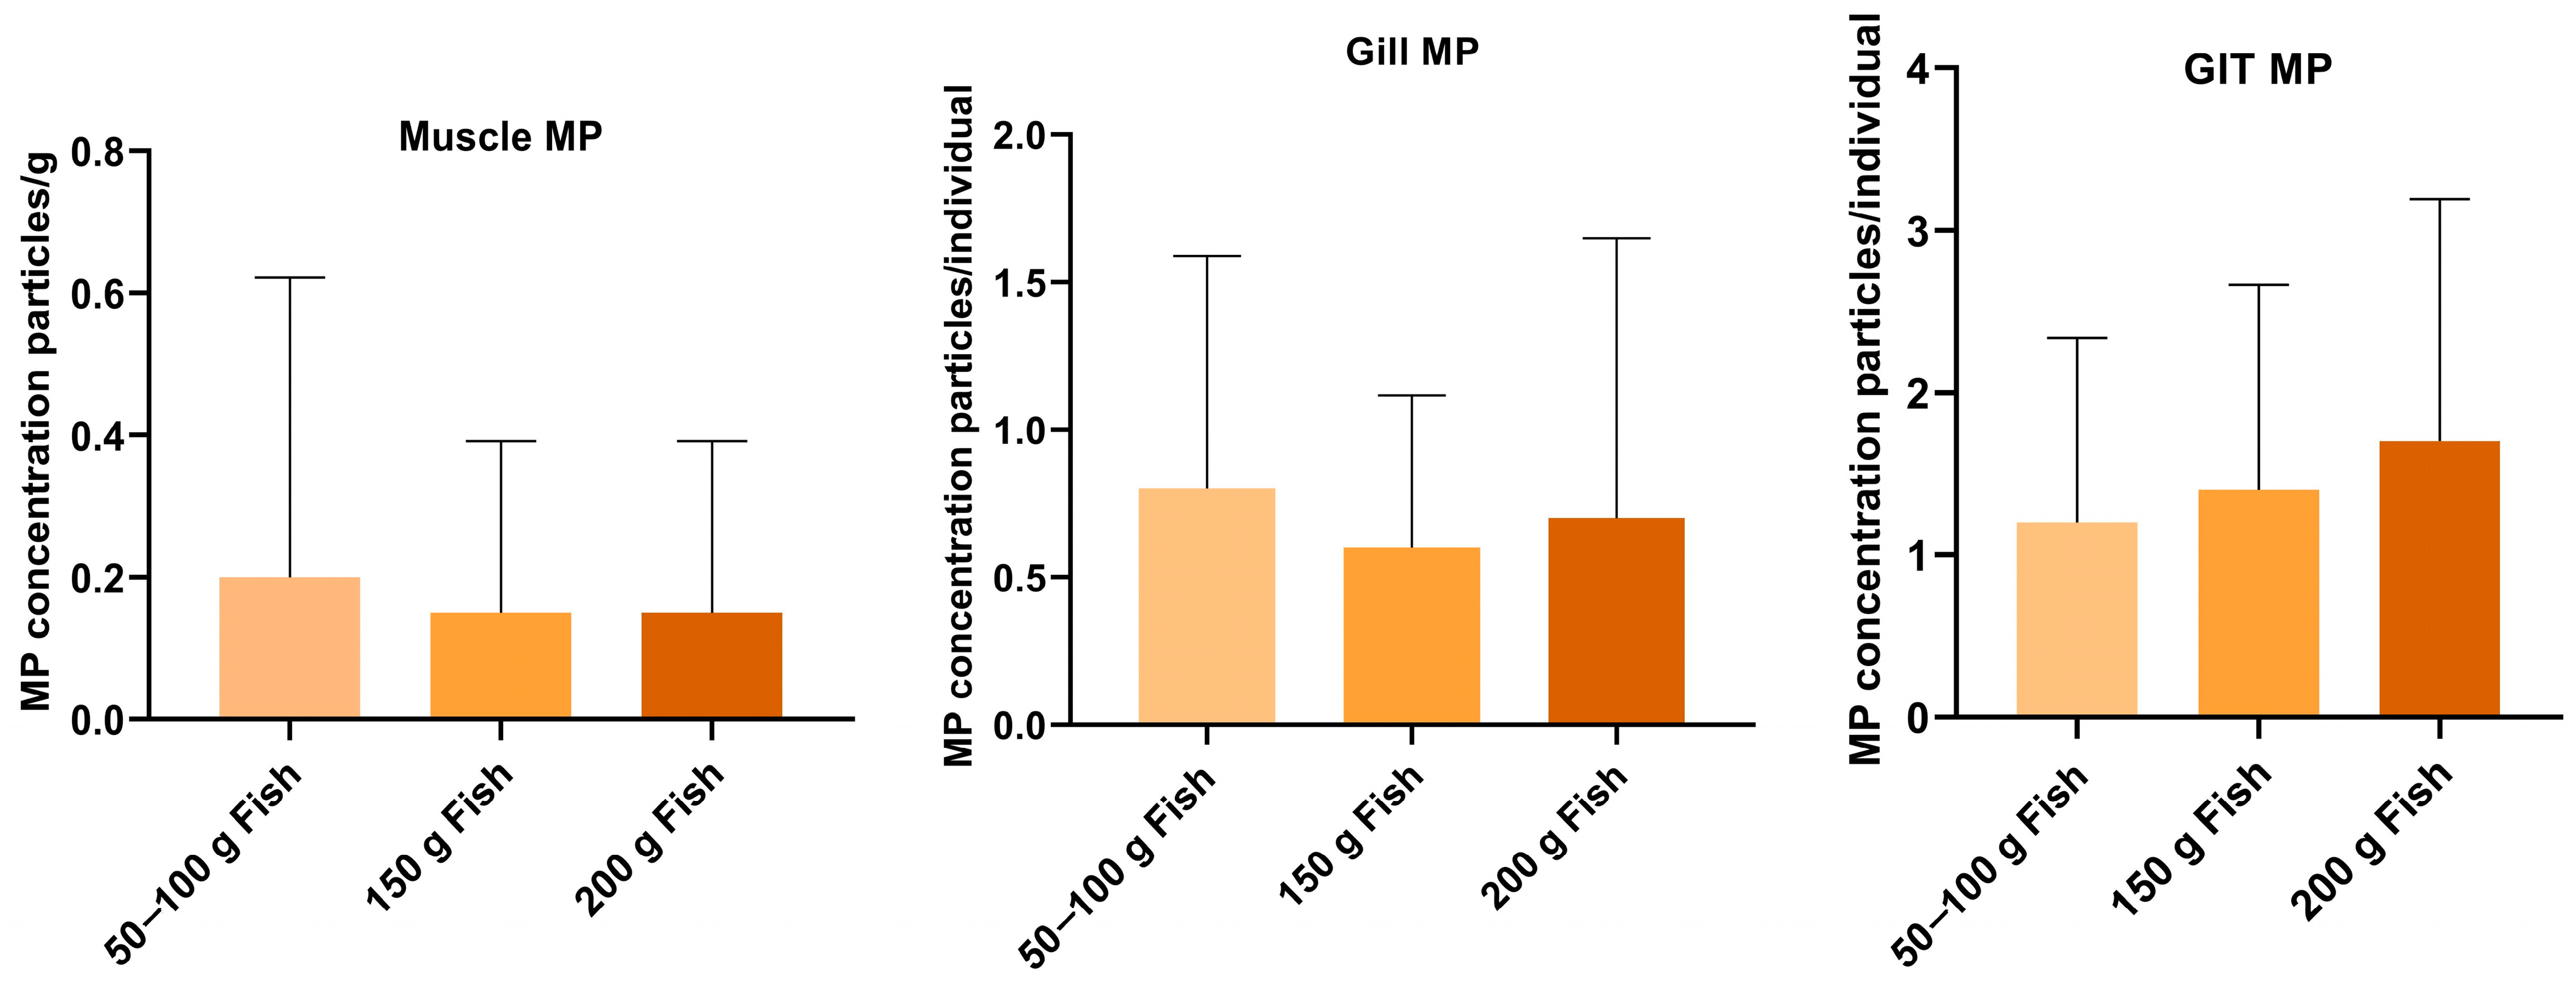
The total MP amount determined in the without feed intake stages of rainbow trout was 14 pieces, mean MP amounts were 1.0 ± 1.2, 0.7 ± 0.8, 0.2 ± 0.4, 0.3 ± 0.5, and 0.2 ± 0.4 pieces of MP in sperm, egg, fertilized egg, eyed egg, and alevin, respectively. A total of 92 MP pieces were detected in fish that started to take external food, and the average MP content in 10 g, 20–50 g, 51–100 g, 150 g, and 200 g fish was 0.7 ± 1.1, 1.1 ± 1.3, 2.4 ± 1.8, 2.3 ± 1.9, and 2.7 ± 2.5 pieces, respectively. A significant difference was not found between the MP amount in the not taking external feed life stages of fish and the change in MP in taking external feed life stages (p > 0.05). Similarly, the MP amount in different tissues of 51–100 g, 150 g, and 200 g fish was examined, and no significant difference was found in MP amounts in fish of different weights (p > 0.05) (Figure 1).

Figure 1.
MP distribution of O. mykiss’ (weighing 51–100 g, 150 g, and 200 g) different tissues (muscle, gill, and gastrointestinal tract) of fish.
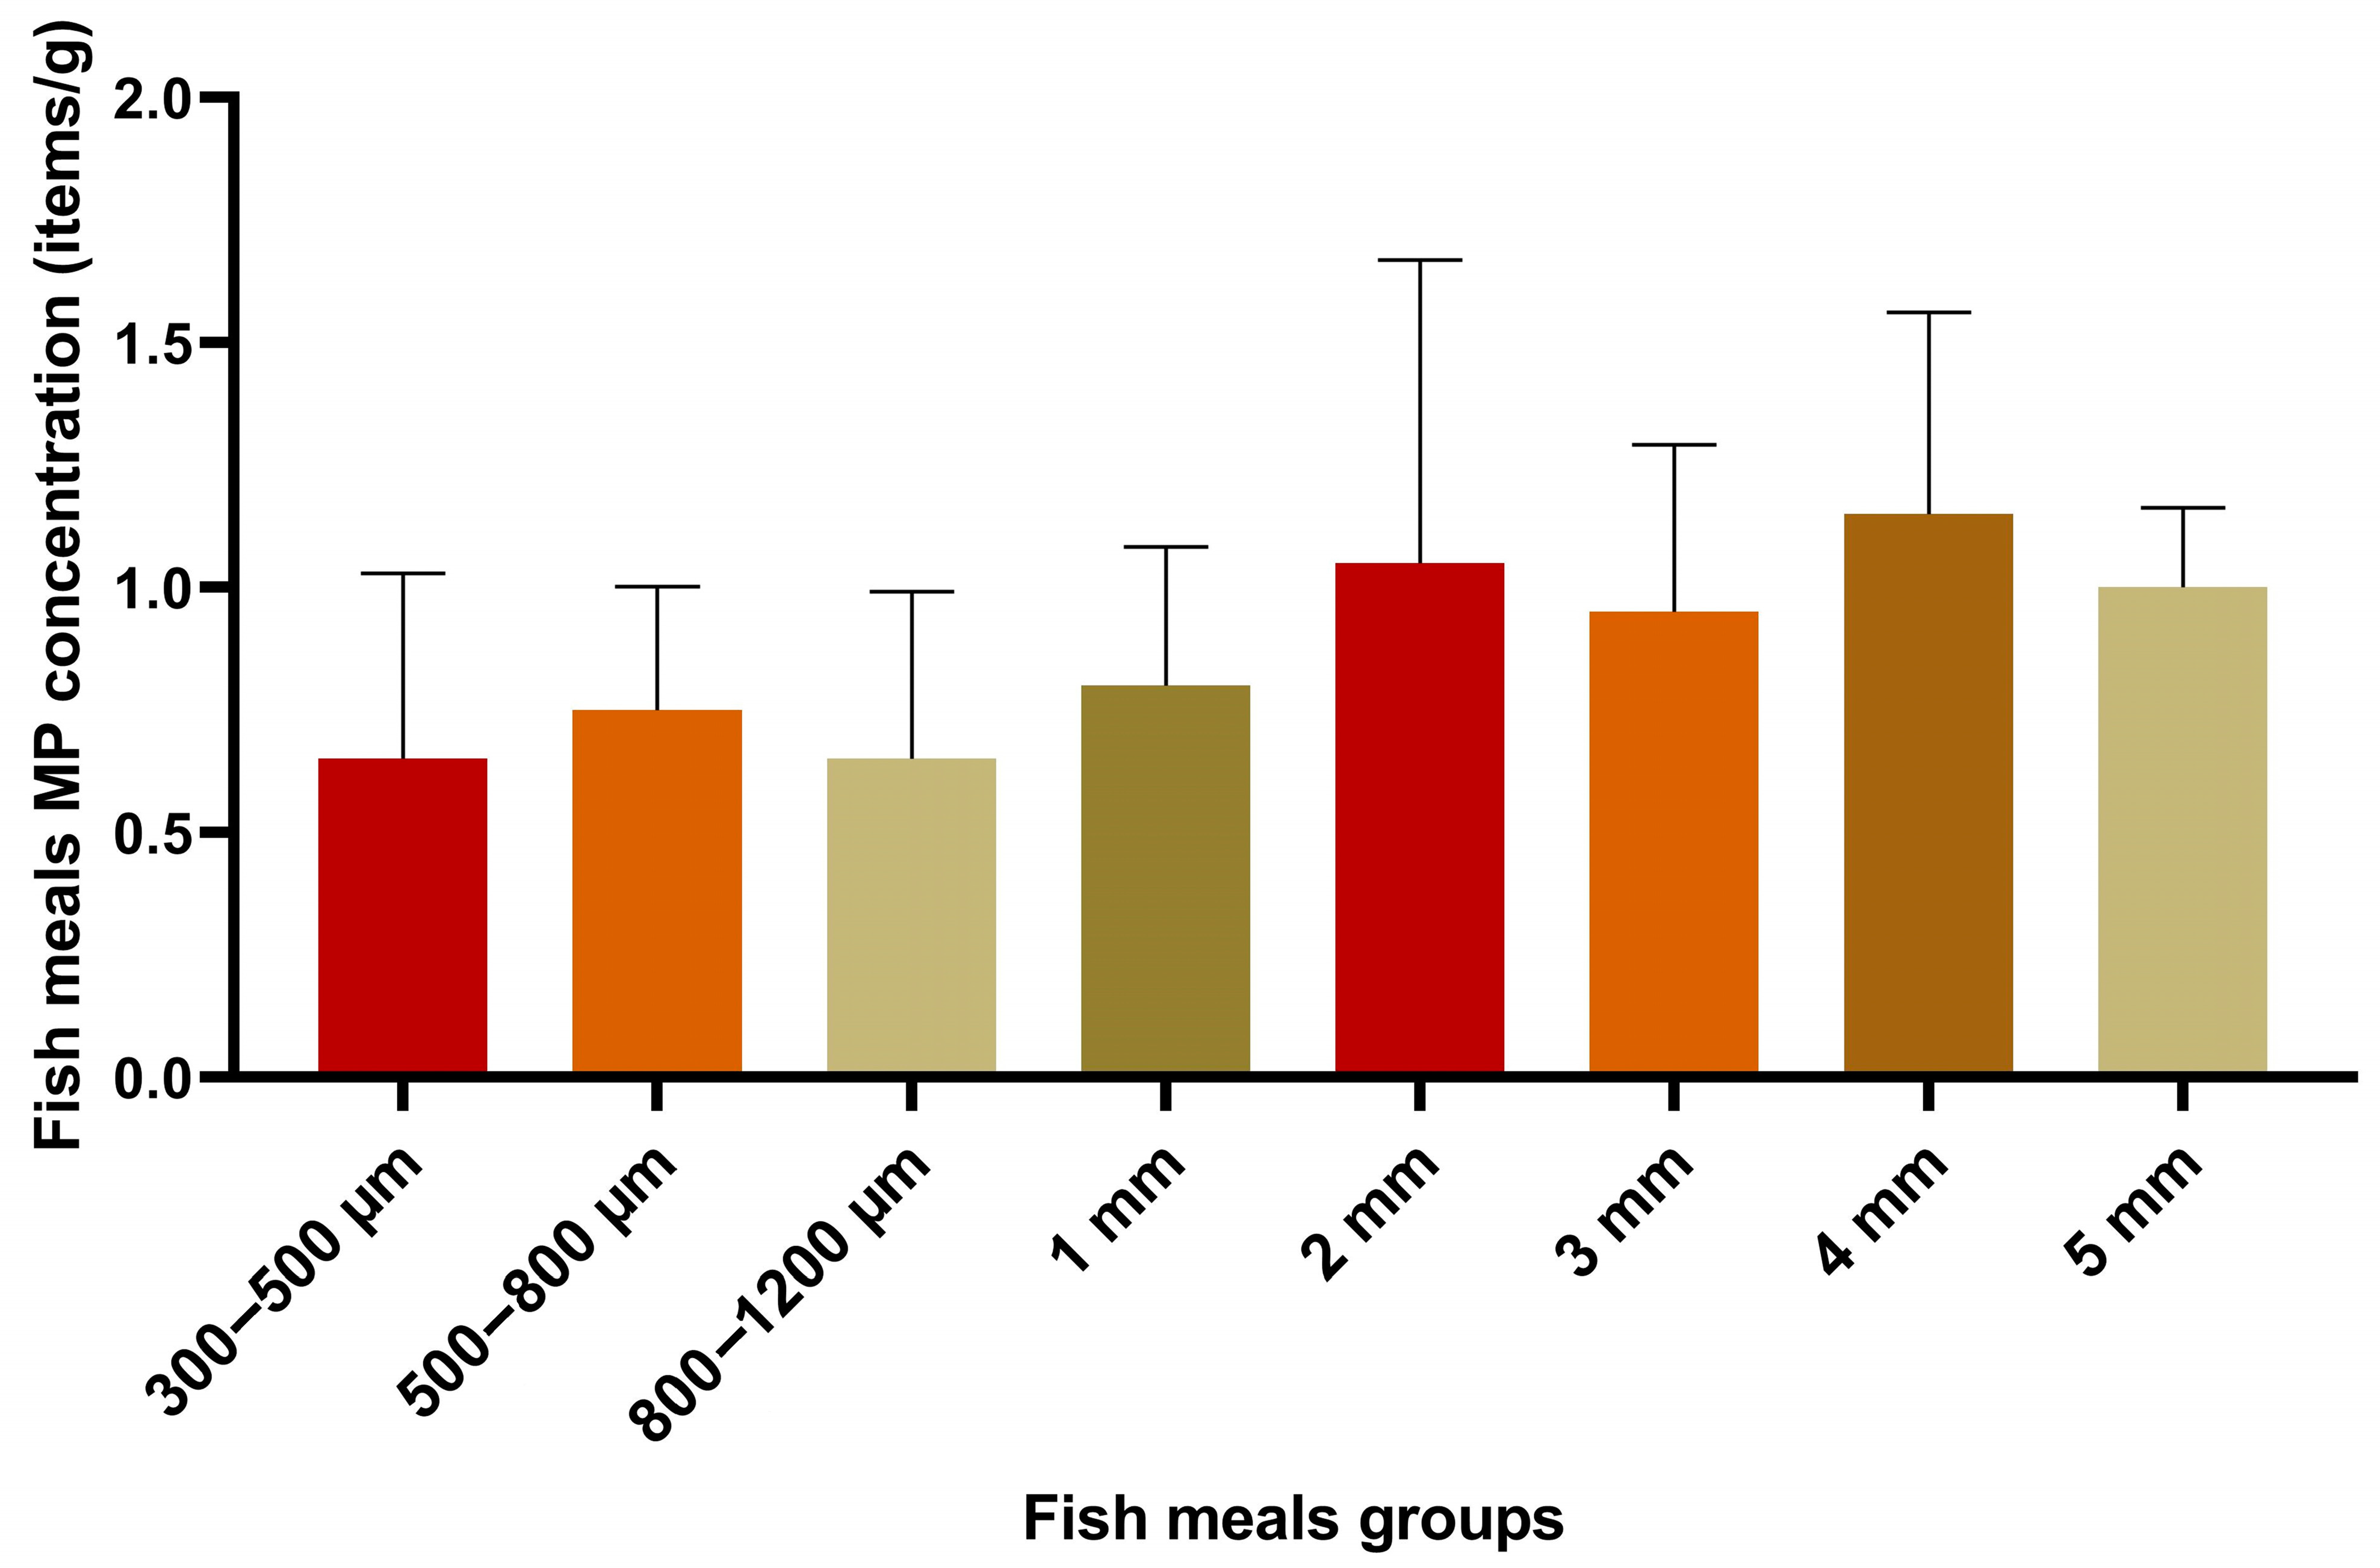
The average MP amount in 300–500 µm, 500–800 µm, 800–1200 µm, 1 mm, 2 mm, 3 mm, 4 mm, and 5 mm sized feeds, on which fish are fed according to their developmental periods, is 0.7 ± 0.4 items/g, 0.8. ± 0.3 items/g, 0.7 ± 0.3 items/g, 0.8 ± 0.3 items/g, 1.1 ± 0.6 items/g, 1.0 ± 0.3 items/g, 1.2 ± 0.4 items/g, and 1.0 ± 0.2 items/g, respectively (Figure 2). No significant difference was detected among the amount of MP in the different feed groups (p ˃ 0.05) (Figure 2).

Figure 2.
Distribution of MP in feed groups of O. mykiss during all life stages.
The dominant MP color was determined in the not taking food life stages of rainbow trout as black in sperm and egg, gray/white in fertilized egg, and blue in alevins (Figure 3A). In 10 g and 20–50 g fish, black color was dominant with 71.4% and 63.6%, respectively (Figure 3B). Similarly, in fish weighing 51–100 g, 150 g, and 200 g, the dominant MP color was black with 62.5%, 56.5%, and 48.1%, respectively (Figure 3C). In the feed groups, the dominant MP color was found to be black and blue in all groups (Figure 3D).
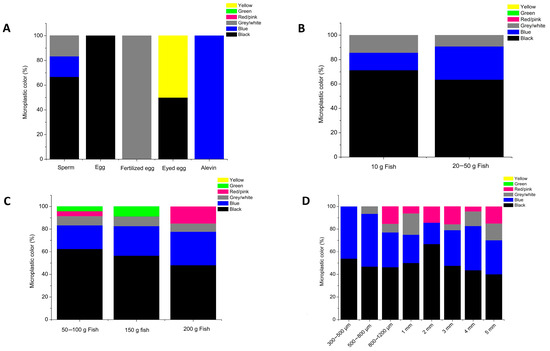
Figure 3.
MP color distribution in O. mykiss’ life stages (A–C) and feed (D).
Dominant MP sizes in non-feeding fish life stages was 51–100 µm in sperm and eyed egg groups; and it was determined as 101–300 µm in egg, fertilized egg, and alevins (Figure 4A). Dominant MP sizes were determined as 101–300 µm and 1001–3000 µm in 10 g and 20–50 g fish groups (Figure 4B).
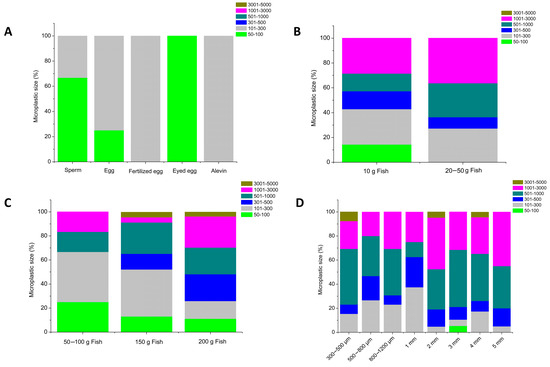
Figure 4.
Size distribution of MPs in O. mykiss’ life stages (A–C) and feed (D).
It was determined that 101–300 µm size MPs were dominant in the 51–100 g fish group with 41.7%, in the 150 g fish with 39.1%, and in the 200 g fish group, the 1001–3000 µm size was dominant with 25.9% (Figure 4C).
The observed dominant MP sizes in feeds were 501–1000 µm in 3 mm and 300–500 µm feed groups with 47.4% and 46.2% ratios, respectively, and the second dominant size was 1001–3000 µm in 5 mm feed groups with a 45.0% ratio (Figure 4D).
In our study, fiber and fragment form microplastics were observed as a result of microscope examination of all fish life stages and in the feeds used for these developmental periods (Figure 5). When MP shapes were examined, the dominant microplastic form was determined as fiber in all fish stages and feeds except eyed egg and fertilized egg groups (Figure 6).
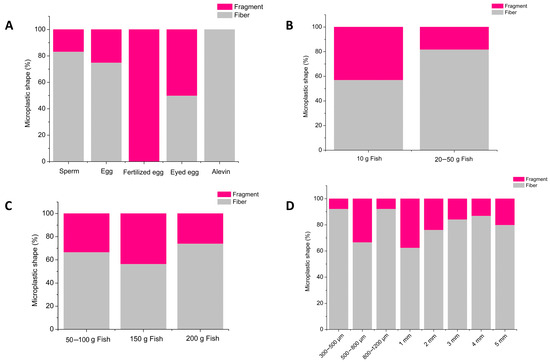
Figure 5.
Shape distribution of MPs in O. mykiss’ life stages (A–C) and feed (D).
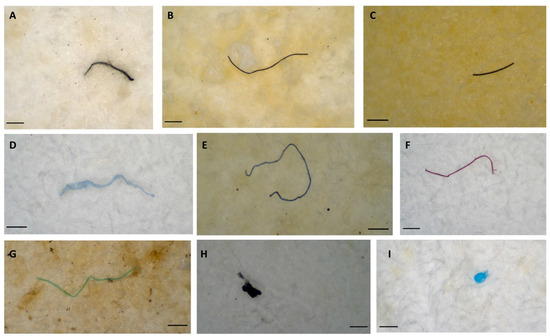
Figure 6.
Microscopic images (A–G; fibers, H,I; fragments) of MPs detected in the life stages of O. mykiss and in feed. Scale: 0.3 mm.
In the microplastics isolated in our study, six polymer types were determined. These were Polyethylene (PE), Polypropylene (PP), Polybutylene terephthalate (PBT), Polyvinyl alcohol (PVA), Polyamide (PA), and Polychloroprene (Neoprene) (Figure 7A). When we analyzed the polymer types of microparticles isolated in O. mykiss’ developmental stages and feeds, FTIR results were determined as 75% Polyethylene (PE) and 25% Polypropylene (PP) for 28.6% (4 MP) of the total microplastics (14 MP) in the not-feeding stages (sperm, egg, fertilized egg, eyed egg, and alevin) (Figure 7B).
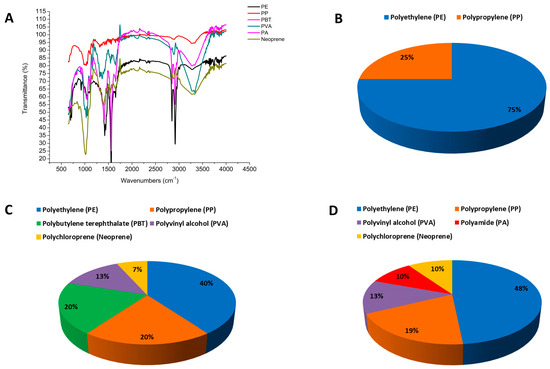
Figure 7.
FTIR polymer spectra and (A) polymer percentage distributions ((B): not feeding fish, (C): feeding fish, (D): feeds).
In this level, 16.3% (15 MP) of total microplastics (92 MP) was detected via FTIR in the taking external feed fish groups (10 g, 20–50 g, 51–100 g, 150 g, and 200 g fish) which were PE (40%), PP (20%), PBT (20%), PVA (13%), and neoprene (7%) (Figure 7C).
In order to evaluate the polymer types of MPs in fish feeds, FTIR analysis of 22.1% (31 MP) of the total MPs (140 MP) in the feed groups was performed and found as PE (48%), PP (19%), PVA (13%), PA (10%), and neoprene (10%) (Figure 7D).
5. Discussion
The most common interaction between aquatic organisms and MPs is the swallowing event. The size contributes to the perception of prey by visual predators, and MPs of a sizes comparable to prey are more prone to being actively swallowed by fish. In addition to color, shape, and size in general, smell can also contribute to the MP’s uptake of fish [16,17]. Feeding behavior in fish, species, age, spatial niche of the species, or population are also effective in the uptake of MPs. Aquatic organisms can be contaminated with MPs/NPs by consuming water contaminated with microplastics or by feeding on other organisms exposed to microplastics [17,18]. For the detection of MPs, fish species are good model organisms in terms of physiological, biochemical, and genetic changes in determining the ecotoxicity of plastics [19].
It is estimated that about 690 species were affected by marine plastic pollution in 2015, and at least 10% of these species ingested MP. It is known that organisms can mistake MPs for prey and swallow them directly. In addition, plastic debris, or MPs, have been detected in the intestines or different tissues of many marine organisms, including fish, bivalves, zooplankton, seabirds, turtles, and whales [20].
According to Li et al. (2020), the presence of MPs in fish may vary according to the nutritional status and habits of the fish. Omnivorous fish are known to consume a greater amount of MP fiber than herbivorous and carnivorous fish. However, the relationship between the types of feeding of fish (ingestion, filter feeding, sucking, etc.) and the properties of microplastics in the fish body (shape, abundance, size) is still not fully understood [17].
The uptake of MPs is also correlated with the concentration of MP, which is spatially and temporally variable. In addition, due to the stress at the time of catching in fish, MPs in the intestine contents have been reported to have a negative effect on the stomach contents [18]. Microplastics are taken up by aquatic organisms and transferred trophically to higher organisms in the food chain. In line with our literature review, this research is the first global attempt to provide a comprehensive study of the rainbow trout life cycle and plastic contamination in feeds used during these periods. Considering the relatively high levels of plastic detected, an important pattern has been uncovered for how plastic pollutants can enter the food chain. This is thought to be related to the consumed feeds. Similar to our results, Wang et al. (2022), Gündoğdu et al. (2021), and Thiele et al. (2021) reported that different fish meal with MP contamination and its use in aquaculture feeds is one of the key routes of possible plastic contamination to the seafood supply chain [14,21,22]. Fish meal is also used in freshwater farming and in fish cages, including lakes and seas. Fish meal is a way for MPs to enter the aquatic environment (increases by adding new ones to the decreasing MP amount) [22]. The relationships between MPs and aquaculture systems are extremely difficult to understand due to the variable and complex aquaculture environments [23]. The fish production sector directly benefits from plastic materials directly. In recent years, its lightness, durability, and affordability has made plastic an ideal resource. The nets, ropes, and other fishing equipment are rapidly turning to plastic day by day. Regardless of origin, MP waste from the fishing industry is common in aquatic environments, because larger plastics (macroplastics) can mix with wildlife, and the ingestion of smaller microplastics by organisms can cause significant health problems [24,25].
A general implication is that contamination found in aquaculture indicates both pollution from the area where the species is caught/raised, and pollution from post-harvest processing. However, the conditions during the processing and packaging of fish meal used in aquaculture can contribute to a certain level of plastic pollution, which can enter fish meal products at many stages during processing [21]. In terms of plastic content, it has been reported that the concentrations in commercial fish meal (even if it does not contain any microfibers) are higher than in the raw fish material, with microfibers potentially being able to enter the production process at any point. However, it has been stated that this situation could be supported by widespread microfiber contamination in the atmosphere, while fragments or films can enter the product together with the raw material or during the storage of the final product in the case of raw materials [22].
In our research findings, it was determined that there were differences in MP sizes between feeds and live samples. Thiele et al. (2021) reported in their study that 90% of the microplastics found in feeds are <1 mm in size [22]. While this result is in line with our current research findings, in addition to the differences between raw materials and end products, it is crucial to conduct additional research on microplastics in fish meal to help understand these inconsistencies between studies. At this point, the fish or parts used in fish feed thereof supports the following hypotheses: (i) fish may contain higher MP concentrations at harvesting time, (ii) MP contamination may have occurred during manufacturing processes, and (iii) more aggressive physical forces are used to break down microplastics during pressing and milling.
Polyethylene (PE) is the most widely studied MP species due to its ubiquity in aquatic ecosystems [26]. PE, as the dominant polymer type in our research findings, may have been caused by the composition of fish meal storage bags and the plastic tools/equipment in the aquaculture environment. Known for its high production volumes and widespread contamination in terrestrial/marine environments, PP, PS, and PE are the most common plastic polymers in fish meal. Small particles in fish meal samples may be at a higher rate than in large ones [27]. In our research findings, a positive relationship was found between MPs found in fish meal and accumulation in fish. However, the MP accumulation can be a reflection of different factors, such as fish species, exposure time, size, and exposure states [28]. The shape and plastic polymer composition of MPs were similar in both fish meal and living samples. The direct route of exposure of fish to MPs in aquaculture is usually through diet. Due to the lack of available information, further studies are required to evaluate the potential accumulation from MP uptake in the life cycle in fish.
Studies on the accumulation of MP in the gastrointestinal tract suggest that the narrow opening of the stomach and intestine, rich in helical structures, is ideal for the accumulation of plastic particles [29]. Another problem with nano- and microplastics is linked to their ability to penetrate organs such as gills, livers, and skin through the intestinal wall [30].
However, the amount of plastic present in the GIT was affected by the microplastic particle size, and smaller microplastics were consumed much more frequently than larger microplastics, regardless of fish size. The size contributes to the perception of prey by visual predators, and MPs of a size comparable to prey are more prone to being actively swallowed by fish. In addition to color, shape, and size in general, smell can also contribute to the fish’s MP uptake [30].
Atamanalp et al. (2023) fed rainbow trout with MP-PE-I and MP-PE-II for 45 days and reported that the density of MP-PE in the gastrointestinal tract increased as the exposure time increased, but this plastic was not found in muscle and liver tissues [10].
6. Conclusions
Considering the importance of fish meal for food safety, as well as the relationship of MPs with the fish grown and the feeds used in their cultivation, more research is needed to understand the direct and indirect effects of fish meal on consumers. Based on the latest literature information, it has become clear that airborne contaminations can occur even in clean environments and needs to be monitored.
It is not possible to separate plastic materials from fishing and aquaculture activities. Most fishing nets, fishing rods, tanks, and other tools are made of plastic or contain plastic components. As this equipment is used and disposed of, it can release MPs into the surrounding environment. This study is an important first step towards reducing the risks arising from aquaculture equipment, as the fishing industry both contributes and adversely affects the presence of plastic in aquatic environments. Evidence that MPs are found in fish meal is just beginning to emerge. By conducting research on commercially available samples to determine whether microplastics in fish meal may pose a problem, it will improve our understanding of the potential for MPs (fish) to enter the food chain via fish meal and inform future assessments of the relevant risks to food safety. In this sense, our study underlines that although there are controlled environments, the contamination originating from plastic materials used in aquaculture cannot be prevented, and that the highest rate of this contamination belongs to feeds.
Author Contributions
Conceptualization, G.A.; methodology, M.K.; software, M.A.; validation, M.K. and N.E.; formal analysis, G.A. and N.E.; data curation, E.M.K., S.Ö., A.U. and V.P.; writing—original draft preparation, G.A.; writing—review and editing, G.A. and M.A.; visualization, G.A.; supervision, G.A., M.K. and M.A.; project administration, G.A.; funding acquisition, G.A. and M.A. All authors have read and agreed to the published version of the manuscript.
Funding
This research received no external funding.
Institutional Review Board Statement
Not applicable.
Informed Consent Statement
Not applicable.
Data Availability Statement
The data that support the findings of this study are available from the corresponding author upon reasonable request.
Conflicts of Interest
The authors declare no conflict of interest.
References
- Kershaw, P.J.; Turra, A.; Galgani, F. Guidelines for the Monitoring and Assessment of Plastic Litter and Microplastics in the Ocean; GESAMP Joint Group of Experts on the Scientific Aspects of Marine Environmental Protection: London, UK, 2019. [Google Scholar] [CrossRef]
- Sun, Y.; Yuan, J.; Zhou, T.; Zhao, Y.; Yu, F.; Ma, J. Laboratory simulation of microplastics weathering and its adsorption behaviors in an aqueous environment: A systematic review. Environ. Pollut. 2020, 265, 114864. [Google Scholar] [CrossRef] [PubMed]
- Salerno, M.; Berlino, M.; Mangano, M.C.; Sarà, G. Microplastics and the functional traits of fishes: A global meta-analysis. Glob. Chang. Biol. 2021, 27, 2645–2655. [Google Scholar] [CrossRef] [PubMed]
- Sanchez-Matos, J.; Regueiro, L.; González-García, S.; Vázquez-Rowe, I. Environmental performance of rainbow trout (Oncorhynchus mykiss) production in Galicia-Spain: A Life Cycle Assessment approach. Sci. Total Environ. 2023, 856, 159049. [Google Scholar] [CrossRef] [PubMed]
- TUIK. 2022. Available online: https://data.tuik.gov.tr/Bulten/Index?p=Fishery-Products-2022-49678 (accessed on 20 August 2023).
- Ghafarifarsani, H.; Yousefi, M.; Hoseinifar, S.H.; Paolucci, M.; Lumsangkul, C.; Jaturasitha, S.; Van Doan, H. Beneficial effects of Persian shallot (Allium hirtifolium) extract on growth performance, biochemical, immunological and antioxidant responses of rainbow trout Oncorhynchus mykiss fingerlings. Aquaculture 2022, 555, 738162. [Google Scholar] [CrossRef]
- Aas, T.S.; Åsgård, T.; Ytrestøyl, T. Utilization of feed resources in the production of rainbow trout (Oncorhynchus mykiss) in Norway in 2020. Aquac. Rep. 2022, 26, 101317. [Google Scholar] [CrossRef]
- Malone, E.W.; Perkin, J.S.; Keith Gibbs, W.; Padgett, M.; Kulp, M.; Moore, S.E. High and dry in days gone by: Life-history theory predicts Appalachian mountain stream fish assemblage transformation during historical drought. Ecol. Freshw. Fish. 2022, 31, 29–44. [Google Scholar] [CrossRef]
- Chen, G.; Li, Y.; Wang, J. Occurrence and ecological impact of microplastics in aquaculture ecosystems. Chemosphere 2021, 274, 129989. [Google Scholar] [CrossRef]
- Atamanalp, M.; Kırıcı, M.; Köktürk, M.; Kırıcı, M.; Kocaman, E.M.; Ucar, A.; Parlak, V.; Özcan, S.; Yanık, T.; Alak, G. Polyethylene exposure in rainbow trout; suppresses growth and may act as a promoting agent in tissue-based oxidative response, DNA damage and apoptosis. Process Saf. Environ. Prot. 2023, 174, 960–970. [Google Scholar] [CrossRef]
- Campanale, C.; Massarelli, C.; Savino, I.; Locaputo, V.; Uricchio, V.F. A detailed review study on potential effects of microplastics and additives of concern on human health. Int. J. Environ. Res. Public Health 2020, 17, 1212. [Google Scholar] [CrossRef]
- Prinz, N.; Korez, Š. Understanding how microplastics affect marine biota on the cellular level is important for assessing ecosystem function: A review. In YOUMARES 9-The Oceans: Our Research, Our Future: Proceedings of the 2018 Conference for Young Marine Researcher in Oldenburg, Germany; Springer International Publishing: Berlin/Heidelberg, Germany, 2020; pp. 101–120. [Google Scholar]
- Munno, K.; Helm, P.A.; Jackson, D.A.; Rochman, C.; Sims, A. Impacts of temperature and selected chemical digestion methods on microplastic particles. Environ. Toxicol. Chem. 2018, 37, 91–98. [Google Scholar] [CrossRef]
- Wang, Q.; Li, J.; Zhu, X.; Sun, C.; Teng, J.; Chen, L.; Shan, E.; Zhao, J. Microplastics in fish meals: An exposure route for aquaculture animals. Sci. Total Environ. 2022, 807, 151049. [Google Scholar] [CrossRef]
- Clere, I.K.; Ahmmed, F.; Peter III, J.G.; Fraser-Miller, S.J.; Gordon, K.C.; Komyakova, V.; Allan, B.J. Quantification and characterization of microplastics in commercial fish from southern New Zealand. Mar. Pollut. Bull. 2022, 184, 114121. [Google Scholar] [CrossRef]
- Barboza, L.G.A.; Cunha, S.C.; Monteiro, C.; Fernandes, J.O.; Guilhermino, L. Bisphenol A and its analogs in muscle and liver of fish from the North East Atlantic Ocean in relation to microplastic contamination. Exposure and risk to human consumers. J. Hazard. Mater. 2020, 393, 122419. [Google Scholar] [CrossRef] [PubMed]
- Li, Z.; Li, Q.; Li, R.; Zhao, Y.; Geng, J.; Wang, G. Physiological responses of lettuce (Lactuca sativa L.) to microplastic pollution. Environ. Sci. Pollut. Res. 2020, 27, 30306–30314. [Google Scholar] [CrossRef] [PubMed]
- Baalkhuyur, F.M.; Qurban, M.A.; Panickan, P.; Duarte, C.M. Microplastics in fishes of commercial and ecological importance from the Western Arabian Gulf. Mar. Pollut. Bull. 2020, 152, 110920. [Google Scholar] [CrossRef]
- Rai, P.K.; Lee, J.; Brown, R.J.; Kim, K.H. Environmental fate, ecotoxicity biomarkers, and potential health effects of micro-and nano-scale plastic contamination. J. Hazard. Mater. 2021, 403, 123910. [Google Scholar] [CrossRef]
- Alak, G.; Uçar, A.; Parlak, V.; Atamanalp, M. Identification, characterisation of microplastic and their effects on aquatic organisms. Chem. Ecol. 2022, 38, 967–987. [Google Scholar] [CrossRef]
- Gündoğdu, S.; Eroldoğan, O.T.; Evliyaoğlu, E.; Turchini, G.M.; Wu, X.G. Fish out, plastic in: Global pattern of plastics in commercial fishmeal. Aquaculture 2021, 534, 736316. [Google Scholar] [CrossRef]
- Thiele, C.J.; Hudson, M.D.; Russell, A.E.; Saluveer, M.; Sidaoui-Haddad, G. Microplastics in fish and fishmeal: An emerging environmental challenge? Sci. Rep. 2021, 11, 2045. [Google Scholar] [CrossRef]
- Zhou, A.; Zhang, Y.; Xie, S.; Chen, Y.; Li, X.; Wang, J.; Zou, J. Microplastics and their potential effects on the aquaculture systems: A critical review. Rev. Aquac. 2021, 13, 719–733. [Google Scholar] [CrossRef]
- Walkinshaw, C.; Tolhurst, T.J.; Lindeque, P.K.; Thompson, R.; Cole, M. Detection and characterisation of microplastics and microfibres in fishmeal and soybean meal. Mar. Pollut. Bull. 2022, 185, 114189. [Google Scholar] [CrossRef] [PubMed]
- Wootton, N.; Nursey-Bray, M.; Reis-Santos, P.; Gillanders, B.M. Perceptions of plastic pollution in a prominent fishery: Building strategies to inform management. Mar. Policy 2022, 135, 104846. [Google Scholar] [CrossRef]
- Miloloža, M.; Kučić Grgić, D.; Bolanča, T.; Ukić, Š.; Cvetnić, M.; Ocelić Bulatović, V.; Dionysiou, D.D.; Kušić, H. Ecotoxicological assessment of microplastics in freshwater sources—A review. Water 2020, 13, 56. [Google Scholar] [CrossRef]
- Hanachi, P.; Karbalaei, S.; Walker, T.R.; Cole, M.; Hosseini, S.V. Abundance and properties of microplastics found in commercial fish meal and cultured common carp (Cyprinus carpio). Environ. Sci. Pollut. Res. 2019, 26, 23777–23787. [Google Scholar] [CrossRef]
- Ding, J.; Zhang, S.; Razanajatovo, R.M.; Zou, H.; Zhu, W. Accumulation, tissue distribution, and biochemical effects of polystyrene microplastics in the freshwater fish red tilapia (Oreochromis niloticus). Environ. Pollut. 2018, 238, 1–9. [Google Scholar] [CrossRef] [PubMed]
- Franzellitti, S.; Canesi, L.; Auguste, M.; Wathsala, R.H.; Fabbri, E. Microplastic exposure and effects in aquatic organisms: A physiological perspective. Environ. Toxicol. Pharmacol. 2019, 68, 37–51. [Google Scholar] [CrossRef]
- Hodkovicova, N.; Hollerova, A.; Svobodova, Z.; Faldyna, M.; Faggio, C. Effects of plastic particles on aquatic invertebrates and fish—A review. Environ. Toxicol. Pharmacol. 2022, 96, 104013. [Google Scholar] [CrossRef]


Disclaimer/Publisher’s Note: The statements, opinions and data contained in all publications are solely those of the individual author(s) and contributor(s) and not of MDPI and/or the editor(s). MDPI and/or the editor(s) disclaim responsibility for any injury to people or property resulting from any ideas, methods, instructions or products referred to in the content. |
© 2023 by the authors. Licensee MDPI, Basel, Switzerland. This article is an open access article distributed under the terms and conditions of the Creative Commons Attribution (CC BY) license (https://creativecommons.org/licenses/by/4.0/).