
Effects of Wind Erosion Control Measures on Vegetation Dynamics and Soil-Surface Materials through Field Observations and Vegetation Indices in Arid Areas, Southeastern Tunisia

Abstract
:1. Introduction
2. Materials and Methods
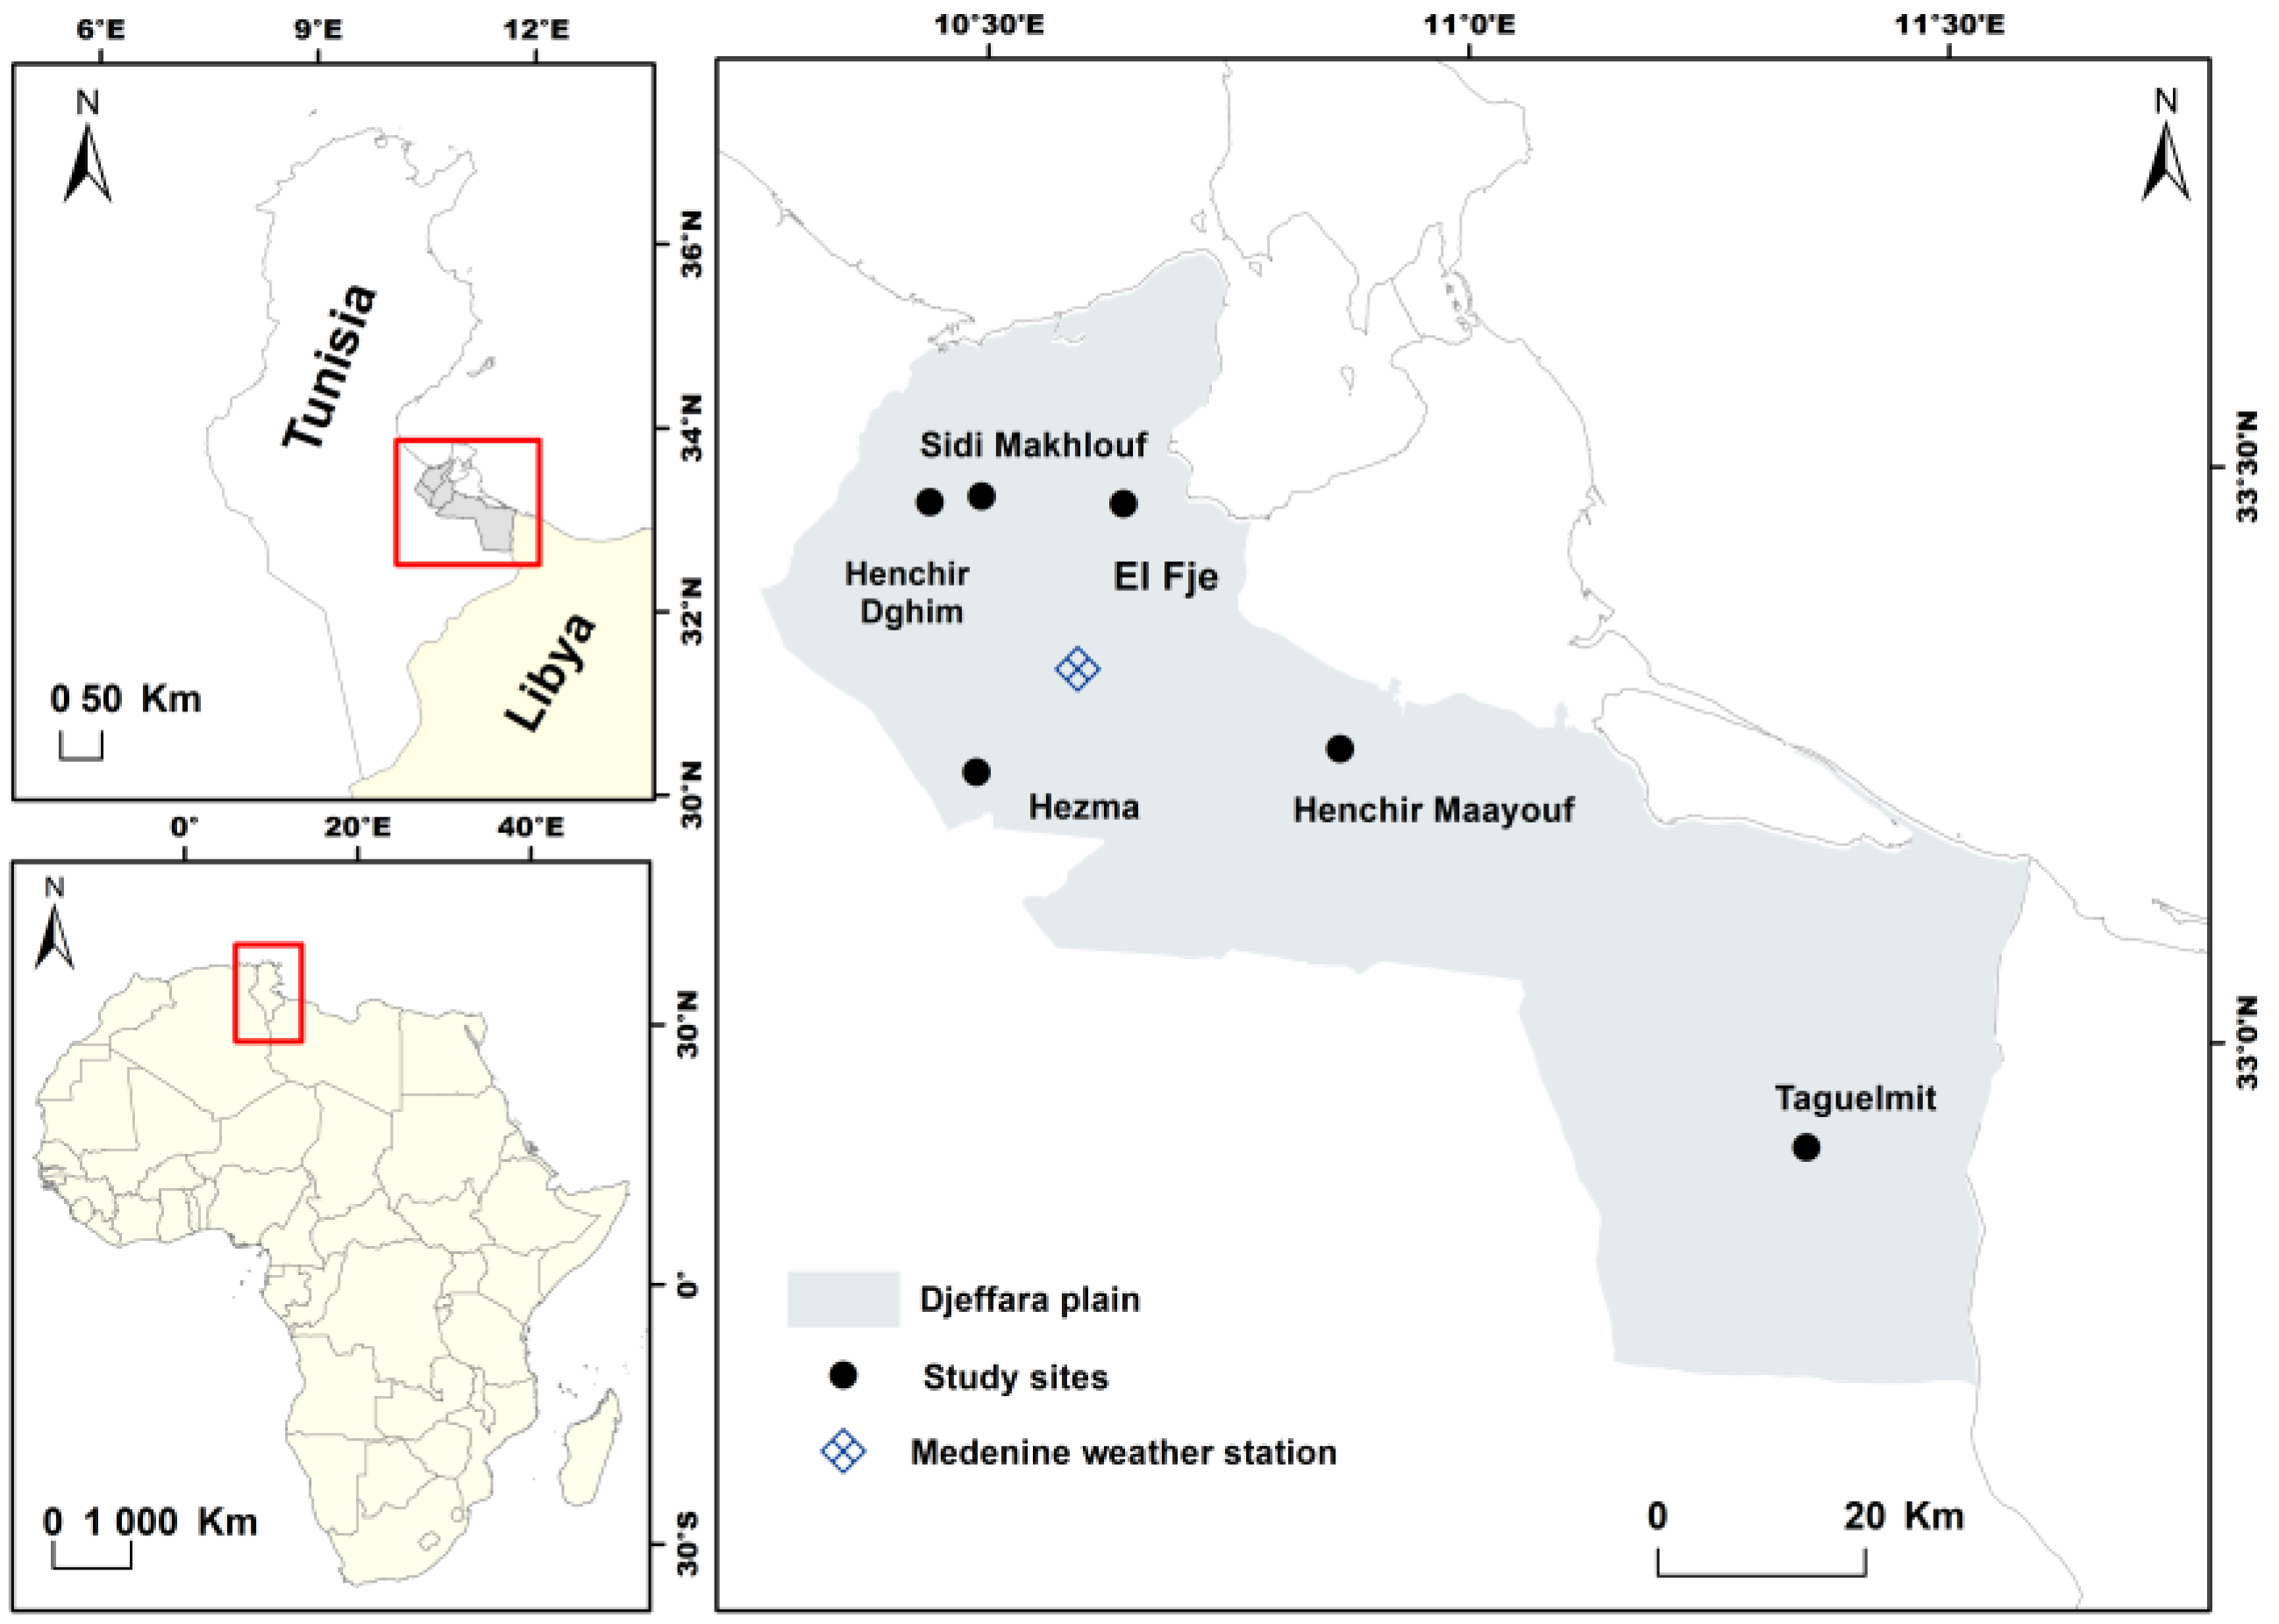
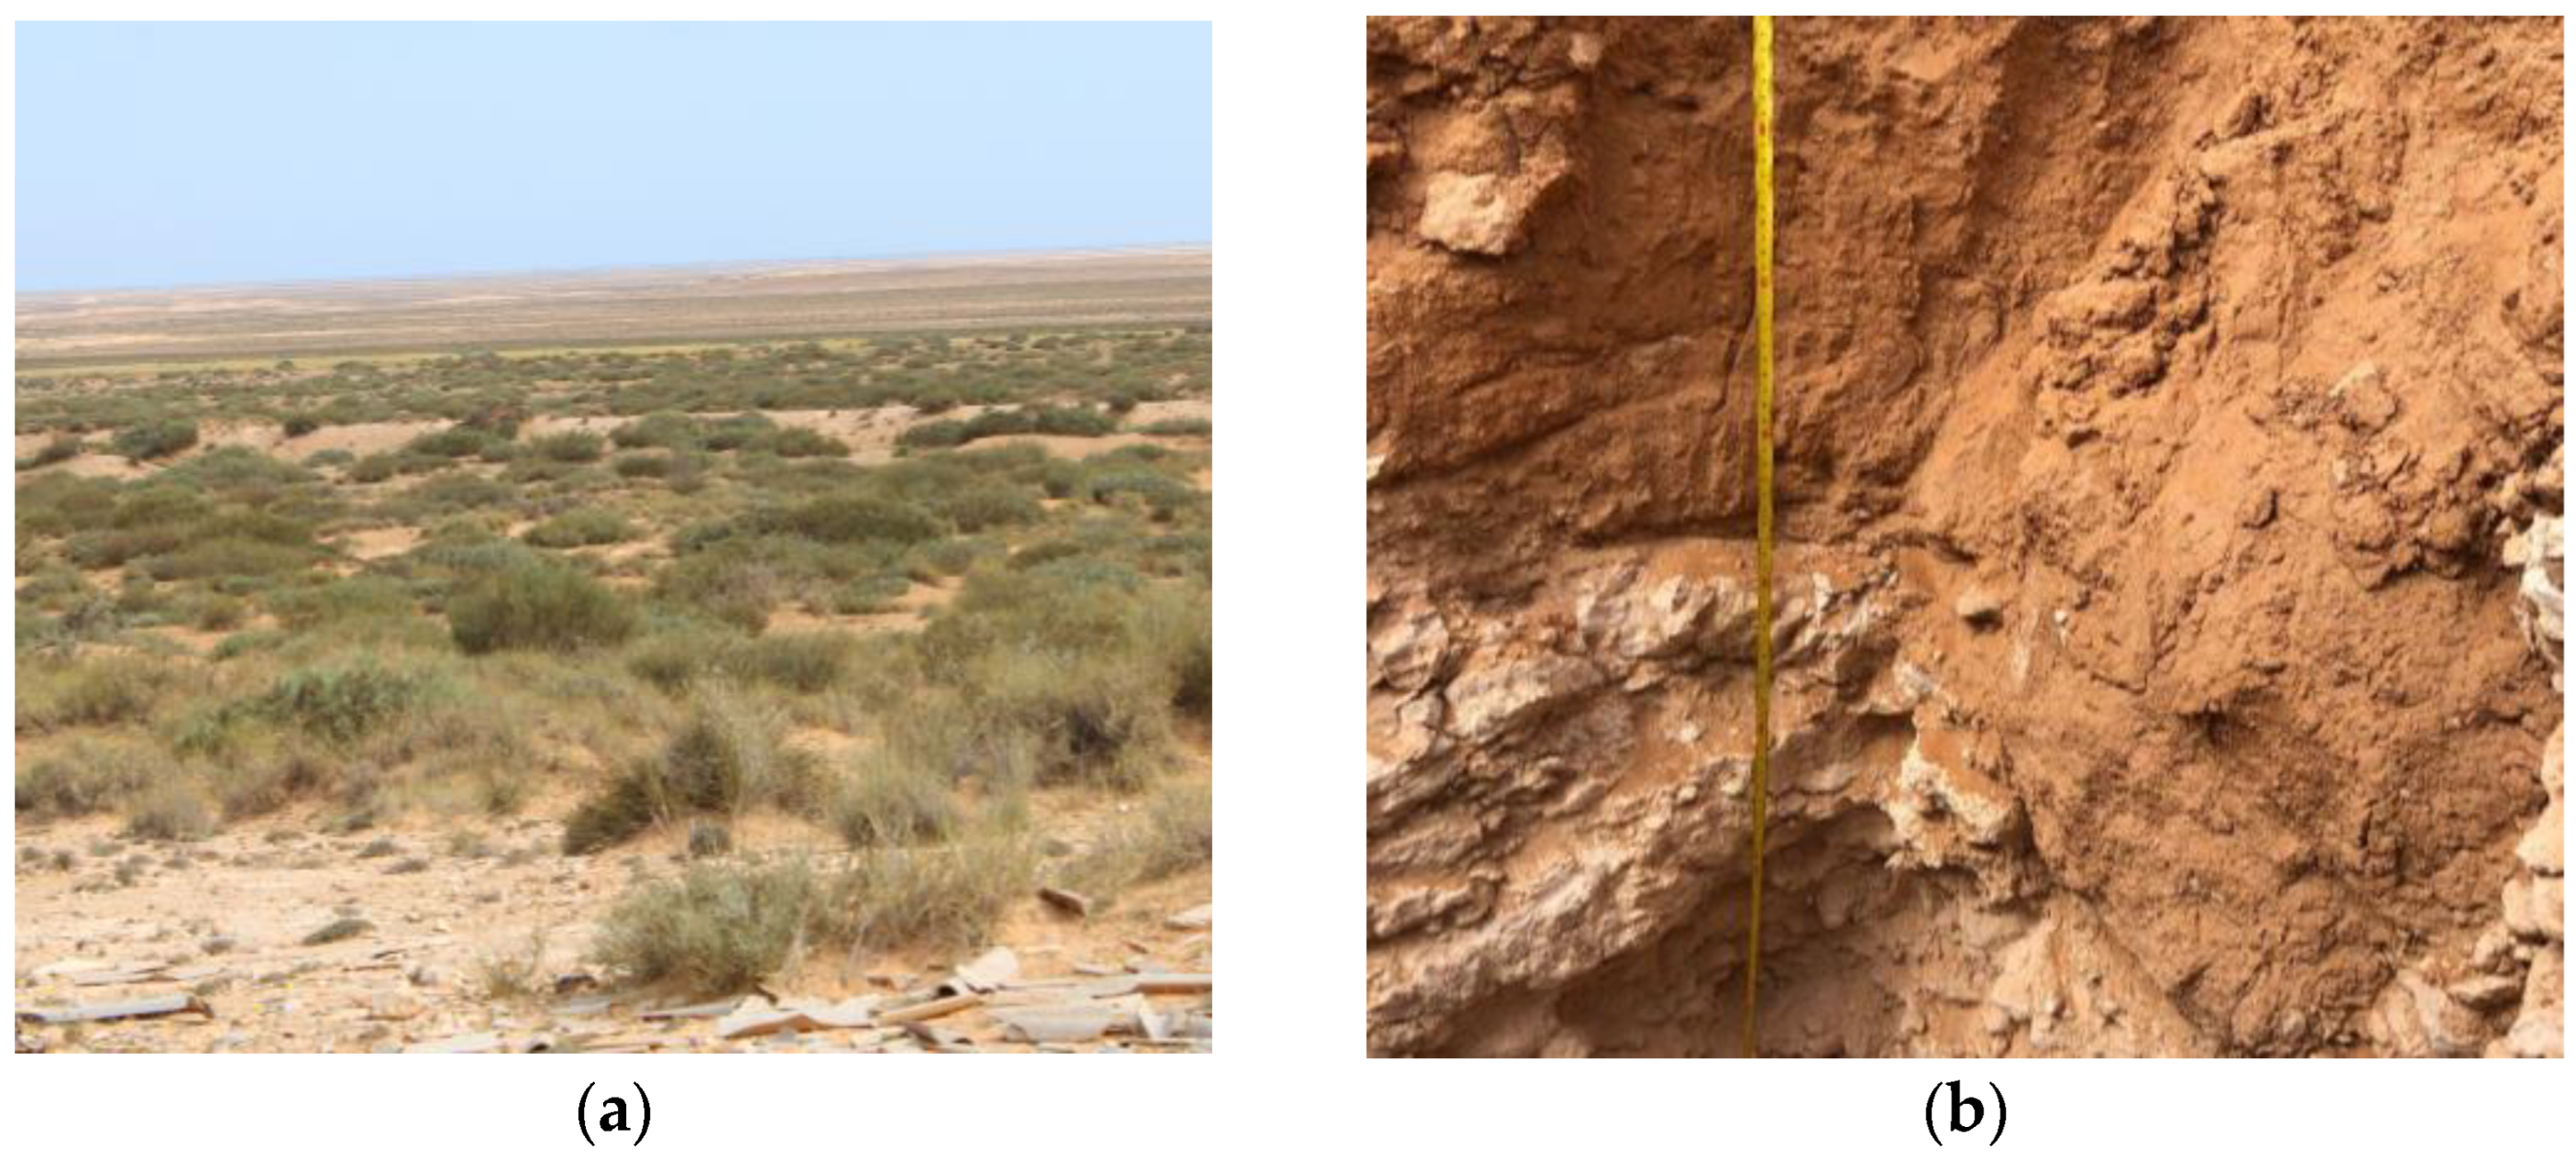
2.1. Site Description
2.2. Methodology
2.2.1. Vegetation Monitoring
2.2.2. Satellite Data Processing
2.2.3. Data Analysis
3. Results
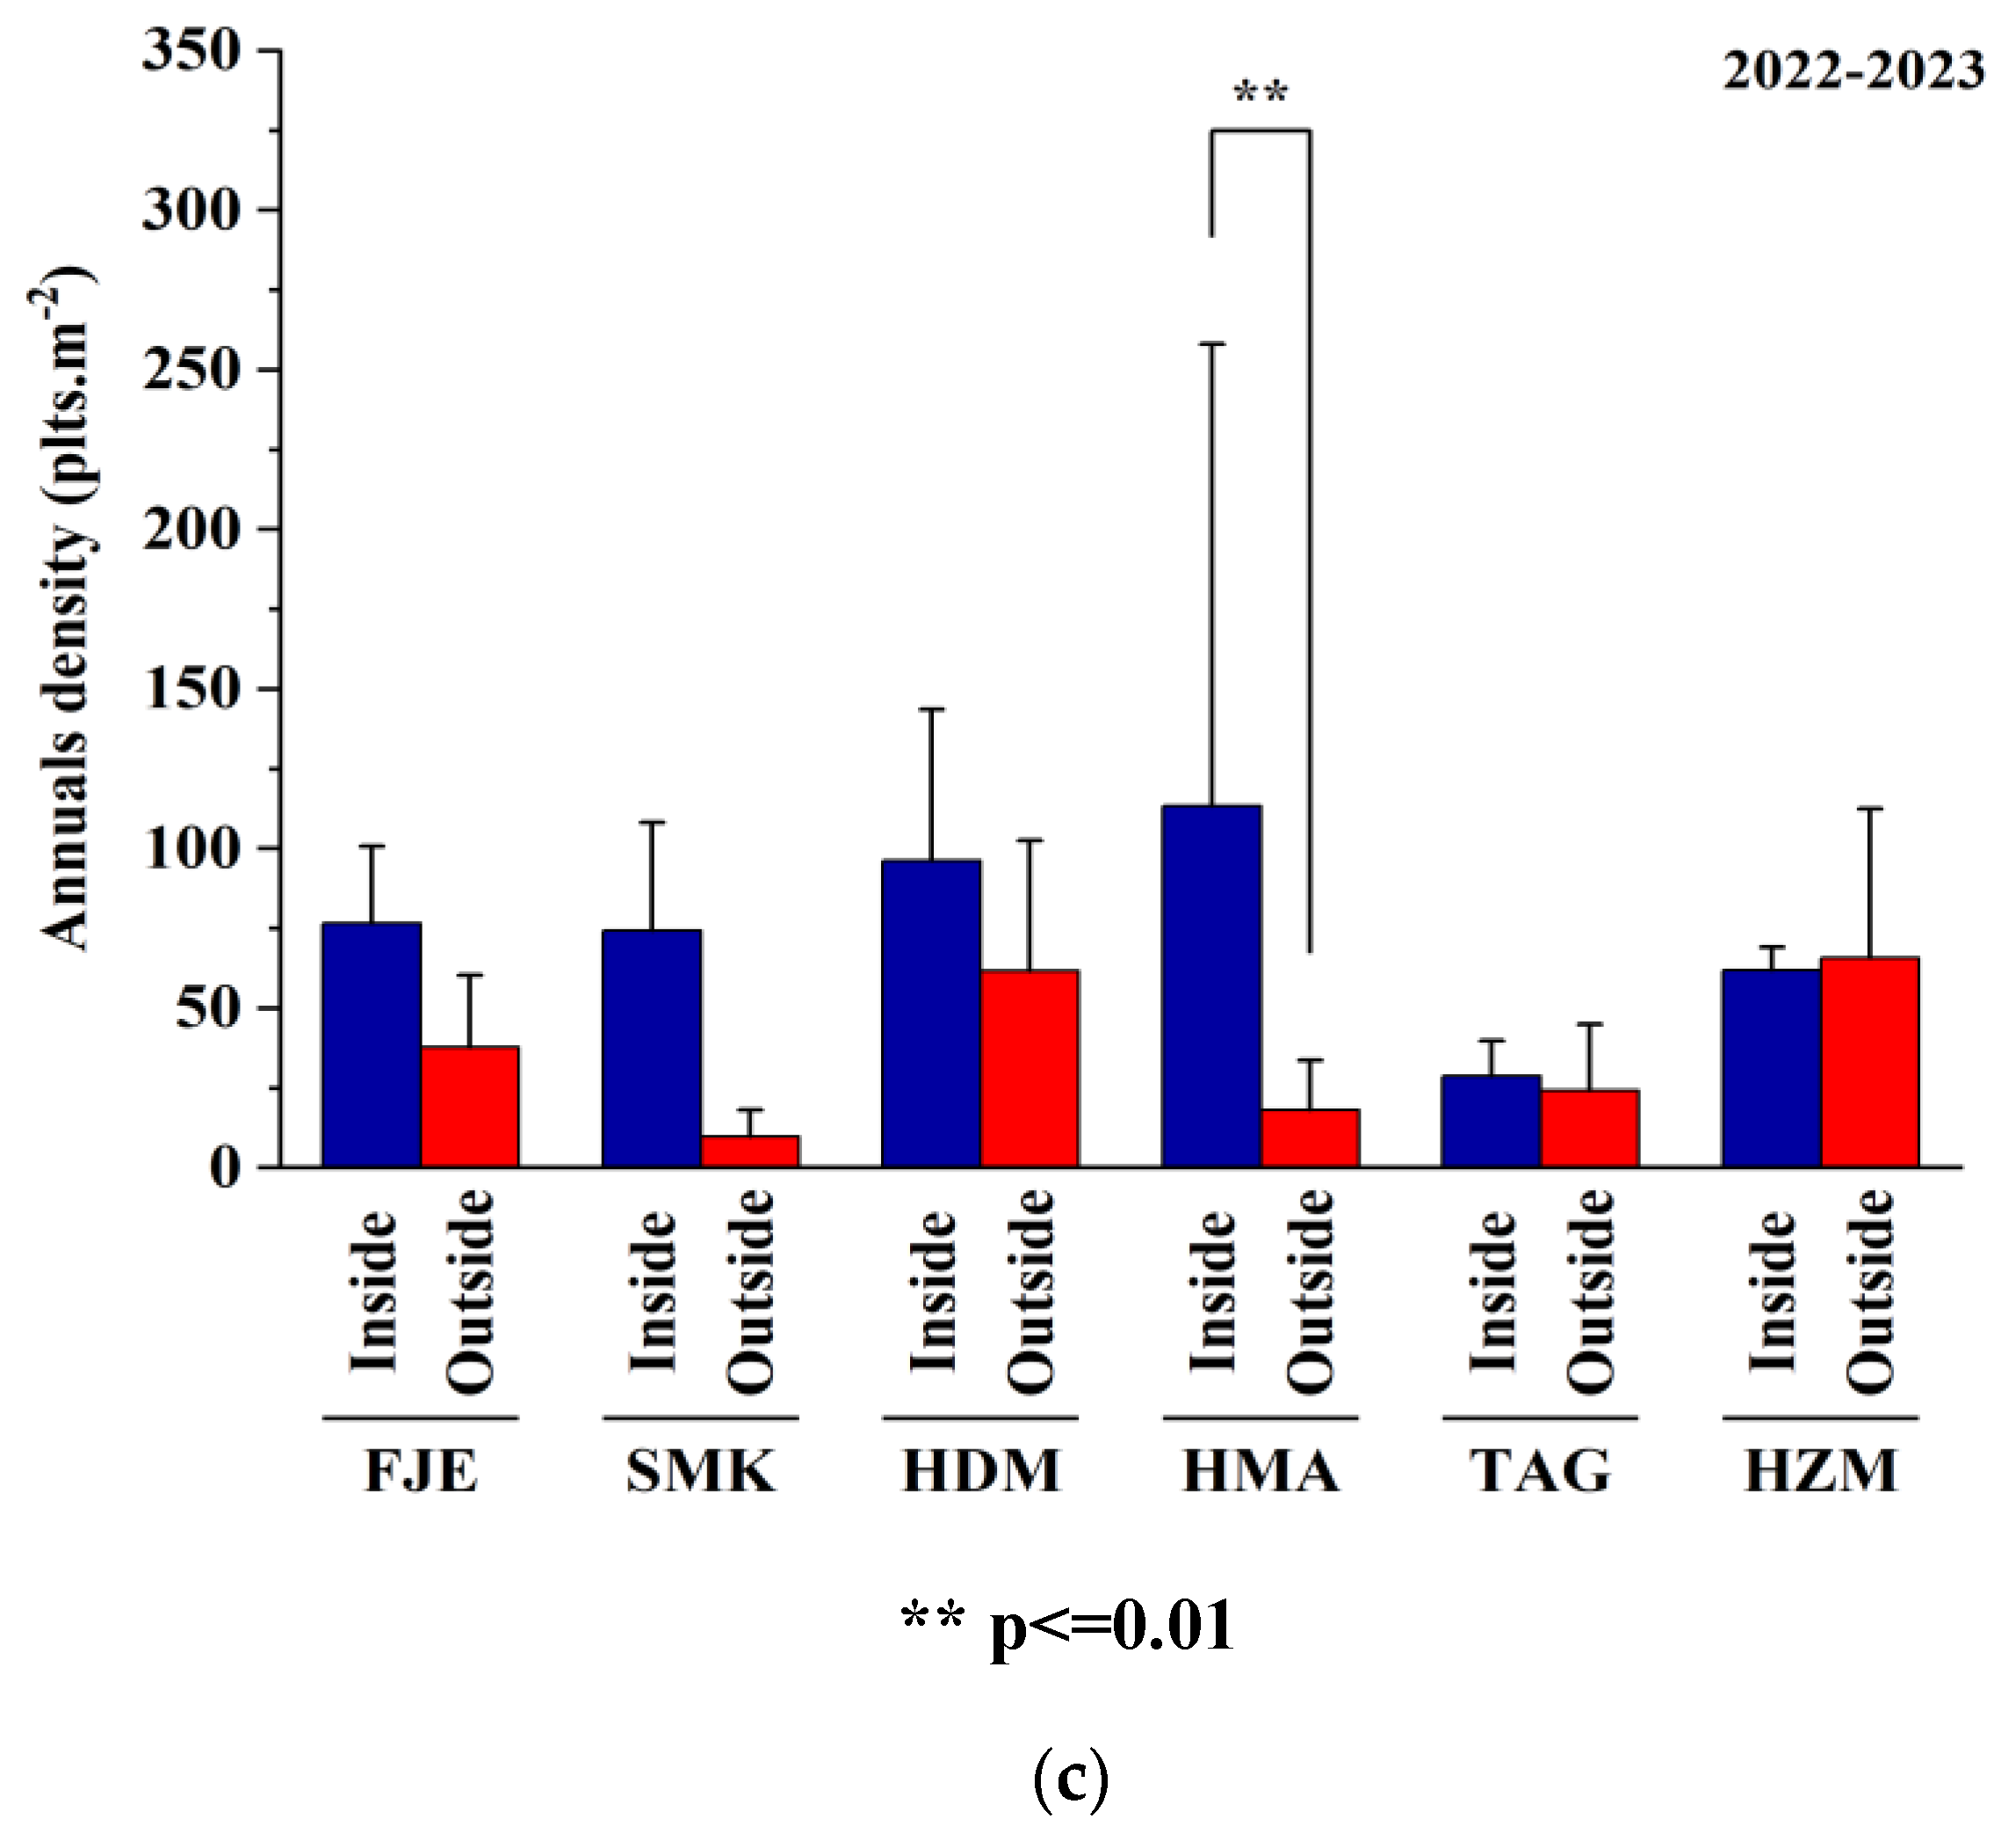
3.1. Plant Density
3.2. Vegetation Cover
3.3. Diversity
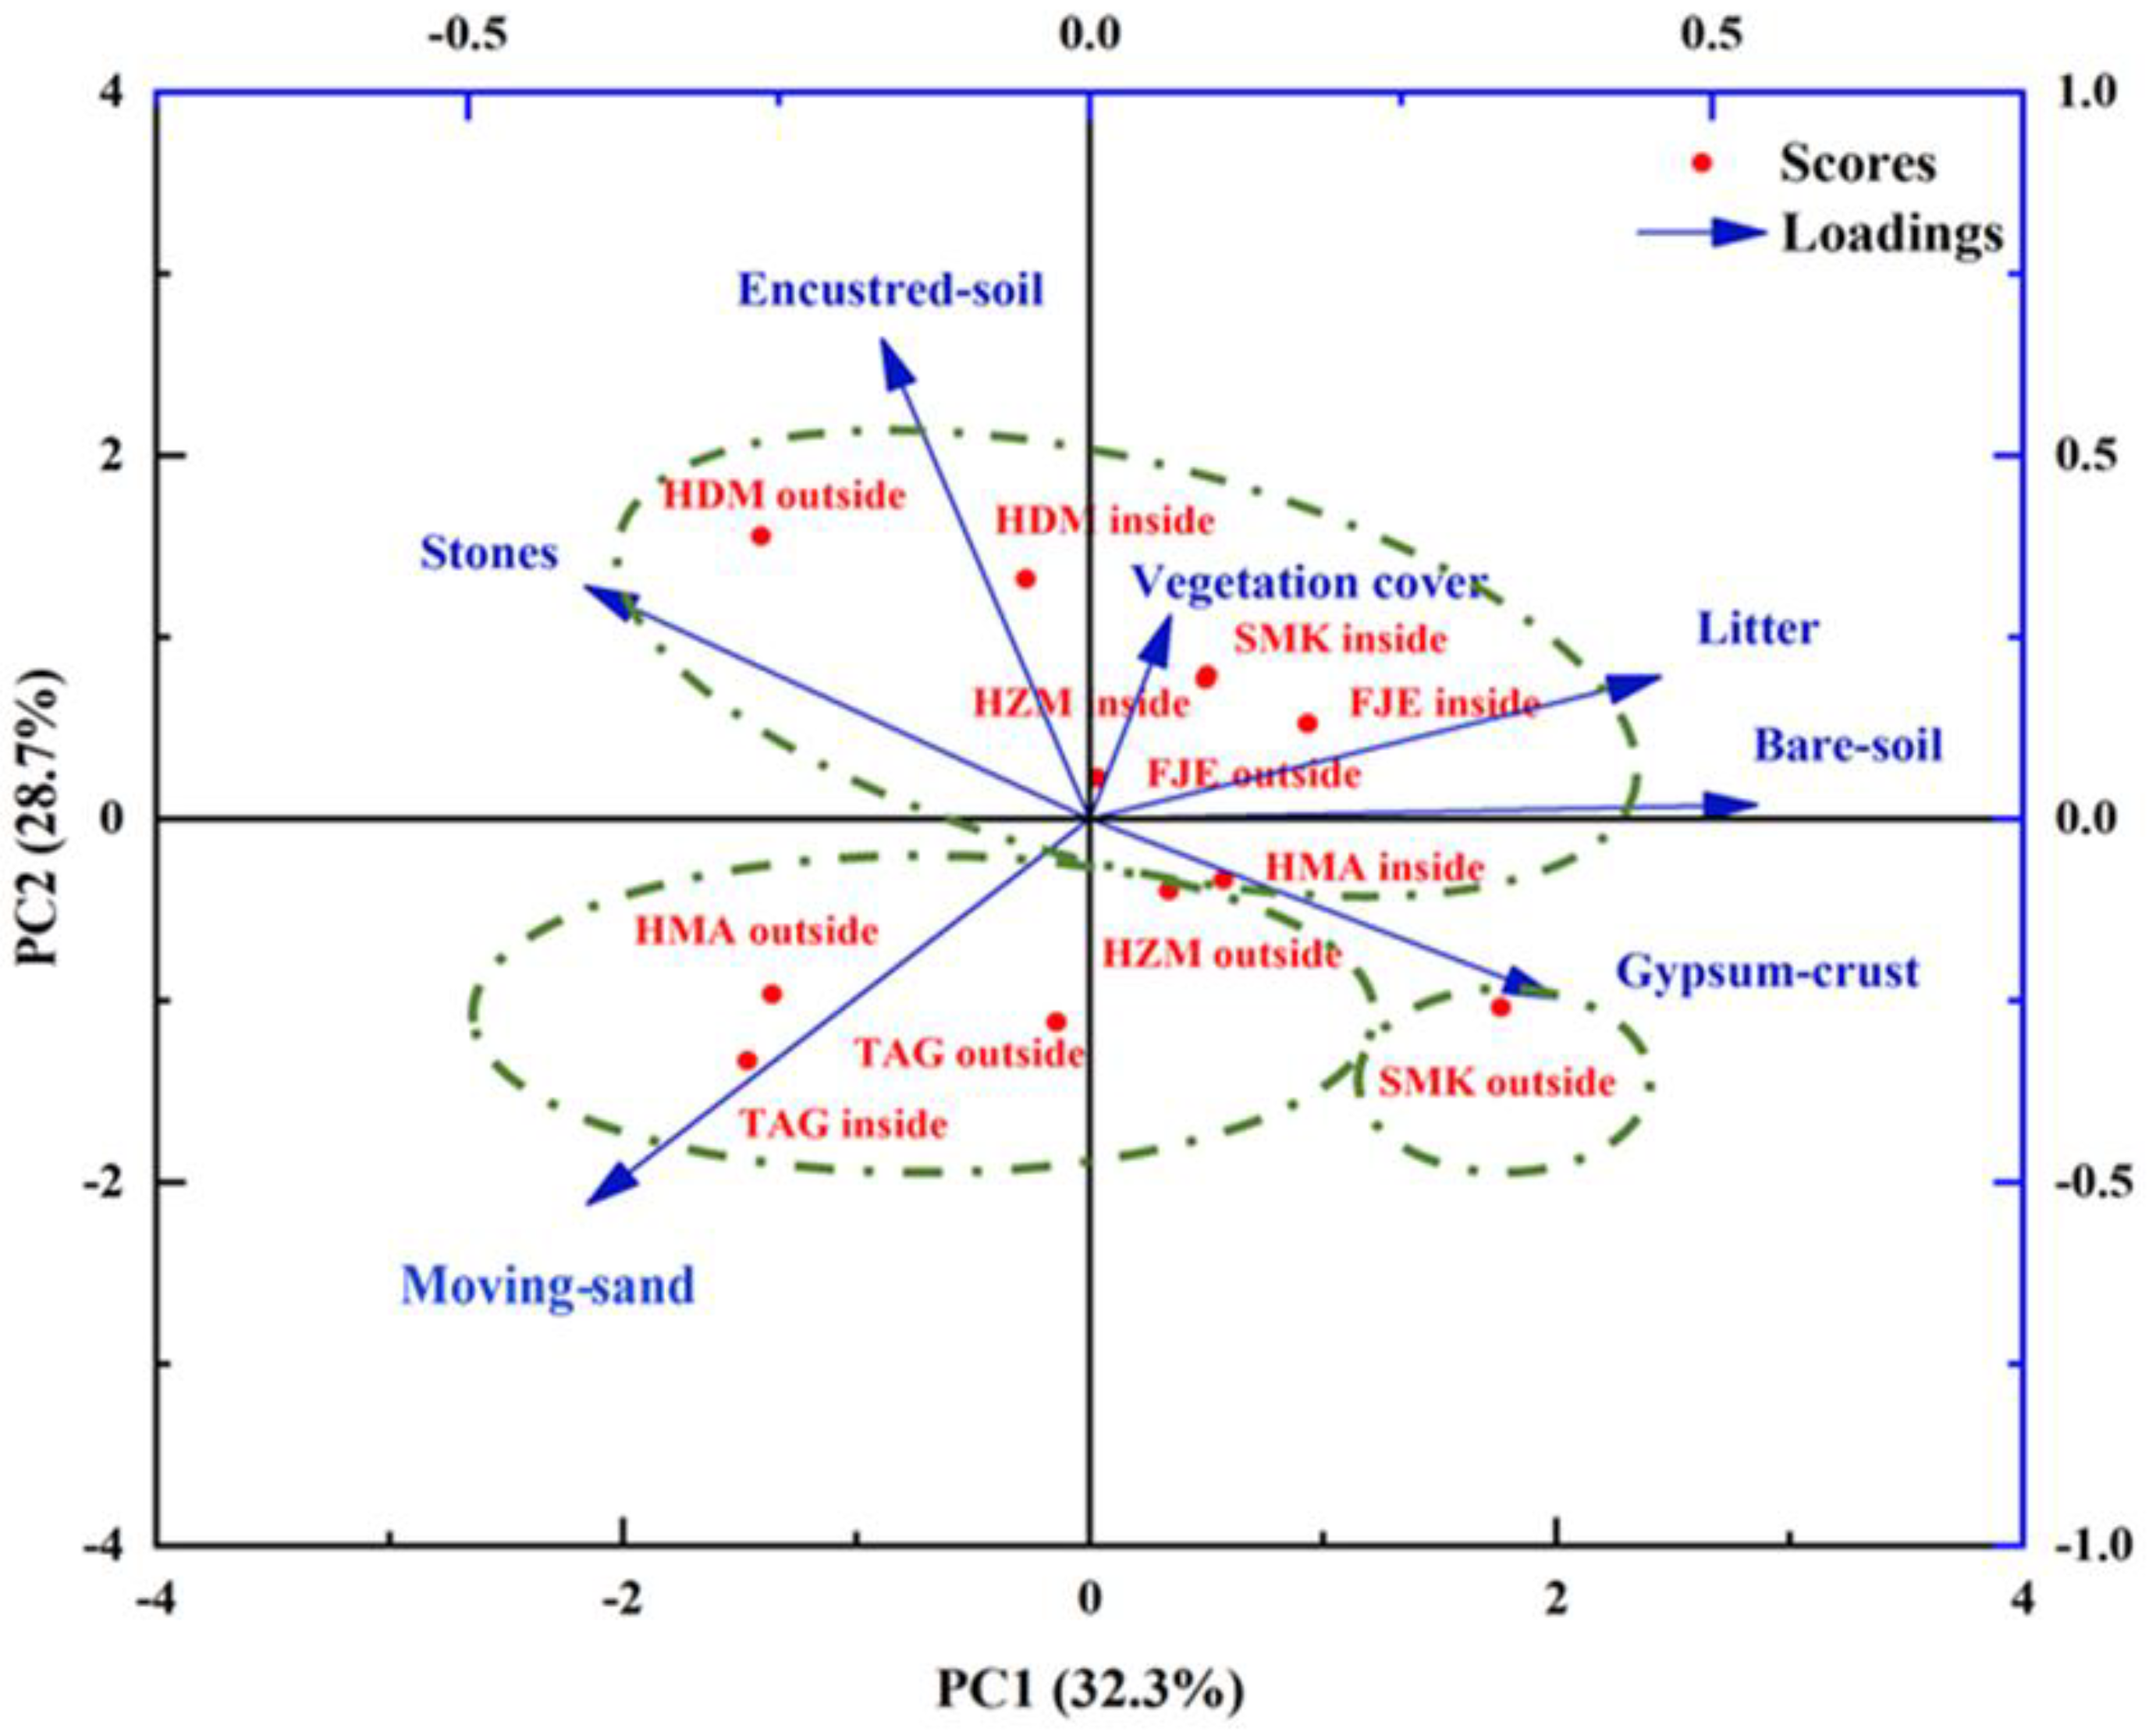
3.4. Soil-Surface Materials
3.5. Vegetation Indices
4. Discussion
4.1. Plant Density
4.2. Soil Surface–Vegetation Cover
4.3. Erosion-Controlling Management
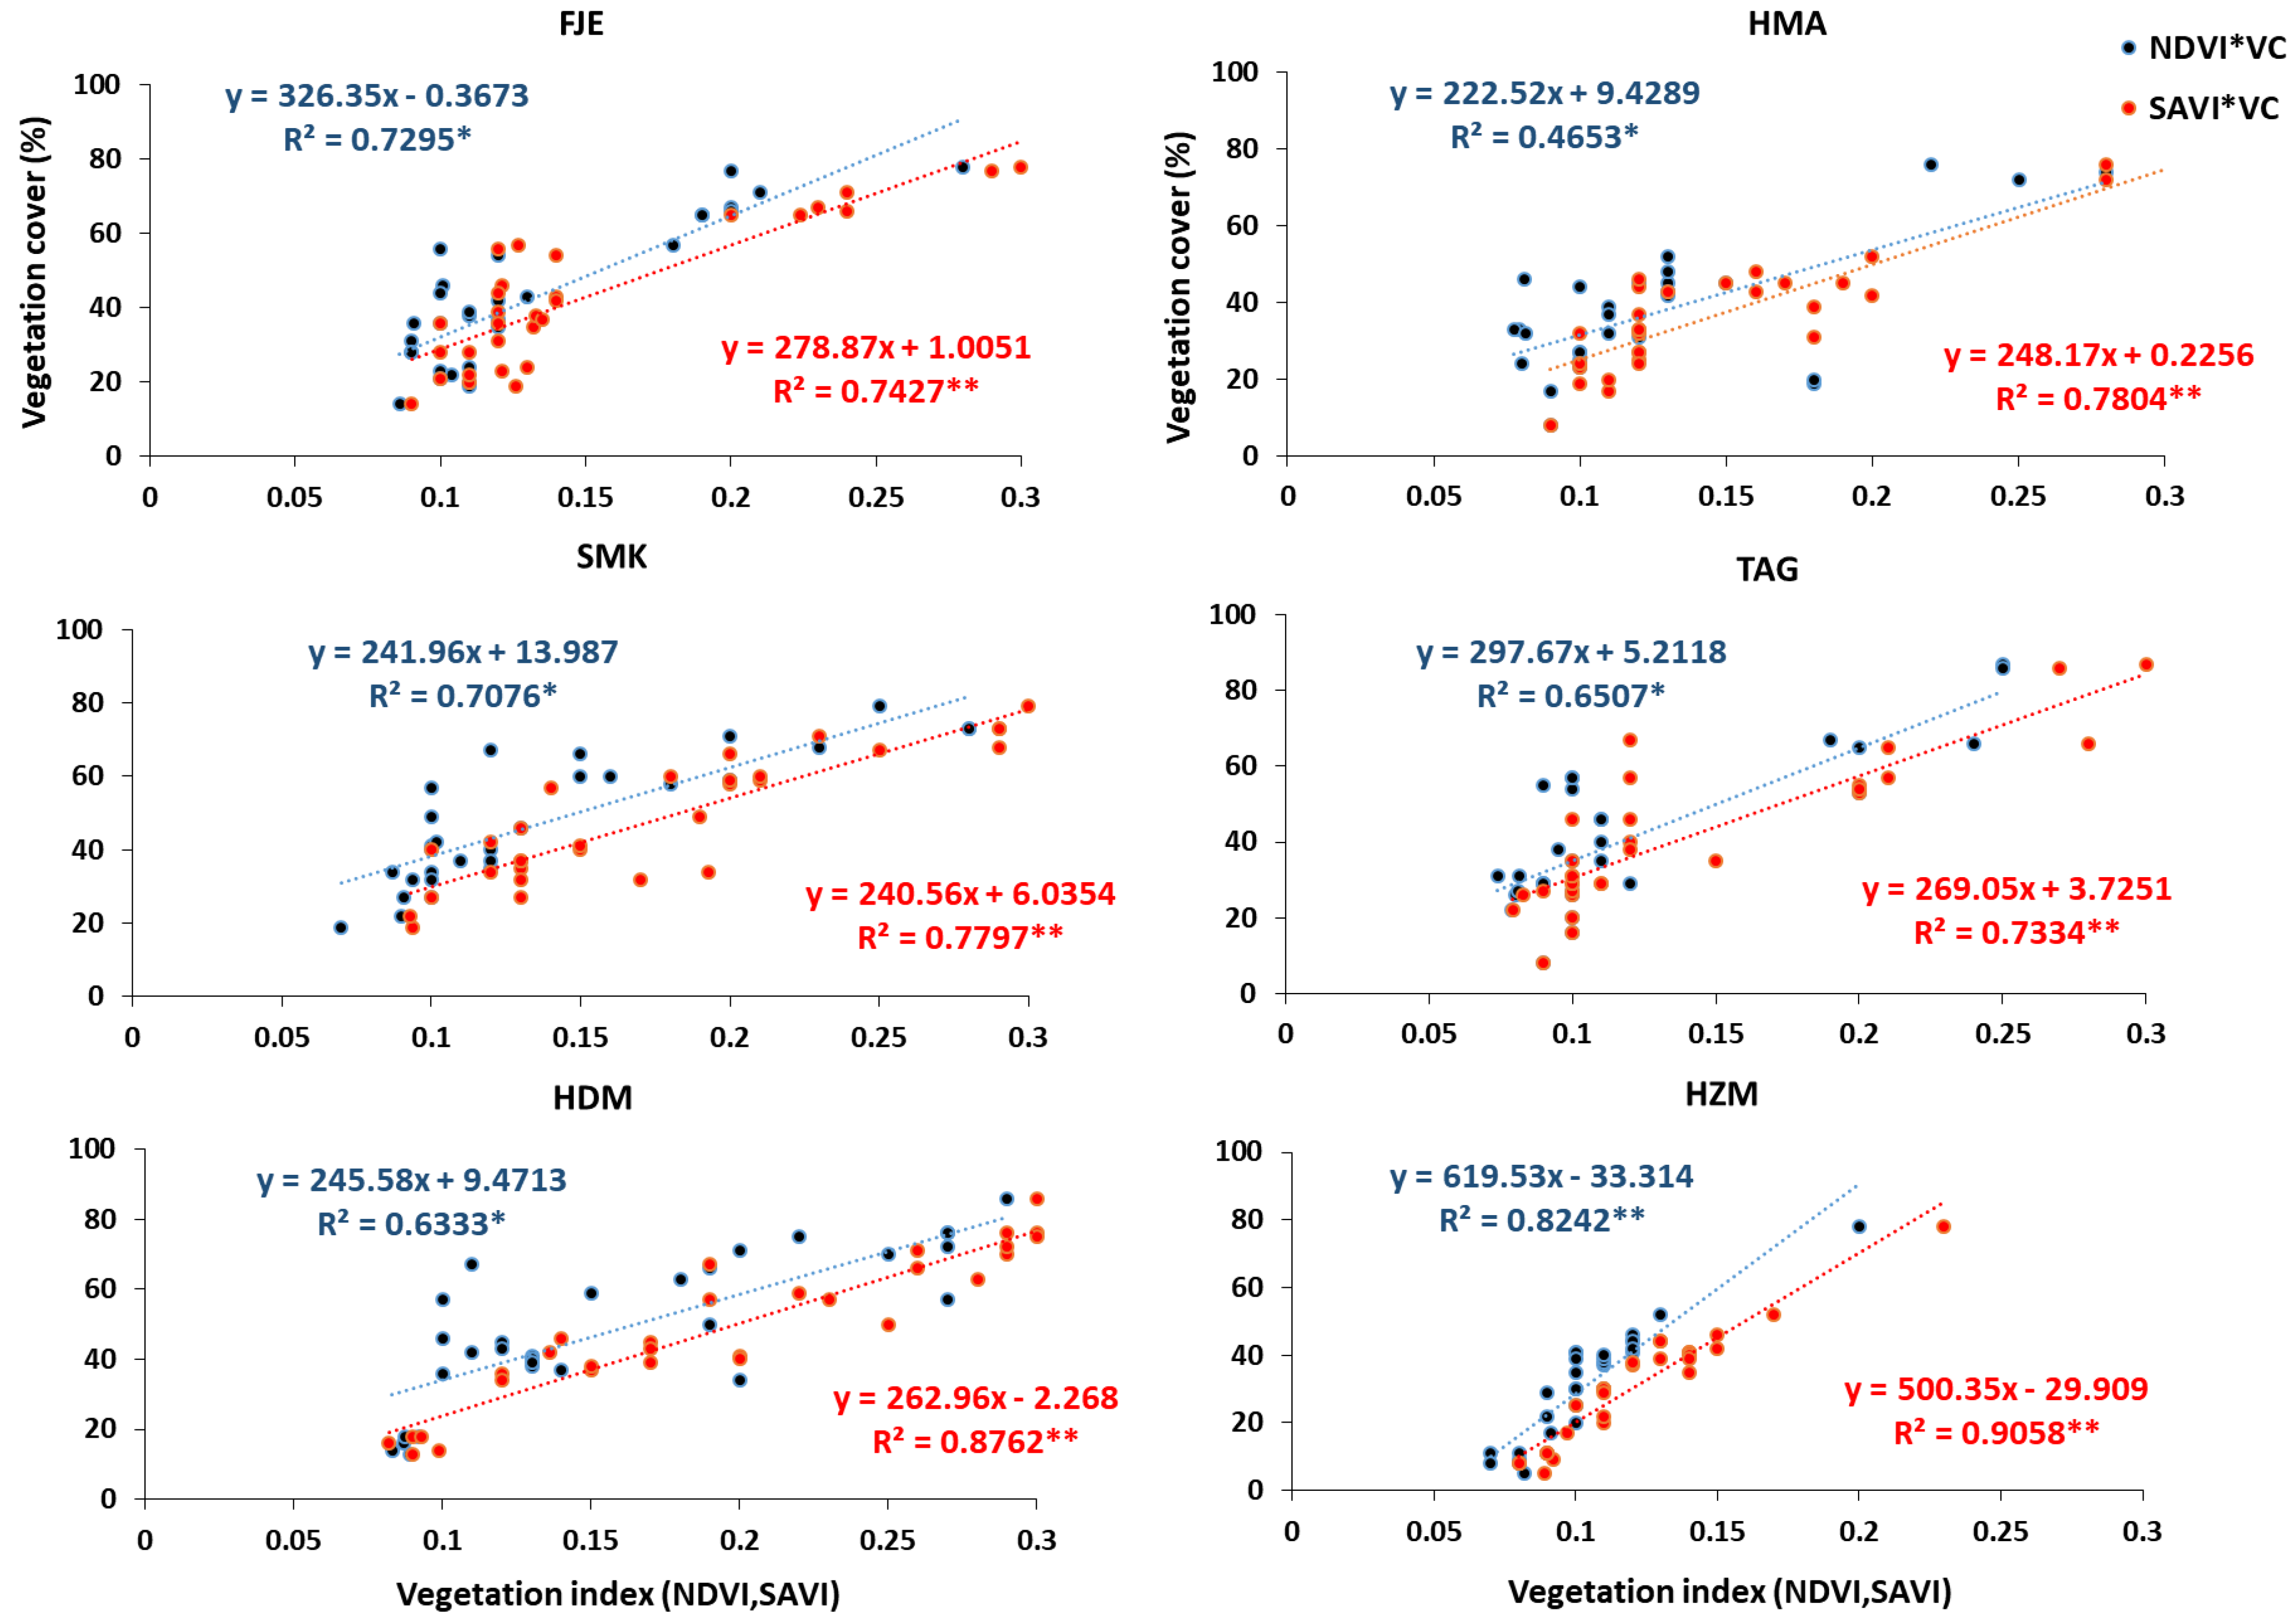
4.4. Vegetation Indices–Vegetation Cover
5. Conclusions
Author Contributions
Funding
Institutional Review Board Statement
Informed Consent Statement
Data Availability Statement
Acknowledgments
Conflicts of Interest
References
- Butchart, S.H.M.; Walpole, M.; Collen, B.; Van Strien, A.; Scharlemann, J.P.W.; Almond, R.E.A.; Baillie, J.E.M.; Bomhard, B.; Brown, C.; Bruno, J.; et al. Global biodiversity: Indicators of recent declines. Science 2010, 328, 1164–1168. [Google Scholar] [CrossRef] [PubMed]
- Hamed, M.A.; Kasem, W.T.; Shalabi, L.F. Floristic diversity and vegetation-soil correlations in Wadi Qusai, Jazan, Saudi Arabia. Int. J. Plant Soil Sci. 2018, 25, 1–18. [Google Scholar] [CrossRef]
- Yang, J.; Tian, H.; Pan, S.; Chen, G.; Zhang, B.; Dangal, S. Amazon drought and forest response: Largely reduced forest photosynthesis but slightly increased canopy greenness during the extreme drought of 2015/2016. Glob. Chang. Biol. 2018, 24, 1919–1934. [Google Scholar] [CrossRef] [PubMed]
- Liu, X.; Zhang, Q.; Song, M.; Wang, N.; Fan, P.; Wu, P.; Cui, K.; Zheng, P.; Du, N.; Wang, H. Physiological responses of Robinia pseudoacacia and Quercus acutissima seedlings to repeated drought-rewatering under different planting methods. Front. Plant Sci. 2021, 12, 760510. [Google Scholar] [CrossRef] [PubMed]
- Yin, T.; Zhai, Y.; Zhang, Y.; Yang, W.; Dong, J.; Liu, X.; Fan, P.; You, C.; Yu, L.; Gao, Q. Impacts of climate change and human activities on vegetation coverage variation in mountainous and hilly areas in Central South of Shandong Province based on tree-ring. Front. Plant Sci. 2023, 14, 1158221. [Google Scholar] [CrossRef]
- Aronson, J.; Floret, C.; Le Floc’h, E.; Ovalle, C.; Pontanier, R. Restauration et réhabilitation des écosystèmes dégradés en zones arides et semi-arides. Le vocabulaire et les concepts. L’homme Peut-Il Refaire Ce Qu’il A Défait 1995, 11–29. [Google Scholar] [CrossRef]
- Pyke, D.A.; Herrick, J.E.; Shaver, P.; Pellant, M. Rangeland health attributes and indicators for qualitative assessment. J. Range Manag. 2002, 55, 584–597. [Google Scholar] [CrossRef]
- Wallace, J.; Behn, G.; Furby, S. Vegetation condition assessment and monitoring from sequences of satellite imagery. Ecol. Manag. Restor. 2006, 7, S31–S36. [Google Scholar] [CrossRef]
- Gallaun, H.; Zanchi, G.; Nabuurs, G.-J.; Hengeveld, G.; Schardt, M.; Verkerk, P.J. EU-wide maps of growing stock and above-ground biomass in forests based on remote sensing and field measurements. For. Ecol. Manag. 2010, 260, 252–261. [Google Scholar] [CrossRef]
- Nagendra, H.; Lucas, R.; Honrado, J.P.; Jongman, R.H.; Tarantino, C.; Adamo, M.; Mairota, P. Remote sensing for conservation monitoring: Assessing protected areas, habitat extent, habitat condition, species diversity, and threats. Ecol. Indic. 2013, 33, 45–59. [Google Scholar] [CrossRef]
- Shen, X.; Liu, B.; Henderson, M.; Wang, L.; Jiang, M.; Lu, X. Vegetation greening, extended growing seasons, and temperature feedbacks in warming temperate grasslands of China. J. Clim. 2022, 35, 5103–5117. [Google Scholar] [CrossRef]
- Huete, A.R. A soil-adjusted vegetation index (SAVI). Remote Sens. Environ. 1988, 25, 295–309. [Google Scholar] [CrossRef]
- Abdurahmanov, I. Assessment of NDVI and SAVI Vegetation Indices Potential to Monitor Grazing Impact in a Rangeland Ecosystem. Int. J. Geoinform. 2016, 12, 9–15. [Google Scholar]
- Qi, J.; Chehbouni, A.; Huete, A.R.; Kerr, Y.H.; Sorooshian, S. A modified soil adjusted vegetation index. Remote Sens. Environ. 1994, 48, 119–126. [Google Scholar] [CrossRef]
- Chaieb, M.; Zaâfouri, M. L’élevage extensif, facteur écologique primordial de la transformation physionomique du cortège floristique en milieu steppique tunisien. In Rupture: Nouveaux Enjeux, Nouvelles Fonctions, Nouvelle Image de l’élevage sur Parcours; Bourbouze, A., Qarro, M., Eds.; CIHEAM: Montpellier, France, 2000; pp. 217–222. [Google Scholar]
- Tarhouni, M.; Belgacem, A.O.; Neffati, M.; Henchi, B. Validation de quelques attributs structuraux de l’ecosysteme sous l’effet de la secheresse saisonniere et la pression animale autour de points d’eau en zone aride tunisienne. Belg. J. Bot. 2006, 139, 188–202. [Google Scholar]
- Noumi, Z.; Dhaou, S.O.; Derbel, S.; Chaieb, M. The status of Asteraceae in the arid and Saharan flora of North African region: Case of Tunisia. Pak. J. Bot. 2010, 42, 1417–1422. [Google Scholar]
- Le Houérou, H.-N. Bioclimatology and Biogeography of Africa; Springer: Berlin/Heidelberg, Germany, 2009; Volume 506. [Google Scholar]
- Louhaichi, M.; Belgacem, A.O.; Petersen, S.L.; Hassan, S. Effects of climate change and grazing pressure on shrub communities of West Asian rangelands. Int. J. Clim. Chang. Strateg. Manag. 2019, 11, 660–671. [Google Scholar] [CrossRef]
- Floret, C.; Hadjej, M.S. An attempt to combat desertification in Tunisia. Ambio 1977, 6, 366–368. [Google Scholar]
- Nelson, A.; Chomitz, K.M. Effectiveness of strict vs. multiple use protected areas in reducing tropical forest fires: A global analysis using matching methods. PLoS ONE 2011, 6, e22722. [Google Scholar] [CrossRef]
- Ferchichi, A. Etude climatique en Tunisie présaharienne. Medit 1996, 7, 46–53. [Google Scholar]
- Khatteli, H. Erosion Éolienne en Tunisie Aride et Désertique: Analyse des Processus et Recherches des Moyens de Lutte; Ghent University: Ghent, Belgium, 1996. [Google Scholar]
- Ouessar, M. Hydrological Impacts of Rainwater Harvesting in Wadi Oum Zessar Watershed (Southern Tunisia); Ghent University: Ghent, Belgium, 2007. [Google Scholar]
- Novikoff, G.; Skouri, M. Balancing Development and Conservation in Pre-Saharan Tunisia. Ambio Stockh. 1981, 10, 135–141. [Google Scholar]
- Kadri, N.; Jebari, S.; Augusseau, X.; Mahdhi, N.; Lestrelin, G.; Berndtsson, R. Analysis of Four Decades of Land Use and Land Cover Change in Semiarid Tunisia Using Google Earth Engine. Remote Sens. 2023, 15, 3257. [Google Scholar] [CrossRef]
- Daget, P.; Poissonnet, J. Principes d’une technique d’analyse quantitative de la végétation des formations herbacées. Doc. CEPE-CNRS 1971, 56, 85–100. [Google Scholar]
- Roux, G.; Roux, M. A propos de quelques méthodes de classification en phytosociologie. Rev. De Stat. Appliquée 1967, 15, 59–72. [Google Scholar]
- U.S.G.S. Available online: https://earthexplorer.usgs.gov/ (accessed on 20 April 2023).
- Rouse, J.W., Jr.; Haas, R.H.; Deering, D.; Schell, J.; Harlan, J.C. Monitoring the Vernal Advancement and Retrogradation (Green Wave Effect) of Natural Vegetation; NASA/GSFCT Type III Final Report, 371; NASA: Washington, DC, USA, 1974. [Google Scholar]
- Amghar, F.; Forey, E.; Margerie, P.; Langlois, E.; Brouri, L.; Kadi-Hanifi, H. Grazing exclosure and plantation: A synchronic study of two restoration techniques improving plant community and soil properties in arid degraded steppes (Algeria). Rev. D’écologie 2012, 67, 257–269. [Google Scholar] [CrossRef]
- Fenetahun, Y.; Yuan, Y.; Xinwen, X.; Yongdong, W. Effects of Grazing Enclosures on Species Diversity, Phenology, Biomass, and Carrying Capacity in Borana Rangeland, Southern Ethiopia. Front. Ecol. Evol. 2021, 8, 623627. [Google Scholar] [CrossRef]
- Kurze, S.; Bilton, M.C.; Álvarez-Cansino, L.; Bangerter, S.; Prasse, R.; Tielbörger, K.; Engelbrecht, B.M.J. Evaluating grazing response strategies in winter annuals: A multi-trait approach. J. Ecol. 2021, 109, 3074–3086. [Google Scholar] [CrossRef]
- Smith, S.M.; Weller, J.L. Seasonal control of seed germination. New Phytol. 2020, 225, 1821–1823. [Google Scholar] [CrossRef]
- Zhang, H.; He, Q.; Pandey, S.P.; Jiang, K.; Wang, C. Can Overgrazing Responses Be Disentangled by Above- and Below-Ground Traits? Front. Ecol. Evol. 2021, 9, 573948. [Google Scholar] [CrossRef]
- Donovan, M.; Monaghan, R. Impacts of grazing on ground cover, soil physical properties and soil loss via surface erosion: A novel geospatial modelling approach. J. Environ. Manag. 2021, 287, 112206. [Google Scholar] [CrossRef]
- Merten, G.H.; Minella, J.P. The expansion of Brazilian agriculture: Soil erosion scenarios. Int. Soil Water Conserv. Res. 2013, 1, 37–48. [Google Scholar] [CrossRef]
- Zhou, Z.; Gan, Z.; Shangguan, Z.; Dong, Z. Effects of grazing on soil physical properties and soil erodibility in semiarid grassland of the Northern Loess Plateau (China). Catena 2010, 82, 87–91. [Google Scholar] [CrossRef]
- Serpe, M.D.; Zimmerman, S.J.; Deines, L.; Rosentreter, R. Seed water status and root tip characteristics of two annual grasses on lichen-dominated biological soil crusts. Plant Soil 2008, 303, 191–205. [Google Scholar] [CrossRef]
- Floret, C.; Pontanier, R. L’aridité en Tunisie Présaharienne: Climat, Sol, Végétation et Aménagement; Office de Recherche Scientifique et Technique Outre-Mer: Paris, France, 1982. [Google Scholar]
- Gamoun, M.; Tarhouni, M.; Ouled Belgacem, A.; Hanchi, B.; Neffati, M. Effects of grazing and trampling on primary production and soil surface in North African rangelands. Ekológia 2010, 29, 219–226. [Google Scholar] [CrossRef]
- Moumni, M.; Tlili, A.; Msaddek, J.; Tarhouni, M. Assessment of desert plant communities under protection: Case of Dghoumes national park, southern Tunisia. Afr. J. Ecol. 2021, 59, 528–531. [Google Scholar] [CrossRef]
- Belhadj, A.; Boulghobra, N.; Demnati Allache, F. Multi-temporal Landsat imagery and MSAVI index for monitoring rangeland degradation in arid ecosystem, case study of Biskra (southeast Algeria). Environ. Monit. Assess. 2023, 195, 656. [Google Scholar] [CrossRef]
- Hostert, P.; Röder, A.; Hill, J. Coupling spectral unmixing and trend analysis for monitoring of long-term vegetation dynamics in Mediterranean rangelands. Remote Sens. Environ. 2003, 87, 183–197. [Google Scholar] [CrossRef]
- Mathias, A.; Chesson, P. Coexistence and evolutionary dynamics mediated by seasonal environmental variation in annual plant communities. Theor. Popul. Biol. 2013, 84, 56–71. [Google Scholar] [CrossRef]
- Vecchio, M.C.; Bolaños, V.; Golluscio, R.A.; Rodríguez, A.M. Rotational grazing and exclosure improves grassland condition of the halophytic steppe in Flooding Pampa (Argentina) compared with continuous grazing. Rangel. J. 2019, 41, 1–12. [Google Scholar] [CrossRef]
- Msadek, J.; Tlili, A.; Moumni, M.; Louhaichi, M.; Tarhouni, M. Impact of Grazing Regimes, Landscape Aspect, and Elevation on Plant Life Form Types in Managed Arid Montane Rangelands. Rangel. Ecol. Manag. 2022, 83, 10–19. [Google Scholar] [CrossRef]
- Belnap, J. Surface disturbances: Their role in accelerating desertification. Environ. Monit. Assess. 1995, 37, 39–57. [Google Scholar] [CrossRef]
- Kebin, Z.; Kaiguo, Z. Afforestation for sand fixation in China. J. Arid Environ. 1989, 16, 3–10. [Google Scholar] [CrossRef]
- FAO. Manuel de Fixation des Dunes; Chaier FAO Conservations 18; FAO: Rome, Italy, 1988. [Google Scholar]
- Genin, D.; Guillaume, H.; Sghaïer, M. Tunisie Aride: Comment Concilier Lutte Contre la Désertification et Développement des Populations? Sci. Chang. Planétaires/Sécheresse. 2007, 18. [Google Scholar]
- 52. In Les Moyens de Lutte Contre L’ensablement Dans la Jeffara (Sud-Est Tunisien): Évaluation et Impacts sur L’évolution du Milieu, Exemple la Région de Médenine; Faculté des Sciences Humaines et Sociales: Tunis, Tunisia, 2003; p. 121.
- Sterk, G. Causes, consequences and control of wind erosion in Sahelian Africa: A review. Land Degrad. Dev. 2003, 14, 95–108. [Google Scholar] [CrossRef]
- del Río-Mena, T.; Willemen, L.; Tesfamariam, G.T.; Beukes, O.; Nelson, A. Remote sensing for mapping ecosystem services to support evaluation of ecological restoration interventions in an arid landscape. Ecol. Indic. 2020, 113, 106182. [Google Scholar] [CrossRef]
- Cheng, H.; He, W.; Liu, C.; Zou, X.; Kang, L.; Chen, T.; Zhang, K. Transition model for airflow fields from single plants to multiple plants. Agric. For. Meteorol. 2019, 266, 29–42. [Google Scholar] [CrossRef]
- Lv, P.; Dong, Z. Study of the windbreak effect of shrubs as a function of shrub cover and height. Environ. Earth Sci. 2012, 66, 1791–1795. [Google Scholar] [CrossRef]
- Zhang, Y.; Peng, C.; Li, W.; Tian, L.; Zhu, Q.; Chen, H.; Fang, X.; Zhang, G.; Liu, G.; Mu, X. Multiple afforestation programs accelerate the greenness in the ‘Three North’region of China from 1982 to 2013. Ecol. Indic. 2016, 61, 404–412. [Google Scholar] [CrossRef]
- Liu, Q.; Zhang, Q.; Yan, Y.; Zhang, X.; Niu, J.; Svenning, J.-C. Ecological restoration is the dominant driver of the recent reversal of desertification in the Mu Us Desert (China). J. Clean. Prod. 2020, 268, 122241. [Google Scholar] [CrossRef]
- Sun, Z.; Mao, Z.; Yang, L.; Liu, Z.; Han, J.; Wanag, H.; He, W. Impacts of climate change and afforestation on vegetation dynamic in the Mu Us Desert, China. Ecol. Indic. 2021, 129, 108020. [Google Scholar] [CrossRef]
- DeFalco, L.; Esque, T.; Kane, J.; Nicklas, M. Seed banks in a degraded desert shrubland: Influence of soil surface condition and harvester ant activity on seed abundance. J. Arid Environ. 2009, 73, 885–893. [Google Scholar] [CrossRef]
- Wang, C.; Chen, J.; Wu, J.; Tang, Y.; Shi, P.; Black, T.A.; Zhu, K. A snow-free vegetation index for improved monitoring of vegetation spring green-up date in deciduous ecosystems. Remote Sens. Environ. 2017, 196, 1–12. [Google Scholar] [CrossRef]
- Vani, V.; Mandla, V.R. Comparative study of NDVI and SAVI vegetation indices in Anantapur district semi-arid areas. Int. J. Civ. Eng. Technol 2017, 8, 559–566. [Google Scholar]
- Cakir, H.I.; Khorram, S.; Nelson, S.A. Correspondence analysis for detecting land cover change. Remote Sens. Environ. 2006, 102, 306–317. [Google Scholar] [CrossRef]
- Klintenberg, P. More Water, Less Grass? An Assessment of Resource Degradation and Stakeholders’ Perceptions of Environmental Change in Ombuga Grassland, Northern Namibia; Institutionen för Naturgeografi och Kvartärgeologi: Stockholm, Sweden, 2007. [Google Scholar]
- Almutairi, B.; El, A.; Belaid, M.; Musa, N. Comparative Study of SAVI and NDVI Vegetation Indices in Sulaibiya Area (Kuwait) Using Worldview Satellite Imagery. Int. J. Geosci. Geomat 2013, 1, 50–53. [Google Scholar]
- Xue, J.; Su, B. Significant remote sensing vegetation indices: A review of developments and applications. J. Sens. 2017, 2017, 1353691. [Google Scholar] [CrossRef]
- Silleos, N.G.; Alexandridis, T.K.; Gitas, I.Z.; Perakis, K. Vegetation indices: Advances made in biomass estimation and vegetation monitoring in the last 30 years. Geocarto Int. 2006, 21, 21–28. [Google Scholar] [CrossRef]
- Mokarram, M.; Boloorani, A.D.; Hojati, M. Relationship between land cover and vegetation indices. case study: Eghlid plain, fars province, Iran. Eur. J. Geogr. 2016, 7, 48–60. [Google Scholar]


| Year | Sep | Oct | Nov | Dec | Jan | Feb | Mar | Apr | May | Jun | Jul | Aug | Total | |
|---|---|---|---|---|---|---|---|---|---|---|---|---|---|---|
| 2020–2021 | P (mm) | 0 | 25.6 | 31.8 | 29.2 | 0 | 4.05 | 4.75 | 0.5 | 0 | 0 | 0 | 0 | 95.9 |
| T (C°) | 28.6 | 22.5 | 18.5 | 14.3 | 15.5 | 16.1 | 15.9 | 24.5 | 26.1 | 29.9 | 31.5 | 33.2 | - | |
| 2021–2022 | P (mm) | 13.42 | 0 | 0 | 0.76 | 12.4 | 0.53 | 8.38 | 3.81 | 0 | 0 | 0 | 0 | 39.3 |
| T (C°) | 30.5 | 23.2 | 19.1 | 13.7 | 11.6 | 14.7 | 16.4 | 20.2 | 33.6 | 31.2 | 31.8 | 32.0 | - | |
| 2022–2023 | P (mm) | 13.5 | 0 | 0 | 17.0 | 0 | 50.3 | 0 | 19.0 | 41.7 | 0 | 0 | - | 141.5 |
| T (C°) | 32.0 | 27.6 | 25.6 | 12.5 | 11.3 | 15.1 | 23.1 | 19.6 | 22.4 | 27.5 | 35.5 | - | - |
| Site | Code | Area (ha) | Protection Period | Management Type | Exploitation Regime | Coordinates (WGS 84) |
|---|---|---|---|---|---|---|
| El Fje | FJE | 114 | Since 1962 | Palisades of dry palm/reforestation | Seasonal grazing | 33°29′16.08″ N, 10°37′54.80″ E |
| Sidi Makhlouf | SMK | 100 | Since 1965 | Palisades of dry palm/reforestation | Seasonal grazing | 33°29′39.30″ N, 10°28′54.85″ E |
| Henchir Dghim | HDM | 98 | Since 1984 | Palisades of dry palm/reforestation | Seasonal grazing | 33°29′38.22″ N, 10°25′53.43″ E |
| El Hezma | HZM | 50 | Since 2000 | Wire mesh/reforestation | Fenced | 33°15′3.34″ N, 10°27′48.11″ E |
| Henchir Mayouf | HMA | 86 | Since 1999 | Palisades of dry palm/reforestation | Seasonal grazing | 33°16′14.45″ N, 10°51′11.57″ E |
| Taguelmit | TAG | 100 | Since 1991 | Palisades of dry palm/reforestation | Seasonal grazing | 32°55′8.39″ N, 11°19′42.06″ E |
| Landsat Product ID | Sensor ID | Acquisition Date | Spatial Resolution | Cloud Cover | Path/Row |
|---|---|---|---|---|---|
| LC08_L2SP_190037_20210421_20210430_02_T1 | OLI_TIRS | 21 April 2021 | 30 m | 1.56 | 190/37 |
| LC08_L2SP_190037_20220408_20220412_02_T1 | OLI_TIRS | 8 April 2022 | 30 m | 0.04 | 190/37 |
| LC08_L2SP_190037_20230403_20230405_02_T1 | OLI_TIRS | 3 April 2023 | 30 m | 7.43 | 190/37 |
| Vegetation Index | Normalized Vegetation Index | Soil-Adjusted Vegetation Index |
|---|---|---|
| Acronym | NDVI | SAVI |
| Author | Rouse et al. (1974) [30] | Huete (1988) [12] |
| Formula | (NIR − Red)/(NIR + Red) [30] | ((NIR − Red)/(NIR + Red + 0.5)) × (1.5) [12] |
| Landsat 8 (OLI) bands (30 m) | (5 − 4)/(5 + 34) | ((5 − 4)/(5 + 4 + 0.5)) × 1.5 |
| Site | Position | Spring 2021 | Spring 2022 | Spring 2023 | |||
| FJE | I | 61.4 ± 10.01 | abcd | 31.8 ± 9.98 | fghijk | 57.2 ± 16.97 *** | abcde |
| FJE | O | 54.2 ± 15.03 | abcdef | 28.6 ± 5.81 | ghijk | 23.2 ± 7.98 *** | ijk |
| SMK | I | 73.3 ± 4.5 | ab | 49.5 ± 10.4 | bcdefgh | 47.8 ± 14.19 | cdefgh |
| SMK | O | 61.4 ± 10.01 | abcde | 38 ± 8.63 | efghij | 26.8 ± 6.37 | hijk |
| HDM | I | 76 ± 6.16 | a | 48.8 ± 17.19 | defgh | 50.6 ± 10.35 *** | bcdefg |
| HDM | O | 61.4 ± 10.01 | abcd | 40.4 ± 3.43 | defghi | 15.8 ± 2.28 *** | jk |
| HMA | I | 58.5 ± 16.78 | abcde | 25.75 ± 1.5 | hijk | 48 ± 17.36 | defgh |
| HMA | O | 41 ± 6.44 | defghi | 19.75 ± 2.5 | ijk | 33.6 ± 7.89 | fghij |
| TAG | I | 71.4 ± 14.7 | abc | 35.2 ± 8.1 | efghij | 40.6 ± 13.35 | defghi |
| TAG | O | 51.2 ± 14.46 | bcdef | 21.6 ± 10.64 | ijk | 27.4 ± 3.78 | hijk |
| HZM | I | 42 ± 3.91 | defghi | 39.6 ± 11.84 *** | defghi | 37.8 ± 4.6 | efghij |
| HZM | O | 31.8 ± 5.35 | fijk | 10.6 ± 4.33 *** | k | 15.6 ± 9.44 | jk |
| INSIDE | OUTSIDE | ||||||
|---|---|---|---|---|---|---|---|
| 2021 | 2022 | 2023 | 2021 | 2022 | 2023 | ||
| FJE | NDVI | 0.17 | 0.11 | 0.16 | 0.14 | 0.09 | 0.09 |
| SAVI | 0.19 | 0.13 | 0.19 | 0.16 | 0.11 | 0.10 | |
| SMK | NDVI | 0.23 | 0.16 | 0.12 | 0.14 | 0.10 | 0.08 |
| SAVI | 0.26 | 0.18 | 0.15 | 0.19 | 0.13 | 0.13 | |
| HDM | NDVI | 0.27 | 0.18 | 0.15 | 0.14 | 0.12 | 0.08 |
| SAVI | 0.29 | 0.18 | 0.23 | 0.20 | 0.16 | 0.09 | |
| HMA | NDVI | 0.18 | 0.09 | 0.14 | 0.12 | 0.13 | 0.08 |
| SAVI | 0.21 | 0.11 | 0.20 | 0.15 | 0.10 | 0.11 | |
| TAG | NDVI | 0.22 | 0.10 | 0.09 | 0.11 | 0.09 | 0.07 |
| SAVI | 0.25 | 0.12 | 0.14 | 0.13 | 0.09 | 0.09 | |
| HZM | NDVI | 0.13 | 0.11 | 0.11 | 0.10 | 0.08 | 0.08 |
| SAVI | 0.15 | 0.13 | 0.13 | 0.12 | 0.09 | 0.09 | |
Disclaimer/Publisher’s Note: The statements, opinions and data contained in all publications are solely those of the individual author(s) and contributor(s) and not of MDPI and/or the editor(s). MDPI and/or the editor(s) disclaim responsibility for any injury to people or property resulting from any ideas, methods, instructions or products referred to in the content. |
© 2023 by the authors. Licensee MDPI, Basel, Switzerland. This article is an open access article distributed under the terms and conditions of the Creative Commons Attribution (CC BY) license (https://creativecommons.org/licenses/by/4.0/).
Share and Cite
Khatteli, A.; Tlili, A.; Chaieb, M.; Ouessar, M. Effects of Wind Erosion Control Measures on Vegetation Dynamics and Soil-Surface Materials through Field Observations and Vegetation Indices in Arid Areas, Southeastern Tunisia. Sustainability 2023, 15, 14256. https://doi.org/10.3390/su151914256
Khatteli A, Tlili A, Chaieb M, Ouessar M. Effects of Wind Erosion Control Measures on Vegetation Dynamics and Soil-Surface Materials through Field Observations and Vegetation Indices in Arid Areas, Southeastern Tunisia. Sustainability. 2023; 15(19):14256. https://doi.org/10.3390/su151914256
Chicago/Turabian StyleKhatteli, Ameni, Abderrazak Tlili, Mohamed Chaieb, and Mohamed Ouessar. 2023. "Effects of Wind Erosion Control Measures on Vegetation Dynamics and Soil-Surface Materials through Field Observations and Vegetation Indices in Arid Areas, Southeastern Tunisia" Sustainability 15, no. 19: 14256. https://doi.org/10.3390/su151914256