
Solar-Powered Adsorption-Based Multi-Generation System Working under the Climate Conditions of GCC Countries: Theoretical Investigation


Abstract
:1. Introduction
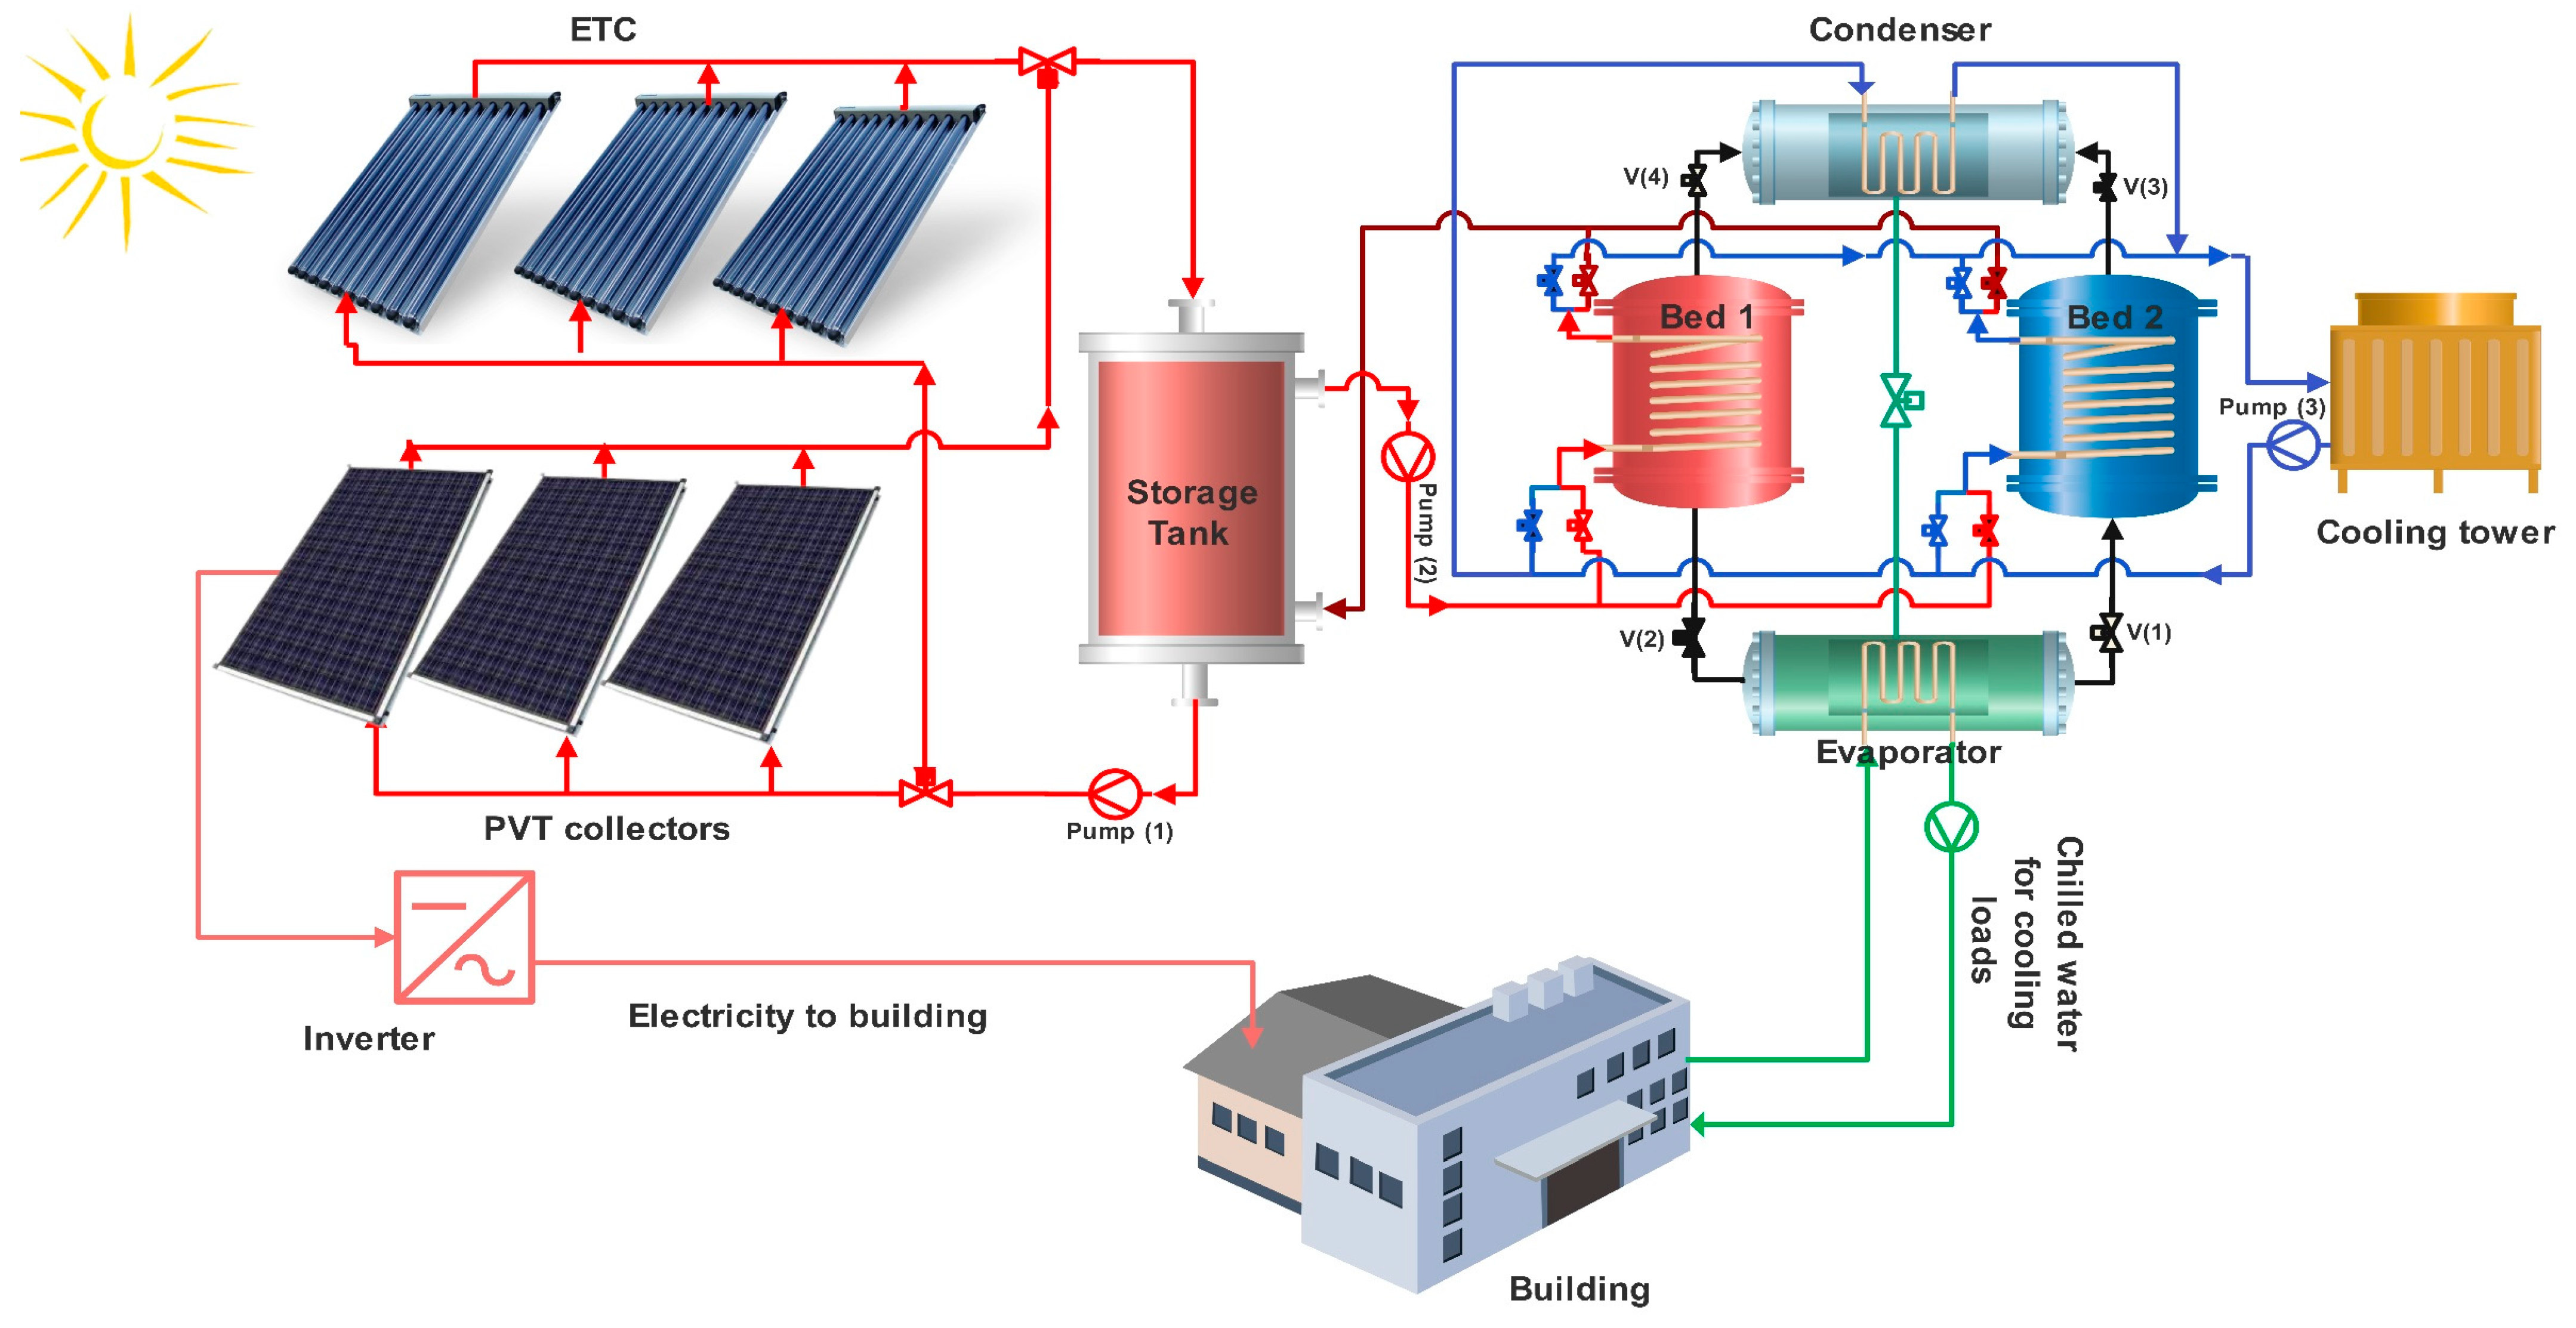
2. Description of the Proposed System
3. Mathematical Model
3.1. Solar Collectors
3.1.1. Thermal Performance
3.1.2. Electrical Performance (PVT Performance)
3.2. The Storage Tank
3.3. Adsorption Chiller
- -
- The main system piping lines and components are well insulated.
- -
- At saturation conditions, the evaporator’s and condenser’s outlet statuses are taken into consideration.
- -
- The system pumping power is disregarded, and the water flow inside the pipe is a continuous, steady 1D flow.
3.3.1. Silica Gel/Water Adsorption Equilibrium and Kinetics
3.3.2. Energy Balance of Adsorption Beds
3.3.3. Energy Balance of the Evaporator and Condenser
3.4. System Performance Indicators
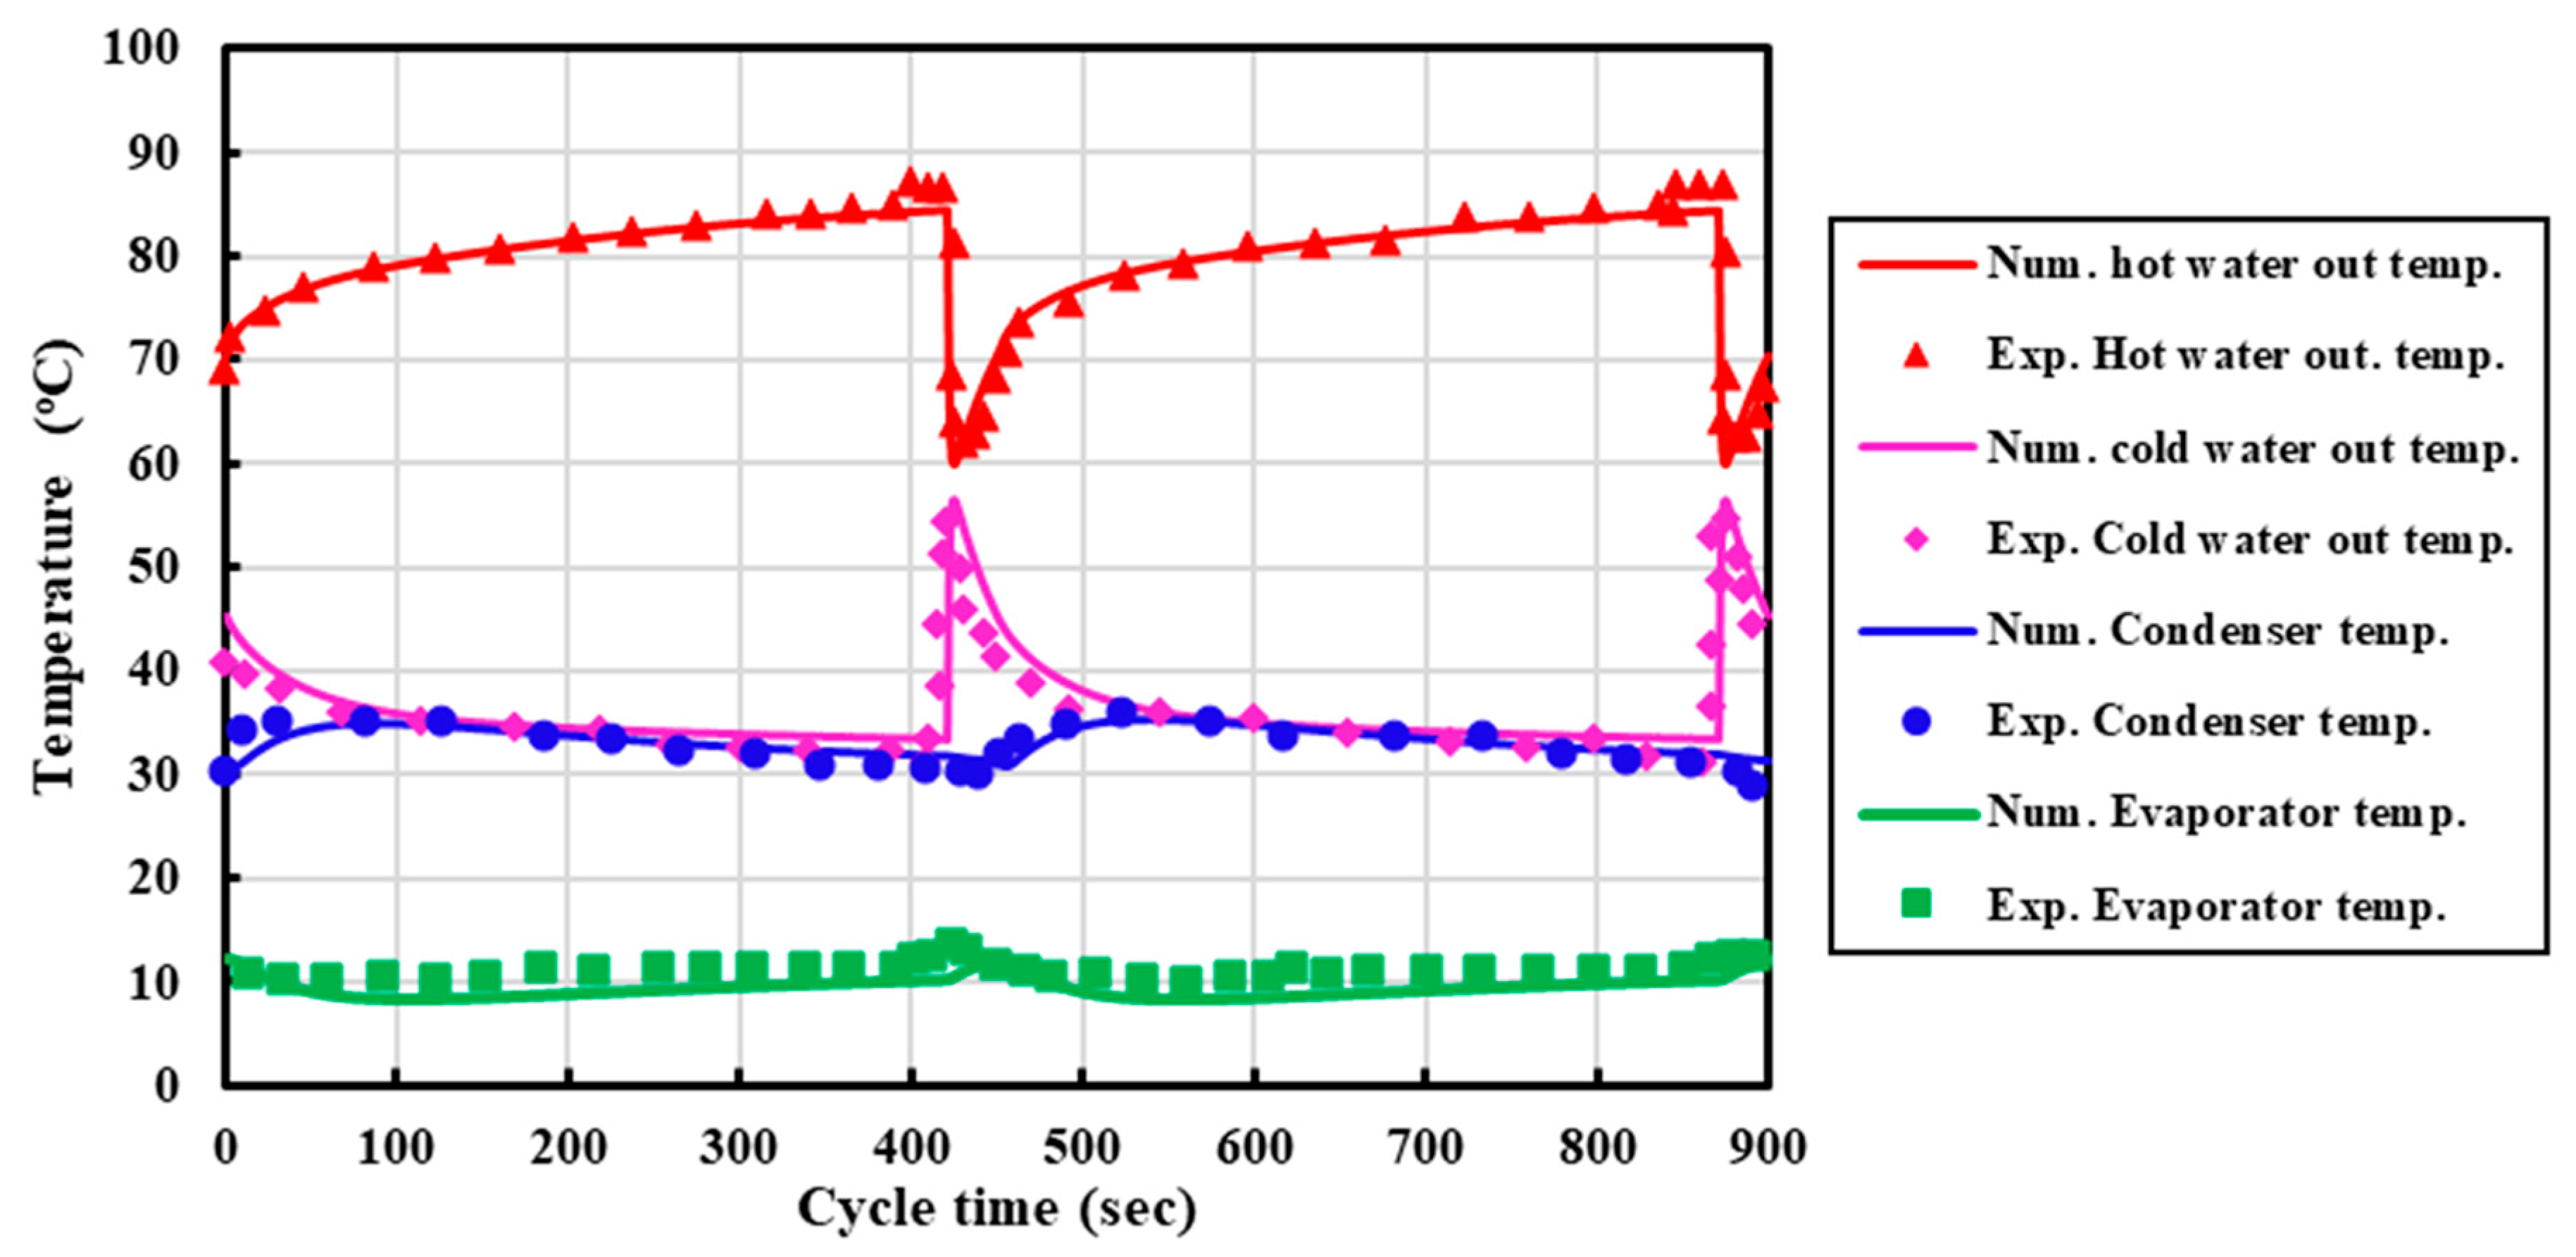
3.5. Model Validation
4. Results and Discussion
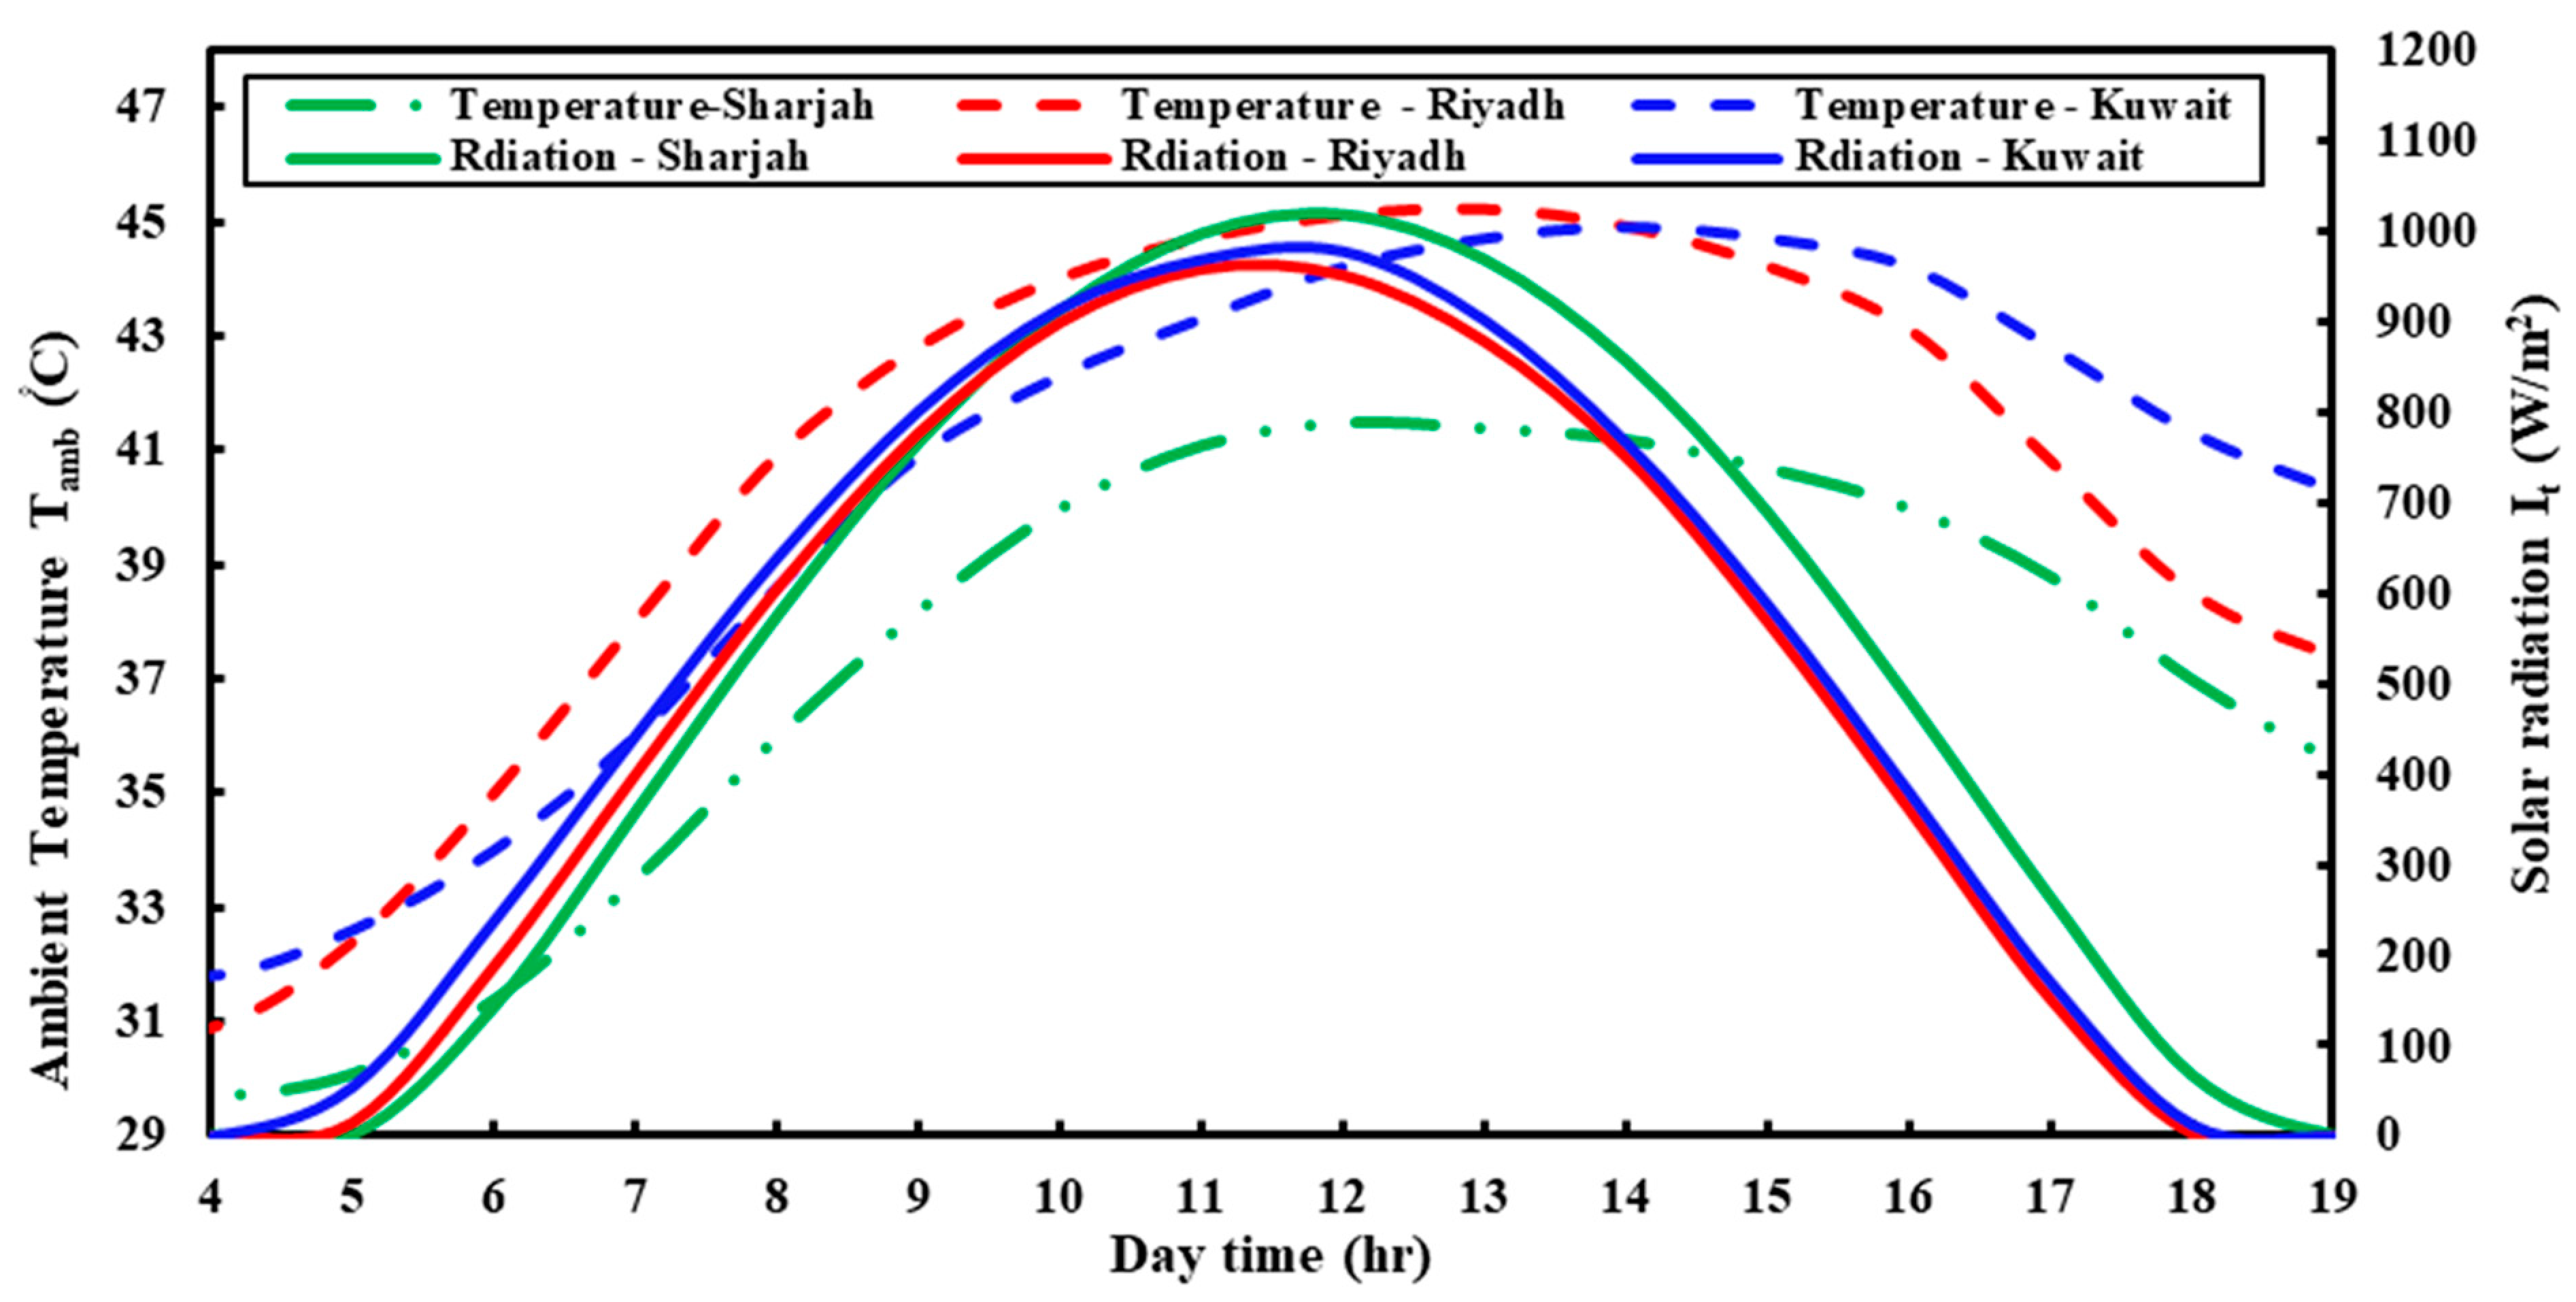
4.1. Climatic Data
4.2. System Performance
4.2.1. Adsorption Cooling System
4.2.2. The Generated Electrical Power
5. Comparison with Other Related Studies
6. Conclusions
- -
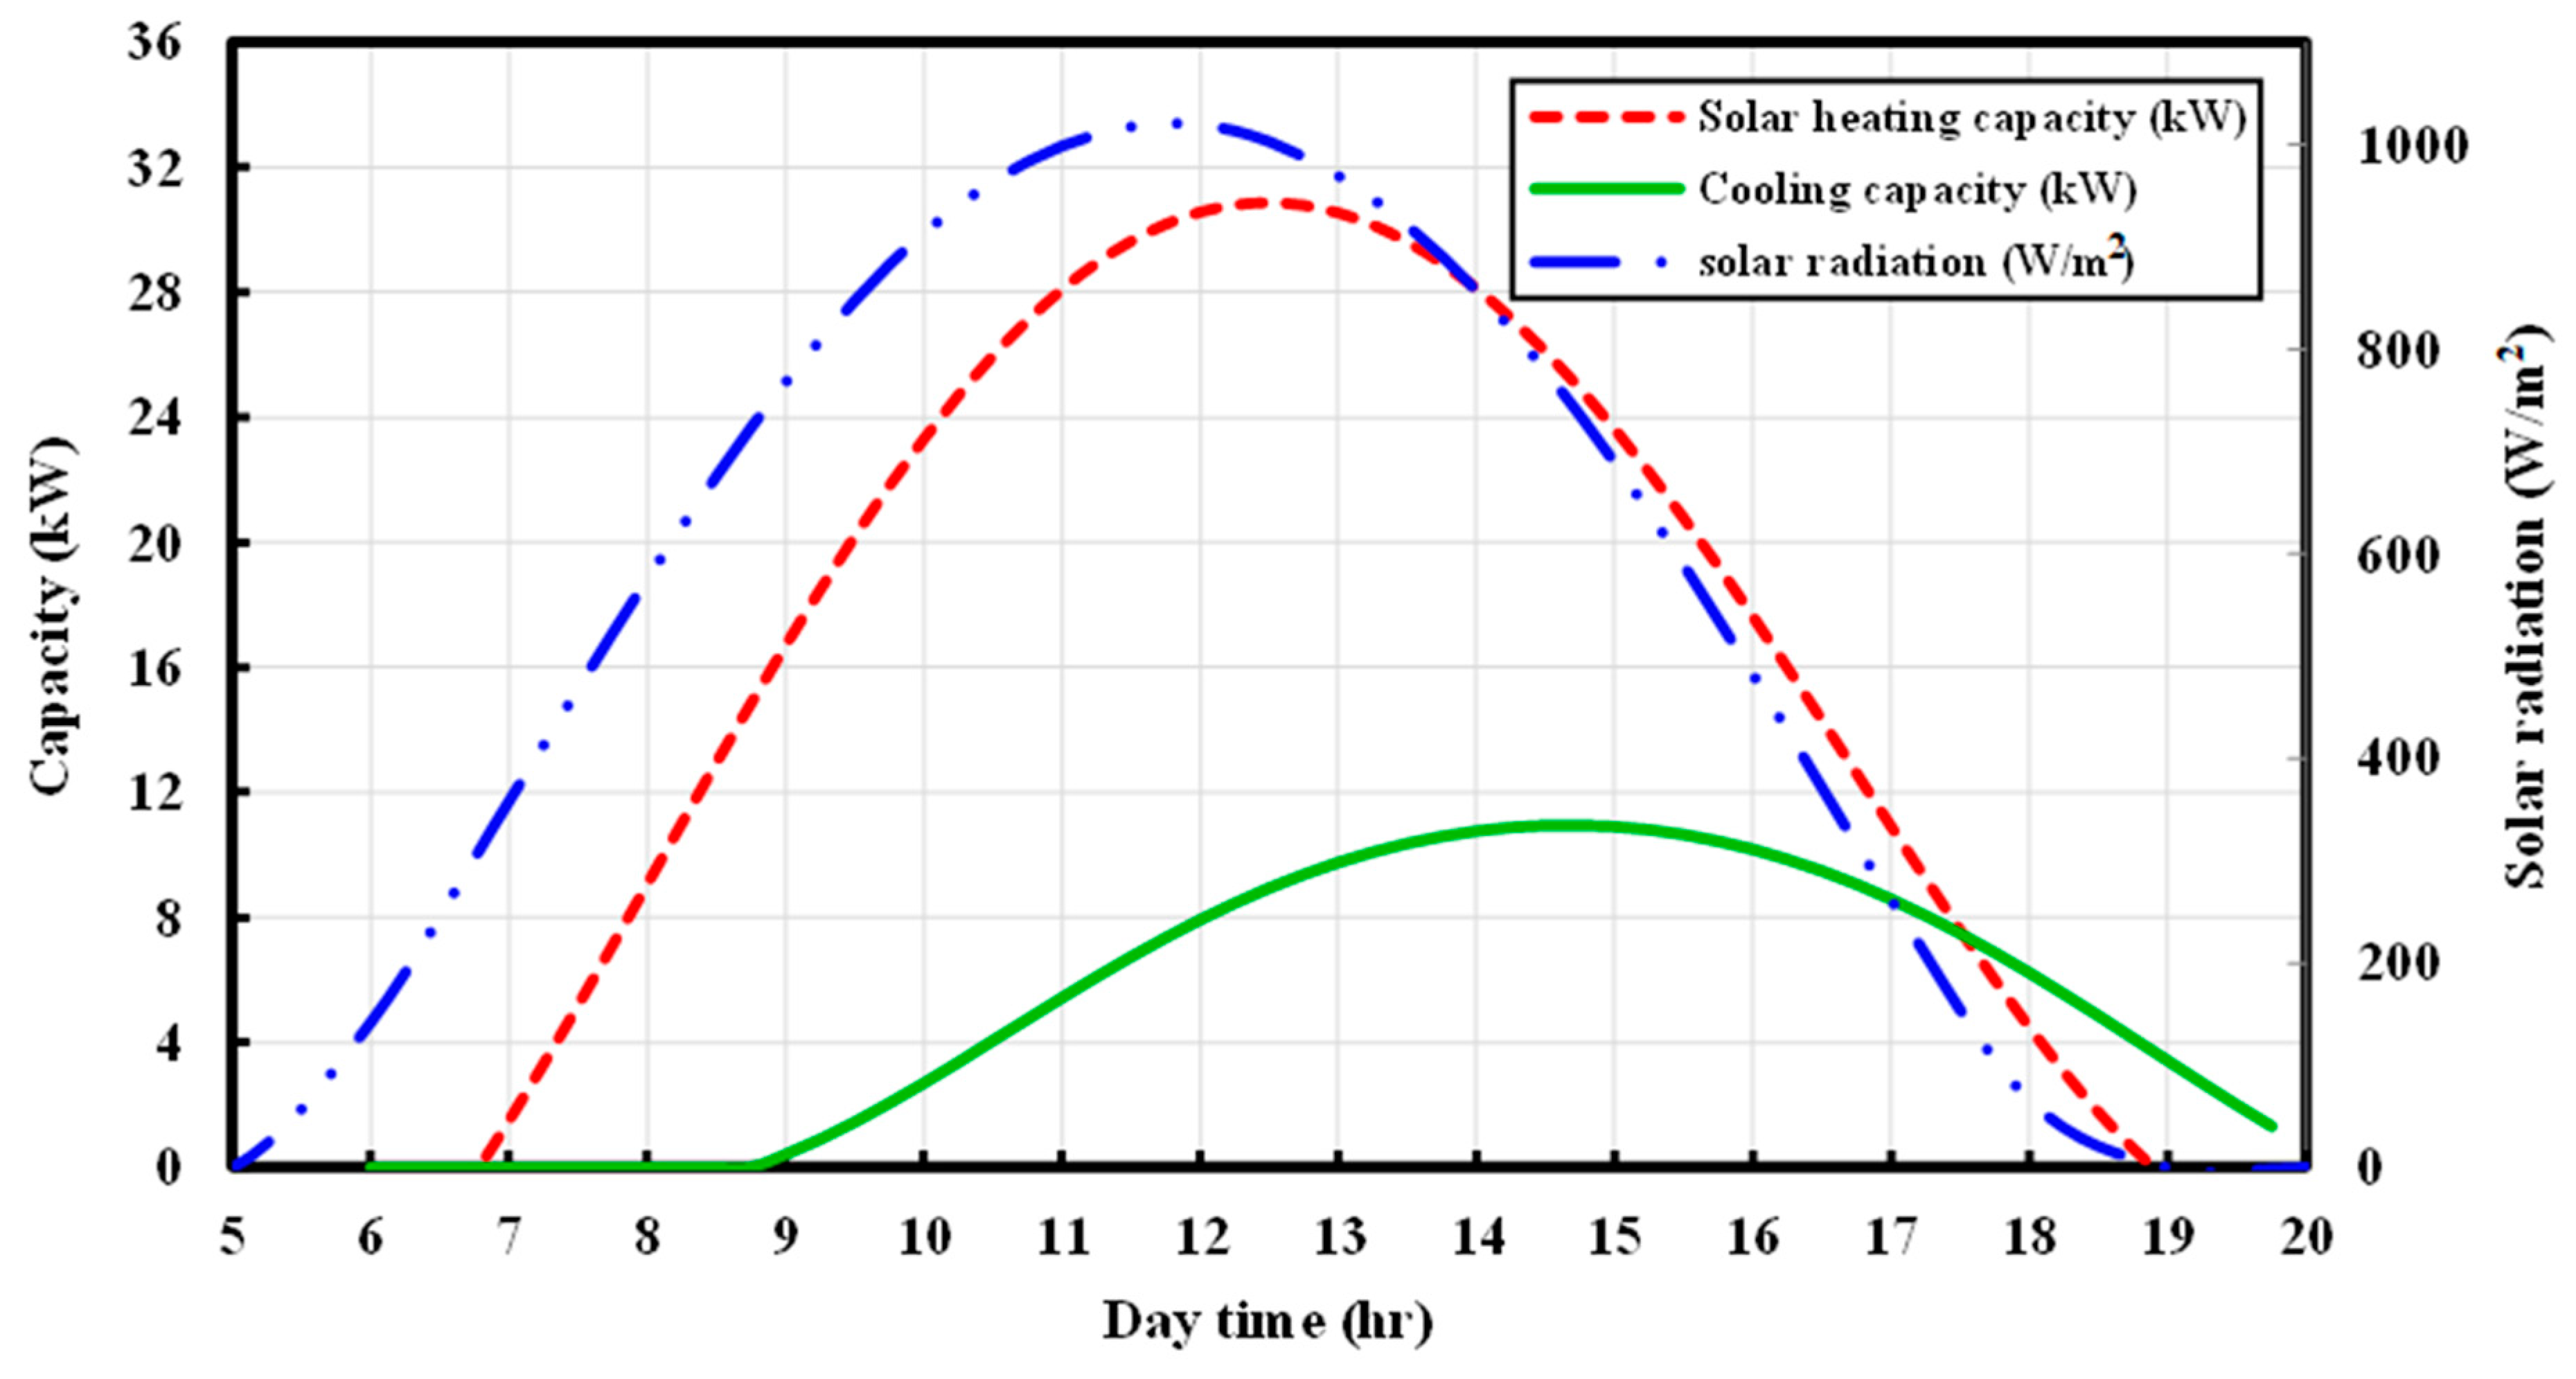
- The Gulf region experiences hot climate conditions during summer, with a solar radiation level approaching 1000 W/m2, making it an attractive location for implementing solar cooling systems.
- -
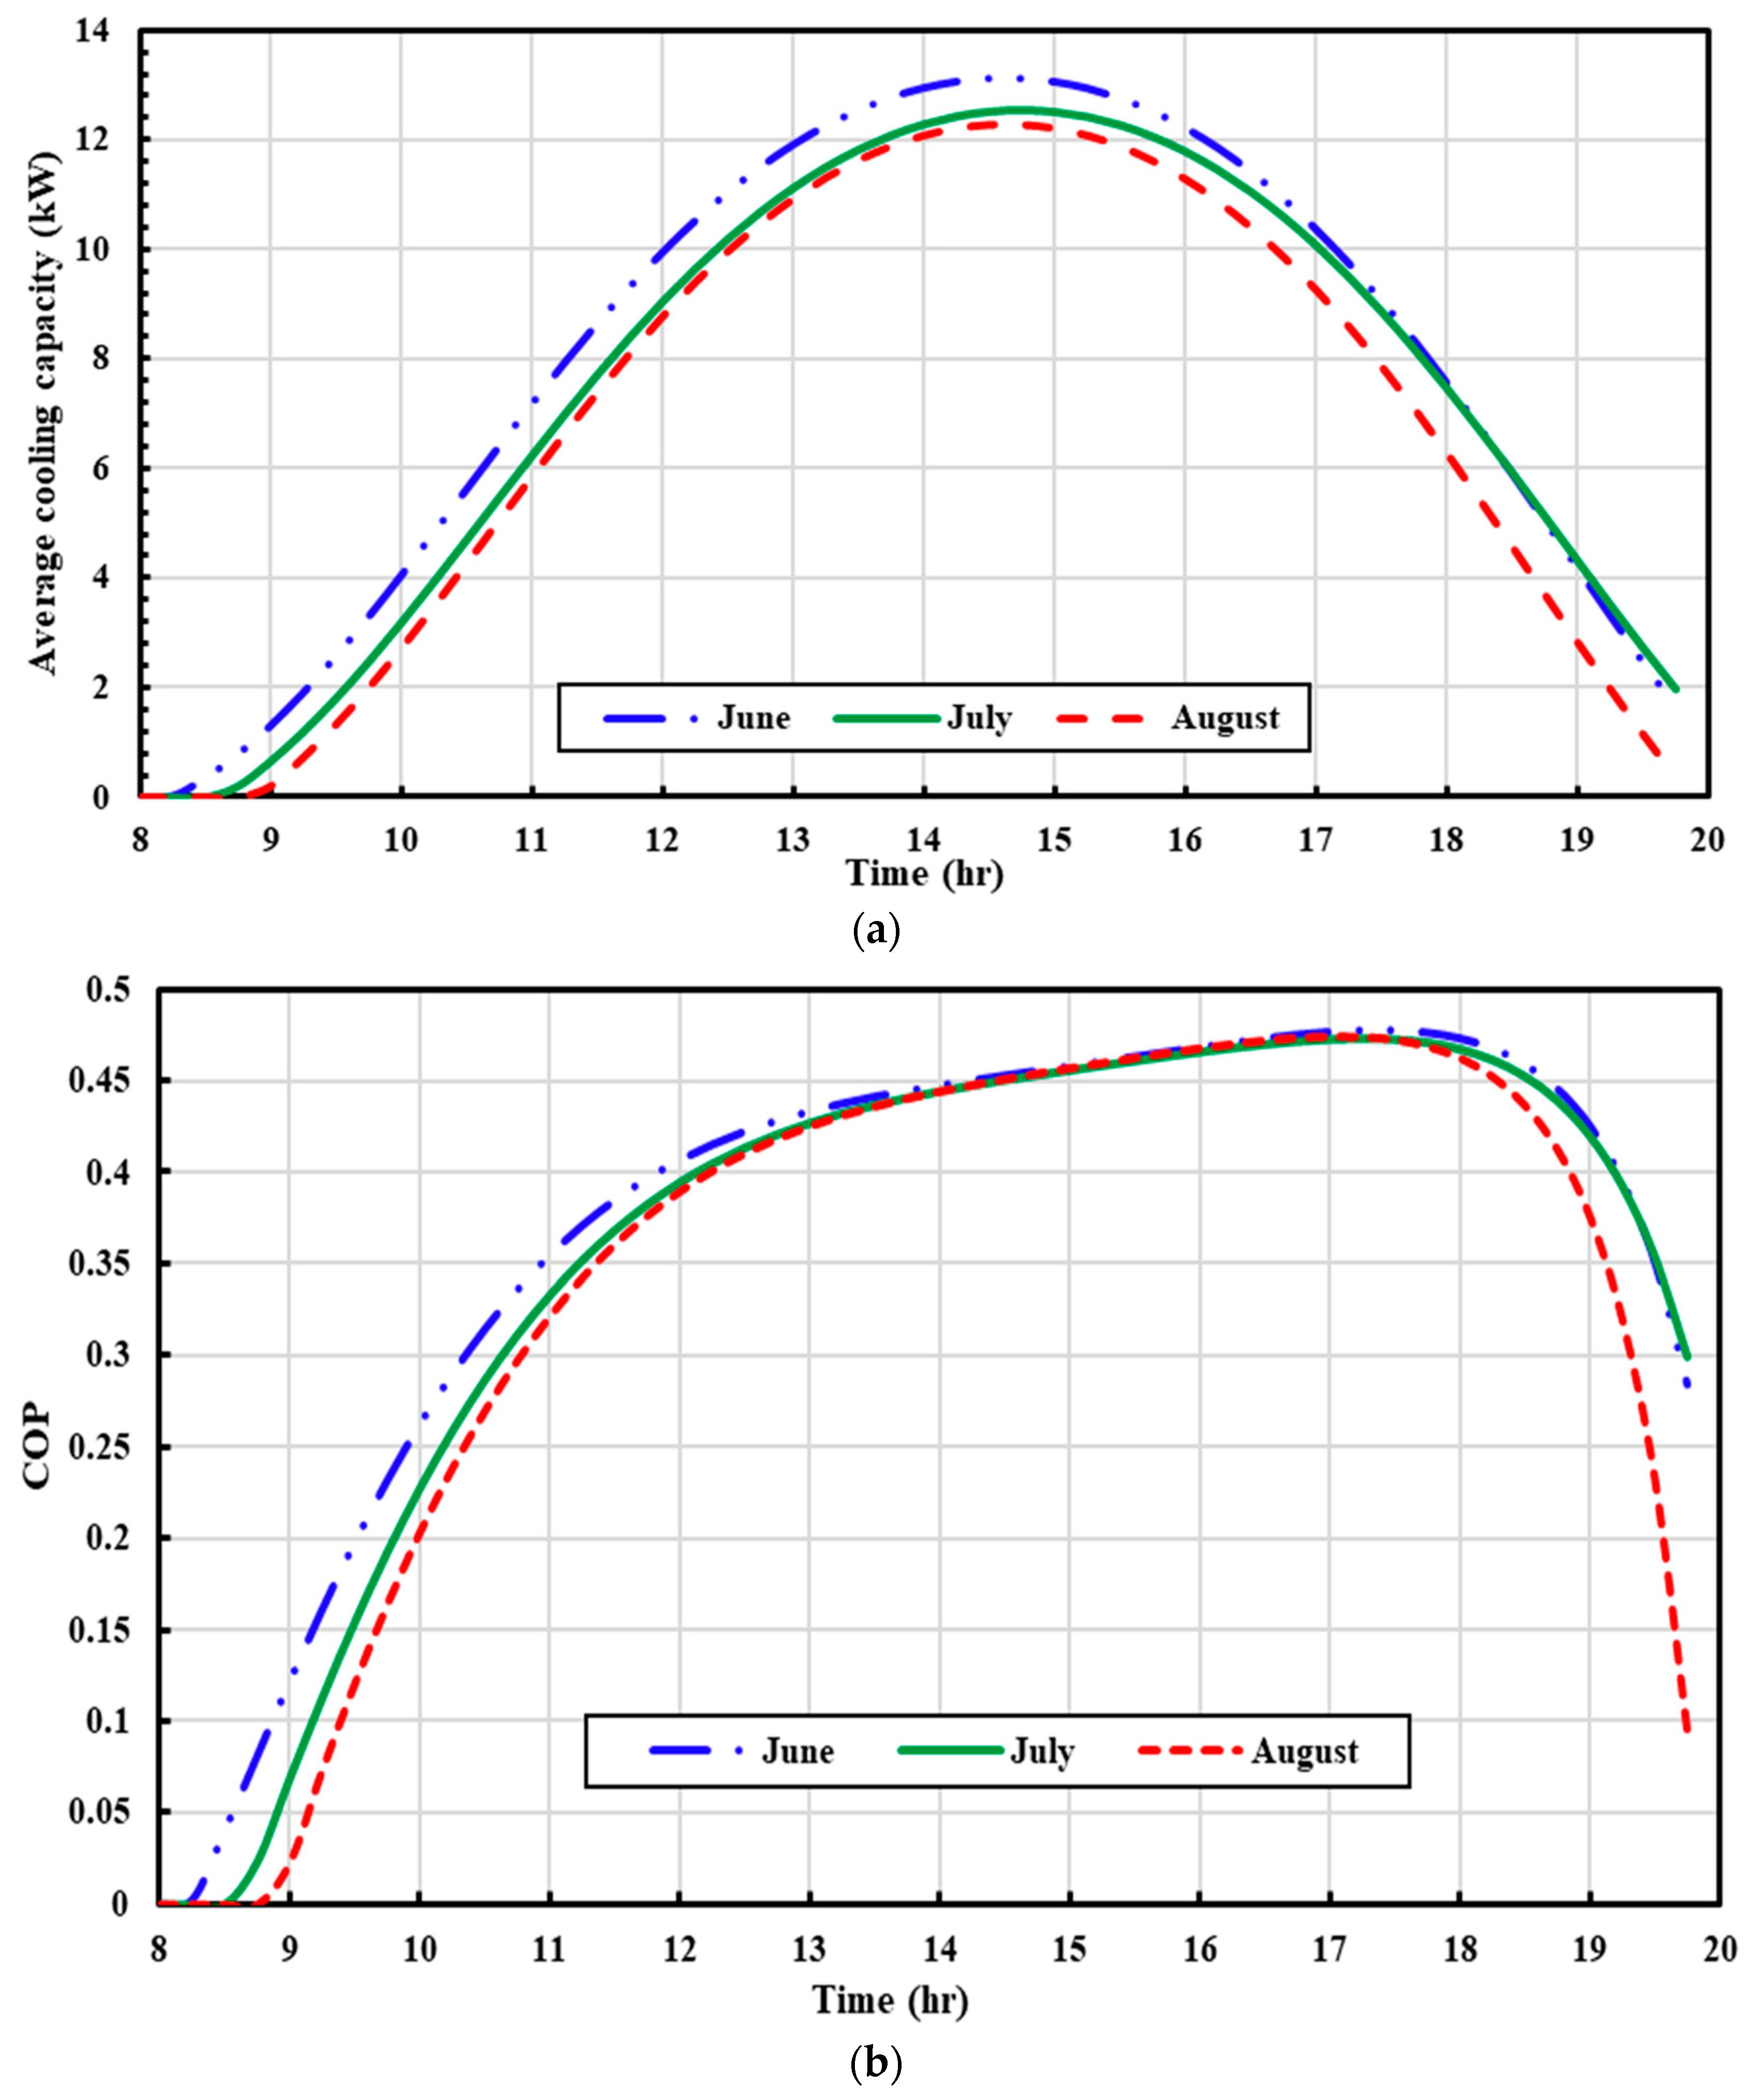
- Among the three cities tested in this study, Riyadh in Saudi Arabia shows better performance due to its relatively higher solar radiation levels and ambient temperatures. On a typical day in June, the adsorption cooling system in the three cities produced an average cooling capacity of 10.6, 10.5, and 9.5 kW in Riyadh, Kuwait, and Sharjah, respectively, while the average COP was found to be 0.464, 0.47, and 0.44, respectively.
- -
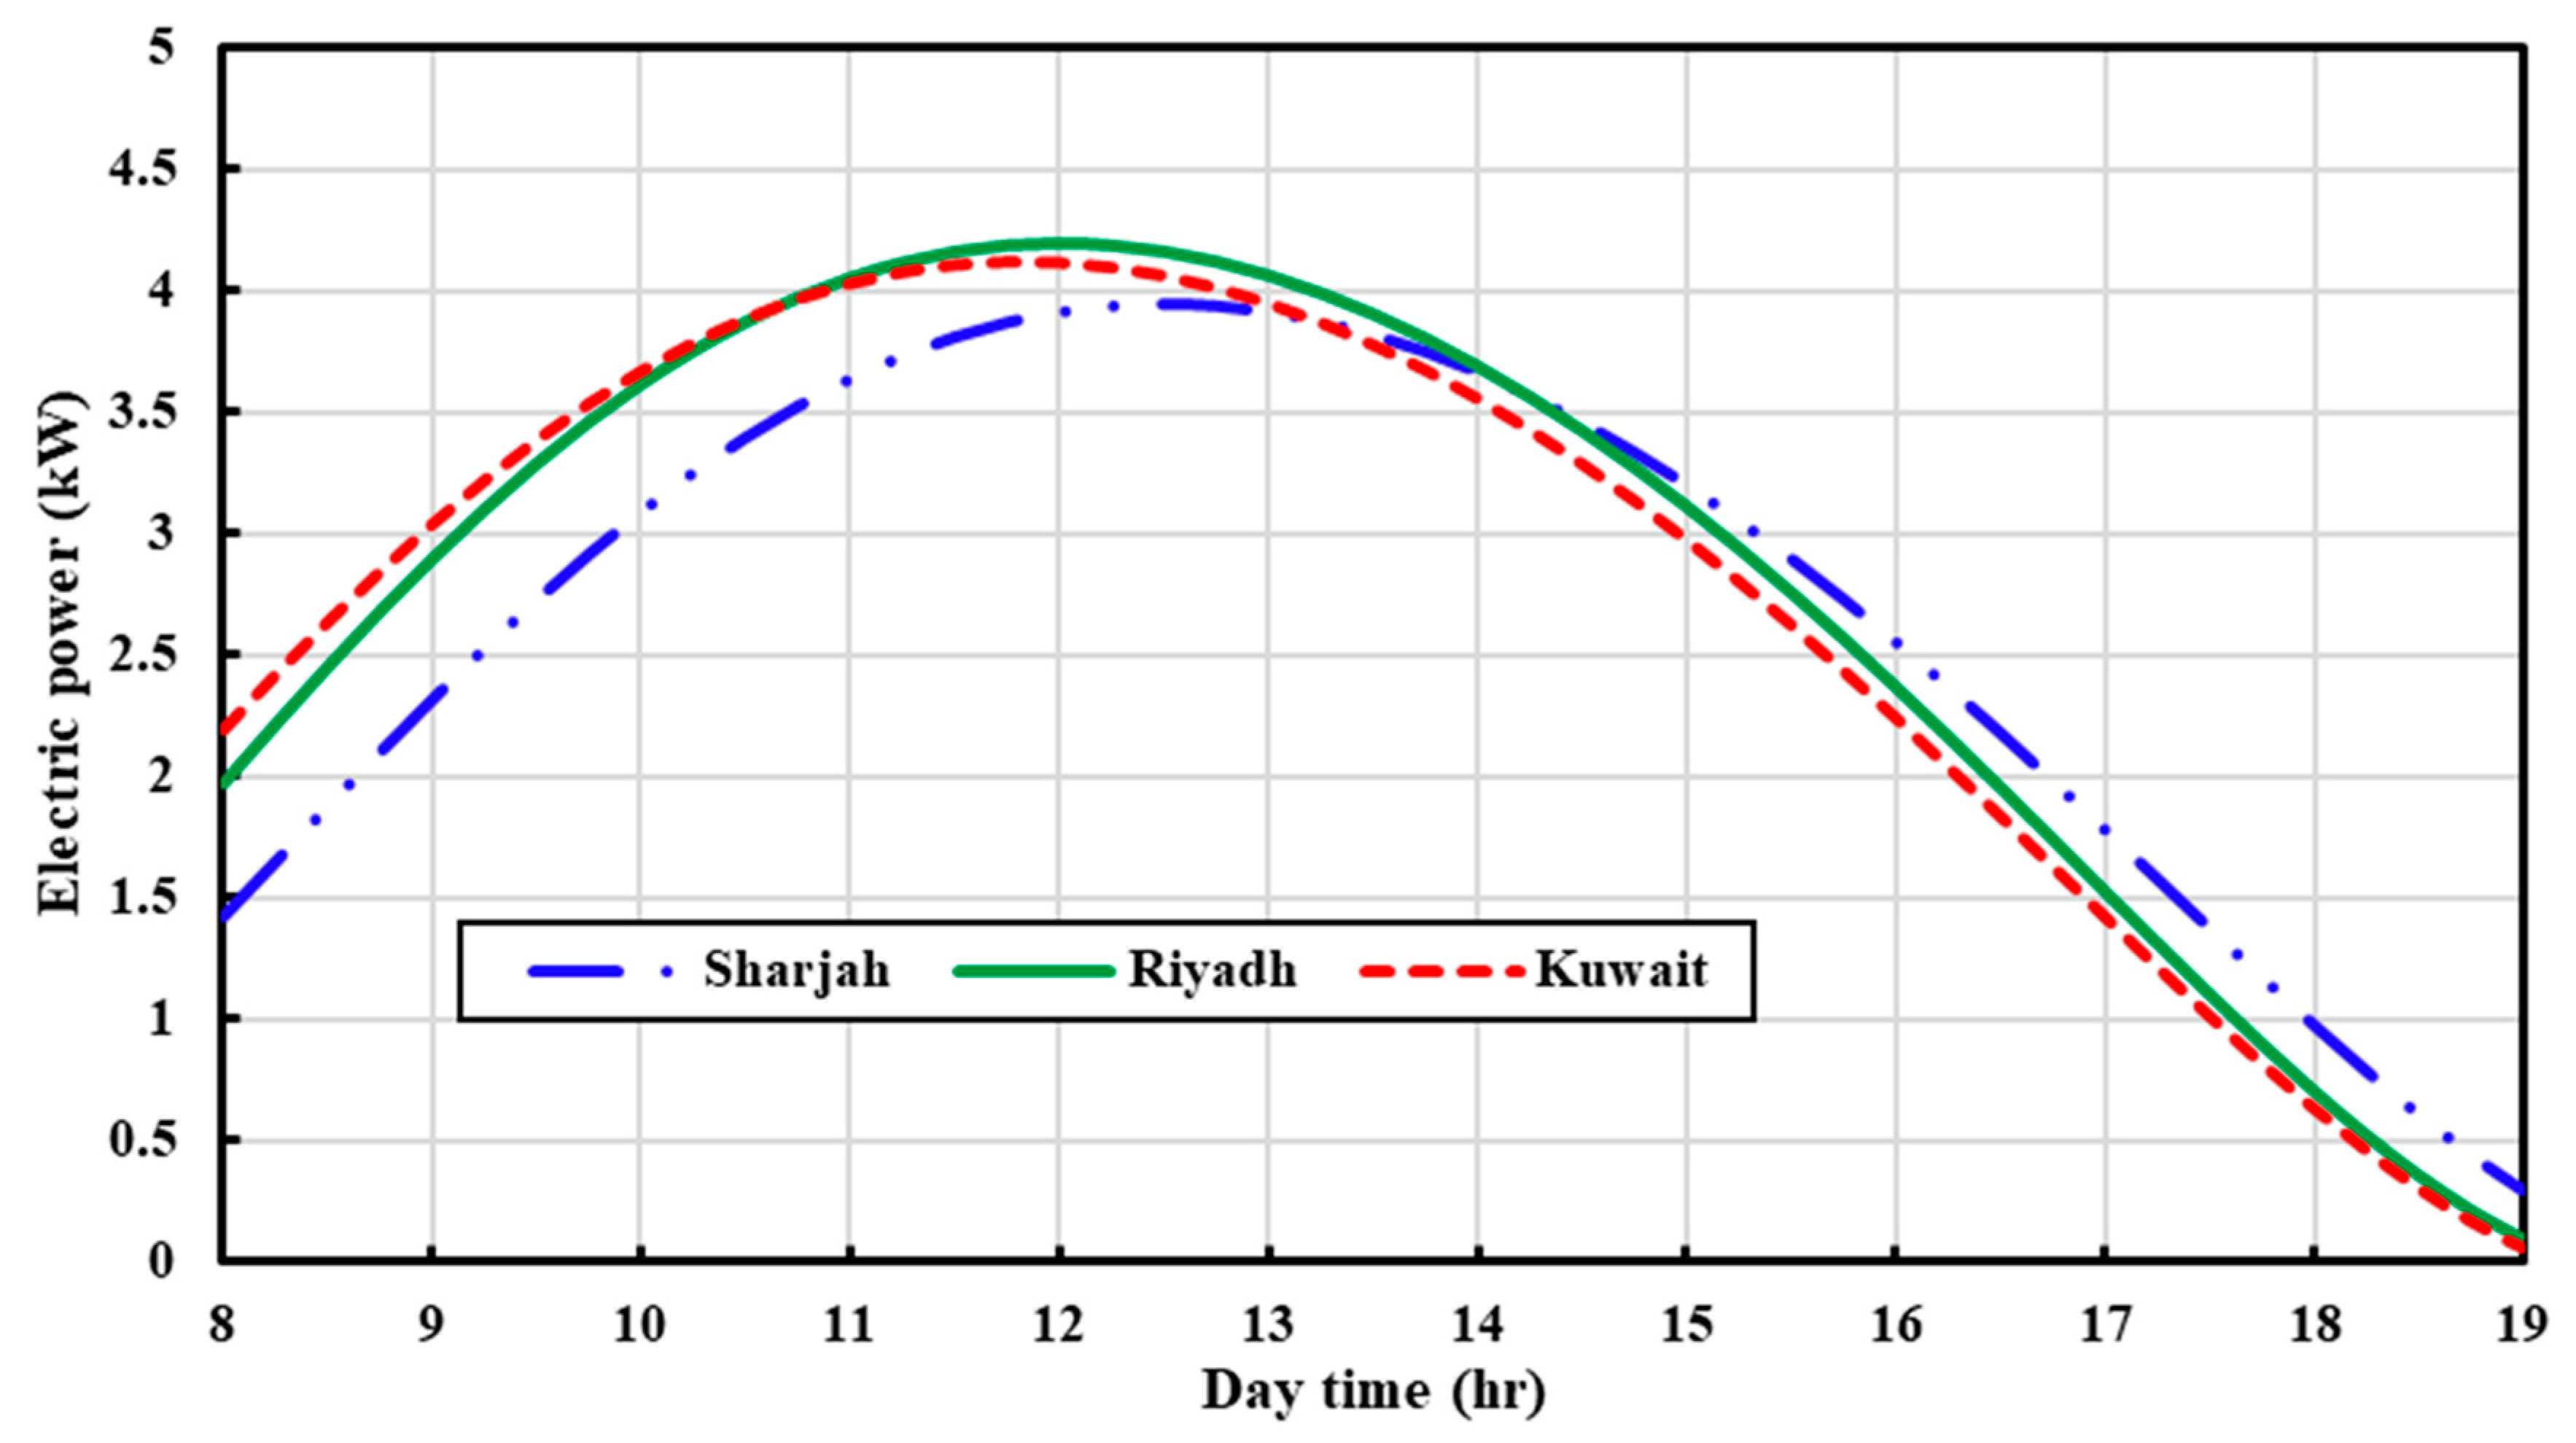
- Considering the electrical energy produced by the PVT collectors in the three cities, it is found that Riyadh produced the highest amount, followed by Kuwait and then Sharjah. The total electrical energy generated by these cities was 31.65, 31.3, and 30.24 kWh/day, respectively.
- -
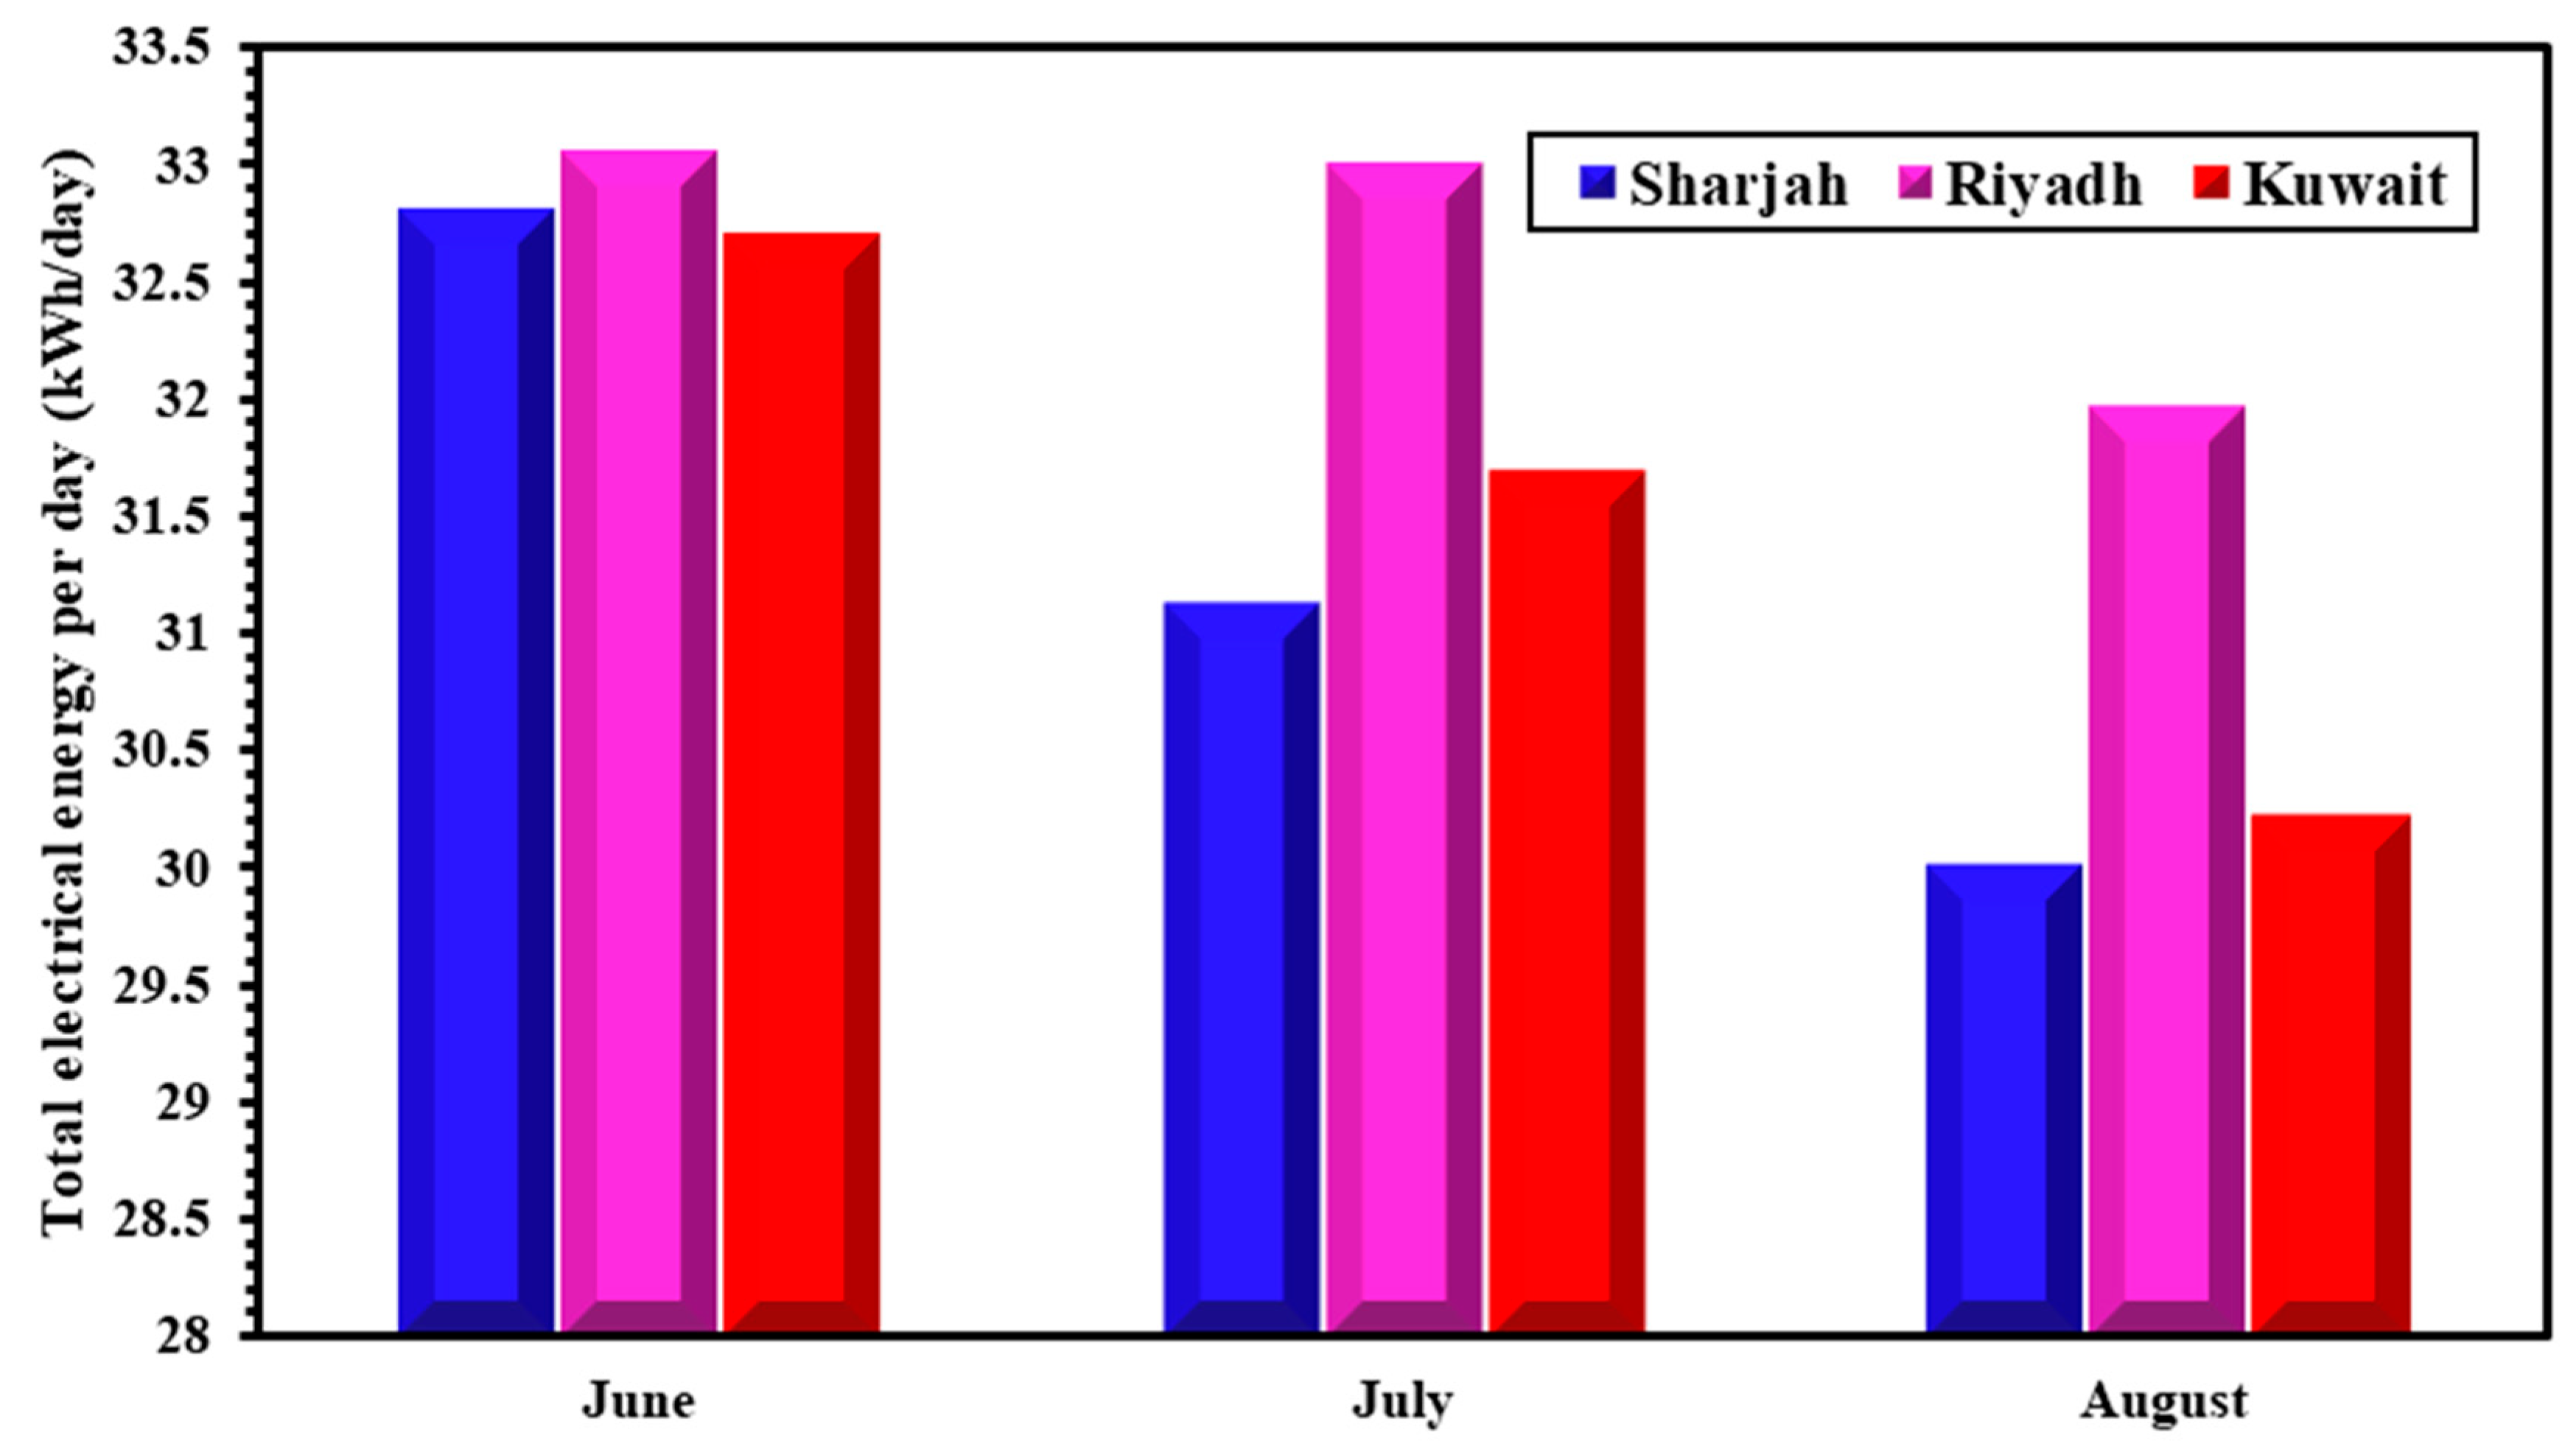
- Considering the electrical energy produced by the PVT collectors in the three cities, it was found that Riyadh exhibits the highest level of electrical energy generation throughout all three months. Riyadh produced 33.05 kWh/day in June, 32.99 kWh/day in July, and 31.91 kWh/day in August.
- -
- The month of June demonstrates the maximum electrical energy values generated from the PVT system in all three cities. Conversely, August showcases the lowest electrical energy values across the three cities, with Riyadh averaging 31.99 kWh/day, followed by Kuwait with 30.21 kWh/day, and Sharjah with 30.00 kWh/day.
- -
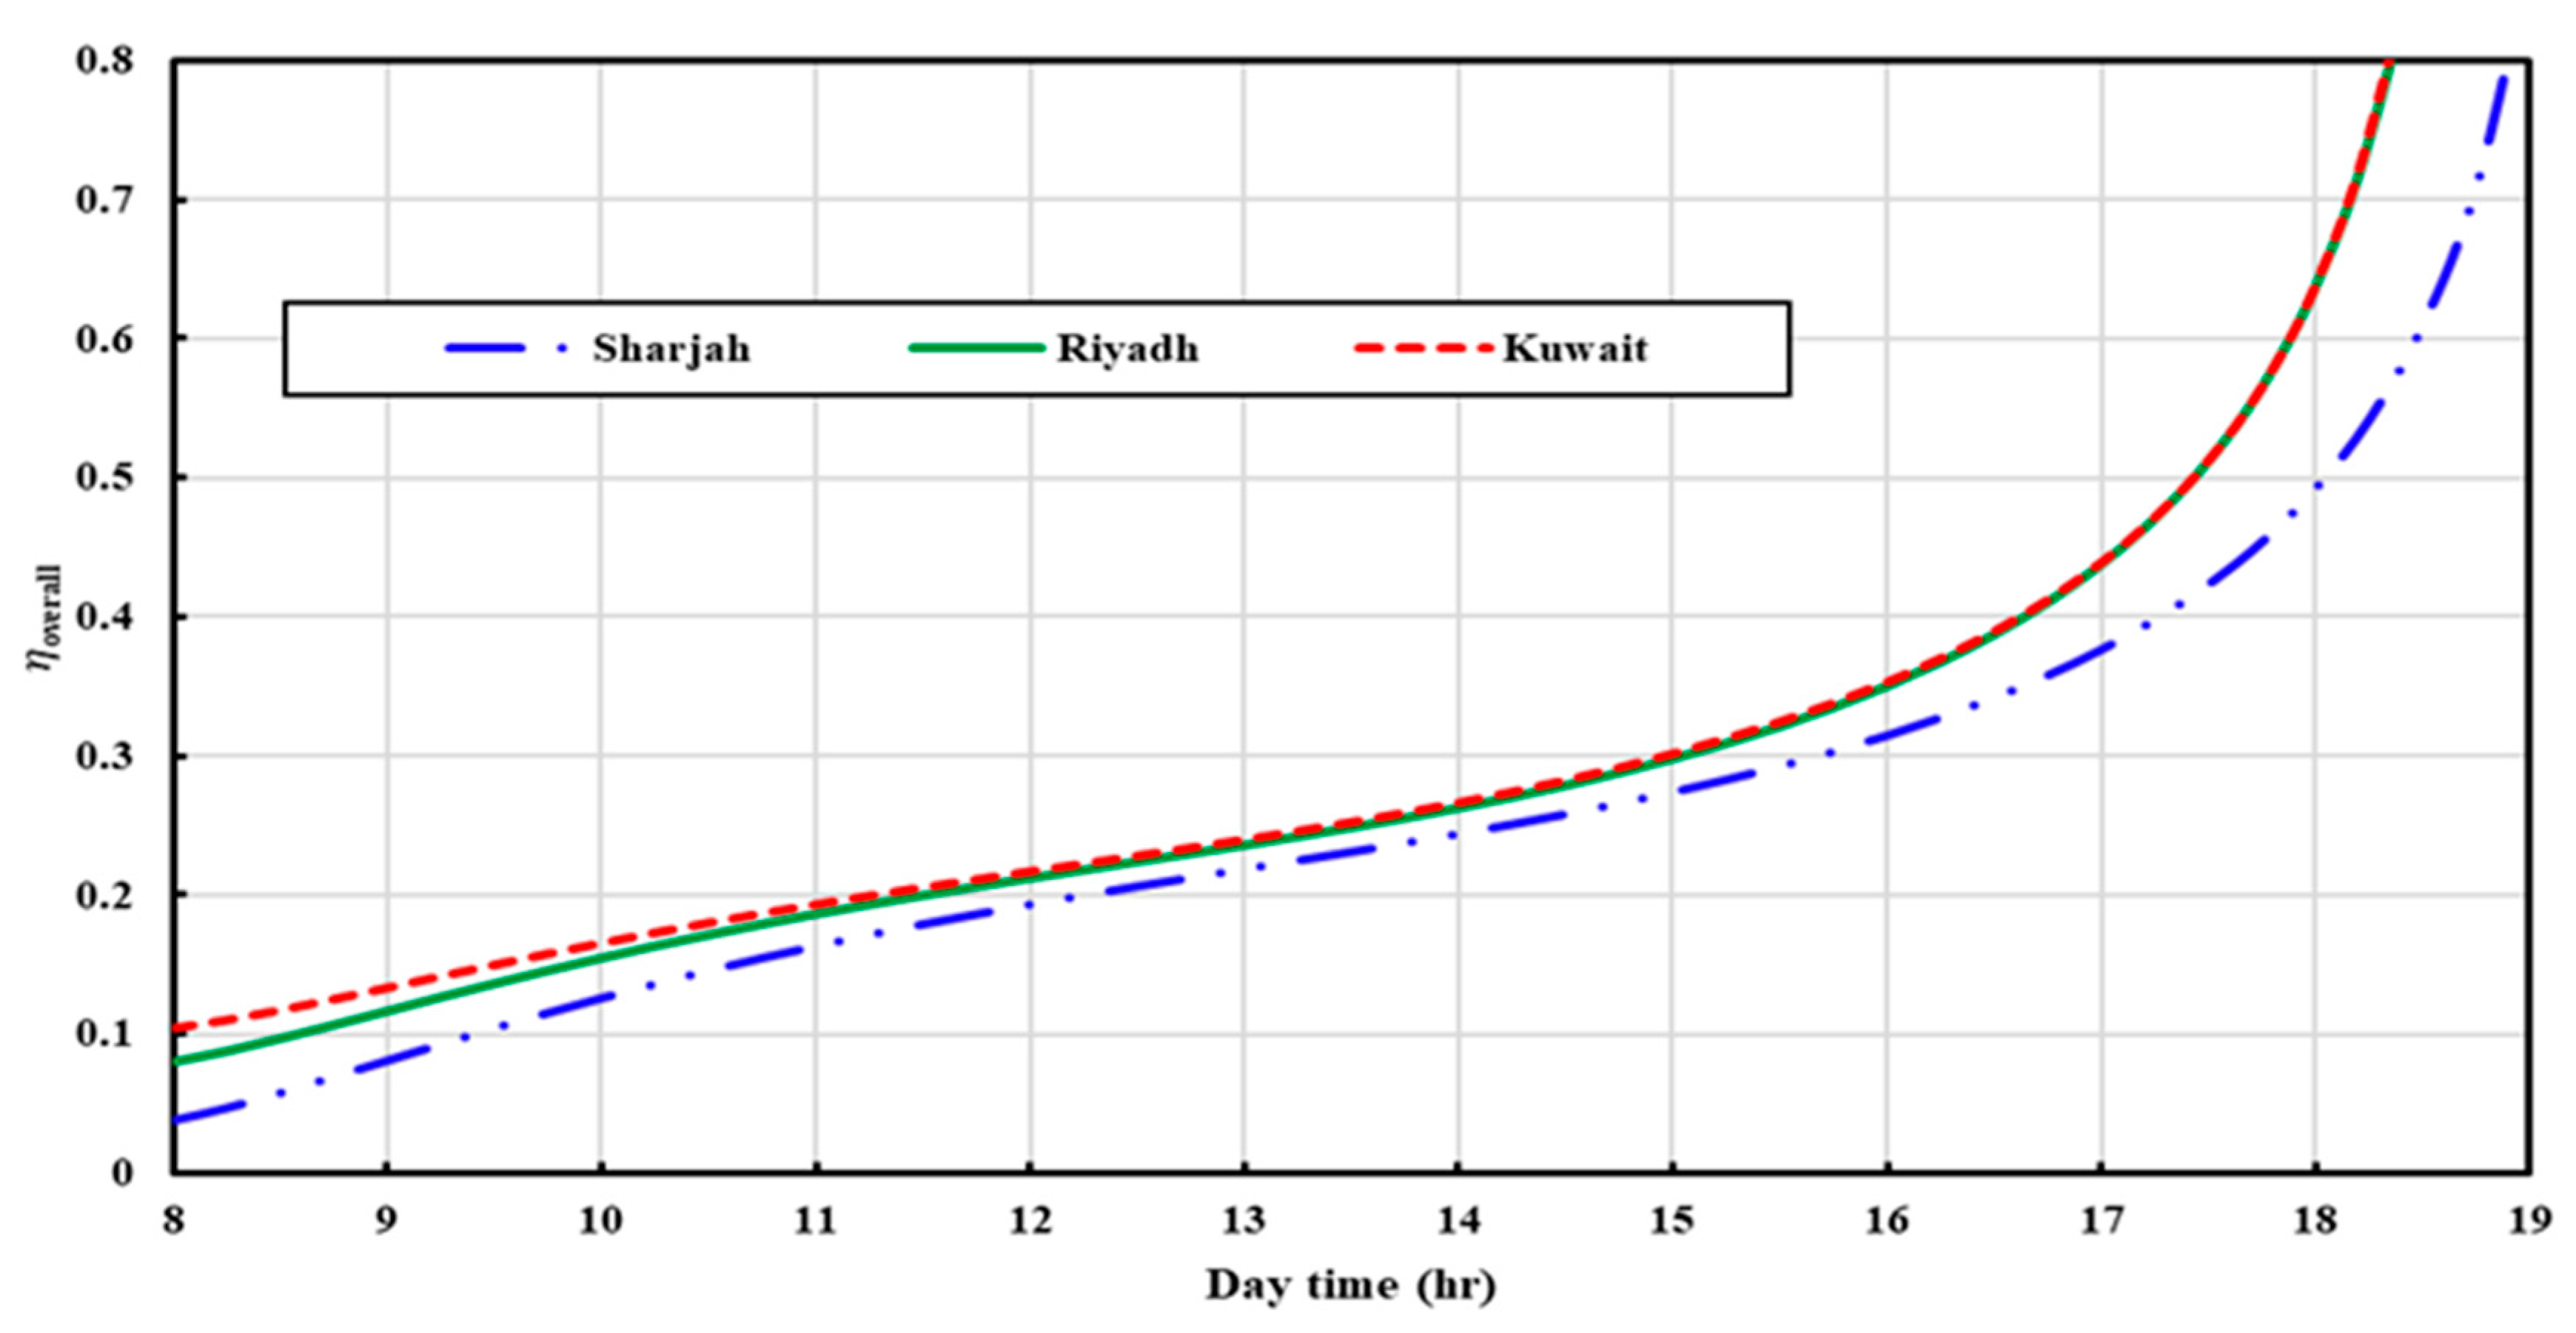
- Irrespective of the city, including a storage tank and its connection to the adsorption chiller enhances the system’s overall efficiency, particularly during the late daylight hours, with the system efficiency reaching approximately 0.64.
Author Contributions
Funding
Institutional Review Board Statement
Informed Consent Statement
Data Availability Statement
Conflicts of Interest
Abbreviations
| COP | coefficient of performance |
| ETC | evacuated tube solar collectors |
| GCC | Gulf Cooperation Council |
| IIR | International Institute of Refrigeration |
| LDF | linear driving force |
| LMTD | logarithmic mean temperature difference |
| PV | photovoltaic |
| PVT | photovoltaic-thermal solar collectors |
| RD | regular density |
| STC | standard testing condition |
| UAE | United Arab Emirates |
Nomenclature
| A | area (m2) |
| An | constants in Equation (13) |
| Bn | constants in Equation (14) |
| CP | specific heat capacity (kJ kg−1 K−1) |
| Dso | pre-exponential constant (m2 s−1) |
| Ea | activation energy (J mol−1) |
| incident solar radiation (W m−2) | |
| K | mass transfer coefficient (m2 s−1) |
| m | mass (kg) |
| mass flow rate (kg s−1) | |
| Pel | electrical power |
| P | pressure (kPa) |
| Qc | mean cooling capacity of cycle (kW) |
| Qst | isosteric heat of adsorption (kJ kg−1) |
| R | universal gas constant (kJ kmol−1 K−1) |
| rp | adsorbent particle radius (m) |
| T | temperature (K) |
| t | Time (s) |
| Weq | amount adsorbed at equilibrium condition (kg kg−1) |
| w | instantaneous adsorption uptake (kg kg−1) |
| U | heat transfer coefficient (W m−2K−1) |
| Greek letters | |
| absorber solar absorptivity | |
| power’s temperature coefficient | |
| intercept factor | |
| η | Efficiency |
| mirror reflectivity | |
| cover transmittance | |
| Subscripts | |
| Ad | adsorption/adsorbent |
| Amb | ambient |
| Bed | adsorber/desorber bed |
| Ch | chilled water |
| C | condenser cooling water |
| Con | condenser |
| Cw | cooling water |
| Cyc | cycle |
| De | desorption |
| El | electrical |
| Eva | evaporator |
| Hw | hot water |
| HE | heat exchanger |
| In | inlet |
| mean | mean value |
| Out | outlet |
| Ref | reference |
| Sat | saturation |
| s.c | solar collector system |
| s.t | storage tank |
| T | tilted surface |
| Th | thermal |
References
- Murugan, S.; Horák, B. Tri and Polygeneration Systems—A Review. Renew. Sustain. Energy Rev. 2016, 60, 1032–1051. [Google Scholar] [CrossRef]
- Papakokkinos, G.; Castro, J.; Capdevila, R.; Damle, R. A Comprehensive Simulation Tool for Adsorption-Based Solar-Cooled Buildings—Control Strategy Based on Variable Cycle Duration. Energy Build 2021, 231, 110591. [Google Scholar] [CrossRef]
- Key World Energy Statistics 2021. In Report of the International Energy Agency 2021; International Energy Agency: Paris, France, 2021. Available online: https://www.iea.org/reports/key-world-energy-statistics-2021 (accessed on 8 July 2023).
- Dupont, J.L.; Domanski, P.; Lebrun, P.; Ziegler, F. The Role of Refrigeration in the Global Economy. In Proceedings of the 38th Note on Refrigeration Technologies (International Institute of Refrigeration, 2019), Montreal, QC, Canada,, 24–30 August 2019. [Google Scholar]
- Cooling. Report of the International Energy Agency; International Energy Agency: Paris, France, 2021. Available online: https://www.iea.org/reports/cooling (accessed on 8 July 2023).
- Mas’ ud, A.A.; Wirba, A.V.; Alshammari, S.J.; Muhammad-Sukki, F.; Abdullahi, M.A.M.; Albarracín, R.; Hoq, M.Z. Solar energy potentials and benefits in the gulf cooperation council countries: A review of substantial issues. Energies 2018, 11, 372. [Google Scholar] [CrossRef]
- Zarei, A.; Liravi, M.; Rabiee, M.B.; Ghodrat, M. A Novel, Eco-Friendly Combined Solar Cooling and Heating System, Powered by Hybrid Photovoltaic Thermal (PVT) Collector for Domestic Application. Energy Convers Manag. 2020, 222, 113198. [Google Scholar] [CrossRef]
- Akhtar, S.; Khan, T.S.; Ilyas, S.; Alshehhi, M.S. Feasibility and Basic Design of Solar Integrated Absorption Refrigeration for an Industry. Energy Procedia 2015, 75, 508–513. [Google Scholar] [CrossRef]
- Wang, D.C.; Wang, Y.J.; Zhang, J.P.; Tian, X.L.; Wu, J.Y. Experimental Study of Adsorption Chiller Driven by Variable Heat Source. Energy Convers. Manag. 2008, 49, 1063–1073. [Google Scholar] [CrossRef]
- Bagherian, M.A.; Mehranzamir, K. A Comprehensive Review on Renewable Energy Integration for Combined Heat and Power Production. Energy Convers. Manag. 2020, 224, 113454. [Google Scholar] [CrossRef]
- Kasaeian, A.; Bellos, E.; Shamaeizadeh, A.; Tzivanidis, C. Solar-Driven Polygeneration Systems: Recent Progress and Outlook. Appl. Energy 2020, 264, 114764. [Google Scholar] [CrossRef]
- Wang, J.; Han, Z.; Guan, Z. Hybrid Solar-Assisted Combined Cooling, Heating, and Power Systems: A Review. Renew. Sustain. Energy Rev. 2020, 133, 110256. [Google Scholar] [CrossRef]
- Herez, A.; El Hage, H.; Lemenand, T.; Ramadan, M.; Khaled, M. Review on Photovoltaic/Thermal Hybrid Solar Collectors: Classifications, Applications and New Systems. Sol. Energy 2020, 207, 1321–1347. [Google Scholar] [CrossRef]
- Joshi, S.S.; Dhoble, A.S. Photovoltaic -Thermal Systems (PVT): Technology Review and Future Trends. Renew. Sustain. Energy Rev. 2018, 92, 848–882. [Google Scholar] [CrossRef]
- Liu, M.; Shi, Y.; Fang, F. Combined Cooling, Heating and Power Systems: A Survey. Renew. Sustain. Energy Rev. 2014, 35, 1–22. [Google Scholar] [CrossRef]
- Mohammadi, K.; Khanmohammadi, S.; Khorasanizadeh, H.; Powell, K. A comprehensive review of solar only and hybrid solar driven multigeneration systems: Classifications, benefits, design and prospective. Appl. Energy 2020, 268, 114940. [Google Scholar] [CrossRef]
- Hassan, A.A.; Elwardany, A.E.; Ookawara, S.; El-Sharkawy, I.I. Performance Investigation of a Solar-Powered Adsorption-Based Trigeneration System for Cooling, Electricity, and Domestic Hot Water Production. Appl. Therm. Eng. 2021, 199, 117553. [Google Scholar] [CrossRef]
- Motamedi, S.; Mehdipour Ghazi, M.; Moradi, S.; Talaie, M.R. An Economic Investigation of a Solar-Powered Adsorption Cooling System. ChemEngineering 2022, 6, 81. [Google Scholar] [CrossRef]
- Calise, F.; Figaj, R.D.; Vanoli, L. A Novel Polygeneration System Integrating Photovoltaic/Thermal Collectors, Solar Assisted Heat Pump, Adsorption Chiller and Electrical Energy Storage: Dynamic and Energy-Economic Analysis. Energy Convers. Manag. 2017, 149, 798–814. [Google Scholar] [CrossRef]
- El-Sharkawy, I.I.; AbdelMeguid, H.; Saha, B.B. Potential Application of Solar Powered Adsorption Cooling Systems in the Middle East. Appl. Energy 2014, 126, 235–245. [Google Scholar] [CrossRef]
- Papoutsis, E.G.; Koronaki, I.P.; Papaefthimiou, V.D. Numerical Simulation and Parametric Study of Different Types of Solar Cooling Systems under Mediterranean Climatic Conditions. Energy Build 2017, 138, 601–611. [Google Scholar] [CrossRef]
- Mostafa, A.; Hassanain, M.; Elgendy, E. Transient Simulation and Design Parameters Optimization of a Cold Store Utilizes Solar Assisted Adsorption Refrigeration System. Case Stud. Therm. Eng. 2022, 37, 102273. [Google Scholar] [CrossRef]
- Apricus ETC-20 Evacuted Tube Collector. Available online: https://www.apricus.com/ETC-20-Solar-Collector-pd46805927.html (accessed on 11 July 2023).
- FOTOTHERM PVT AL-Series Collectors. Available online: https://www.fototherm.com/en/our products/. (accessed on 11 July 2023).
- Lämmle, M.; Kroyer, T.; Fortuin, S.; Wiese, M.; Hermann, M. Development and Modelling of Highly-Efficient PVT Collectors with Low-Emissivity Coatings. Sol. Energy 2016, 130, 161–173. [Google Scholar] [CrossRef]
- Buonomano, A.; Calise, F.; Palombo, A.; Vicidomini, M. Adsorption Chiller Operation by Recovering Low-Temperature Heat from Building Integrated Photovoltaic Thermal Collectors: Modelling and Simulation. Energy Convers. Manag. 2017, 149, 1019–1036. [Google Scholar] [CrossRef]
- López-Martín, R.; Valenzuela, L. Optical Efficiency Measurement of Solar Receiver Tubes: A Testbed and Case Studies. Case Stud. Therm. Eng. 2018, 12, 414–422. [Google Scholar] [CrossRef]
- Evola, G.; Marletta, L. Exergy and Thermoeconomic Optimization of a Water-Cooled Glazed Hybrid Photovoltaic/Thermal (PVT) Collector. Sol. Energy 2014, 107, 12–25. [Google Scholar] [CrossRef]
- Askalany, A.A.; Saha, B.B.; Ahmed, M.S.; Ismail, I.M. Adsorption Cooling System Employing Granular Activated Carbon–R134a Pair for Renewable Energy Applications. Int. J. Refrig. 2013, 36, 1037–1044. [Google Scholar] [CrossRef]
- Saha, B.B.; Koyama, S.; Kashiwagi, T.; Akisawa, A.; Ng, K.C.; Chua, H.T. Waste heat driven dual-mode, multi-stage, multi-bed regenerative adsorption system. Int. J. Refrig. 2003, 26, 749–757. [Google Scholar] [CrossRef]
- Elsheniti, M.B.; Rezk, A.; Shaaban, M.; Roshdy, M.; Nagib, Y.M.; Elsamni, O.A.; Saha, B.B. Performance of a Solar Adsorption Cooling and Desalination System Using Aluminum Fumarate and Silica Gel. Appl. Therm. Eng. 2021, 194, 117116. [Google Scholar] [CrossRef]
- Saha, B.B.; Boelman, E.C.; Kashiwagi, T. Computer Simulation of a Silica Gel-Water Adsorption Refrigeration Cycle-the Influence of Operating Conditions on Cooling Output and COP. ASHRAE Trans. 1995, 101, 348–357. [Google Scholar]
- Zhai, H.; Dai, Y.J.; Wu, J.Y.; Wang, R.Z. Energy and Exergy Analyses on a Novel Hybrid Solar Heating, Cooling and Power Generation System for Remote Areas. Appl. Energy 2009, 86, 1395–1404. [Google Scholar] [CrossRef]
- Koronaki, I.P.; Papoutsis, E.G.; Papaefthimiou, V.D. Thermodynamic Modeling and Exergy Analysis of a Solar Adsorption Cooling System with Cooling Tower in Mediterranean Conditions. Appl. Therm. Eng. 2016, 99, 1027–1038. [Google Scholar] [CrossRef]
- Aneli, S.; Gagliano, A.; Tina, G.M.; Ilis, G.G.; Demir, H. Effectiveness and Constraints of Using PV/Thermal Collectors for Heat-Driven Chillers. Appl. Therm. Eng. 2022, 210, 118330. [Google Scholar] [CrossRef]
- Zhai, X.Q.; Wang, R.Z. Experimental Investigation and Performance Analysis on a Solar Adsorption Cooling System with/without Heat Storage. Appl. Energy 2010, 87, 824–835. [Google Scholar] [CrossRef]


| FOTOTHERM PVT. | Apricus (ETC-20) ETC. | ||
|---|---|---|---|
|
| ||
| Aperture Area | 1.58 m2 | Aperture Area | 1.89 m2 |
| Optical Efficiency (η0) | 58.3% | Optical Efficiency (η0) | 71.4% |
| Heat loss coefficient (c1) | 6.08 W m−2 K−2 | Heat loss coefficient (c1) | 1.243 W m−2 K−1 |
| Heat loss coefficient (c2) | 0.0 W m−2 K−2 | Heat loss coefficient (c2) | 0.009 W m−2 K−2 |
| |||
| Type of Cell | Monocrystalline | ||
| Nominal power | 300 Wp | ||
| efficiency of Module | 18.3% | ||
| Power Temperature coefficient | −0.40% °C−1 | ||
| Parameter | Value | Unit |
|---|---|---|
| −6.5314 | ||
| 0.072452 | ||
| −0.23951 × 10⁻³ | ||
| 0.25493 × 10⁻⁶ | ||
| −15.587 | --- | |
| 0.15915 | ||
| −0.50612 × 10⁻³ | ||
| 0.5329 × 10⁻⁶ |
| Parameter | Value | Units |
|---|---|---|
| 47 | ||
| 51.2 | Kg | |
| 64.04 | Kg | |
| 5.36 | ||
| 6.36 | ||
| 24.38 × 0.386 + 20 × 4.186 | ||
| 12.45 × 0.386 + 50 × 4.186 | ||
| 4241.38 | ||
| 15,349.80 | ||
| 4884.90 | ||
| 1.52 | ||
| 1.28 | ||
| 31 | °C |
| Reference | Description | Main Findings |
|---|---|---|
| Calise et al. [19] |
|
|
| El-Sharkawy et al. [20] |
|
|
| Aneli et al. [35] |
|
|
| Zhai and Wang [36] |
|
|
| Hassan et al. [17] |
|
|
| Current study |
|
|
Disclaimer/Publisher’s Note: The statements, opinions and data contained in all publications are solely those of the individual author(s) and contributor(s) and not of MDPI and/or the editor(s). MDPI and/or the editor(s) disclaim responsibility for any injury to people or property resulting from any ideas, methods, instructions or products referred to in the content. |
© 2023 by the authors. Licensee MDPI, Basel, Switzerland. This article is an open access article distributed under the terms and conditions of the Creative Commons Attribution (CC BY) license (https://creativecommons.org/licenses/by/4.0/).
Share and Cite
El-Sharkawy, I.I.; Hassan, M.; Abd-Elhady, M.M.; Radwan, A.; Inayat, A. Solar-Powered Adsorption-Based Multi-Generation System Working under the Climate Conditions of GCC Countries: Theoretical Investigation. Sustainability 2023, 15, 15851. https://doi.org/10.3390/su152215851
El-Sharkawy II, Hassan M, Abd-Elhady MM, Radwan A, Inayat A. Solar-Powered Adsorption-Based Multi-Generation System Working under the Climate Conditions of GCC Countries: Theoretical Investigation. Sustainability. 2023; 15(22):15851. https://doi.org/10.3390/su152215851
Chicago/Turabian StyleEl-Sharkawy, Ibrahim I., M. Hassan, Mahmoud M. Abd-Elhady, Ali Radwan, and Abrar Inayat. 2023. "Solar-Powered Adsorption-Based Multi-Generation System Working under the Climate Conditions of GCC Countries: Theoretical Investigation" Sustainability 15, no. 22: 15851. https://doi.org/10.3390/su152215851
APA StyleEl-Sharkawy, I. I., Hassan, M., Abd-Elhady, M. M., Radwan, A., & Inayat, A. (2023). Solar-Powered Adsorption-Based Multi-Generation System Working under the Climate Conditions of GCC Countries: Theoretical Investigation. Sustainability, 15(22), 15851. https://doi.org/10.3390/su152215851