Article

Spatio-Temporal Pattern of Groundwater Nitrate-Nitrogen and Its Potential Human Health Risk in a Severe Water Shortage Region

1
State Key Laboratory of Freshwater Ecology and Biotechnology, Institute of Hydrobiology, Chinese Academy of Sciences, Wuhan 430072, China
2
School of Environment and Resources, Taiyuan University of Science and Technology, Taiyuan 030024, China
3
College of Materials Environmental Engineering, Shanxi Polytechnic College, Taiyuan 030006, China
*
Authors to whom correspondence should be addressed.
Sustainability 2023, 15(19), 14284; https://doi.org/10.3390/su151914284
Submission received: 11 August 2023 / Revised: 8 September 2023 / Accepted: 20 September 2023 / Published: 27 September 2023
(This article belongs to the Section Pollution Prevention, Mitigation and Sustainability)

Abstract

:
Groundwater nitrate-nitrogen (GNN) has been one of the most widespread pollutants. However, there is still a poor understanding of GNN pollution and its potential effects on human health. In this study, GNN in Taiyuan, a region of severe water scarcity in northern China, was tracked from 2016 to 2020; the spatio-temporal distribution characteristics of GNN were demonstrated and the potential human health risks to infants, children, and adults were assessed. The results showed that the concentration of GNN varied from 0.1 to 43.3 mg L−1; the highest mean concentration was observed in 2016 and the lowest value appeared in 2020. GNN concentration declined over time, which was closely related to the proactive environmental policies of Tiyuan city. GNN levels were considerably greater in urban areas than in rural areas (p < 0.001), and the forest had a very low level of GNN, which was significantly different from the grassland, farmland, and construction land (p < 0.001). According to the hazard quotient, the impacts of GNN on human health revealed age specificity, namely in the order of infants > children > adults. It was concluded that the interception effect of the forest could effectively alleviate groundwater pollution pressures, and more forest land is necessary for human health risk prevention in the severe water shortage areas to alleviate GNN pollution.

1. Introduction

Nitrate, produced through natural processes and human activities, was one of the most prevalent contaminants in groundwater contamination globally [1]. Nitrate leaching from soil and rock, the decomposition of plants and animal wastes, as well as atmospheric deposition were the main natural sources of nitrate enrichment in groundwater [2]. Besides these, industrial wastewater, livestock farming, landfill leachate, agricultural fertilizers, and domestic sewage [3,4,5,6] were anthropogenic nitrate sources in the environment [7,8,9]. Nitrate can enter groundwater from the surface and dissolves well in soil [10,11]; it is a common constituent of groundwater.
Nitrate induces environmental problems in the groundwater after participating in the hydrological cycle; the groundwater quality could be rapidly deteriorated by the increasing nitrate concentration, which could pose health risks to those who are exposed to the groundwater in various ways [12]. Consuming groundwater was found to be the major way to be exposed to nitrate, and there were two ways to be exposed to nitrate: orally and topically [13,14,15]. The amount of nitrate that the human body absorbed determined how harmful it was [16,17,18,19]. Besides this, newborns were at greater health risk than children when they were exposed to nitrate [15,20,21,22].
Though no direct harm to the human body could be found, nitrate could be converted into nitrite, which could quickly cause health problems [23], such as high iron hemoglobin (known as blue infant syndrome or methemoglobinemia), diabetes, colorectal cancer, etc. [24,25]. Blue infant syndrome, which could be caused by high concentrations of nitrate, is a blood disorder that impairs the ability of the blood supply to carry oxygen throughout the body [24]; it primarily affects infants less than 6 months of age. Many countries and regions have developed nitrate concentration standards based on their realities [15,21,22]. The WHO limited nitrate concentrations to 10 mg L−1. The median level of nitrate in groundwater in the U.S. was generally less than 2 parts per million, and the US EPA requires nitrate concentrations in drinking water to be less than 10 mg L−1 [26] (US EPA, 2009). Iran has set limits for nitrate concentrations of 10 mg L−1 and 50 mg L−1 according to the WHO and national circumstances. China stipulated the limit of nitrate concentration in drinking groundwater was 20 mg L−1. Due to the great health risk, groundwater nitrate-nitrogen (GNN) was paid attention to by the public, especially in severe water shortage regions; moreover, health issues originating from nitrate contamination in groundwater needed to be studied further.
Nitrate pollution in groundwater has been reported in many developing and developed countries [9,27]. The level of nitrate in groundwater generally decreases with depth below ground, indicating that deeper groundwater is somewhat insulated from surface conditions by intervening rock layers. In semi-arid southern India, roughly 57% of samples exceeded the nitrate limits of the country’s drinking water guidelines [28]. Nitrate levels ranged between 0.4–137.0 mg L−1 and 2.9–209.0 mg L−1 in rural and urban parts of Iran, respectively. In the two locations, 25% and 24% of water samples’ nitrate levels were greater than 50 mg L−1, with agricultural and residential areas having the greatest values [29]. GNN was related to the N usage efficiency of agriculture and nitrate concentrations in Denmark during the past 70 years [30]. In South Korea, seasonal fluctuations in GNN concentration were observed, rising in the dry season and decreasing in the wet season [31]. In Chinese intensive farming regions, areas with higher GNN concentrations were primarily found in those with low groundwater runoff modulus and excessive use of nitrogen fertilizer. It was reported that 30 regions in Africa, 20 in Asia, and 9 in Europe were in a severe position on a global level. With more than 25% of samples over 50 ppm of nitrate, Europe had the largest proportion of contaminated regions, whereas Asia had a bigger number of polluted regions than Europe [32]. Despite studies on the distribution features of groundwater nitrate, more research on its distribution characteristics and health risks in areas with serious water scarcity is still required.
The amount of nitrate in groundwater was typically related to the land-use activities in the upstream watershed or on the land over the aquifer. Groundwater nitrate levels were generally highest in agricultural areas (usually greater than 20 mg L−1) [33]. It was proven that land-use types significantly affected GNN concentration [34,35], with researchers from Iran [16] and the North China Plain [36] providing further evidence of this. Nitrate from human activities was discharged directly or indirectly into groundwater, which could lead to continuous nitrate contamination of groundwater [37]. However, there is currently limited research on the spatio-temporal differences of GNN and its potential health risks under different land-use cover types, which is not conducive to the formulation of active environmental policies.
Taiyuan is a serious water scarcity region in Shanxi Province, Northern China, and has been suffering from GNN pollution for many years. In order to gain insight into the status of health risks originating from GNN pollution, the spatio-temporal distribution pattern of nitrate-nitrogen in the groundwater of Taiyuan was examined in this study, along with the differences in nitrate distribution between urban and suburban regions and the features of nitrate’s temporal fluctuation. Human (infants, children, and adults) health hazards associated with GNN were evaluated using the non-carcinogenic risk method. Our findings would be helpful in gaining insight into the status of GNN distribution and its related health risks, which would be useful for experts and policy-makers to implement appropriate actions to protect human health.

2. Materials and Methods
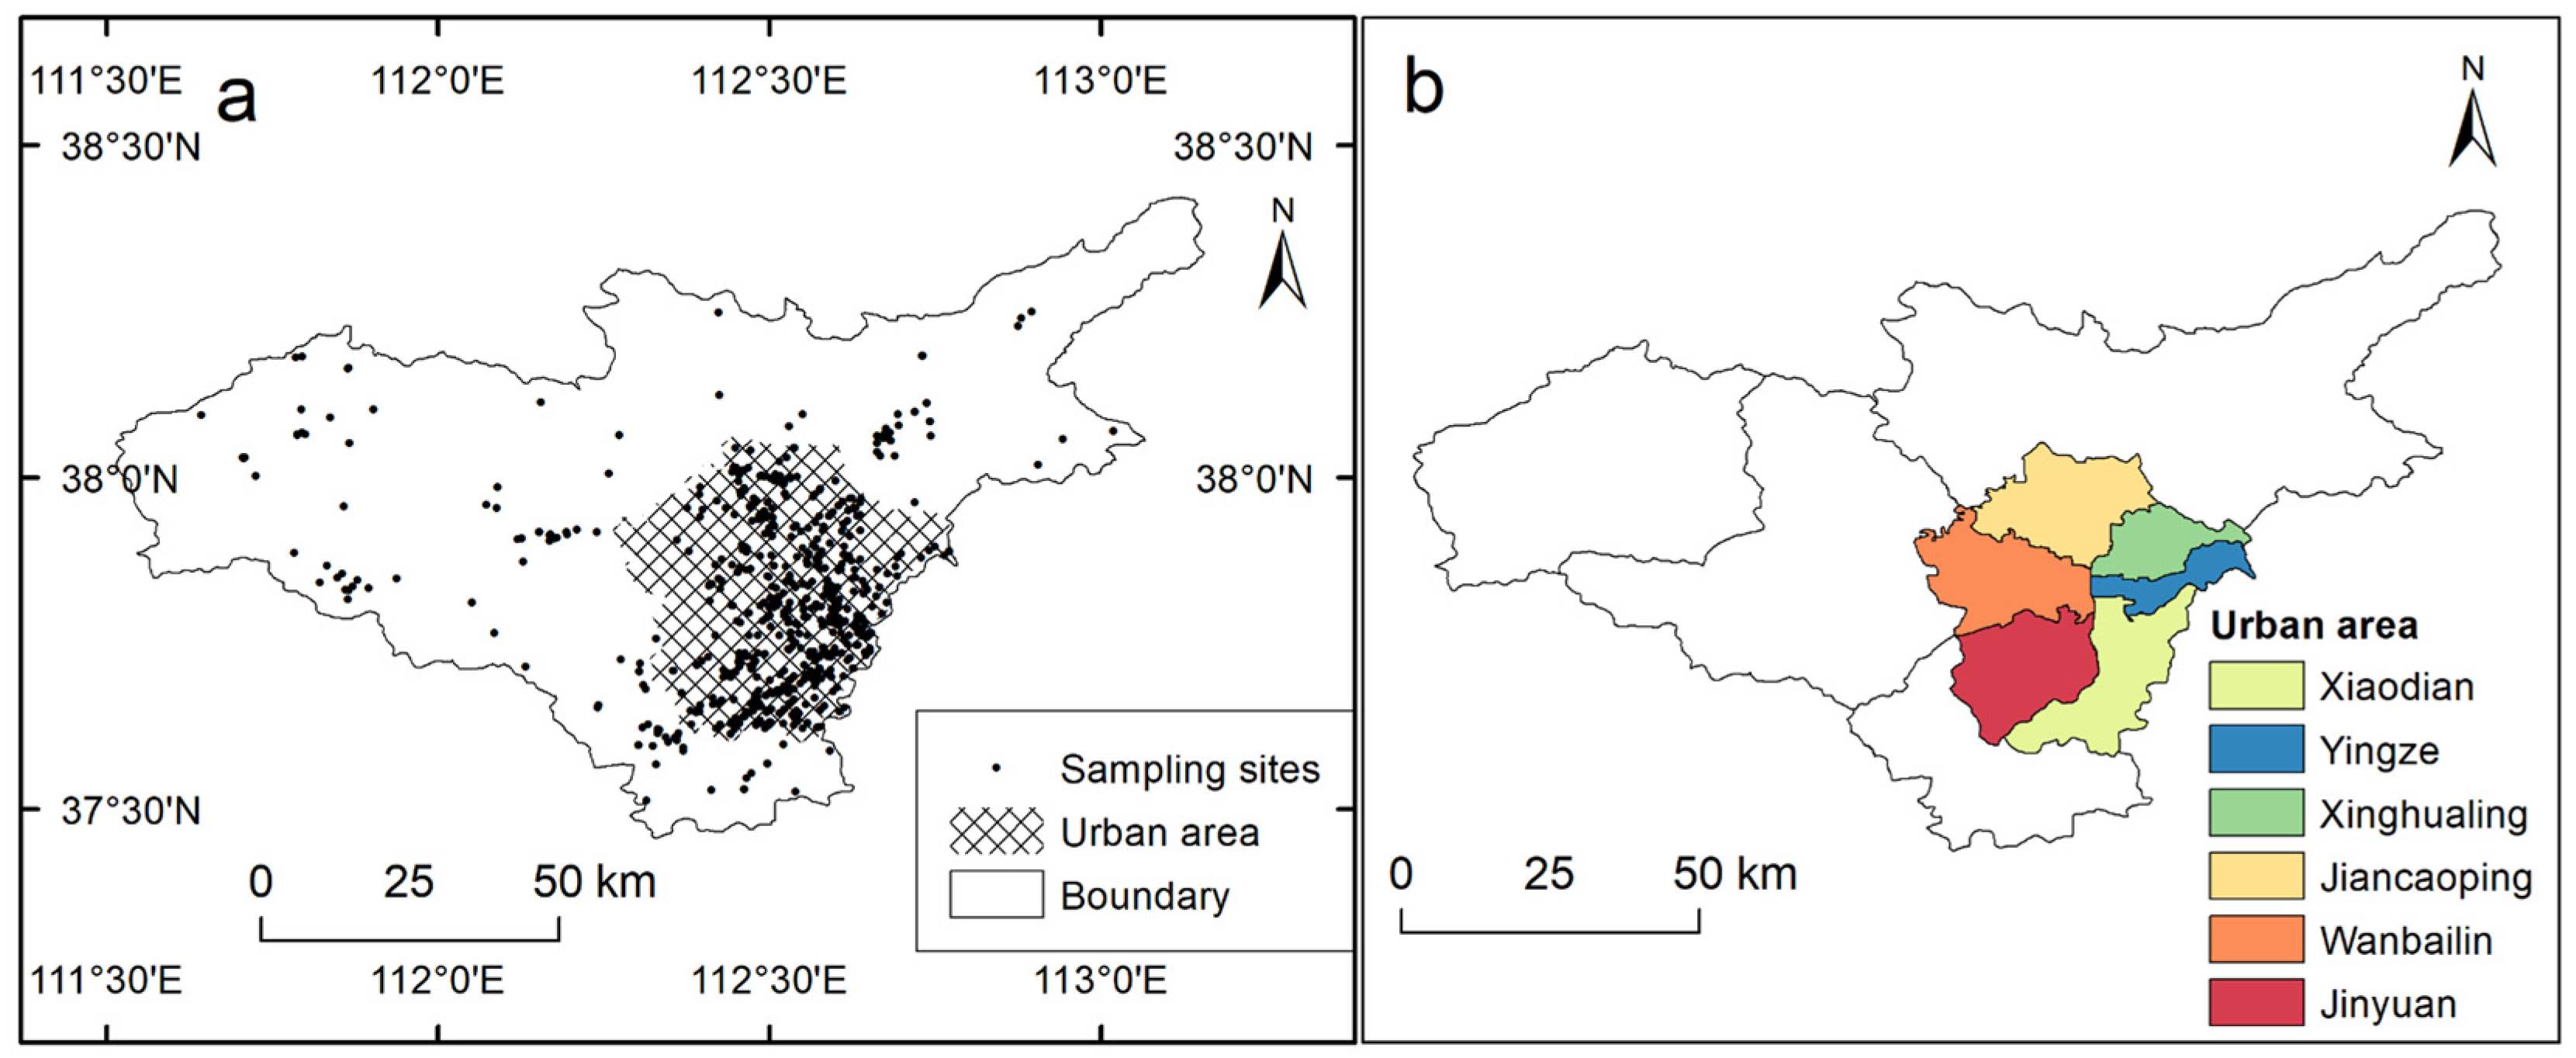
2.1. Study Area

Taiyuan (111°30′–113°09′ N, 37°27′–38°25′ E) is located in Northern China and has a total area of 6988 km2 (Figure 1a). The 1460 km2 urban area has housed 3.67 million people and served as a national heavy industrial base [34]. Taiyuan belongs to the arid and semi-arid area with an annual average precipitation of 425–520 mm. It is hot and rainy in the summer, and cold and dry in the winter; the annual average temperature is 9.75 °C, and the temperature difference between day and night is significant. Groundwater is the primary source of drinking water. The central economic pillar of Taiyuan is the coal industry, which causes severe pollution in Taiyuan [38]. Nitrate pollution is one of the most common water pollutants in groundwater, especially in semi-arid areas in northern China. Taiyuan, Shanxi Province, is a typical semi-arid area. The principal source of drinking water in Taiyuan is groundwater [39], and it is a typical groundwater nitrate pollution area [40].
Taiyuan has six municipal districts, three counties, and one county-level city. Taiyuan was separated into urban and suburban regions for investigation in this study, including Waibailin District (WBL), Xinghualing District (XHL), Jiancaoping District (JCP), Xiaodian District (XD), Yingze District (YZ), and Jinyuan District (JY) as the urban regions; the suburbs include Gujiao City (GJ), Loufan County (LF), Qingxu County (QX), and Yangqu County (YQ) (Figure 1). From 2016 to 2020, 850 drinking water samples from untreated civilian wells were collected in Taiyuan’s urban (677) and suburban (173) locations (Figure 1) to demonstrate the spatio-temporal distribution characteristics of GNN. The four land-use types, agriculture, grassland, forest land, and building land, were paired with nitrate concentration to explain the likely source of nitrate.

2.2. Sample Analysis

2.2.1. Sample Determination

A 250 mL plastic bottle was used to collect water samples. All samples were filtered through a 0.45 μm cellulose acetate membrane and refrigerated at 4 °C. The nitrate content was evaluated using an ion chromatograph (ICS-1000) [41]. Specifically, we used an eluent of 20% KOH solution flowing through an AS19 anion column. Pure deionized water was used as the suppressor (ASRS 4 mm, I = 50 mA). We used a flow rate of 1.0 mL min−1 and set the injected sample volume to 25 mcl (μL). The process occurred under 0.2 MPa (the eluent under 3–6 psi), and IC was initiated once the pressure reached 1000 psi. All solvents used during IC were pure deionized water. These solutions were stable for 24 h after preparation.

2.2.2. Quality Control

According to the Chinese Standards for Drinking Water Quality (GB5749-2022) [42], the quality control of NO3 detection was evaluated using a standard regression curve, regular instrument calibration, repeatability and repeatability.

2.3. Exposure and Health Risk Assessment

The US EPA’s human health risk assessment approach was widely employed. It was found to be one of the most successful ways to assess possible hazards that could quantify risks [10,43]. Nitrate risk should be assessed using the reference dosage [44,45,46]. The WHO recommended the non-carcinogenic health risk level. When the hazard quotient (HQ) is <1, this indicates no negative effects on the human body. If the HQ value is >1, the drug might have a non-carcinogenic impact on the human body. When HQ levels rise, so do non-carcinogenic health hazards [47,48,49].
Non-carcinogenic health risks of nitrate in three age groups were assessed: infants (<2 years), children (2–16 years), and adults (>16 years). The EDI parameter [7,21] was used in this analysis.
E D I = C × I R × E F × E D B W × A T
where EDI was the estimated daily intake (mg kg−1 day−1), C was the measured NO3 concentration (mg L−1), IR was the drinking water intake rate (L day−1), EF was daily exposure frequency (day year−1), ED was exposure duration (year), BW was the weight (kg), and AT was the average time (day).
We used Equation (2) to calculate non-carcinogenic risk [7,9,50].
H Q = E D I R f D    
where HQ was the non-carcinogenic risk index, and RfD was the reference dose of NO3-N in specific exposure pathways (mg kg−1 day−1). The RfD coefficient of NO3 in drinking water was 1.6 mg kg−1 day−1. Calculation parameters for the exposure to drinking water were shown in Table 1 and Table 2 [9,11,51,52].

2.4. Data Analysis and Statistics

Excel 2010 was used for data treatment. Origin 2021 created a box diagram, histogram, temperature diagram, and linear regression fitting diagram. Given that the sample concentration distribution was severely skewed, and the data after logarithmic transformation still did not adhere to a normal distribution, SPSS was used to conduct the Kruskal–Wallis test and Man–Whitney test for the one-way ANOVA.
To determine whether there was a significant difference between groups (p < 0.05), Arcgis 10.6 was used to create all spatial visualization maps. The spatial autocorrelation approach (local Moran index) was employed to investigate the geographical features of GNN.

3. Results and Discussion

3.1. The Spatio-Temporal Distribution

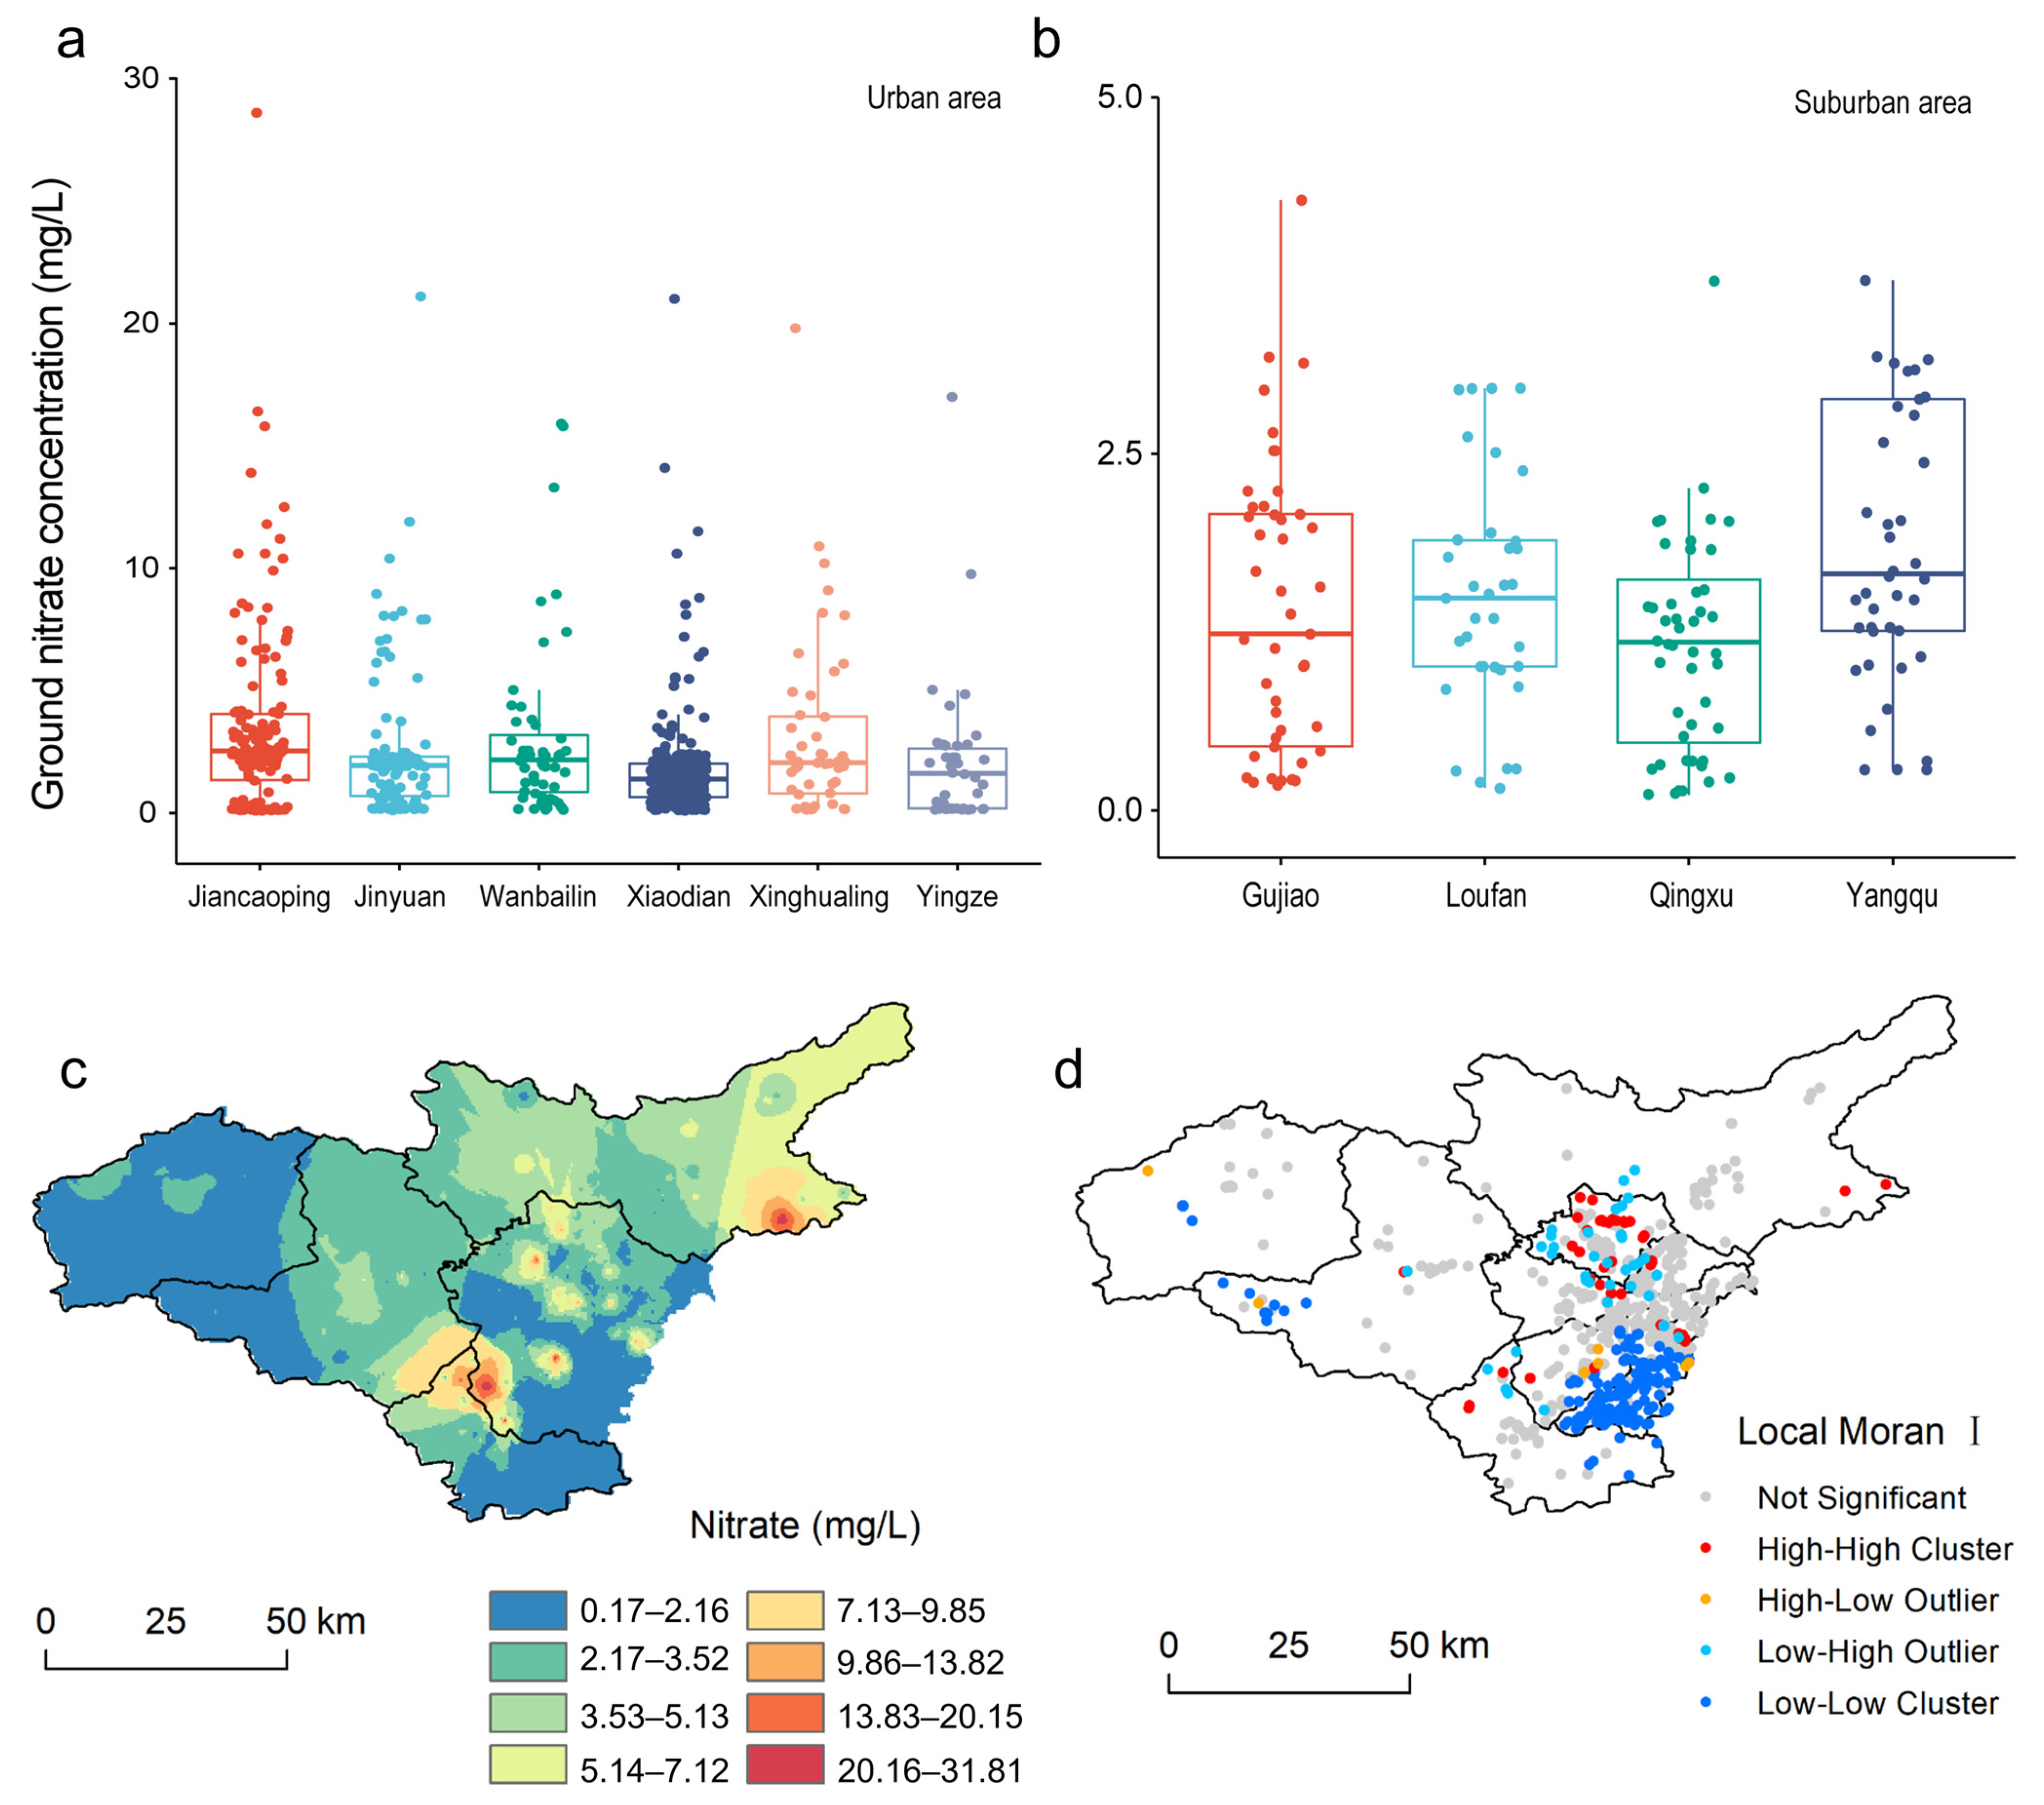
3.1.1. Spatial Distribution Characteristics

The GNN concentration ranged from 0.1 mg L−1 to 43.3 mg L−1 with a mean of 2.43 mg L−1 and a median of 1.68 mg L−1. The sample concentration showed a skewed distribution. The average and median values were lower than the limits of the World Health Organization (10 mg L−1) and Chinese drinking water standards (20 mg L−1) [42]. In the urban area, the average concentration of GNN in XHL District was the highest (3.89 mg L−1), followed by WBL District (3.63 mg L−1) and JCP District (3.45 mg L−1). The lowest concentration appeared in the JY District (2.80 mg L−1) (Figure 2a). The average concentration in all of the districts of Taiyuan was not more than 10 mg L−1. The Kruskal–Wallis one-way analysis of variance on ranks showed that GNN concentrations in urban and suburban regions were significantly different (p < 0.001). GNN concentrations in urban regions (2.60 mg L−1) were substantially greater than in suburban regions (1.75 mg L−1).
It was reported that nitrate concentrations in semi-arid southern India varied from 17 to 120 mg/L, with 54.29% of the groundwater samples exceeding the recommended limit of 50 mg/L [28]. Nitrate concentrations in the rural and urban parts of Iran were 0.4–137.0 mg L−1 and 2.9–209.0 mg L−1, respectively; the nitrate levels were greater than 50 mg L−1 in 25% of the water samples from agricultural areas and in 24% of the water samples from residential areas [29]. Compared to these two areas, the GNN concentrations in Taiyuan were lower and the pollution status was not serious.
Figure 2c depicts a spatial autocorrelation of GNN concentration. GNN concentrations in XD District and QX County belonged to the Low-Low cluster, suggesting that the GNN concentration was typically low in most locations of XD District and QX County. GNN concentrations in JCP District, west of JY District and southeast of YQ County, northeast of XD District, and northwest of QX County exhibited a High-High cluster, suggesting that NO3 concentrations in these locations were usually high. The high GNN concentration belonged to the Low-High outlier in northern JCP District and the region bordering JCP and WBL Districts, as well as in the center portion of GJ City. The Low-High outlier suggested that GNN concentrations in these places were low, but NO3 concentrations in the surrounding areas were high, with large spatial variances. However, because there was no apparent spatial autocorrelation in most regions of Taiyuan, the inverse distance weighting method (IDW interpolation) was utilized to forecast the geographical distribution of NO3 concentration. In most regions of Taiyuan, NO3 concentrations were less than 3 mg L−1 (Figure 2c). There were a few locations that exceeded the norm, mostly in Taiyuan’s southwest and suburbs. The over-standard areas had a similar distribution location to the High-High cluster (Figure 2d). Spatial difference of GNN was also observed in the Sonnen Plain [41]; the distribution of high-concentration areas expanded from the central and western areas to the east, with time. The drivers that increased GNN in the Sonnen Plain were the increased fertilizer use, due to the increased cultivated land area, and the implementation of a land fertility policy by the local government. The situation in the Sonnen Plain was significantly different from that in Taiyuan. Though anthropogenic activity was recognized as the main reason for the spatial differences in GNN spatial distribution, the specific influencing factors varied in different regions.
The excessive concentration was mostly focused in the southwest urban area, which might be due to the principal coal industry concentration [38]. Most regions in GJ City had low NO3 concentrations. GJ City is China’s largest coking coal base and a sophisticated industrial and mining metropolis. Agriculture in the north, central, and southern regions, as well as cleaning coal and electricity, have been vigorously developed. The rate of collection and treatment of industrial wastewater and rural home sewage, distinct outcomes, have been increased. This sequence of environmental safeguards might have resulted in a decrease in NO3 concentrations in the groundwater.

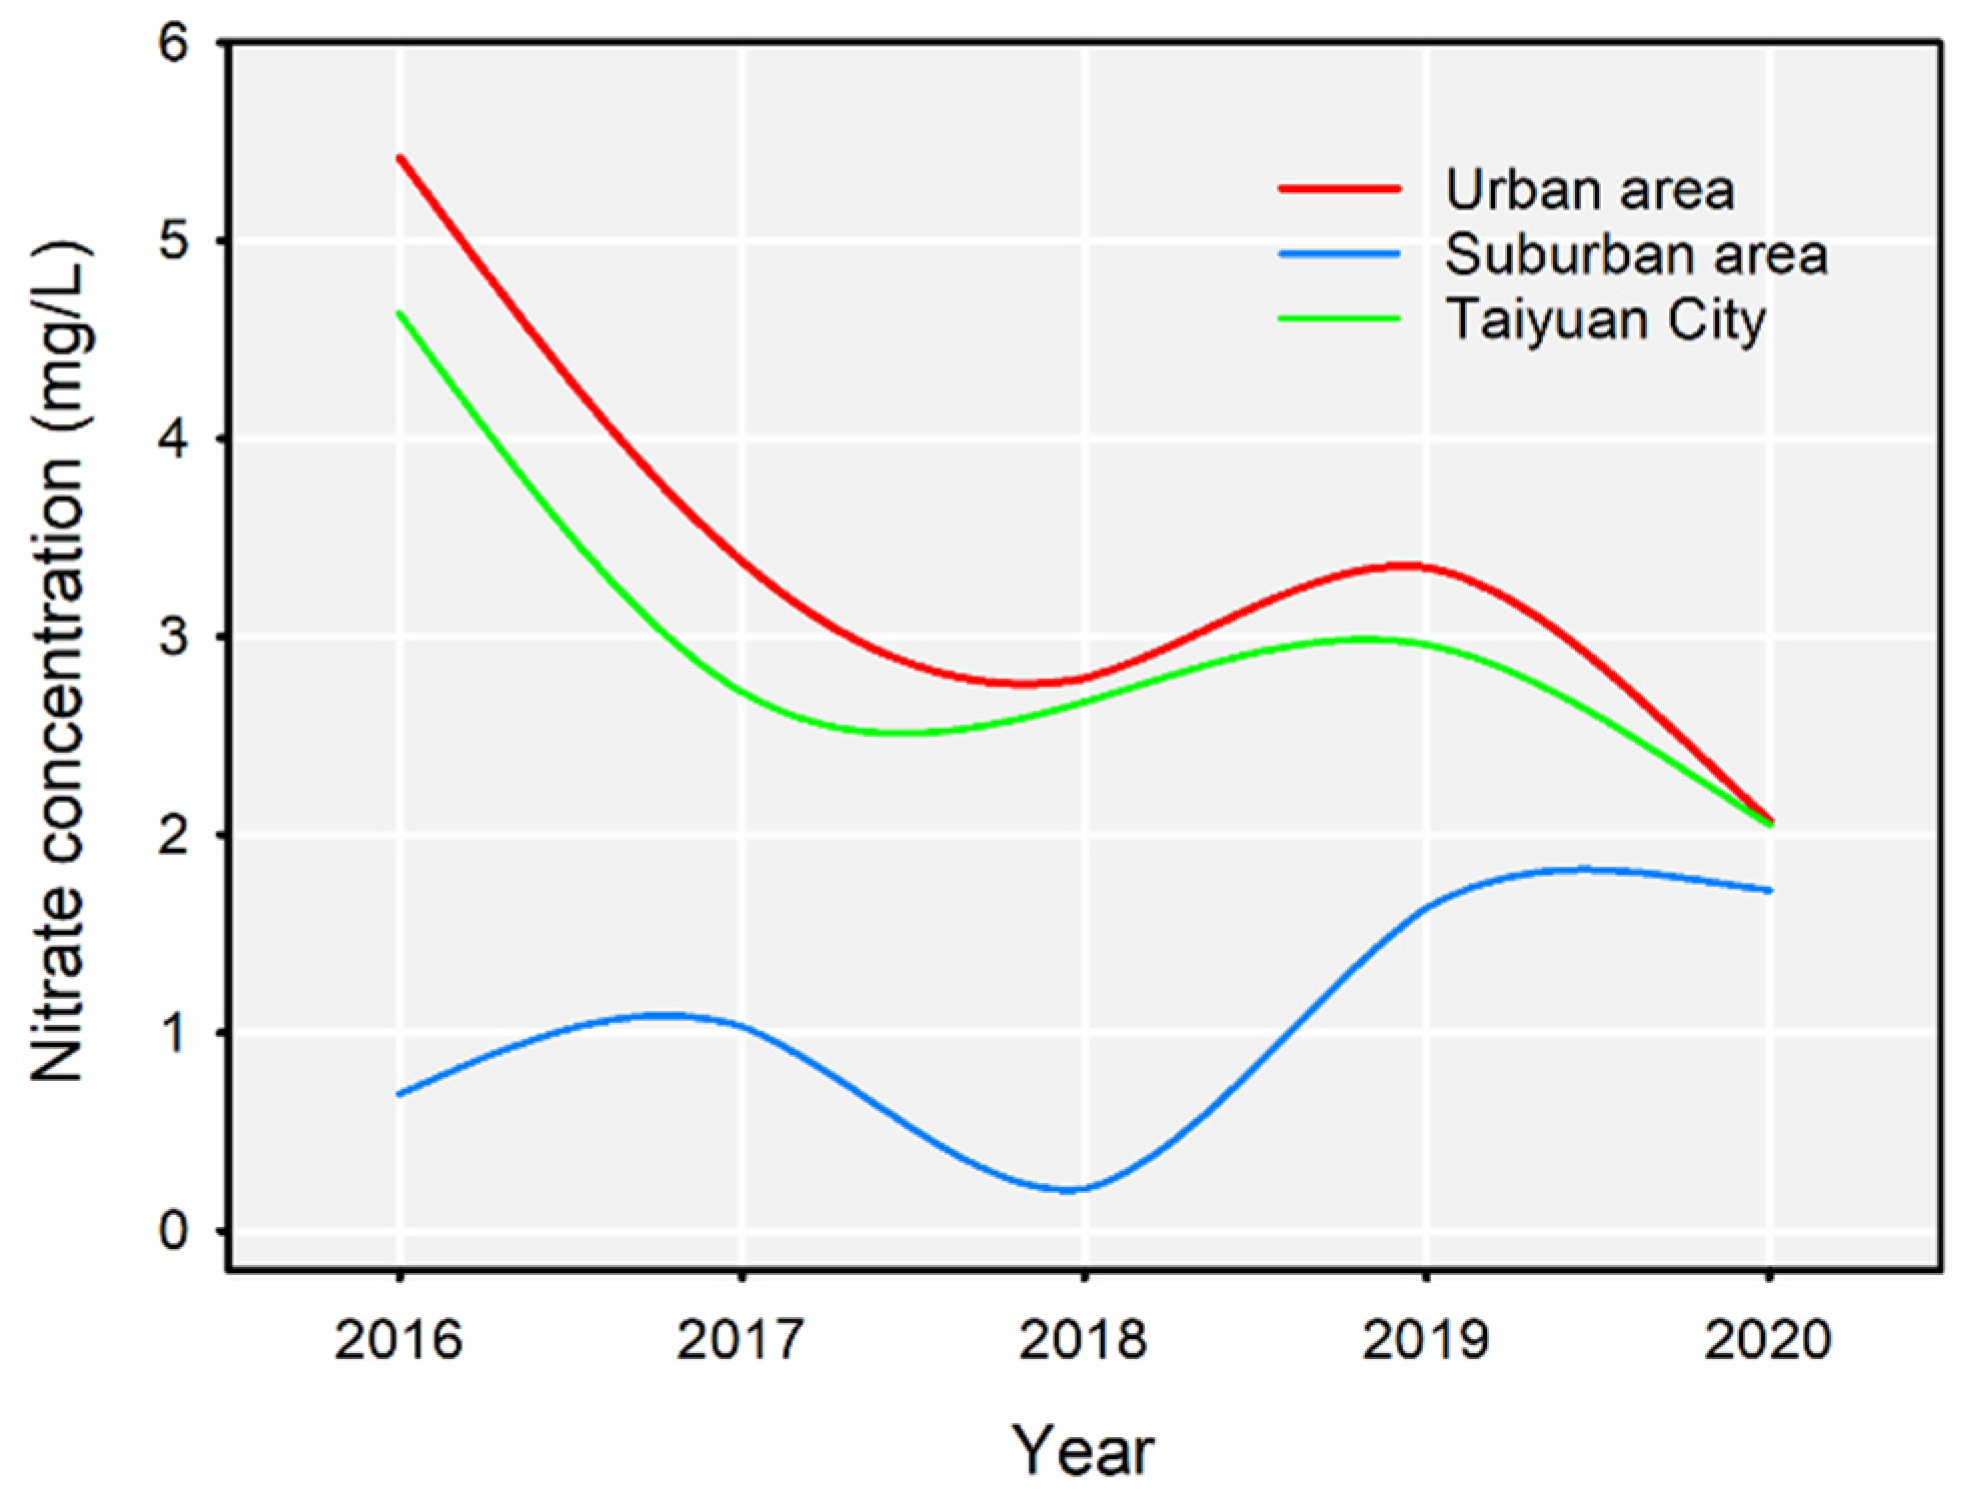
3.1.2. Temporal Variation
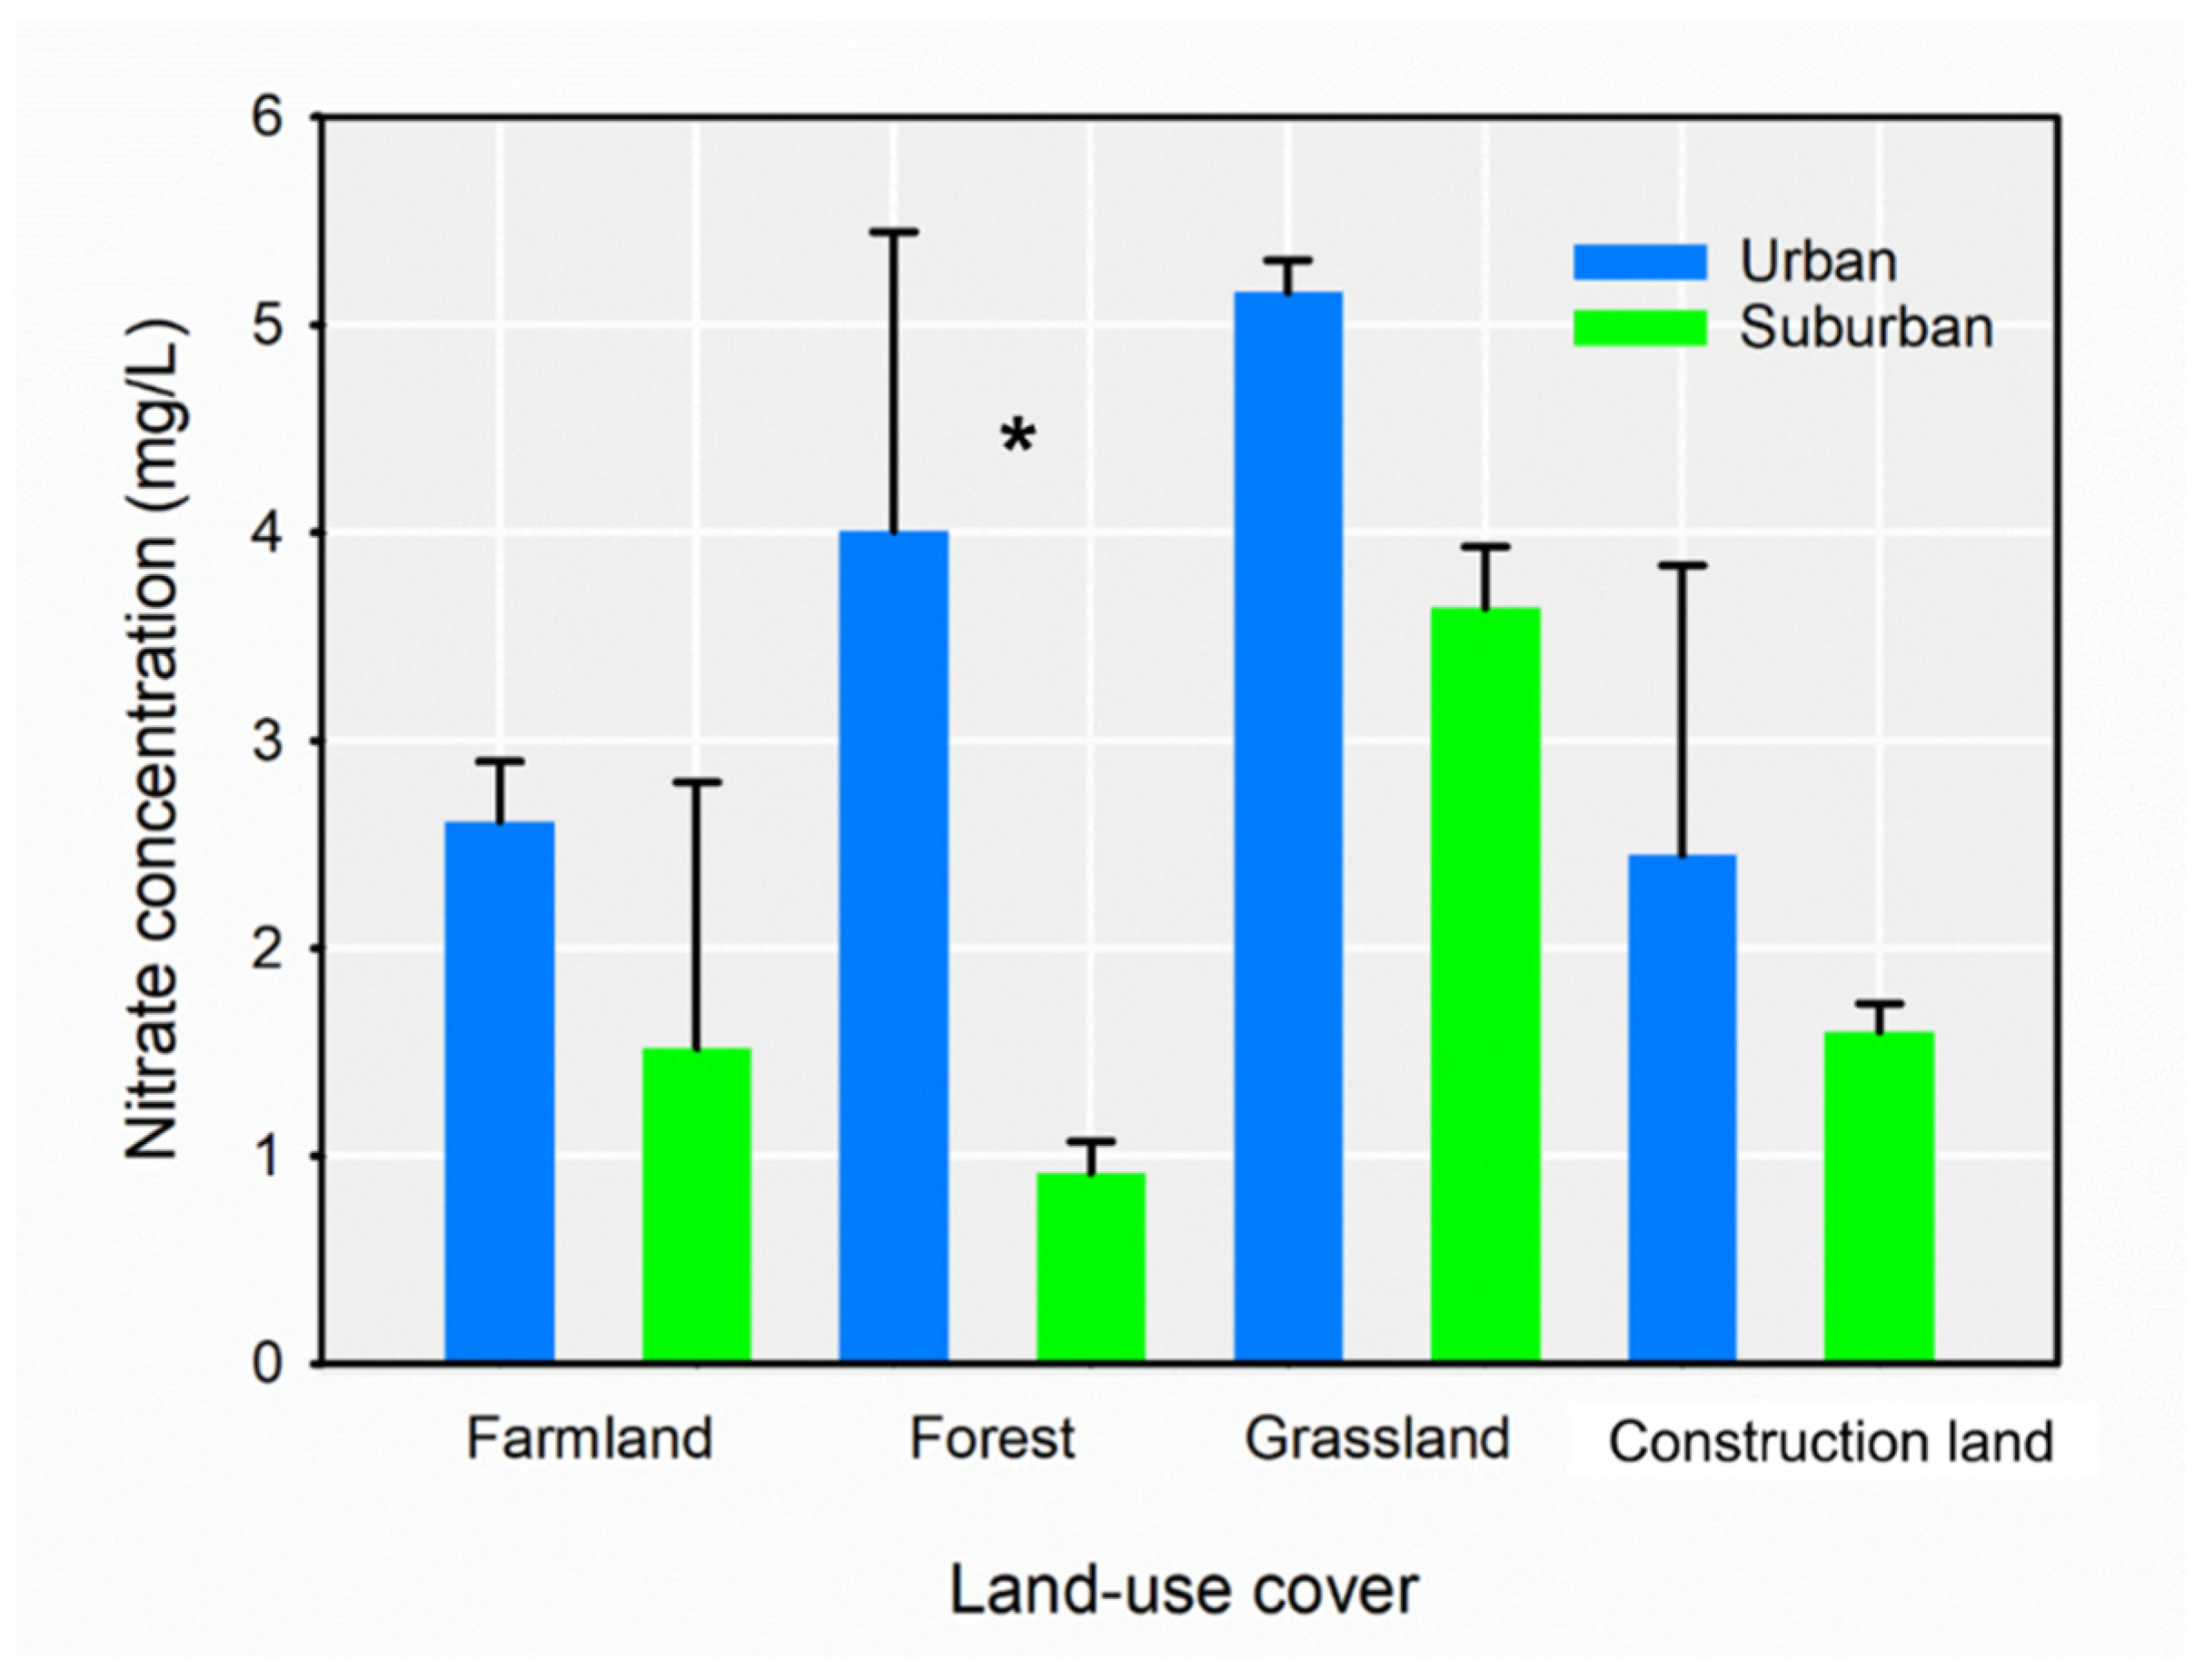
The average concentrations of the whole city of Taiyuan and the urban areas were the highest in 2016 (3.71 mg L−1 and 5.15 mg L−1) and the lowest in 2020 (2.05 mg L−1 and 2.04 mg L−1). NO3 concentration’s temporal variation trend is shown in Figure 3. Average NO3-N concentrations in Taiyuan and urban areas decreased over time, but both showed a brief upward trend in 2019. Suburbs showed a significantly downward trend from 2016 to 2018, and a significantly upward trend from 2018 to 2020. The average NO3 concentration in the suburban was the lowest (0.21 mg L−1) in 2018 and the highest (2.09 mg L−1) appeared in 2020.
Taiyuan has taken a series of measures to optimize industrial structure, implement economic transformation and development, and actively develop new energy. This series of environmentally friendly measures from 2016 to 2020 led to a downward trend of NO3 concentration in the overall groundwater of Taiyuan over time. Annual variation is shown in Figure 3, and the groundwater nitrate pollution situation has been improved year by year.
In the Sonnen Plain, groundwater nitrate-nitrogen concentrations exhibited significant temporal differences and there was an increasing trend with time from 1995 to 2015 [41]. The temporal variation trend was different from that in Taiyuan. The difference of influencing factors led to the difference in the temporal variation.

3.2. Response of NO3 Concentration to Land-Use Types

As shown in Figure 4, the difference in GNN between urban and suburban regions was significant, and GNN in urban regions was 1.85 times that in the suburban regions. On the other hand, more than half of the sample sites in the four land-use types in urban and suburban areas showed GNN concentrations were lower than 3.0 mg L−1. The forest showed very low levels of GNN and was significantly different from the other land-use types (p < 0.001); construction land was not considered in this issue due to its impermeability.
According to research, the primary sources of nitrate in groundwater beneath forest and grassland were soil nitrogen and animal manure [53]; the NO3 concentration in agriculture and building land was typically greater, owing to the strong impact of human activity, whereas the NO3 concentration in grassland and woodland was lower. In this study, forests showed similar results to the previous study; it could be deduced that more forests were necessary to alleviate groundwater nitrate pollution in the severe water shortage areas. But the grassland showed significantly different results from the previous study; thus, the highest GNN in the grassland of Taiyuan should be paid attention to and needs further study.

3.3. Health Risk Assessment

3.3.1. HQ among Different Age Groups

HQ values of different age groups in the urban area, suburban area and entirety of Taiyuan City were similar: infant > child > adult (compared with average HQ) (Table 2). The results indicated that NO3 in groundwater had certain health risks for infants and children, and health risks for adults were acceptable.
The non-carcinogenic risk of infants was about 1.11 times that of children and 2 times that of adults, while the non-carcinogenic risk of children was 1.8 times that of adults. The non-carcinogenic risks showed significant differences between infants and children (p < 0.001) and between children and adults (p < 0.001), and there were also significant differences between infants and children (p < 0.05) (Figure S1).
Children had a greater non-carcinogenic risk than adults, most likely because they were more susceptible to environmental pollution than adults [54]. Infants had lesser B5 reductase activity in IR cells than adults, putting them at greater risk [55]. Furthermore, the disparities between age groups in urban and suburban locations were investigated. The findings revealed considerable disparities in non-carcinogenic hazards across age groups. For example, 0.6% of infants and children had HQ > 1, suggesting that they were at moderate risk of NO3N exposure.

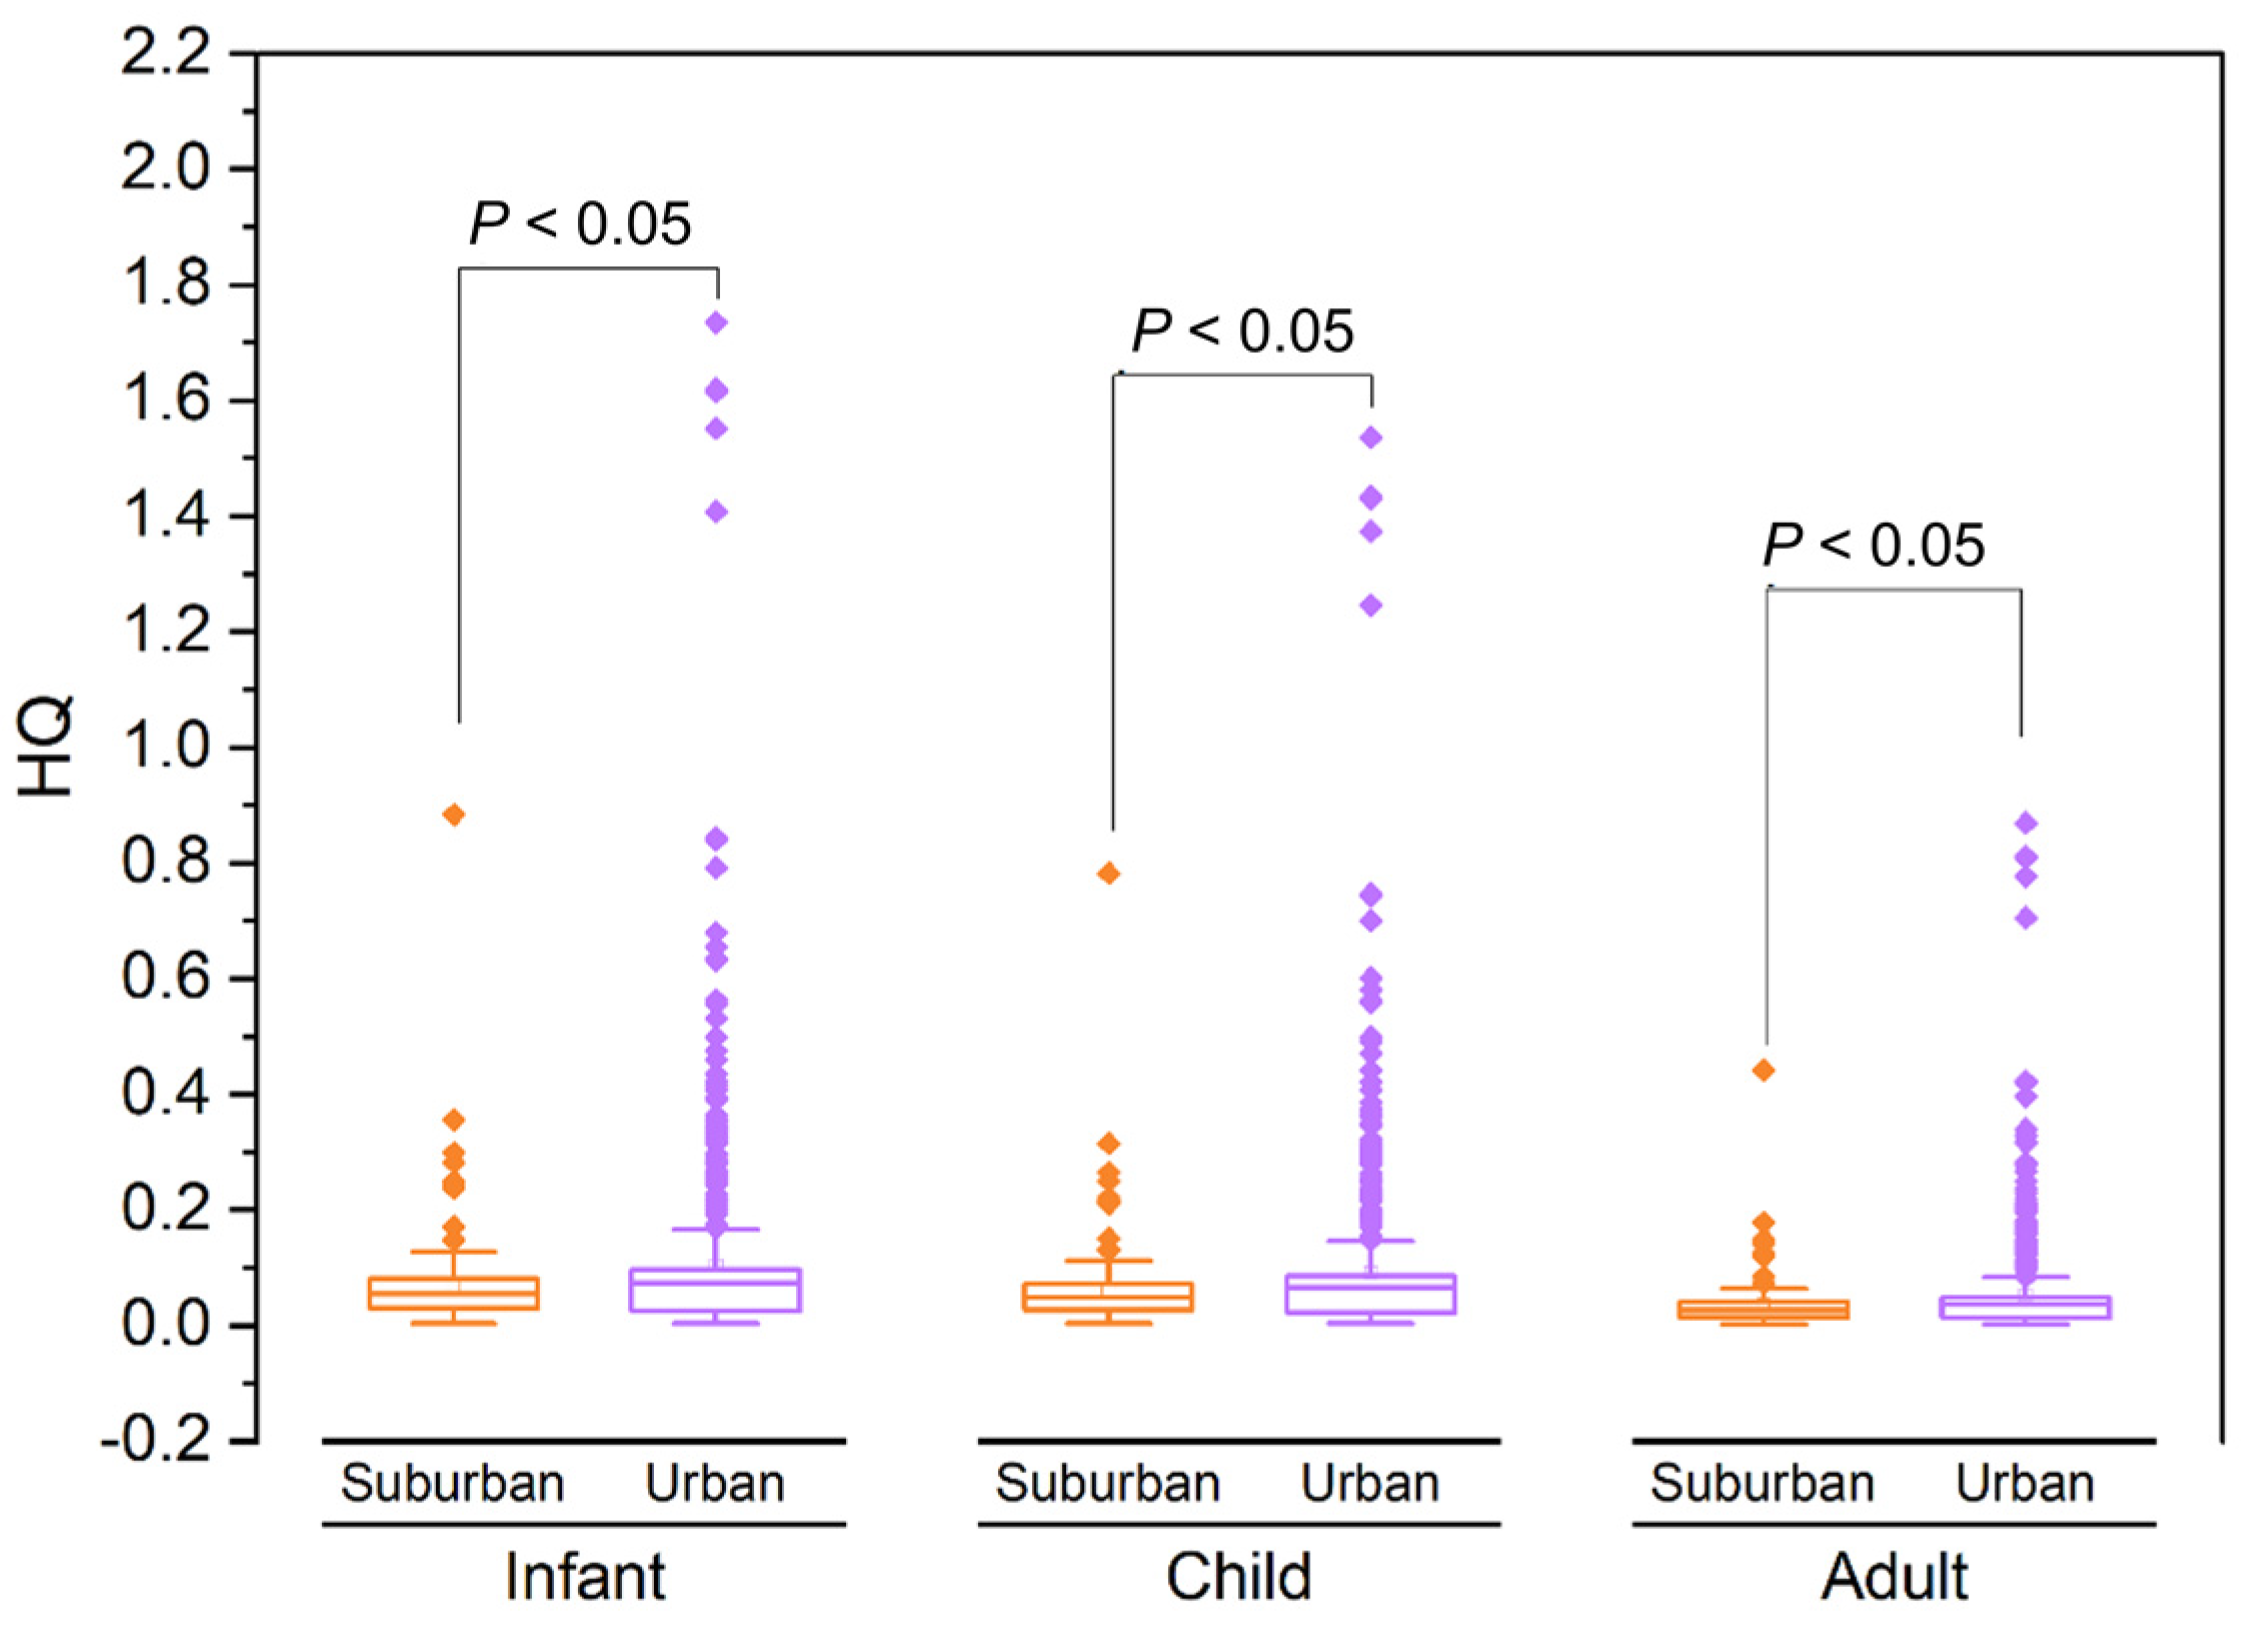
3.3.2. HQ in Urban and Suburban Areas

Significant differences in HQ between urban and suburban areas can be observed in Figure 5 (p < 0.05). HQ of infants, children, and adults in urban areas (the means were 0.1, 0.09, and 0.05, respectively) were significantly higher than in suburban areas (the means were 0.07, 0.06, and 0.03, respectively). In urban areas, the non-carcinogenic risks of infants, children, and adults were 1.43, 1.5, and 1.67 times higher than in suburban areas, respectively. All populations in suburban areas had HQ < 1, indicating that the risk of NO3 exposure among all populations in the suburban areas was at an acceptable degree.
The quality of groundwater is affected by natural and anthropogenic factors. The natural factors that affect water quality in rural and urban areas were similar. Significant differences in HQ between urban and suburban areas originated from urbanization. Urbanization was a pervasive form of land−cover/land−use alteration that was rapidly growing [56]. This involved the conversion of croplands, forests, grasslands, pastures, wetlands, and other cover types to residential, transportation, commercial, and industrial uses, thereby increasing the areas of impervious surfaces [57]. Though impervious surfaces could prevent the infiltration of nitrate from the surface into the groundwater, industrialization, sewage discharge, and other domestic activities were the major factors that influenced the groundwater quality and made the HQ higher.

3.3.3. The Tendency of Non-Carcinogenic Risk over Time

The HQ of infants, children, and adults decreased significantly over time (Figure S2) (p < 0.01). We used inverse distance–weight interpolation analysis for the HQ of infants, children, and adults each year to draw the spatial distribution map of non-carcinogenic risk. Figure S3 shows the relationship between the risk category spaces and the important areas. Non-carcinogenic risks of NO3-N exposure through drinking water to infants and children from 2016 to 2020 were less than one in most areas (Figure S3). HQ > 1 appeared in some areas of JCP District in 2016, YQ County in 2018, YQ County in 2019, and JY District in 2020. The non-carcinogenic risk of NO3 in groundwater exposure through drinking water to adults in Taiyuan was acceptable from 2016 to 2020 (Figure S3). Based on the temporal and spatial analysis, we need to focus on the health risks to infants and children in JCP District, JY District, and YQ County of Taiyuan City, and then implement environmental planning management and drinking water improvement policies in these areas.

4. Conclusions

Groundwater nitrate-nitrogen (GNN) has been one of the most widespread pollutants; the spatio-temporal distribution pattern and its related health risks were paid attention by the public. In this study, GNN in Taiyuan, a severe water scarcity region in northern China, was tracked from 2016 to 2020, and the potential human health risks to infants, children, and adults were assessed. GNN in the Taiyuan region varied from 0.1 to 43.3 mg L−1; the highest mean concentration was observed in 2016 and the lowest value appeared in 2020. The spatial heterogenicity of GNN distribution was observed, and different nitrate concentrations were measured in different urban and suburban regions. GNN concentrations in urban regions (2.60 mg L−1) were substantially greater than in suburban regions (1.75 mg L−1). GNN concentrations in Xiaodian District and Qingxu County were lower than in other areas. The difference in GNN between urban and suburban areas was significant, and GNN in urban areas was 1.85 times that in suburban areas. Forests showed a very low level of GNN and were significantly different from the other land-use types (p < 0.001). More forests were recommended to alleviate groundwater nitrate pollution in severe water shortage areas. HQ values of different age groups in urban and suburban areas and the whole of Taiyuan City were similar: infant > child > adult (compared to average HQ). The results indicated that NO3 in groundwater had certain health risks for infants and children. In urban areas, the non-carcinogenic risks to infants, children, and adults were 1.43, 1.5, and 1.67 times higher than in suburban areas, respectively. The HQ of infants, children, and adults decreased significantly over time (p < 0.01).
The above findings would be helpful for us to gain insight into the status of GNN distribution and its related health risks in the Taiyuan region, which would be useful for experts and policy-makers to implement appropriate actions to protect human health for the local people. Future research needs to focus on identifying at-risk populations and the disease risks of exposure to groundwater pollutants, as well as quantifying the impact of human activities on groundwater pollutants.

Supplementary Materials

The following supporting information can be downloaded at: https://www.mdpi.com/article/10.3390/su151914284/s1, Table S1: Nitrate concentrations and frequency of nitrate levels in groundwater in different regions of Taiyuan City (mg L–1); Figure S1: Box plot of HQ for infants, Children and Adults in (a) Taiyuan City, (b) urban and suburban; Figure S2: Linear regression of HQ with time in infants (a), children (b) and adults (c); Figure 3: Spatial distribution of HQ for infants, children and adults in 2016 (a–c), 2017 (d–f), 2018 (g–i), 2019 (j–l), and 2020 (m–o).

Author Contributions

Conceptualization, M.Z.; Methodology, W.P.; Investigation, Y.L., X.J. and X.X.; Data curation, Y.L.; Writing–original draft, W.M.; Writing–review & editing, Q.H. and Y.B.; Visualization, M.Z.; Supervision, X.X. and C.X. All authors have read and agreed to the published version of the manuscript.

Funding

This research was funded by the National Natural Science Foundation of China (No. 42207528 by Yuan Li; No.31971477 by Yonghong Bi; No.42077201 by Qiusheng He; No.22206146 by Xin Xing).

Institutional Review Board Statement

Not applicable.

Informed Consent Statement

Not applicable.

Data Availability Statement

The datasets used or analyzed during the current study are available from the corresponding author on reasonable request.

Acknowledgments

Special thanks to three anonymous reviewers whose comments greatly enhanced the paper.

Conflicts of Interest

The authors declare that they have no known competing financial interest or any other conflict of interest.

References

  1. Dong, W.W.; Zhang, Y.; Quan, X. Health risk assessment of heavy metals and pesticides: A case study in the main drinking water source in Dalian, China. Chemosphere 2020, 242, 125113. [Google Scholar] [CrossRef] [PubMed]
  2. Elisante, E.; Muzuka, A.N.N. Assessment of sources and transformation of nitrate-nitrogen in groundwater on the slopes of Mount Meru, Tanzania. Environ. Earth Sci. 2016, 75, 277. [Google Scholar] [CrossRef]
  3. Perez-Fernandez, M.A.; Calvo-Magro, E.; Valentine, A. Benefits of the Symbiotic Association of Shrubby Legumes for the Rehabilitation of Degraded Soils under Mediterranean Climatic Conditions. Land Degrad. Dev. 2016, 27, 395–405. [Google Scholar] [CrossRef]
  4. Nakagawa, K.; Amano, H.; Takao, Y.; Hosono, T.; Berndtsson, R. On the use of coprostanol to identify source of nitrate-nitrogen pollution in groundwater. J. Hydrol. 2017, 550, 663–668. [Google Scholar] [CrossRef]
  5. Green, C.T.; Liao, L.X.; Nolan, B.T.; Juckem, P.F.; Shope, C.L.; Tesoriero, A.J.; Jurgens, B.C. Regional Variability of Nitrate-nitrogen Fluxes in the Unsaturated Zone and Groundwater, Wisconsin, USA. Water Resour. Res. 2018, 54, 301–322. [Google Scholar] [CrossRef]
  6. Ti, C.P.; Xia, L.L.; Chang, S.X.; Yan, X.Y. Potential for mitigating global agricultural ammonia emission: A meta-analysis. Environ. Pollut. 2019, 245, 141–148. [Google Scholar] [CrossRef]
  7. Badeenezhad, A.; Radfard, M.; Passalari, H.; Parseh, I.; Abbasi, F.; Rostami, S. Factors affecting the nitrate-nitrogen concentration and its health risk assessment in drinking groundwater by application of Monte Carlo simulation and geographic information system. Hum. Ecol. Risk Assess. 2019, 27, 1458–1471. [Google Scholar] [CrossRef]
  8. Pirsaheb, M.; Khosravi, T.; Fazlzadeh, M.; Sharafie, K. Effects of loading rate, resin height, and bed volume on nitrate-nitrogen removal from drinking water by non-selective strong anion exchange resin (A400E). Desalination Water Treat. 2017, 89, 127–135. [Google Scholar] [CrossRef]
  9. Qasemi, M.; Farhang, M.; Biglari, H.; Afsharnia, M.; Ojrati, A.; Khani, F.; Samiee, M.; Zarei, A. Health risk assessments due to nitrate-nitrogen levels in drinking water in villages of Azadshahr, northeastern Iran. Environ. Earth Sci. 2018, 77, 782. [Google Scholar] [CrossRef]
  10. Feng, W.W.; Wang, C.; Lei, X.H.; Wang, H.; Zhang, X.L. Distribution of Nitrate-nitrogen Content in Groudwater and Evaluation of Potential Health Risks: A Case Study of Rural Area in Northern China. Int. J. Environ. Res. Public Health 2020, 17, 9390. [Google Scholar] [CrossRef]
  11. Kumar, P.; Dasgupta, R.; Johnson, B.A.; Saraswat, C.; Basu, M.; Kefi, M.; Mishra, B.K. Effect of Land Use Change on Water Quality in an Ephemeral Coastal Plain: Khambhat City, Gujarat, India. Water 2019, 11, 724. [Google Scholar] [CrossRef]
  12. Li, P.Y.; Wu, J.H.; Qian, H. Groundwater quality assessment based on rough sets attribute reduction and TOPSIS method in a semi-arid area, China. Environ. Monit. Assess. 2012, 184, 4841–4854. [Google Scholar] [CrossRef] [PubMed]
  13. Mostafizur, R.M.; Bodrud-Doza, M.; Iftakharul, M.M.; Binte, K.F.H.; Sikder, M.T.; Mashura, S.; Rubaiya, A.; Khabir, U.M. Human Health Risk Assessment of Nitrate-nitrogen and Trace Metals Via Groundwater in Central Bangladesh. Pollution 2020, 6, 253–266. [Google Scholar] [CrossRef]
  14. Sadler, R.; Maetam, B.; Edokpolo, B.; Connell, D.; Yu, J.; Stewart, D.; Park, M.J.; Gray, D.; Laksono, B. Health risk assessment for exposure to nitrate-nitrogen in drinking water from village wells in Semarang, Indonesia. Environ. Pollut. 2016, 216, 738–745. [Google Scholar] [CrossRef] [PubMed]
  15. Wu, J.H.; Sun, Z.C. Evaluation of Shallow Groundwater Contamination and Associated Human Health Risk in an Alluvial Plain Impacted by Agricultural and Industrial Activities, Midwest China. Expo. Health 2016, 8, 311–329. [Google Scholar] [CrossRef]
  16. Badeenezhad, A.; Radfard, M.; Radfard, M.; Abbasi, F.; Jurado, A.; Bozorginia, M.; Jalili, M.; Soleimani, H. Effect of land use changes on non-carcinogenic health risks due to nitrate-nitrogen exposure to drinking groundwater. Environ. Sci. Pollut. Res. 2021, 28, 41937–41947. [Google Scholar] [CrossRef]
  17. Sakizadeh, M.; Zhang, C.S. Health risk assessment of nitrate-nitrogen using a probalilistic approach in groundwater resources of western part of Iran. Environ. Earth Sci. 2020, 79, 43. [Google Scholar] [CrossRef]
  18. Schullehner, J.; Hansen, B.; Thygesen, M.; Pedersen, C.B.; Sigsgaard, T. Nitrate-nitrogen in drinking water and colorectal cancer risk: A nationwide population-based cohort study. Int. J. Cancer 2018, 143, 73–79. [Google Scholar] [CrossRef]
  19. Wu, J.L.; Yin, Y.N.; Wang, J.L. Hydrogen-based membrane biofilm reactors for nitrate-nitrogen removal from water and wastewater. Int. J. Hydrog. Energy 2018, 43, 1–15. [Google Scholar] [CrossRef]
  20. Gao, S.; Li, C.S.; Jia, C.; Zhang, H.L.; Guan, Q.; Wu, X.C.; Wang, J.X.; Lv, M.H. Health risk assessment of groundwater nitrate-nitrogen contamination: A case study of a typical karst hydrogeological unit in East China. Environ. Sci. Pollut. Res. 2020, 27, 9274–9287. [Google Scholar] [CrossRef]
  21. Radfard, M.; Gholizadeh, A.; Azhdarpoor, A.; Badeenezhad, A.; Mohammadi, A.A.; Yousefi, M. Health risk assessment to fluoride and nitrate-nitrogen in drinking water of rural residents living in the Bardaskan city, arid region, southeastern Iran. Desalination Water Treat. 2019, 145, 249–256. [Google Scholar] [CrossRef]
  22. Zhai, Y.Z.; Zhao, X.B.; Teng, Y.G.; Li, X.; Zhang, J.J.; Wu, J.; Zuo, R. Groundwater nitrate pollution and human health risk assessment by using HHRA model in an agricultural area, NE China. Ecotoxicol. Environ. Saf. 2017, 137, 130–142. [Google Scholar] [CrossRef] [PubMed]
  23. Fallahazadeh, R.A.; Almodarest, S.A.; Dashti, M.M.; Fattahi, A.; Sadeghnia, M.; Eslami, H.; Khosravi, R.; Minaee, R.P.; Taghavi, M. Zoning of Nitrite and Nitrate-nitrogen Concentration in Groundwater Using Geografic Information System (GIS), Case Study: Drinking Water Wells in Yazd City. J. Geosci. Environ. Prot. 2016, 4, 91–96. [Google Scholar] [CrossRef]
  24. Singh, N.; Singh, V.; Rai, S.N.; Vamanu, E.; Singh, M.P. Metagenomic analysis of garden soil-derived microbial consortia and unveiling their metabolic potential in mitigating toxic hexavalent chromium. Life 2022, 12, 2094. [Google Scholar] [CrossRef]
  25. Singh, V.; Verma, M. Microbial removal of Cr (VI) by a new bacterial strain isolated from the site contaminated with coal mine effluents. J. Environ. Chem. Eng. 2021, 9, 106279. [Google Scholar] [CrossRef]
  26. US EPA. National Primary Drinking Water Regulations. 2009. Available online: https://www.epa.gov/ground-water-and-drinking-water/national-primary-drinking-water-regulation-table (accessed on 8 September 2023).
  27. Mallya, C.L.; Rwiza, M.J. Influence of land use change on nitrate-nitrogen sources and pollutant enrichment in surface and groundwater of a growing urban area in Tanzania. Environ. Earth Sci. 2021, 80, 111. [Google Scholar] [CrossRef]
  28. Adimalla, N. Spatial distribution exposure, and potential health risk assessment from nitrate-nitrogen in drinking water from semi-arid region of South India. Hum. Ecol. Risk Assess. 2020, 26, 310–334. [Google Scholar] [CrossRef]
  29. Aghapour, S.; Bina, B.; Tarrahi, M.J.; Amiri, F.; Ebrahimi, A. Comparative health risk assessment of nitrate-nitrogen in drinking groundwater resources of urban and rural regions (Isfahan, Iran), using GIS. Environ. Monit. Assess. 2021, 193, 794. [Google Scholar] [CrossRef]
  30. Hansen, B.; Thorling, L.; Schullehner, J.; Termansen, M.; Dalgaard, T. Groundwater nitrate response to sustainable nitrogen management. Sci. Rep. 2017, 7, 8566. [Google Scholar] [CrossRef]
  31. Lee, C.-M.; Hamm, S.-Y.; Cheong, J.-Y.; Kim, K.; Yoon, H.; Kim, M.; Kim, J. Contribution of nitrate-nitrogen concentration in groundwater to stream water in an agricultural head watershed. Environ. Res. 2020, 184, 109313. [Google Scholar] [CrossRef]
  32. Abascal, E.; Gómez-Coma, L.; Ortiz, I.; Ortiz, A. Global diagnosis of nitrate pollution in groundwater and review of removal technologies. Sci. Total Environ. 2022, 810, 152233. [Google Scholar] [CrossRef] [PubMed]
  33. Gardner, S.G.; Levison, J.; Parker, B.L.; Martin, R.C. Groundwater nitrate in three distinct hydrogeologic and land-use settings in southwestern Ontario, Canada. Hydrogeol. J. 2020, 28, 1891–1908. [Google Scholar] [CrossRef]
  34. Li, Y.; Bi, Y.H.; Mi, W.J.; Xie, S.L.; Ji, L. Land-use change caused by anthropogenic activities increase fluoride and arsenic pollution in groundwater and human health risk. J. Hazard. Mater. 2021, 406, 124337. [Google Scholar] [CrossRef] [PubMed]
  35. Zhang, H.; Xu, Y.; Cheng, S.Q.; Li, Q.L.; Yu, H.R. Application of the dudl-isotope approach and Bayesian isotope mixing model to identify nitrate-nitrogen in groundwater of a multiple land-use area in Chengdu Plain, China. Sci. Total Environ. 2020, 717, 137134. [Google Scholar] [CrossRef] [PubMed]
  36. Zheng, W.; Wang, S. Extreme precipitation accelerates the contribution of nitrate sources from anthropogenetic activities to groundwater in a typical headwater area of the North China Plain. J. Hydrol. 2021, 603, 127110. [Google Scholar] [CrossRef]
  37. Salman, S.A.; Shahid, S.; Mohsenipour, M.; Asgari, H. Impact of landuse on groundwater quality of Bangladesh. Sustain. Water Resour. Manag. 2018, 4, 1031–1036. [Google Scholar] [CrossRef]
  38. Cao, X. Policy and regulatory responses to coalmine closure and coal resources consolidation for sustainability in Shanxi, China. J. Clean. Prod. 2017, 145, 199–208. [Google Scholar] [CrossRef]
  39. Shan, L.J. Feature Analysis of Dynamic Variation of Groundwater in Taiyuan City. Shanxi Coal. 2019, 39, 8–13. [Google Scholar] [CrossRef]
  40. Li, Y.; Ji, L.; Mi, W.J.; Xie, S.L.; Bi, Y.H. Health risks from groundwater arsenic on residents in northern China coal-rich region. Sci. Total Environ. 2021, 773, 145003. [Google Scholar] [CrossRef]
  41. Li, D.; Zhai, Y.; Lei, Y.; Li, J.; Yanguo, T.; Lu, H.; Xia, X.; Yue, W.; Yang, J. Spatiotemporal evolution of groundwater nitrate nitrogen levels and potential human health risks in the Songnen Plain, Northeast China. Ecotoxicol. Environ. Saf. 2021, 208, 111524. [Google Scholar] [CrossRef]
  42. National Health Commission of the People’s Republic of China. Standards for Drinking Water Quality (GB5749-2022). 2023. Available online: https://std.samr.gov.cn/search/std?q=GB5749-2022 (accessed on 8 September 2023).
  43. Jia, Z.M.; Li, S.Y.; Wang, L. Assessment of soil heavy metals for eco-environment and human health in a rapidly urbanization area of the upper. Sci. Rep. 2018, 8, 3256. [Google Scholar] [CrossRef] [PubMed]
  44. Chen, F.J.; Lao, Q.B.; Zhang, S.W.; Bain, P.W.; Jin, G.Z.; Zhu, Q.M.; Chen, C.Q. Nitrate-nitrogen sources and biogeochemical process identified using nitrogen and oxygen isotopes on the eastern coast of Hainan Island. Cont. Shelf Res. 2020, 207, 104209. [Google Scholar] [CrossRef]
  45. Groh, T.A.; Isenhart, T.M.; Schultz, R.C. Long-term nitrate-nitrogen removal in three riparian buffers: 21 years of data from the Bear Creek watershed in central lowa, USA. Sci. Total Environ. 2020, 740, 140114. [Google Scholar] [CrossRef] [PubMed]
  46. Yu, G.M.; Wang, J.; Liu, L.; Li, Y.; Zhang, Y.; Wang, S.S. The analysis of groundwater nitrate-nitrogen pollution and health risk assessment in rural areas of Yantai, China. Bmc Public Health 2020, 20, 437. [Google Scholar] [CrossRef]
  47. Lasagna, M.; De Luca, D.A.; Franchino, E. Nitrate-nitrogen contamination of groundwater in the western Po Plain (Italy): The effects of groundwater and surface water interactions. Environ. Earth Sci. 2016, 75, 240. [Google Scholar] [CrossRef]
  48. US EPA. National Primary Drinking Water Regulations. 2012. Available online: https://nepis.epa.gov/Exe/ZyPDF.cgi/P100N01H.PDF?Dockey=P100N01H.PDF (accessed on 8 September 2023).
  49. US EPA. National Primary Drinking Water Regulations. 2013. Available online: https://www.epa.ie/publications/compliance--enforcement/drinking-water/Drinking-Water-Report-Web.pdf (accessed on 8 September 2023).
  50. Azhdarpoor, A.; Radfard, M.; Pakdel, M.; Abbasnia, A.; Badeenezhad, A.; Mohammadi, A.A.; Yousefi, M. Assessing fluoride and nitrate-nitrogen contaminants in drinking water resources and their health risk assessment in a semiarid region of southwest Iran. Desalination Water Treat. 2019, 149, 43–51. [Google Scholar] [CrossRef]
  51. Fabro, A.Y.R.; Avila, J.G.P.; Alberich, M.V.E.; Sansores, S.A.C.; Camargo-Valero, M.A. Spatial distribution of nitrate-nitrogen health risk associated with groundwater use as drinking water in Merida, Mexico. Appl. Geogr. 2015, 65, 49–57. [Google Scholar] [CrossRef]
  52. Qasemi, M.; Farhang, M.; Morovati, M.; Mahmoudi, M.; Ebrahimi, S.; Abedi, A.; Bagheri, J.; Zarei, A.; Bazeli, J.; Afsharnia, M.; et al. Investigation of potential human health risks from fluoride and nitrate-nitrogen via water consumption in Sabzevar, Iran. Int. J. Environ. Anal. Chem. 2020, 102, 307–318. [Google Scholar] [CrossRef]
  53. Pasten-Zapata, E.; Ledesma-Ruiz, R.; Harter, T.; Ramirez, A.I.; Mahlknecht, J. Assessment of sources and fate of nitrate-nitrogen in shallow groundwater of an agricultural area by using a multi-tracer approach. Sci. Total Environ. 2014, 470, 855–864. [Google Scholar] [CrossRef]
  54. Ezekwe, I.C.; Odu, N.N.; Chima, G.N.; Opigo, A. Assessing regional groundwater quality and its health implications in the Lokpaukwu, Lekwesi and Ishiagu mining areas of southeastern Nigeria using factor analysis. Environ. Earth Sci. 2012, 67, 971–986. [Google Scholar] [CrossRef]
  55. Su, X.S.; Wang, H.; Zhang, Y.L. Health Risk Assessment of Nitrate-nitrogen Contamination in Groundwater: A Case Study of an Agricultural Area in Northeast China. Water Resour. Manag. 2013, 27, 3025–3034. [Google Scholar] [CrossRef]
  56. Paul, M.J.; Meyer, J.L. Streams in the urban landscape. Annu. Rev. Ecol. Syst. 2001, 32, 333–365. [Google Scholar] [CrossRef]
  57. Tsegaye, T.; Sheepard, D.; Islam, K.R.; Johnson, A.; Tadesse, W. Development of chemical index as ameasure of in-stream water quality in response to land-use and land-cover changes. Water Air Soil Pollut. 2006, 174, 161–179. [Google Scholar] [CrossRef]
Figure 1. Sketch map of sampling sites in Taiyuan: (a) location of sampling sites; (b) administrative division of Taiyuan.
Sustainability 15 14284 g001
Figure 2. Nitrate concentration in each district of Taiyuan: (a) boxplots in urban areas; (b) boxplots in suburban areas; (c) spatial distribution map of nitrate concentration in Taiyuan; (d) clustering and outlier analysis of nitrate in groundwater in Taiyuan, using the Local Indicators of Spatial Association method (LISA).
Sustainability 15 14284 g002
Figure 3. Time trend of urban, suburban, and the whole city of Taiyuan.
Sustainability 15 14284 g003
Figure 4. Variation of groundwater nitrate in different land-use covers in urban and suburban of Taiyuan City (* shows significant difference).
Sustainability 15 14284 g004
Figure 5. Health risks to infants, children, and adults in urban and suburban areas.
Sustainability 15 14284 g005
Table 1. Calculation of parameters in non-carcinogenic risk.
Risk Exposure FactorsAge Groups
InfantsChildrenAdultsUnit
IR0.640.852.5L/day
EF365365365Day/year
ED1440years
BW101578kg
AT365146014600Days
Table 2. HQ of different age groups in urban, suburban, and Taiyuan City regions.
Sampling RegionAge GroupsHQSR
MeanMaximumMinimum
UrbanInfant0.101.740.000.17
Children0.091.540.000.15
Adult0.050.870.000.09
SuburbanInfant0.070.880.000.08
Children0.060.780.000.07
Adult0.030.440.000.04
Taiyuan CityInfant0.101.740.000.16
Children0.091.540.000.14
Adult0.050.870.000.08
Disclaimer/Publisher’s Note: The statements, opinions and data contained in all publications are solely those of the individual author(s) and contributor(s) and not of MDPI and/or the editor(s). MDPI and/or the editor(s) disclaim responsibility for any injury to people or property resulting from any ideas, methods, instructions or products referred to in the content.

