Article

The Diffusion Rule of Demand-Oriented Biogas Supply in Distributed Renewable Energy System: An Evolutionary Game-Based Approach

1
School of Energy and Environment, Anhui University of Technology, Maanshan 243002, China
2
Engineering Research Center of Biofilm Water Purification and Utilization Technology of Ministry of Education, Anhui University of Technology, Maanshan 243032, China
3
Institute for Sanitary Engineering, Water Quality and Solid Waste Management, University of Stuttgart, Bandtäle 2, 70569 Stuttgart, Germany
*
Authors to whom correspondence should be addressed.
Sustainability 2023, 15(19), 14297; https://doi.org/10.3390/su151914297
Submission received: 2 August 2023 / Revised: 18 September 2023 / Accepted: 22 September 2023 / Published: 27 September 2023
(This article belongs to the Section Energy Sustainability)

Abstract

:
Biogas can be regarded as a dispatchable renewable source when changing into the demand-oriented operation mode (DO), thus could be used for complementing with solar and wind power in distributed energy system (DES) as a substitute for chemical energy storage. However, if the DO is implemented in regional DES, uncertainties are emerged caused by the complex interest interaction between the seller and the buyer groups formed by the biogas plant and the DES’s dispatching center, thus making the development trend of DO unknown. In this context, this study explored the diffusion law of DO in regional DES by establishing a mathematical model based on an evolutionary game between the two major stakeholders, during which the evolutionarily stable strategy (ESS) was deduced for understanding their strategy selections, and then the dynamic diffusion trend was simulated by the system dynamics via a case example. Finally, the sensitivity analysis of parameters is carried out and the optimal policy instruments are proposed according to the main influencing factors. The study revealed that when the DES can realize monetized returns from socio-environmental benefits, the adoption of DO becomes more feasible. Importantly, the revenue generated from electricity sales, by the dispatching center when they do not utilize biogas, emerged as the most critical parameter influencing the ultimate outcomes. The limitations of this research and modeling are discussed to lay a foundation for further improvement.

1. Introduction

Anaerobic digestion technology can recover biomass energy from organic waste, achieving a win-win situation for both waste treatment and renewable energy production, and is now an important part of the complementary distributed renewable energy system (DES) [1]. Among the renewable energy sources, wind and solar energy, which are currently the most widely used, are intermittent and their energy output is highly dependent on external conditions (e.g., weather, climate or geography) and is highly volatile and stochastic [2]. In contrast, biomass energy has the significant advantage of easily being controlled by humans [3]. As one of the most successful countries in the development and utilization of biogas energy, Germany pioneered the technological concept of the demand-oriented biogas supply mechanism (DO), which was first systematically summarized and proposed by Szarka et al. [4] in 2013, who noted that under this mechanism, biogas plants have the capacity to dynamically adjust biogas production in response to real-time energy demand fluctuations. This adaptability can be achieved through the expansion of biogas storage capacity or by implementing flexible biogas production methods, such as optimizing feed management [4]. Such measures allow for on-demand regulation of biogas supply, addressing shortages or surpluses resulting from intermittent energy supply, thereby facilitating the reliable and stable operation of DES [5]. The development of the biogas industry in most countries is still constrained by high costs with the traditional utilization ways of feed-in tariff, and thus the DO has not received much attention until now. However, the DO mechanism can make full use of biogas power generation to achieve adjusting peak, filling the valley and thus enhancing efficiency and reliability for DES as an alternative to chemical energy storage, as well as being an important component of the smart power grid [5]. Therefore, the implementation of the DO mechanism has important implications for determining a suitable application scenario for biogas energy, which can help achieve the goal of “peak carbon and carbon neutrality”.
In recent years, researchers have investigated the application scenarios of DO mechanism from different perspectives, in which most of them focused on its technical improvements, such as how to use mathematical models for biochemical reaction control [6,7], the selection of suitable feeding substrates [8,9], and process optimization [10,11] to better ensure on-demand biogas supply. Several studies have previously focused on the practical application of biogas; however, these studies often employed simplified demand profiles [12,13]. Remarkably, there exists a dearth of research exploring the utilization of DO mechanisms within DES. One plausible explanation for this gap in the literature pertains to the intricacies inherent in operating a distributed renewable energy system, particularly when integrating DO, as it entails a heightened complexity stemming from the interaction among multiple stakeholders [14,15].
In the context of DES, achieving a harmonious energy balance between energy supply units and energy consumers, along with effectively leveraging the complementarity and coordination among various renewable energy sources, assumes paramount importance in facilitating this operational process [16]. If the DO is not implemented, the biogas plant do not have the ability for peak-regulating and will only be able to supply part of the regional load demand at a constant low power level [17]. Under this strategy, the operating costs of biogas plants are obviously lower, but the potential benefits are also lower. When DO is implemented, the biogas plant will adjust feeding plans and operating parameters in real time according to the load demand of the supply area, and this would require an increase in the overall supply capacity of the biogas, resulting in higher feeding substrates collection and plant’s operating costs, but also a “flexibility premium” can be obtained due to the participation in the coordination and balancing for the region’s distributed energy sources [18]. The microgrid’s dispatching center possesses the flexibility to either engage in wholesale electricity transactions with the biogas plant, thereby bolstering the adoption of renewable energy sources within the region and capitalizing on the associated industrial advancements [19]. Alternatively, they can persist with conventional methods for peak regulation, such as non-biogas solutions, which typically entail lower costs in areas where renewable energy sources are less prevalent and carry fewer inherent risks [20]. Nonetheless, it is crucial to emphasize that this strategy may deviate from the predominant trend that promotes the widespread adoption of renewable energy sources. The implementation of DO holds the potential for the biogas plant to anticipate increased electricity purchases by the dispatching center, leading to augmented revenue generation [21]. Nevertheless, it is essential to acknowledge the conundrum at hand. The escalated costs associated with this approach may remain unsustainable unless the electricity prices reach a sufficiently high threshold [22]. Paradoxically, a high electricity price can impose substantial financial burdens on the dispatching center, subsequently diminishing their inclination to embrace the DO system [23]. It is imperative to recognize that as the demand for biogas from users reaches a certain capacity threshold, it can engender economies of scale and ensure the technological maturity of demand response [24]. This development ultimately fosters greater mutual reliance and interdependence between both the biogas plant and the dispatching center [25]. In summary, as two pivotal stakeholders in the implementation of DO, they will make strategic choices driven by their own interests, thus forming a strategic game between the buyer and the seller.
On this basis, our study adopted evolutionary game theory to reveal the evolutionary law of the DO’s development process in a regional DES. Within this framework, the evolutionarily stable strategy (ESS) was derived to elucidate their strategic choices. Subsequently, the dynamic diffusion trajectory was simulated using system dynamics. Lastly, a sensitivity analysis of key parameters was conducted, leading to the formulation of optimal policy instruments guided by the primary influencing factors.

2. Research Methods

2.1. Establishment of the Evolutionary Game Model

The conceptual framework of the evolutionary game is established on the foundation of the aforementioned interactions of interests, and its system boundaries are illustrated in Figure 1. As one of the distributed energy supply units, the biogas plant assumes the responsibility for several tasks, including the collection and transportation of organic waste from the surrounding area, the pretreatment of raw materials, the digestion process, biogas purification, and electricity generation, among other functions. In this study, the specific approach employed to fulfill dynamic energy demands of users through DO is configured as biogas storage control. The electricity generated will be transmitted and distributed through power lines to the microgrid, ultimately serving as the energy source for local users or residents within the area [26]. As the primary buyer of biogas energy, the operator and manager of the distributed micro-grid serves as the central hub for energy distribution, who is tasked with ordering and distributing biogas and other renewable energy sources based on sound forecasts of energy consumption within its operational jurisdiction. Additionally, it facilitates the synergistic utilization of wind, photovoltaic (PV), and biogas resources [27].
Upon the introduction of the DO, the biogas plant faces a binary choice: either to implement DO or abstain from its implementation. Similarly, the dispatching center possesses the flexibility to choose between utilizing biogas and opting for an alternative energy source. The behavior of other relevant stakeholders, such as the thermal power plant, which competes with the biogas plant, is considered as exogenous variables and lies outside the defined boundary of the study. As the main promoter of distributed renewable energy, the government can carry out a series of financial incentives to support the development of DO mechanism, or impose certain restrictions on traditional non-renewable energy sources [28]. Assuming that there is finite rationality in both groups of players, this paper used evolutionary game theory based on biological evolution to analyze the biogas plant’s and dispatching center’s decision choices, which can replace the mixed strategy in game theory with the percentage of individuals choosing different pure strategies in the two types of groups as a whole.

2.1.1. Model Hypothesis

In order to highlighting our research focus, this paper makes some necessary simplifications and assumptions for developing the evolutionary game model:
  • The two players choose their strategies by maximizing their own interests, while being influenced by government incentives, etc. The influence of other stakeholders is set as exogenous variables in the game.
  • Behavioral strategy: The dispatching center may or may not choose the electricity supplied by the biogas plant. When using the electricity from biogas, the biogas plant is responsible for supplying biogas on demand to meet the electricity load curve of the service area; if the biogas plant is not able to supply biogas on demand, the dispatching center has to temporary deployment of other energy sources to cover the demand gap. For biogas plants, they have also the two choices, on-demand supply or not; if the biogas plant implements the DO while the dispatching center does not use the biogas, the produced biogas can only be used for satisfying the plant’s internal varying power demand at a low-capacity level. The players may have different response options and strategies selection in each scenario, but they are not taken into consideration in this study.
  • Probability of players’ behavioral strategy: Assuming that the probability of the dispatching center using the biogas plant’s electricity is X (the probability of not using is 1 − X); the probability of the biogas plant implementing DO mechanism is Y (the probability of biogas plant not implementing is 1 − Y);
  • Parameter assumptions and basic explanations: C1: cost of collection and transportation of substrates when the biogas plant does not implement DO; C2: cost of operation and maintenance when the biogas plant does not implement DO; h1: saved fees of purchased electricity when the biogas plant dies not implement DO; Q1: government subsidy for biogas plants when the biogas plant does not implement DO; u1: revenue from electricity sales when the biogas plant does not implement DO; M1: cost of collection and transportation of substrates when the biogas plant implements DO; M2: cost of operation and maintenance when the biogas plant implements DO; h2: saved fees of purchased electricity when the biogas plant implements DO; Q2: government subsidy for biogas plants when the biogas plant implements DO; a: additional revenue from on-demand electricity sales when the biogas plant implements DO; b1: cost for purchased electricity when the biogas plant implements DO and the dispatching center use biogas; b2: cost of using emergency back-up energy; m1: revenue from electricity sales of the dispatching center when they use biogas and the biogas plant implements DO; r1: social-environmental benefits of the region brought by the implementation of DO; b3: cost for purchased electricity when the dispatching center use biogas while the biogas plant does not implement DO; m2: revenue from electricity sales of the dispatching center when they use biogas but the biogas plant does not implement DO; r2: social-environmental benefits of the region when the dispatching center use biogas but the biogas plant does not implement DO; b4: cost for purchased electricity when the dispatching center does not use biogas; m3: revenue from electricity sales of the dispatching center when they do not use biogas.

2.1.2. The Payoff Matrix and Replicator Dynamic Equations of the Evolutionary Game

Based on the above assumptions, the benefits of the dispatching center and biogas plant can be expressed as a two-sided evolutionary game payoff matrix, as shown in Table 1.
The expected payoff functions for the dispatching center and the biogas plant is obtained from the payoff matrix, in which the expected payoff of the biogas plant when they implement DO is provided in Equation (1):
U 11 = x u 1 + a + Q 2 + h 2 M 1 M 2 + 1 x Q 2 + h 2 M 1 M 2 = x u 1 + a + Q 2 + h 2 M 1 M 2
The expected payoff of biogas plant when not implementing DO is shown in Equation (2):
U 12 = x u 1 + Q 1 + h 1 C 1 C 2 + 1 x Q 1 + h 1 C 1 C 2 = x u 1 + Q 1 + h 1 C 1 C 2
The average expected payoff of the biogas plant is shown in Equation (3):
U 1 ¯ = y U 11 + 1 y U 12 = y x u 1 + a + Q 2 + h 2 M 1 M 2 + 1 y x u 1 + Q 1 + h 1 C 1 C 2
The expected payoff of the dispatching center when using biogas is shown in Equation (4):
U 21 = y m 1 + r 1 b 1 b 2 + 1 y m 2 + r 2 b 3 b 2 = y m 1 + r 1 r 2 b 1 + b 3 m 2 + m 2 + r 2 b 2 b 3
The expected payoff of the dispatching center when they do not use biogas is shown in Equation (5):
U 22 = y m 3 b 4 + 1 y m 3 b 4 = m 3 b 4
The average expected payoff of the dispatching center is shown in Equation (6):
U 2 ¯ = x U 21 + 1 x U 22 = x y m 1 + r 1 r 2 b 1 + b 3 m 2 + m 2 b 2 b 3 + r 2 + 1 x m 3 b 4
Combining these equations given above, the replicator dynamic equation of the dispatching center can be obtained, as shown in Equation (7):
F x = dx dt = x U 21 U 2 ¯ = x 1 x y m 1 + r 1 r 2 b 1 + b 3 m 2 + m 2 b 2 b 3 + r 2 m 3 + b 4
The replicator dynamic equation of the biogas plant is given in Equation (8):
F y = dy dt = y U 11 U 1 ¯ = y 1 y xa + Q 2 + h 2 Q 1 h 1 M 1 M 2 + C 1 + C 2

2.1.3. Stability Analysis of the Game

Letting F(x) = F(y) = 0, we can derive the possible evolutionary stability strategy (ESS) of the game: E1 (0, 0), E2 (0, 1), E3 (1, 0), E4 (1, 1), E5 ( Q 1 + h 1   + M 1 +   M 2 Q 2 h 2 C 1 C 2 a , m 3   + b 2 +   b 3 m 2 r 2 b 4 m 1   + r 1 +   b 3 m 2 b 1 r 2 ). If ( Q 1 +   h 1 + M 1 + M 2 Q 2 h 2 C 1 C 2 a )∈(0, 1), ( m 3   +   b 2 +   b 3 m 2 r 2 b 4 m 1 +   r 1 +   b 3 m 2 b 1 r 2 )∈(0, 1), then E1, E2, E3, E4 are pure strategy equilibrium points and E5 is a mixed strategy equilibrium point. Using the Jacobi matrix equilibrium stability analysis method, which states that when the matrix determinant is greater than zero and the trace of the matrix Is also greater than zero, then the evolution can reach stability, we can find the ESS [29]. Equations (9)–(12) show the solving process for the Jacobi matrix:
F 11 = F x / x = 1 2 x y m 1 + r 1 r 2 b 1 + b 3 m 2 + m 2 b 2 b 3 + r 2 m 3 + b 4
F 12 = F x / y = x 1 x m 1 + r 1 r 2 b 1 + b 3 m 2
F 21 = F y / x = ay 1 y
F 22 = F y / y = 1 2 y xa + Q 2 + h 2 Q 1 h 1 M 1 M 2 + C 1 + C 2
The Jacobi matrix can be obtained based on the four equations above, using the followed equation:
J = F 11 F 12 F 21 F 22
When substituting for the possible ESS points, the point can be determined as the ESS if all the eigenvalues of the Jacobi matrix are negative; if all the eigenvalues in the Jacobi matrix are positive, the point is unstable; if there are positive and negative eigenvalues in the Jacobi matrix, the point is a saddle point. At the point E5, the trace of the matrix is zero, which indicates that there is no evolutionary stable equilibrium point which tends to be stable with the increase of game times, but when the parameters of the payoff function meet certain conditions, the evolutionary game function may be stable, at which point, the ESS appears. For the equilibrium points E1 (0, 0), E2 (0, 1), E3 (1, 0) and E4 (1, 1), the local stability needs to be analyzed, and the corresponding eigenvalues of each equilibrium solution are shown in Table 2:
Of these four equilibrium points, the equilibrium E1 (0, 0) is ESS when m2 − b2 − b3 + r2 − m3 + b4 < 0 and Q2 + h2 − Q1 − h1 − M1 − M2 + C1 + C2 < 0; E1 (0, 0) is the saddle point when only one of m2 − b2 − b3 + r2 − m3 + b4 and Q2 + h2 − Q1 − h1 − M1 − M2 + C1 + C2 is positive; when m2 − b2 − b3 + r2 − m3 + b4 > 0 and Q2 + h2 − Q1 − h1 − M1 − M2 + C1 + C2 > 0, E1 is the instability point.
When m1 + r1 + b4 − b1 − b2 − m3 < 0 and Q1 + h1 + M1 + M2 − Q2 − h2 − C1 − C2 < 0, the point E2 (0, 1) is ESS; when only one of the m1 + r1 + b4 − b1 − b2 − m3 and Q1 + h1 + M1 + M2 − Q2 − h2 − C1 − C2 is positive, E2 is the saddle point; when m1 + r1 + b4 − b1 − b2 − m3 > 0 and Q1 + h1 + M1 + M2 – Q2 − h2 − C1 − C2 > 0, E2 is the instability point.
When b2 + b3 + m3 − m2 − r2 − b4 < 0 and a + Q2 + h2 − Q1 − h1 − M1 − M2 + C1 + C2 < 0, the point E3 (1, 0) is the ESS; when b2 + b3 + m3 − m2 − r2 − b4 and a + Q2 + h2 − Q1 − h1 − M1 − M2 + C1 + C2 only one is positive, E3 is the saddle point; when b2 + b3 + m3 − m2 − r2 − b4 > 0 and a + Q2 + h2 − Q1 − h1 − M1 − M2 + C1 + C2 > 0, E3 is an instability point.
When b1 + b2 + m3 − m1 − r1 − b4 < 0 and Q1 + h1 + M1 + M2 – a – Q2 − h2 − C1 − C2 < 0, the point E4 (1, 1) is the ESS; E4 is the saddle point when b1 + b2 + m3 − m1 − r1 − b4 and Q1 + h1 + M1 + M2 – a − Q2 − h2 − C1 − C2 and one is positive; when b1 + b2 + m3 − m1 − r1 − b4 > 0 and Q1 + h1 + M1 + M2 – a − Q2 − h2 − C1 − C2 > 0, E4 is an instability point.

2.2. Simulation of the Evolutionary Game Based on System Dynamics

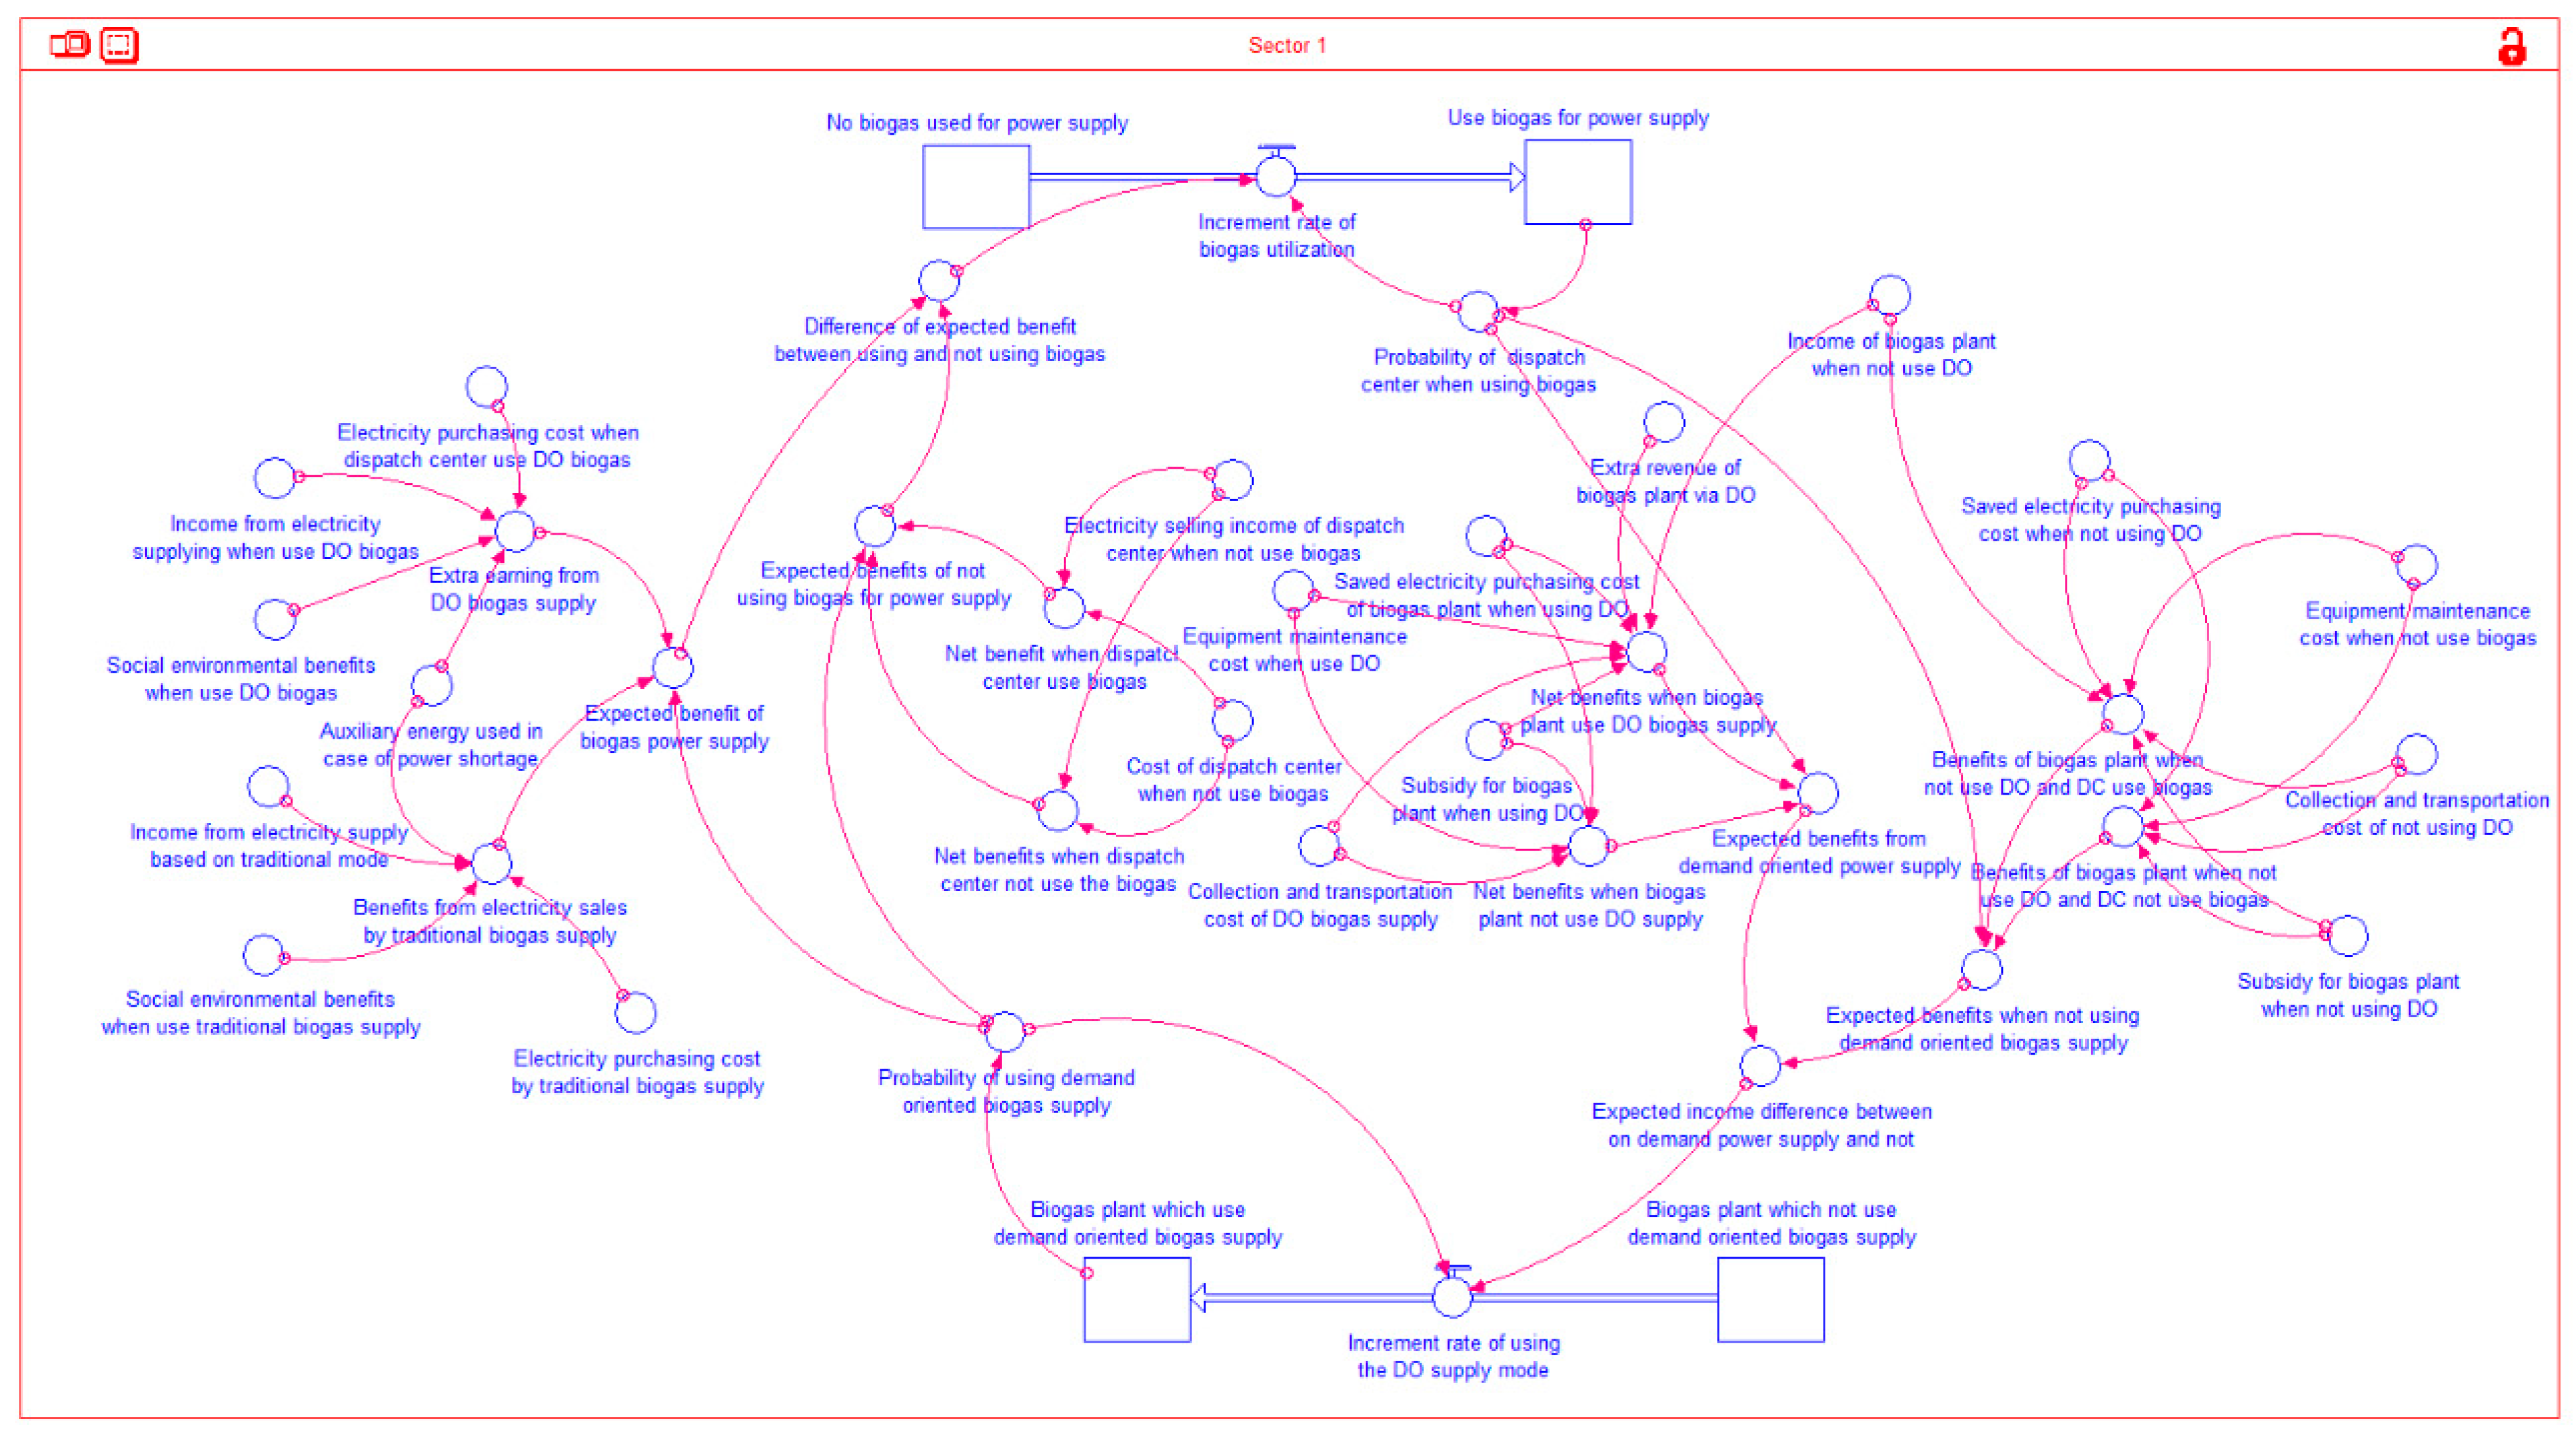
2.2.1. Construction of the SD Model

The above analysis provides the theoretical derivation of the evolutionary game between the biogas plant and the dispatching center, but due to the large number of parameters involved in the model, it is hard to predict visually whether there is an equilibrium point that enables the game to reach stability by mathematical methods only [30]. Therefore, this paper instantiates the evolutionary game based on the system dynamics (SD) simulation platform STELLA. The main variables of the model are set according to the payoff functions in the game, and the functional relationships among the variables are determined based on the replicator dynamic equation, and the stock-flow diagram of the SD model is shown in Figure 2.
In this SD model, the quantities of various biogas plant groups and dispatching center groups are designated as stock variables, while the transmission rates, acquired through the replicator dynamic equation, are specified as rate variables within the SD model. All other variables are established as auxiliary variables within the model.

2.2.2. SD Simulation Parameters and Data Acquisition

The DES in Anhui Province was selected as a typical case example for this study. The power system of this region consists mainly of five decentralized distributed microgrid systems, which are distributed among clusters of users in industrial parks, villages and agricultural bases. In the region, the predominant source of renewable energy at present is primarily photovoltaic. Additionally, there are currently two small-scale biogas facilities engaged in the anaerobic co-digestion of livestock manure and straw. The biogas produced from these facilities is harnessed to generate electricity using internal combustion engine units. The electricity generated will complement energy from wind and solar sources, fulfilling the electrical needs of local users, including those in industrial, agricultural, or residential sectors.
Based on the actual techno-economic parameters of the biogas plant and the data of regional energy consumption, the relevant parameters of the evolutionary game model can be calculated; the values as well as the calculation processes are shown in Table 3 (detailed calculation process can be found in Supplementary Materials). Once these parameters are obtained, we incorporate them into the SD model according to the previously defined variables and their respective parameter types. Subsequently, we execute the model to generate the simulated results.

3. Results and Discussion

3.1. Simulation Results of the Evolutionary Game and the Model’s Verifications

Figure 3 shows the simulation results of the evolutionary game for this case study. In the absence of any monetization compensation for the generated socio-environmental benefits, the ESS can be identified in which the biogas plant does not implement the DO and the dispatching center does not use the biogas. Substituting the parameter values of Table 3 into Table 2 to calculate the eigenvalues of each possible ESS point, it can be obtained that the only two eigenvalues F11 and F22 of E1 (0, 0) are less than 0, indicating that E1 is the only ESS at this point, which is consistent with the simulation results of system dynamics, which proves that the theoretical derivation is consistent with the simulation model and the model is valid. The ESS result indicates that the DO mechanism is not able to be promoted when there is not yet an effective incentive to compensate for the externalities, and both players prefer to maintain the status quo, which is consistent with the current status quo of the biogas industry in most regions of China [35]. When the social-environmental benefit parameters after the carbon trading are taken into account, the simulated results are shown in Figure 3b, where the ESS strategy for the biogas plant and dispatching center is (implement the DO, use the biogas), and E4 is the only ESS where both eigenvalues are less than 0, which is consistent with the theoretical deduction results; and it can be seen intuitively from the results that the evolutionary process of the dispatching center will reach stability around the fifth year. This is mainly due to the fact that under both economic and environmental incentives, the regional microgrid decision makers will tend to use renewable energy, so the demand for flexible biogas will increase, and then the economic benefit of biogas plant group will rise, thus motivating the biogas plant to participate in supplying for the distributed microgrid. However, it takes longer to reach equilibrium for biogas plants because it needs to bear higher production, operation and maintenance costs, and have a relatively low internal rate of return when implementing DO [25].

3.2. Sensitivity Analysis of Model Parameters

In order to determine the extent to which changes in the parameters involved in the model could affect the system’s evolutions, and then to give the basis for enacting the suitable incentives, a sensitivity analysis of the parameters was carried out. The parameters with high uncertainty were selected for analysis, and then the biogas plant and the dispatching center’s strategy selection probabilities were observed by increasing and decreasing these parameters within their reasonable ranges of fluctuation, respectively. Seven parameters were selected for sensitivity analysis: M1: cost of collection and transportation of substrates when the biogas plant implements DO; Q2: government subsidy for biogas plants when the biogas plant implements DO; b3: cost for purchased electricity when the dispatching center use biogas while the biogas plant does not implement DO; b4: cost for purchased electricity when the dispatching center does not use biogas; m2: revenue from electricity sales of the dispatching center when they use biogas but the biogas plant does not implement DO; m3: revenue from electricity sales of the dispatching center when they do not use biogas and r1: social-environmental benefits of the region brought by the implementation of DO.
The results are shown in Figure 4 and Figure 5, where the four parameters that have the greatest influence on the probability of biogas plant are m3, m2, b4 and b3, respectively; for the dispatching center, the rankings are the same as the biogas plant, while the change of variables has a relatively more severe impact on the dispatching center, which means that the dispatching center is the player with the initiative, whose strategy selection will drive the biogas plant’s actions.
It can be found that the parameter of m3 (revenue from electricity sales of dispatching center when they do not use biogas) has the most critical impact on the strategy selection of the biogas plant and dispatching center, especially when the revenue rises to 4–7%; the evolution rate of the dispatching center using biogas drops significantly to few DCs that are willing to use biogas. The acceptance of DO by both the dispatching center and biogas plant occurs only when the m3 increase remains within a threshold of 6%, approximately equivalent to 1.484 Yuan/KWh in unit revenue. The regulations are same for the biogas plant. The possibilities of increment of the dispatching center’s revenue if it does not use biogas mainly come from the rise of demand for electricity or electricity price. In this case, the chemical energy storage or thermal power will play a significant role for the dispatching center to compensate the gap of other renewable energies, in which the share of renewable energy utilization is relatively insufficient. Therefore, if the revenue rises, it attests that energy users are willing to pay for non-renewable resources. Based on the above analysis, the corresponding solutions for increasing the diffusion of the DO mechanism is to reduce the users’ acceptance for non-renewable sources and the willingness to pay.
The parameter m2 (revenue from electricity sales of dispatching center when they use biogas but biogas plant does not implement DO) has the second-most critical impact on the results, and if the revenue from using biogas decreases to 5–10%, the probability of the dispatching center using biogas will drop remarkably. The acceptance of DO by both the dispatching center and biogas plant is contingent upon the decrease in m2 staying within a threshold of 5%, roughly equivalent to 1.249 Yuan/KWh in unit revenue. This ensures that the probability of DO acceptance exceeds 50% in the 30th year of operation. If the dispatching center chose to use biogas while the biogas plant does not implement the DO, the users’ power demand can only be partly compensated by the renewable energy, and other peak-regulating methods, such as the chemical energy storage that must be employed, the induced cost, as well as the original high cost from biogas production, and will finally be transferred to the dispatching center so that making users unable to afford electricity greatly hinders the development of biogas [36]. The key point for enhancing the revenue from biogas utilization is to take the advantage of the biomass energy, i.e., the potential benefits from waste treatment, the recycling of biogas residue and the ecological cycle [37].
The b4 (cost for purchased electricity when dispatching center does not use biogas) and b3 (cost for purchased electricity when the dispatching center use biogas while biogas plant do not implement DO) also have a significant impact on the results. The changes of b3 and b4 mainly come from the variation of the electricity prices of biogas and traditional energy. When b3 rises, which means that the electricity price from biogas increases, both rates of the dispatching center using biogas and the biogas plant implementing DO will drop dramatically; on the contrary, when b4 decreases, which may be caused by the reduction of price of electricity from traditional energy, the rates will obviously decline. Therefore, the effective pathways to promote the DO is to avoid the rises of electricity prices of biogas, which can be realized by using more efficient anaerobic digestion technologies, i.e., the dry fermentation for cutting down the costs [38]; in addition, reasonable restrictive measures can be imposed to the traditional power plant, i.e., the thermal power can be taxed for limiting the development of fossil fuels.

3.3. Implications for the Optimal Policy Instrument Selection

According to the sensitivity analysis, the parameter m3 has the most critical impact on the strategy selection, the key solutions that promote the DO mechanism to restrict the users’ acceptance for non-renewable sources and the willingness to pay, as discussed in Section 3.2. However, in most countries, especially the developing countries, the fossil fuels are still the cheapest energy source, so the manufacturers and residents prefer to use the traditional energies under the single goal of economic development. Therefore, suitable industrial policies are needed to assist the development of biogas energy with the governmental guidance. It is suggested that market-based industrial policies, for instance, the green energy certificate trading under the quota system in which the energy users’ fossil fuel usage amount exceeds the quota, should be purchased from others with surplus, and paid more attention to by local government [39]. The mandatory quota and a unified trading market are the important preconditions for making the green energy certificate system work. Of course, the development of users’ green consciousness is a long-term evolution, but the large-scale enterprise should undertake the responsibility of green transformation, in order for obtaining more corporate green reputation under the more popularized green labeling scheme [40].
Another important parameter that has a significant impact on the results is m2, and our proposed solution to promote DO is to take the advantage of the biomass energy on this basis in order to enhance the users’ direct or indirect revenues. The targeted polices can be enacted with the direction of helping enterprises to solve the organic waste treatment bottleneck problems, thus finding the optimal application scenarios for biogas. For example, the technical route of anaerobic digestion of agriculture straw can be reformed, i.e., the straw can be firstly used to produce the furfurol, and then the residue of furfurol can be used to produce biogas, thus the products of furfurol can be another benefit source, the biogas production rate can be increased, and the biogas residue will be a good fertilizer, which can be used for desertification restoration, bio-fertilizer, etc. [41]. In summary, related industrial policy instruments can be enacted to extend the industrial chain of original biogas production.

3.4. Discussion

The established game model could provide an effective tool for analyzing the diffusion law behind the strategy selection of different stakeholders, and the outstanding advantages lay on the expansibility of the model’s structures. There are still uncertainties involved in the evolutionary game established in this paper: firstly, there are various pathways for DO mechanism, such as biogas storage and flexible biogas production, etc. The technical and economic parameters corresponding to different pathways may be different, but this point has not taken into consideration in this research; in addition, the types of power users’ load demand are also diverse, and if it involves the complementarities with intermittent renewable energy sources, such as photovoltaic, wind power, etc., then the related stakeholders will be more complex. Therefore, the game scenarios need to be enriched, and further research can be carried out using multi-player evolutionary games or network games to explore this in depth. Secondly, this study simplifies the possible feedback mechanism among the variables and parameters in the game model of DO’s development; for example, the price of biogas is influenced by the supply of biogas plants and the demand of users, and the behaviors of the two sides are regulated by the feedback of price, but the dynamic changes of biogas price are ignored in this paper. Thirdly, the paper only considers government subsidies and carbon trading for biogas industry support policies; thus, other possible incentives can be explored in further research, and the promotion of social capital investments for industry development can also be taken into account. Finally, during the modeling process, we assumed that DO technology possesses full feasibility; in fact, DO technology still encounters a series of challenges in practice. These challenges can include safety risks associated with expanding gas storage capacity, issues related to the coordination of sensors, automation systems, and monitoring devices controlled by biogas, long-term system reliability concerns, and inefficiencies in raw substrate pretreatment. It is important to note that the specific challenges can vary depending on the region and the particular case, thus necessitating a context-specific analysis.

4. Conclusions

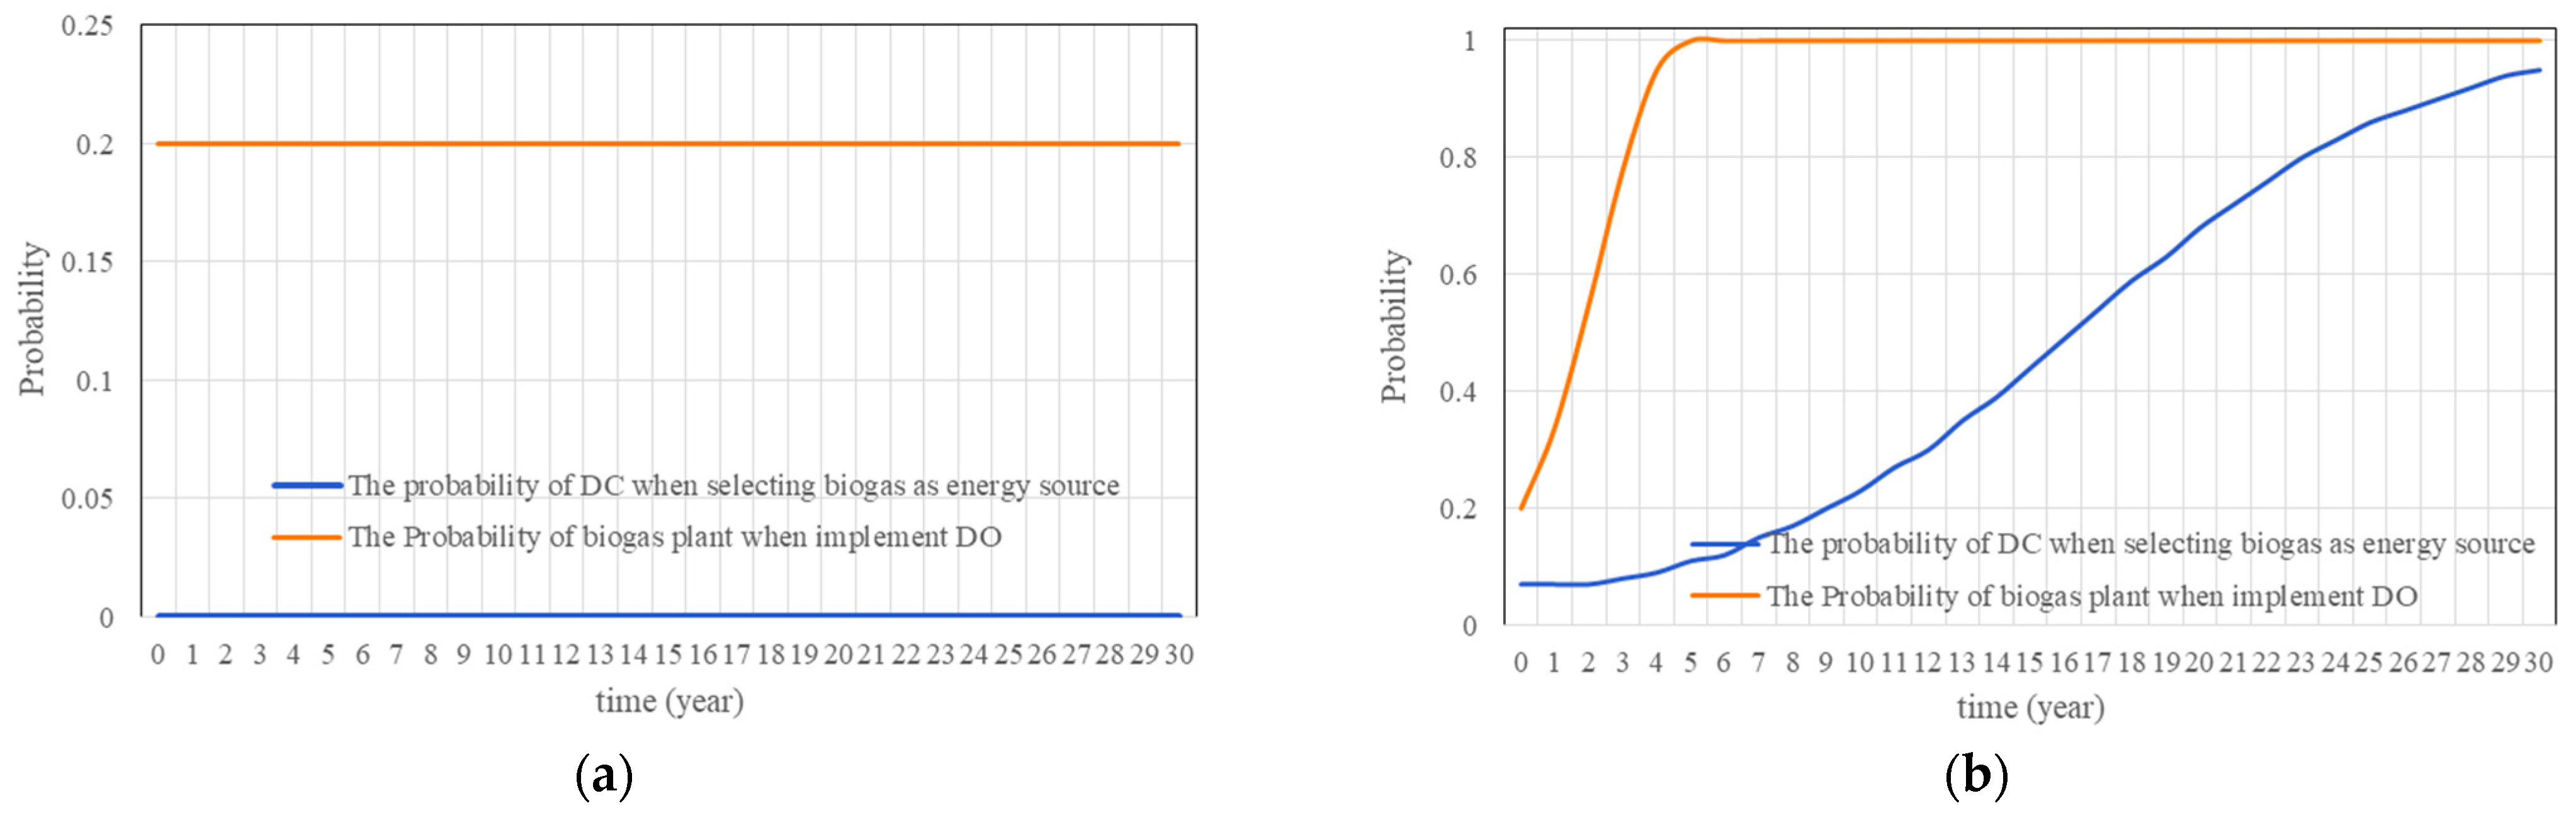
  • According to the deduction results of the ESS and the SD, the biogas plant and the dispatching center in DES will converge to an undesirable set of ESS (not implement the DO, not use the power from biogas) when the carbon trading mechanism are not introduced into the case region. However, when the DES is able to obtain monetized returns of socio-environmental benefits, through participating in the carbon trading with other regions, it can converge to the ideal ESS (implement the DO, use the power from biogas), at which point the dispatching center can reach a stable equilibrium around the fifth year, and the biogas plant will reach equilibrium around the thirtieth year, driven by the demands for power from biogas.
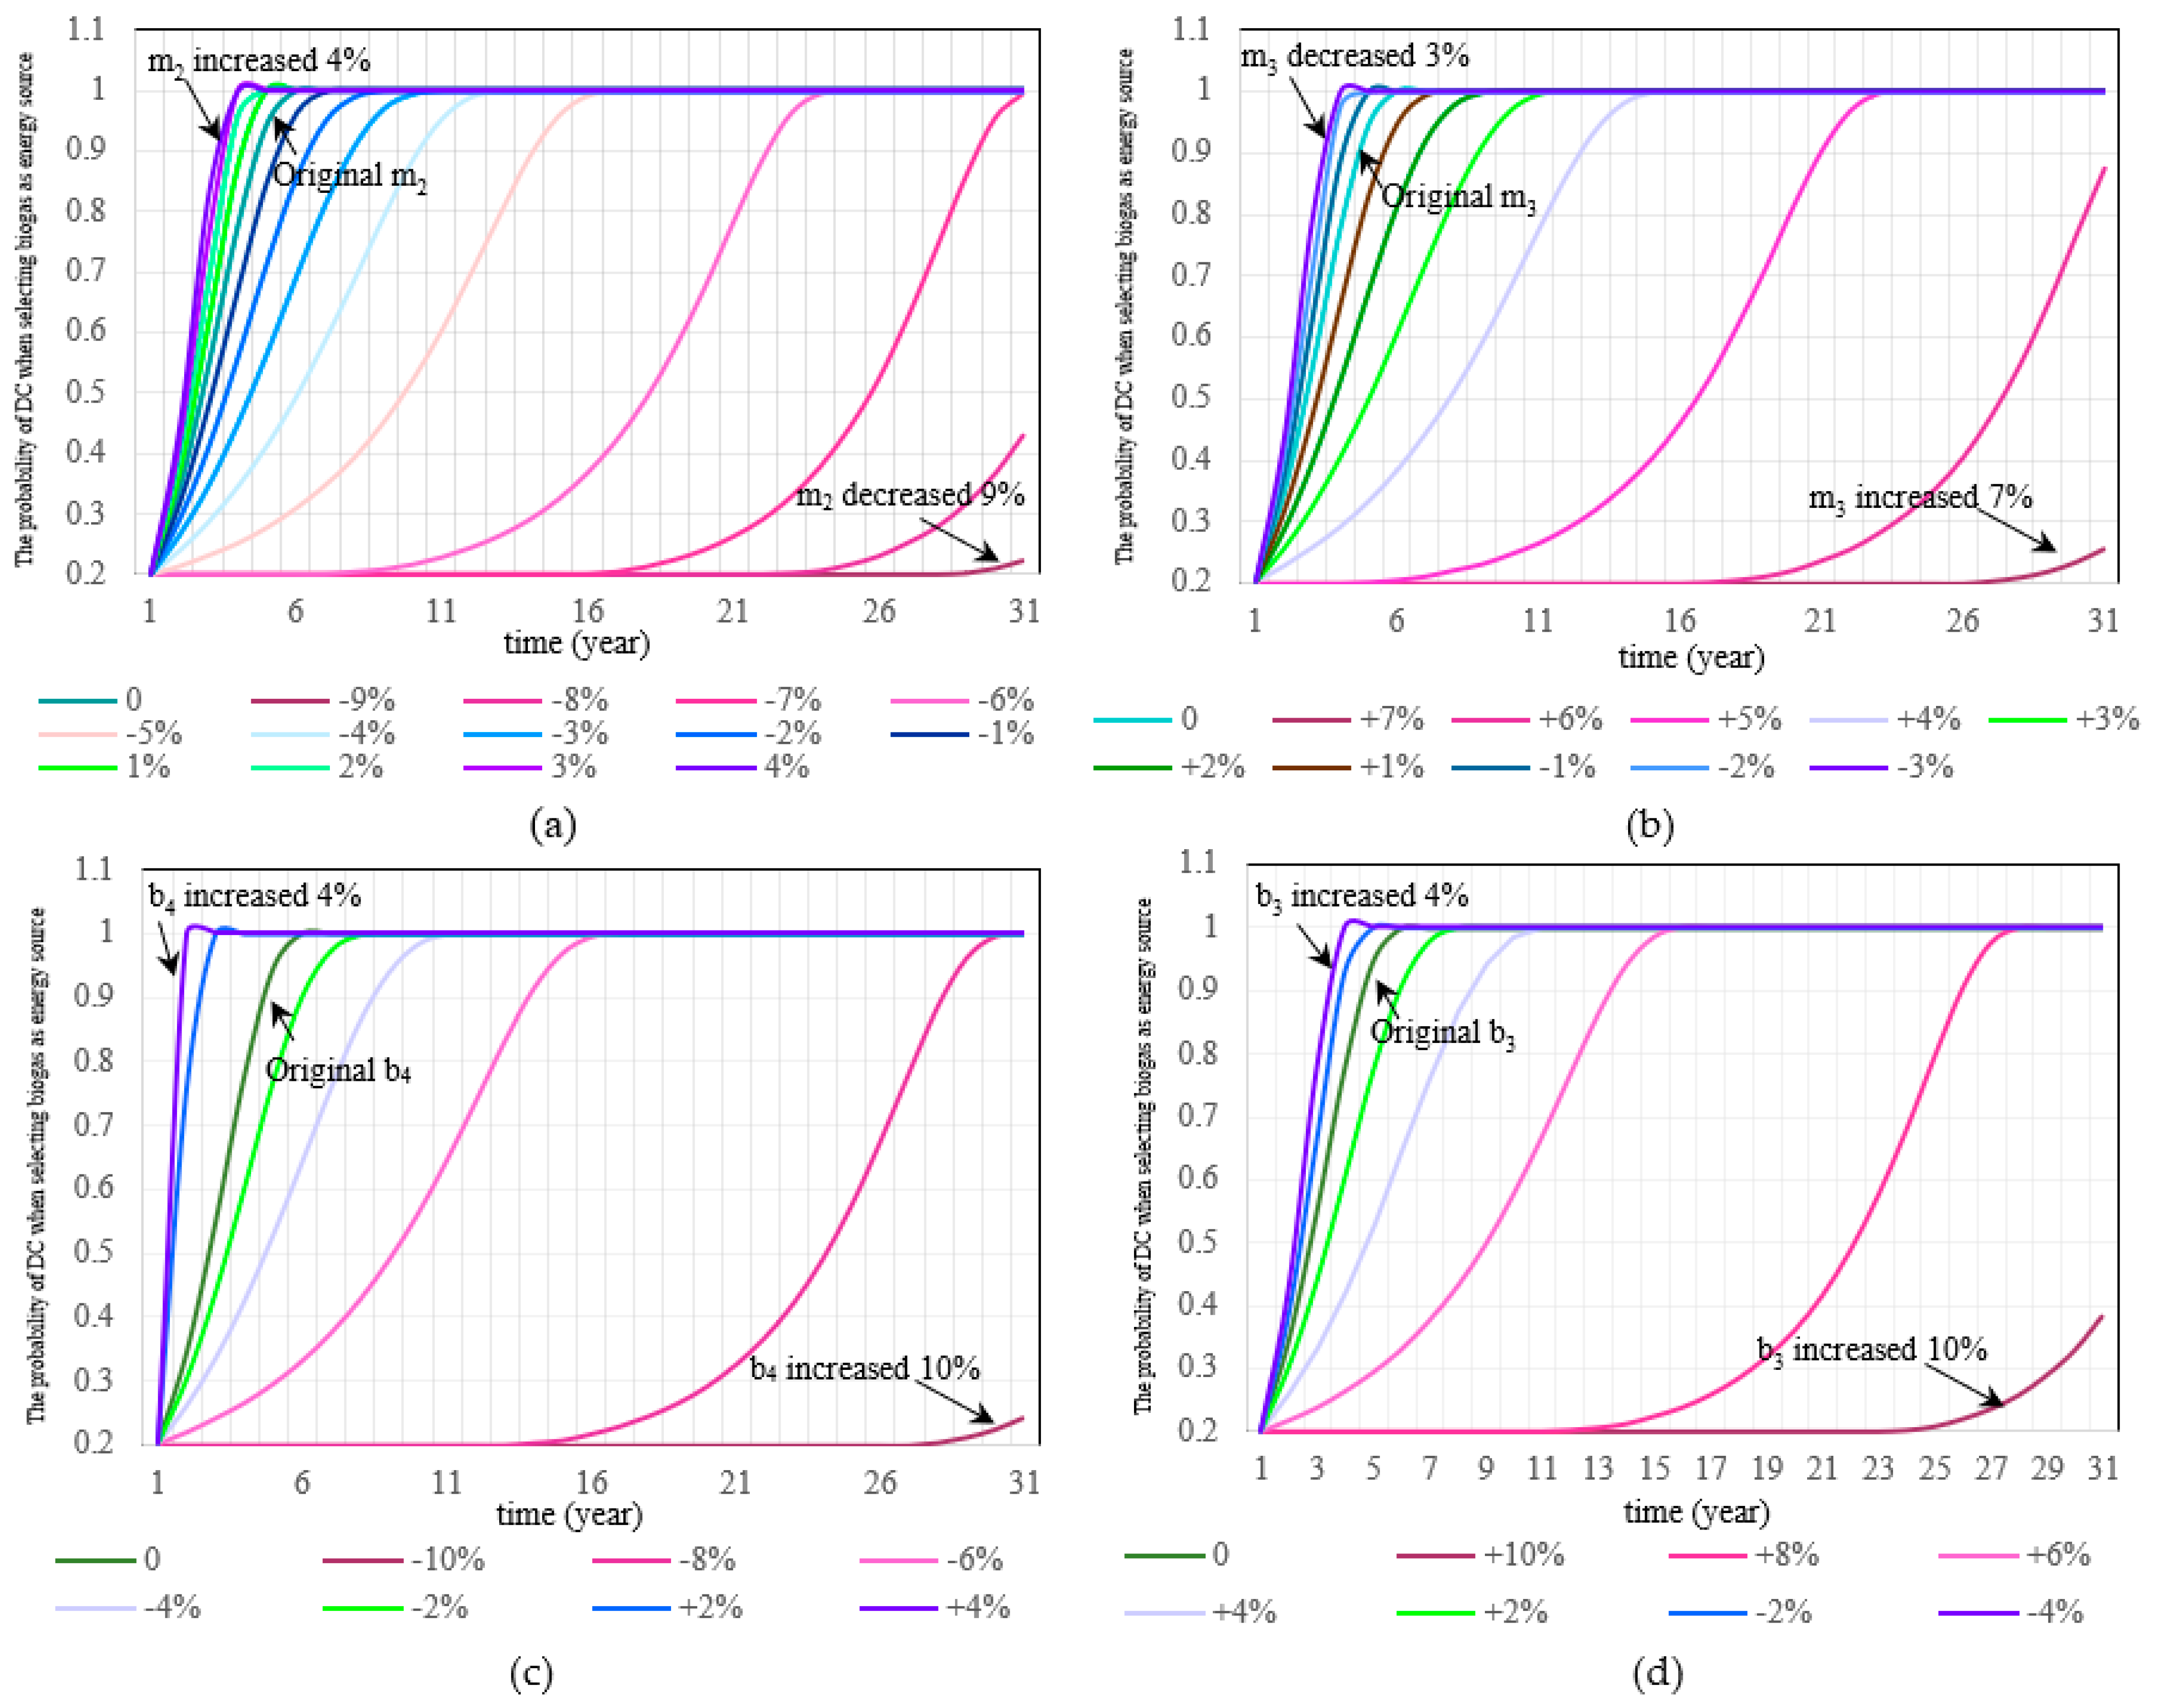
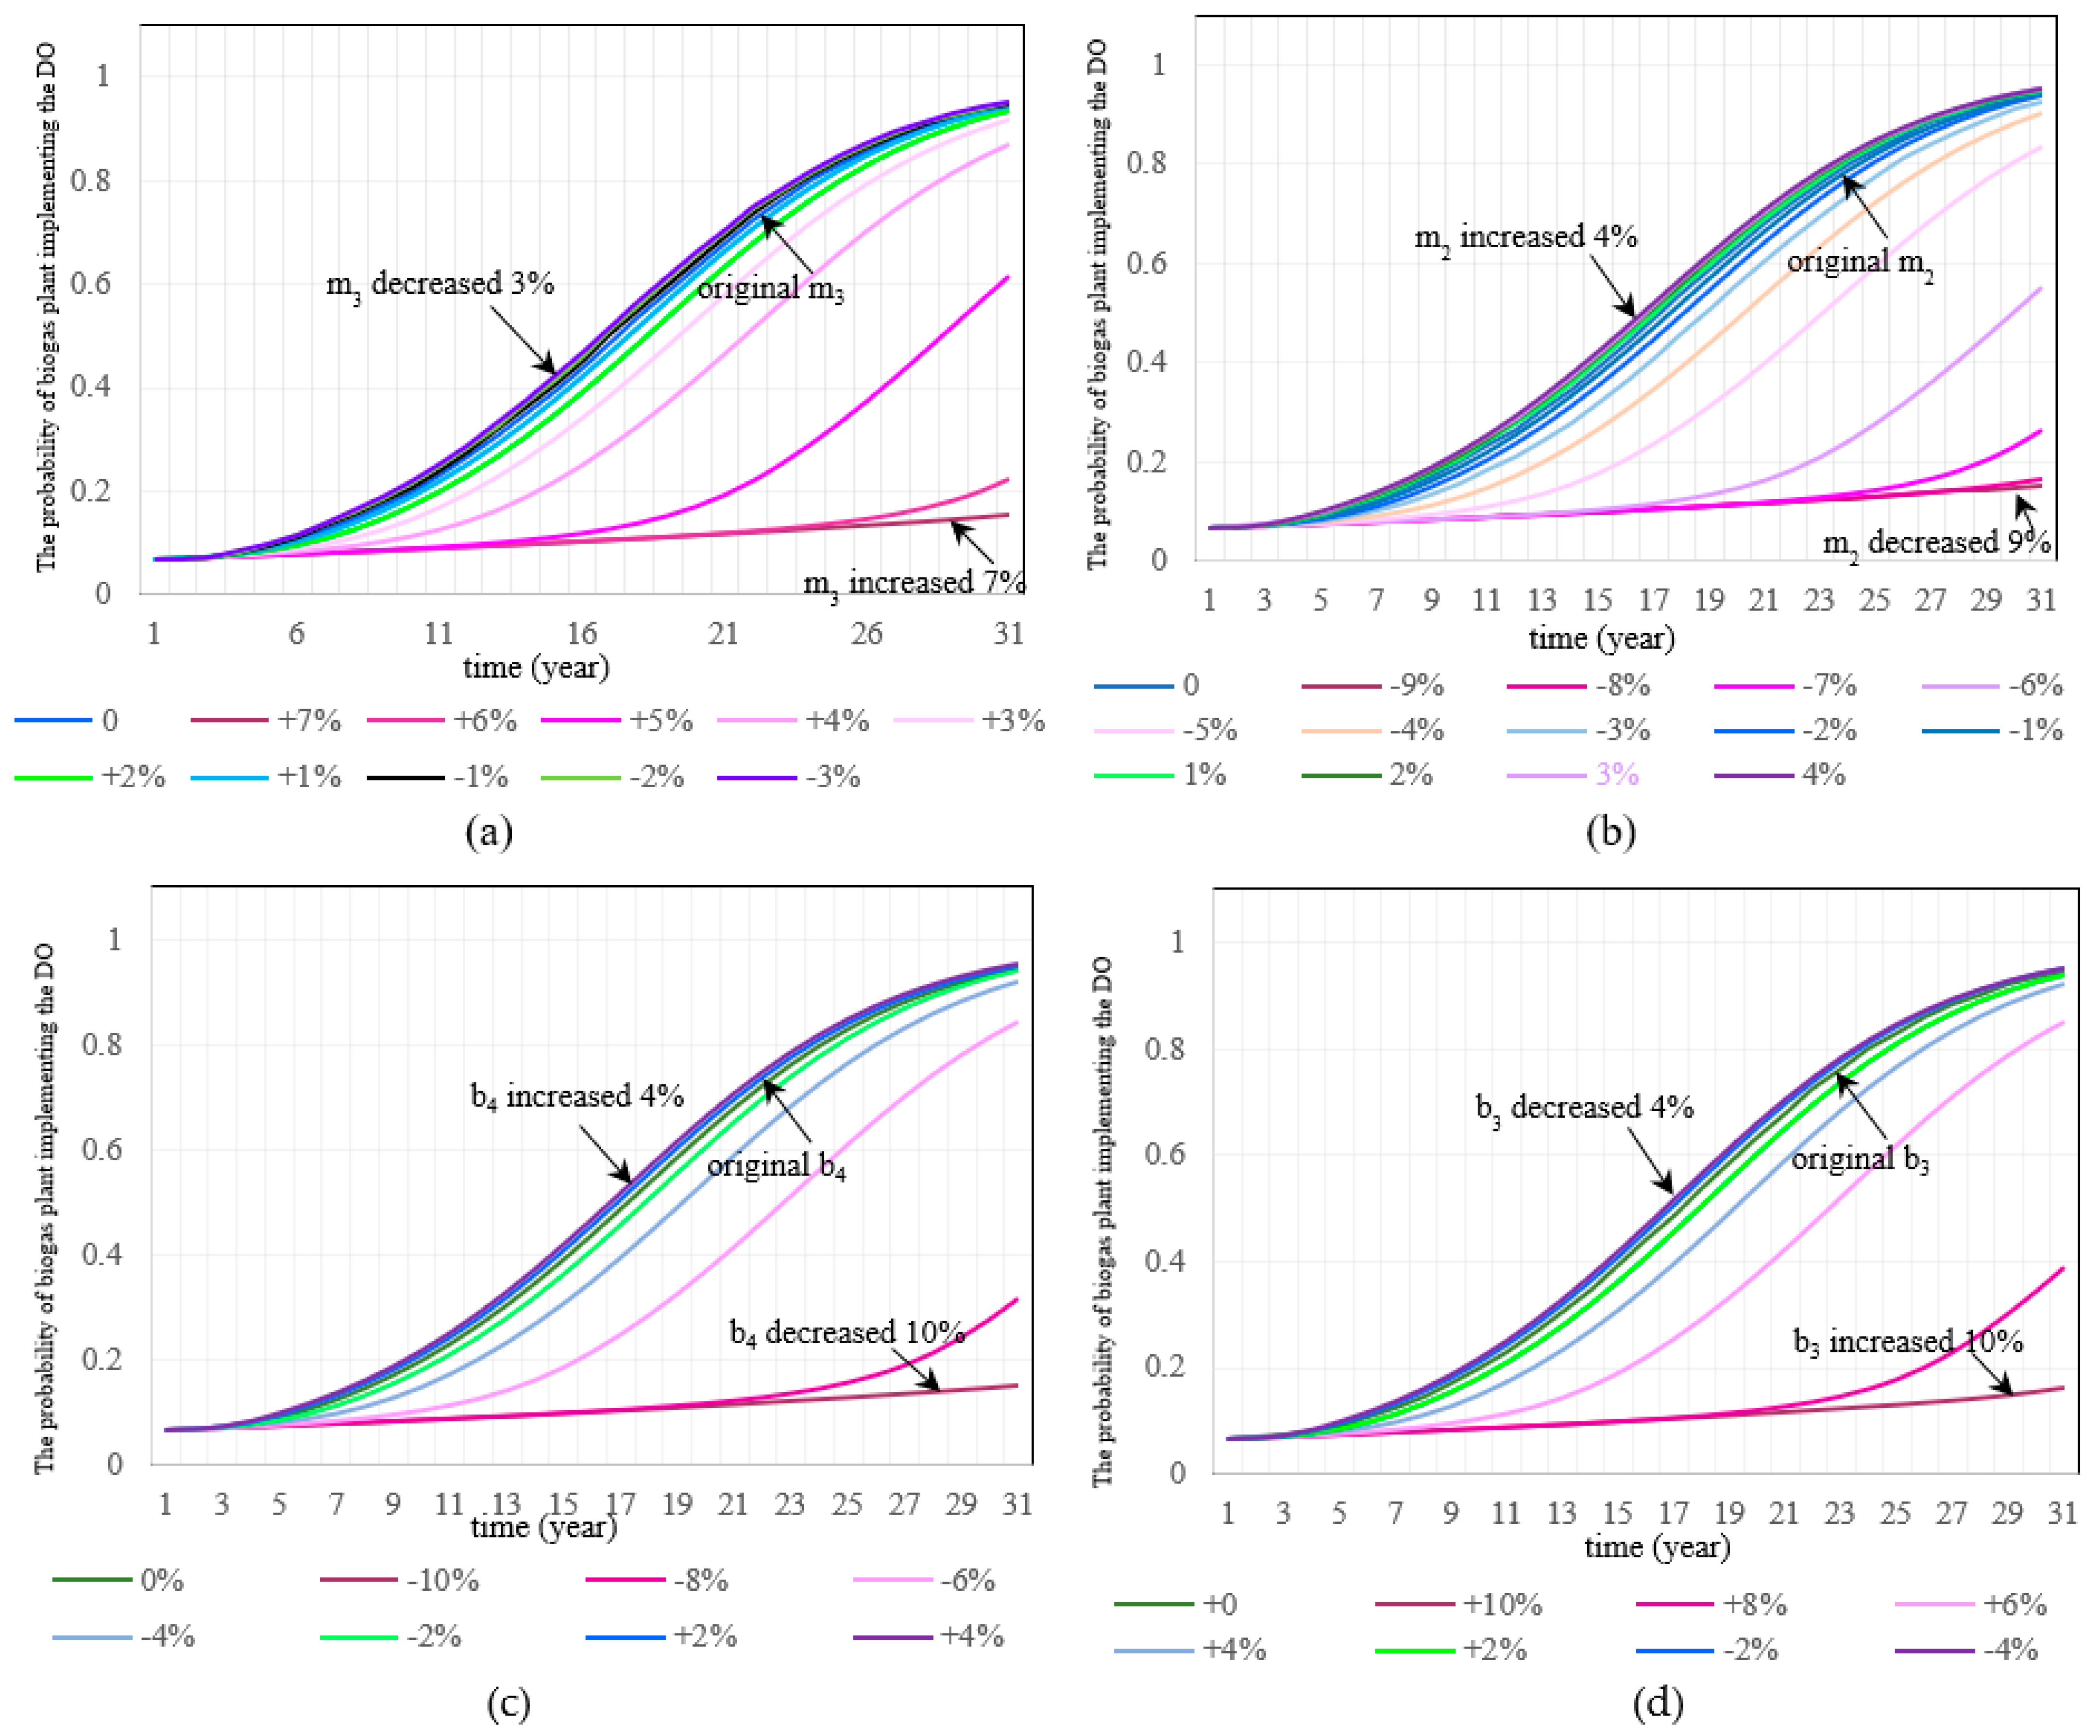
  • The results of the sensitivity analysis show that the revenue from electricity sales of the dispatching center when they do not use biogas, as well as the revenue from electricity sales of the dispatching center when they use biogas but the biogas plant does not implement DO, are the most critical parameters influencing the evolutionary game process between the biogas plant and dispatching center. The parameters of cost for purchased electricity when the dispatching center does not use biogas, as well as the cost for purchased electricity when the dispatching center use biogas while the biogas plant does not implement DO, also have significant impact on the results. The acceptance of DO by both the dispatching center and biogas plant occurs only when the m3 increase remains within a threshold to 1.484 Yuan/KWh in unit revenue. Other factors, such as the substrates collection and transportation cost, the governmental subsidies to the biogas plant and the social-environmental benefits, do not have significant impacts on the final results of the game.
  • Based on the results of sensitivity analysis, it is recommended that more regions and enterprises should be included in the national unified carbon market, and the market-based industrial policies such as green electricity quota trading can be used to restrict the users’ acceptance for non-renewable sources and the willingness to pay, while suitable targeted polices are needed to extend the industrial chain of original biogas production, so that the potential revenues of biogas plants can be enhanced and, finally, the ESS for better promotion of DO can be rated and successfully implemented.

Supplementary Materials

The following supporting information can be downloaded at: https://www.mdpi.com/article/10.3390/su151914297/s1, Table S1: Determination of the model’s parameters.

Author Contributions

Conceptualization, Y.L.; methodology, Y.L.; software, J.W.; validation, J.L.; formal analysis, J.W.; investigation, J.W.; resources, Y.L.; data curation, J.W.; writing—original draft preparation, Y.L.; writing—review and editing, J.H.; visualization, J.W.; supervision, J.H.; project administration, Y.L.; funding acquisition, Y.L. All authors have read and agreed to the published version of the manuscript.

Funding

This research was funded by [National Natural Science Foundation of China] grant number [42201313], [Nature Science Research Project of Anhui Province] grant number [2208085QD109], [Open Fund of Engineering Research Center of Biofilm Water Purification and Utilization Technology of Ministry of Education] grant number [BWPU2021KF09].

Institutional Review Board Statement

Not applicable.

Informed Consent Statement

Not applicable.

Data Availability Statement

Data can be obtained from the corresponding author upon reasonable request.

Conflicts of Interest

The authors declare no conflict of interest.

Abbreviations

The symbols and abbreviations used in the paper:
DOdemand oriented biogas supplyDESdistributed renewable energy system
ESSevolutionarily stable strategyPVphotovoltaic
C1cost of collection and transportation of substrates when biogas plant not implement DOC2cost of operation and maintenance when biogas plant not implement DO
h1saved fees of purchased electricity when biogas plant not implement DOQ1government subsidy for biogas plants when biogas plant not implement DO
u1revenue from electricity sales when biogas plant not implement DOM1cost of collection and transportation of substrates when biogas plant implement DO
M2cost of operation and maintenance when biogas plant implement DOh2saved fees of purchased electricity when biogas plant implement DO
Q2government subsidy for biogas plants when biogas plant implement DOaadditional revenue from on-demand electricity sales when biogas plant implement DO
b1cost for purchased electricity when biogas plant implement DO and the dispatching center use biogasb2cost of using emergency back-up energy
m1revenue from electricity sales of dispatching center when they use biogas and biogas plant implement DOr1social-environmental benefits of the region brought by the implementation of DO
b3cost for purchased electricity when the dispatching center use biogas while biogas plant do not implement DOm2revenue from electricity sales of dispatching center when they use biogas but biogas plant do not implement DO
r2social-environmental benefits of the region when dispatching center use biogas but biogas plant do not implement DOb4cost for purchased electricity when dispatching center do not use biogas
m3revenue from electricity sales of dispatching center when they do not use biogasSDsystem dynamics

References

  1. Tan, C.; Yu, M.; Wang, J.; Geng, S.; Niu, D.; Tan, Z. Feasibility study on the construction of multi-energy complementary systems in rural areas—Eastern, central, and western parts of China are taken as examples. Energy 2022, 249, 123571. [Google Scholar]
  2. Li, J.; Chen, S.; Wu, Y.; Wang, Q.; Liu, X.; Qi, L.; Lu, X.; Gao, L. How to make better use of intermittent and variable energy? A review of wind and photovoltaic power consumption in China. Renew. Sust. Energy Rev. 2021, 137, 110626. [Google Scholar]
  3. Shahsavar, M.M.; Akrami, M.; Gheibi, M.; Kavianpour, B.; Fathollahi-Fard, A.M.; Behzadian, K. Constructing a smart framework for supplying the biogas energy in green buildings using an integration of response surface methodology, artificial intelligence and petri net modelling. Energy Convers. Manag. 2021, 248, 114794. [Google Scholar]
  4. Szarka, N.; Scholwin, F.; Trommler, M.; Jacobi, H.F.; Eichhorn, M.; Ortwein, A.; Thrän, D. A novel role for bioenergy: A flexible, demand-oriented power supply. Energy 2013, 61, 18–26. [Google Scholar]
  5. Luo, T.; Khoshnevisan, B.; Huang, R.; Chen, Q.; Mei, Z.; Pan, J.; Liu, H. Analysis of revolution in decentralized biogas facilities caused by transition in Chinese rural areas. Renew. Sust. Energy Rev. 2020, 133, 110133. [Google Scholar]
  6. O’Shea, R.; Wall, D.; Murphy, J.D. Modelling a demand driven biogas system for production of electricity at peak demand and for production of biomethane at other times. Bioresour. Technol. 2016, 216, 238–249. [Google Scholar]
  7. Ohnmacht, B.; Lemmer, A.; Oechsner, H.; Kress, P. Demand-oriented biogas production and biogas storage in digestate by flexibly feeding a full-scale biogas plant. Bioresour. Technol. 2021, 332, 125099. [Google Scholar]
  8. Terboven, C.; Ramm, P.; Herrmann, C. Demand-driven biogas production from sugar beet silage in a novel fixed bed disc reactor under mesophilic and thermophilic conditions. Bioresour. Technol. 2017, 241, 582–592. [Google Scholar]
  9. Lafratta, M.; Thorpe, R.B.; Ouki, S.K.; Shana, A.; Germain, E.; Willcocks, M.; Lee, J. Demand-driven biogas production from anaerobic digestion of sewage sludge: Application in demonstration scale. Waste Biomass Valorization 2021, 12, 6767–6780. [Google Scholar]
  10. Weithmann, N.; Mlinar, S.; Sonnleitner, E.; Weig, A.R.; Freitag, R. Flexible feeding in anaerobic digestion–Impact on process stability, performance and microbial community structures. Anaerobe 2021, 68, 102297. [Google Scholar]
  11. Li, Y.; Ma, J.; Yuan, H.; Li, X. Effects of Feeding Regimes on Process Performance and Microbial Community Structure in Anaerobic Semi-Continuously Stirred Tank Reactors Treating Corn Stover. Waste Biomass Valorization 2022, 13, 1003–1014. [Google Scholar] [CrossRef]
  12. Körber, M.; Weinrich, S.; Span, R.; Gerber, M. Demand-oriented biogas production to cover residual load of an electricity self-sufficient community using a simple kinetic model. Bioresour. Technol. 2022, 361, 127664. [Google Scholar] [CrossRef] [PubMed]
  13. Hochloff, P.; Braun, M. Optimizing biogas plants with excess power unit and storage capacity in electricity and control reserve markets. Biomass Bioenergy 2014, 65, 125–135. [Google Scholar] [CrossRef]
  14. Hua, Z.; Li, J.; Zhou, B.; Or, S.W.; Chan, K.W.; Meng, Y. Game-theoretic multi-energy trading framework for strategic biogas-solar renewable energy provider with heterogeneous consumers. Energy 2022, 260, 125018. [Google Scholar] [CrossRef]
  15. Wang, G.; Chao, Y.; Cao, Y.; Jiang, T.; Han, W.; Chen, Z. A comprehensive review of research works based on evolutionary game theory for sustainable energy development. Energy Rep. 2022, 8, 114–136. [Google Scholar] [CrossRef]
  16. Mansouri, S.A.; Ahmarinejad, A.; Javadi, M.S.; Nezhad, A.E.; Shafie-Khah, M.; Catalão, J.P. Demand response role for enhancing the flexibility of local energy systems. In Distributed Energy Resources in Local Integrated Energy System; Elsevier: Amsterdam, The Netherlands, 2021; pp. 279–313. [Google Scholar] [CrossRef]
  17. Nassar, Y.; Mangir, I.; Hafez, A.; El-Khozondar, H.; Salem, M.; Awad, H. Feasibility of innovative topography-based hybrid renewable electrical power system: A case study. Clean. Eng. Technol. 2023, 14, 100650. [Google Scholar] [CrossRef]
  18. Hahn, H.; Krautkremer, B.; Hartmann, K.; Wachendorf, M. Review of concepts for a demand-driven biogas supply for flexible power generation. Renew. Sustain. Energy Rev. 2014, 29, 383–393. [Google Scholar] [CrossRef]
  19. Alao, M.A.; Popoola, O.M.; Ayodele, T.R. Sustainable prime movers selection for biogas-based combined heat and power for a community microgrid: A hybrid fuzzy multi criteria decision-making approach with consolidated ranking strategies. Energy Convers. Manag. 2022, 16, 100281. [Google Scholar] [CrossRef]
  20. Dong, H.; Fu, Y.; Jia, Q.; Wen, X. Optimal dispatch of integrated energy microgrid considering hybrid structured electric-thermal energy storage. Renew. Energy 2022, 199, 628–639. [Google Scholar] [CrossRef]
  21. Lauer, M.; Thrän, D. Biogas plants and surplus generation: Cost driver or reducer in the future German electricity system? Energy Policy 2017, 109, 324–336. [Google Scholar] [CrossRef]
  22. Skovsgaard, L.; Jacobsen, H.K. Economies of scale in biogas production and the significance of flexible regulation. Energy Policy 2017, 101, 77–89. [Google Scholar] [CrossRef]
  23. Nassar, Y.F.; Alsadi, S.Y.; El-Khozondar, H.J.; Ismail, M.S.; Al-Maghalseh, M.; Khatib, T.; Sa’ed, J.A.; Mushtaha, M.H.; Djerafi, T. Design of an isolated renewable hybrid energy system: A case study. Mater. Renew. Sustain. 2022, 11, 225–240. [Google Scholar] [CrossRef]
  24. Lauer, M.; Leprich, U.; Thrän, D. Economic assessment of flexible power generation from biogas plants in Germany’s future electricity system. Renew. Energy 2020, 146, 1471–1485. [Google Scholar] [CrossRef]
  25. Hahn, H.; Ganagin, W.; Hartmann, K.; Wachendorf, M. Cost analysis of concepts for a demand oriented biogas supply for flexible power generation. Bioresour. Technol. 2014, 170, 211–220. [Google Scholar] [CrossRef] [PubMed]
  26. Ghenai, C.; Janajreh, I. Design of solar-biomass hybrid microgrid system in Sharjah. Energy Procedia 2016, 103, 357–362. [Google Scholar] [CrossRef]
  27. Sun, S.; Wang, C.; Wang, Y.; Zhu, X.; Lu, H. Multi-objective optimization dispatching of a micro-grid considering uncertainty in wind power forecasting. Energy Rep. 2022, 8, 2859–2874. [Google Scholar] [CrossRef]
  28. Chen, Q.; Liu, T. Biogas system in rural China: Upgrading from decentralized to centralized? Renew. Sust. Energy Rev. 2017, 78, 933–944. [Google Scholar] [CrossRef]
  29. Friedman, D. On economic applications of evolutionary game theory. J. Evol. Econ. 1998, 8, 15–43. [Google Scholar] [CrossRef]
  30. Tian, Y.; Govindan, K.; Zhu, Q. A system dynamics model based on evolutionary game theory for green supply chain management diffusion among Chinese manufacturers. J. Clean. Prod. 2014, 80, 96–105. [Google Scholar] [CrossRef]
  31. Hublin, A.; Schneider, D.R.; Džodan, J. Utilization of biogas produced by anaerobic digestion of agro-industrial waste: Energy, economic and environmental effects. Waste Manag. Res. 2014, 32, 626–633. [Google Scholar] [CrossRef]
  32. Lauer, M.; Dotzauer, M.; Hennig, C.; Lehmann, M.; Nebel, E.; Postel, J.; Szarka, N.; Thrän, D. Flexible power generation scenarios for biogas plants operated in Germany: Impacts on economic viability and GHG emissions. Int. J. Energy Res. 2017, 41, 63–80. [Google Scholar] [CrossRef]
  33. Liu, Y.; Huang, T.; Peng, D.; Huang, J.; Maurer, C.; Kranert, M. Optimizing the co-digestion supply chain of sewage sludge and food waste by the demand oriented biogas supplying mechanism. Waste Manag. Res. 2021, 39, 302–313. [Google Scholar] [CrossRef] [PubMed]
  34. Zhang, D.; Zhang, R.; Zheng, Y.; Zhang, B.; Jiang, Y.; An, Z.; Bai, J. Carbon emission reduction analysis of CHP system driven by biogas based on emission factors. Energy Built. Environ. 2023, 4, 576–588. [Google Scholar] [CrossRef]
  35. Lu, J.; Gao, X. Biogas: Potential, challenges, and perspectives in a changing China. Biomass Bioenerg. 2021, 150, 106127. [Google Scholar] [CrossRef]
  36. Abdalla, A.N.; Nazir, M.S.; Tao, H.; Cao, S.; Ji, R.; Jiang, M.; Yao, L. Integration of energy storage system and renewable energy sources based on artificial intelligence: An overview. J. Energy Storage 2021, 40, 102811. [Google Scholar] [CrossRef]
  37. Bai, Y.; Zhai, Y.; Zhang, T.; Ren, K.; Jia, Y.; Zhou, X.; Cheng, Z.; Tanikawa, H.; Hong, J. Sustainable assessment and resource recycling opportunities identification for China’s pig industry: Integrating environmental, economic and social perspectives. Sustain. Prod. Consum. 2023, 39, 425–437. [Google Scholar] [CrossRef]
  38. Fu, Y.; Luo, T.; Mei, Z.; Li, J.; Qiu, K.; Ge, Y. Dry anaerobic digestion technologies for agricultural straw and acceptability in China. Sustainability 2018, 10, 4588. [Google Scholar] [CrossRef]
  39. Zhang, L.; Liu, D.; Cai, G.; Lyu, L.; Koh, L.H.; Wang, T. An optimal dispatch model for virtual power plant that incorporates carbon trading and green certificate trading. Int. J. Electr. Power 2023, 144, 108558. [Google Scholar] [CrossRef]
  40. Lin, H.C.; Pan, S.Y.; Lin, Y.I.; Cao, D.T.N. Enhanced biomethane production with a low carbon footprint via anaerobic co-digestion of swine wastewater with rice husk. Sci. Total Environ. 2023, 891, 164612. [Google Scholar] [CrossRef]
  41. Ginni, G.; Kavitha, S.; Kannah, Y.; Bhatia, S.K.; Kumar, A.; Rajkumar, M.; Gopalakrishnan, K.; Arivalagan, P.; Nguyen, T.; Rajesh, B. Valorization of agricultural residues: Different biorefinery routes. J. Environ. Chem. Eng. 2021, 9, 105435. [Google Scholar]
Figure 1. The proposed conceptual system and its boundary.
Sustainability 15 14297 g001
Figure 2. Stock flow diagram of the SD model.
Sustainability 15 14297 g002
Figure 3. Simulation results of the initial strategy evolution game; (a) simulation results under the current sitauations; (b) results when carbon trading is introduced.
Sustainability 15 14297 g003
Figure 4. Evolution process of the dispatching center deduced by sensitivity analysis. (a) variation of m2; (b) variation of m3; (c) variation of b4; (d) variation of b3.
Sustainability 15 14297 g004
Figure 5. Evolution process of the biogas plant deduced by sensitivity analysis. (a) variation of m3; (b) variation of m2; (c) variation of b4; (d) variation of b3.
Sustainability 15 14297 g005
Table 1. Payoff matrix of the dispatching center and biogas plant.
Game PlayersDispatching Center
Use the Biogas
(X)
Do not Use the Biogas
(1 − X)
Biogas plantImplement DO
(Y)
u1 + a + Q2 + h2 − M1 − M2;Q2 + h2 − M1 − M2;
m1 + r1 − b1 − b2m3 − b4
Not implement DO
(1 − Y)
u1 + Q1 + h1 − C1 − C2;Q1 + h1 − C1 − C2;
m2 + r2 − b2 − b3m3 − b4
Table 2. Eigenvalues of equilibrium points.
(x, y)F11F22
(0, 0)m2 − b2 − b3 + r2 − m3 + b4Q2 + h2 − Q1 − h1 − M1 − M2 + C1 + C2
(0, 1)m1 + r1 + b4 − b1 − b2 − m3Q1 + h1 + M1 + M2 − Q2 − h2 − C1 − C2
(1, 0)b2 + b3 + m3 − m2 − r2 − b4a + Q2 + h2 − Q1 − h1 − M1 − M2 + C1 + C2
(1, 1)b1 + b2 + m3 − m1 − r1 − b4Q1 + h1 + M1 + M2 − a − Q2 − h2 − C1 − C2
Table 3. Key parameters of the model and their measurement process.
Input ParametersNumerical ValuesSources and Measurement Methods
C10.12 million Yuan/aThe substrates used can be calculated by the biogas demand when the DO has not been implemented, in which the 1 m3 of biogas can generate 1.8 KWh electricity, and 1 ton of substrates (here we have taken the livestock manure and wheat straw as the substrates) can produce about 250 m3 of biogas [31]; the concentrative collection and transportation cost of straw is about 80 Yuan/ton.
C226.32 thousand Yuan/aThe Operating and maintenance costs of biogas production are 1% of the initial investment based on the study by Lauer et al. [32].
h159.79 thousand Yuan/aWhen the DO is not implemented, 13% of the hourly generated electricity should be used for self-use [33], from which the saved fees for industrial electricity use can be calculated.
Q10.16 million Yuan/aWe calculated the subsidy for the biogas plant based on the subsidy standard for renewable source 0.25 Yuan/KWh in China.
u10.38 million Yuan/aUnder this scenario, electricity from biogas is directly composing into the power grid, and the local industrial electricity price is 0.657 Yuan/KWh
M10.23 million Yuan/aThe substrates used can be calculated by the biogas demand when DO has been implemented.
M20.18 million Yuan/aWhen DO is implemented, the operating and maintenance costs must consider the increment of biogas storage capacity, the equipped automatic control system and the electricity monitoring system, which account for 2% of the initial investments of biogas plants according to Lauer et al. [32].
h20.14 million Yuan/aIt can be calculated by the hourly electricity demand at this scenario, similar to h1.
Q20.33 million Yuan/aThe biogas plant can receive the subsidy based on the power output, which can be calculated referred to Q1.
a0.38 million Yuan/aThe extraneous income from DO can be calculated by excess power supply through peak-regulating.
b10.75 million Yuan/aCalculated as the electricity consumption under the DO multiplied by the price of electricity.
b20.15 million Yuan/aWhen the dispatching center decides to use the electricity from biogas, it needs to purchase additional 20% of the total energy demand as the reserves to cope with the risk of supply outages.
m10.94 million Yuan/aThe revenue of dispatching center when DO is implemented can be calculated by the time-of-use power price.
r10/0.56 million Yuan/aAs there is no mechanism to transform the social-environmental benefits of distributed renewable energy system into economic returns in the current case region, r1 is assigned to 0. Considering that the carbon trading has been implemented in some regions of China, this study assumes that if the carbon trading is introduced in this region, 1 KWh of electricity can achieve 0.006 t CO2 emission reduction [34], and the surplus carbon emission permit can be sold in the carbon trading market; the price is about 71.1 Yuan/ton.
b30.70 million Yuan/aWhen DO is not implemented, the peak-regulating and complementary to renewable energy will be undertaken by thermal power.
b40.65 million Yuan/aIt is assumed that the gap in electricity demand will be supplied by thermal power in this scenario.
m30.92 million Yuan/aUsers in this region are charged according to the traditional electricity price.
m20.86 million Yuan/aPart of the power will be sold by the price of electricity from biogas.
r20/0.28 million Yuan/aCalculated method can be referred to r1.
Disclaimer/Publisher’s Note: The statements, opinions and data contained in all publications are solely those of the individual author(s) and contributor(s) and not of MDPI and/or the editor(s). MDPI and/or the editor(s) disclaim responsibility for any injury to people or property resulting from any ideas, methods, instructions or products referred to in the content.

