Review

Measuring Circularity in Cities: A Review of the Scholarly and Grey Literature in Search of Evidence-Based, Measurable and Actionable Indicators

1
Circular and Low Carbon Project, International Solid Waste Association, 3013 AK Rotterdam, The Netherlands
2
Institute of Combustion and Power Plant Technology (IFK), University of Stuttgart, 70174 Stuttgart, Germany
3
Springloop Cooperatie UA, 8024 AX Zwolle, The Netherlands
4
Department of Environmental Studies (ES), Antioch University New England, Keene, NH 03431, USA
*
Author to whom correspondence should be addressed.
Sustainability 2023, 15(19), 14302; https://doi.org/10.3390/su151914302
Submission received: 2 August 2023 / Revised: 14 September 2023 / Accepted: 18 September 2023 / Published: 27 September 2023
(This article belongs to the Special Issue Sustainability: Resources and Waste Management)

Abstract

:
Circularity in cities is key to Earth’s sustainable and resource-efficient future. In contrast to the broad framework of circular economy, circularity is a technical concept associated with avoiding disposal and prolonging the useful life of products and materials, and thereby extracting fewer resources. In search of metrics and indicators to measure the impacts of circular processes in cities in real time, the authors reviewed the literature on the circular economy and circularity, in search of evidence-based circularity indicators suitable for cities to use to benchmark the environmental and climate benefits of six waste prevention cascades. This paper reports on a systematic literature review using the PRISMA protocol to screen, evaluate, and review published and grey literature sources. From more than 15,000 papers screened, after application of criteria, fewer than 25 papers were found that presented evidence-based, measurable, and actionable indicators or indicator sets for benchmarking the performance of circular processes in cities. The authors concluded that the practical commitment to evidence-based tracking of circularity (in cities) is weak. Practical progress towards a circular economy and physical and economic circularity will require stakeholders to strengthen and test the very small number of indicators and indicator sets that are relevant and useful for cities and regions to use for measuring their progress towards becoming more circular, and increase evidence-based monitoring for circularity and the circular economy.

1. Introduction

1.1. Circular Economy and Circularity

Circular systems are the default for the Earth’s ecosystem—in fact, almost all natural processes are circular. Examples include the carbon, nitrogen, and water cycles. Life, food, water, and other materials in natural systems continuously cycle regardless of what humans do as a species.
Between 2019 and 2023, the International Solid Waste Association’s Scientific and Technical Committee (STC) commissioned a project called CALC—Circular and Low Carbon Cities. As part of its ambition to identify best and good circular economy initiatives, one of the goals of the CALC project was to produce and disseminate an inventory of benchmarks and indicators that cities and regions could use to measure their progress towards circularity, with the ultimate goal being to be able to evaluate interventions according to whether they would lead towards more or less circularity in the city.
This paper aims to identify available measurement tools that scholars and governmental institutions currently have and use for measuring the available industrial and institutional actions that would allow cities to function more like circular natural systems. It appears that there are surprisingly few measurable, evidence-based indicators in use at this time, and this contributes to the confusion about what should be considered “circular” [1].
Circular economy and circularity are concepts that aim to mimic circular natural systems, where the increased cycling of materials and longer useful lives of products provide a path to shift to a more sustainable, efficient, and climate-friendly economic model.
The circular economy is a theoretically possible economic system that is restorative and regenerative by design [2]. It is a system that preserves and retains value added, keeps resources in use for as long as possible, minimises waste, and contributes to the regeneration of natural systems. Circular economy policies aim to shift companies and policymakers away from traditional linear practices based on the take–make–use–dispose approach. According to some authors, circularity reaches “upstream” to the principles for designing products, systems, and physical processes to close the loop and create a circular economy [3].
In this paper, the authors chose to interpret the concept of circularity as referring to a possible future economic system in which products have longer useful lives, are purchased with care, are regularly maintained, and are suitable for repurposing, reuse, refurbishing, remanufacturing, and material recycling at the end of those longer useful lives.
Circularity represents a change from the current practice in which many products and packages are thrown away shortly after they are “consumed”, and discarded even when they are new and work perfectly, because they are out of style, no longer desired, do not work anymore, or because they were purchased for no particular reason. Circular practices in cities can avoid or mitigate problems associated with traditional linear models of production and consumption, such as the environmental and energy costs of extraction, production, and disposal. Circularity can contribute to preserving natural resources, promoting sustainable consumption and production, and reducing waste. Secondary economic benefits include reduced materials and energy expenditures and increased resource efficiency.

1.2. Circularity in Cities

The literature provides many ideas about the potential for cities to be major drivers of circularity. With more than half of the world’s population living in urban areas, cities play an important role in addressing global challenges such as climate change, resource depletion, and social inequality [4].
Cities are important sites for circularity because they are centres of consumption and production. The density and diversity of stakeholders and the concentration of commercial and public-sector processes in cities facilitate a variety of options for closing loops, connecting materials and processes, lengthening useful life, and avoiding disposal and the greenhouse gas emissions associated with it, as well as those attributable to extracting virgin resources and producing new goods [5].
A number of cities—primarily but not only in Europe—are exploring circularity and developing city-specific circular economy strategies, which include setting targets and developing indicators for circularity.
  • Amsterdam (NL) has developed a circular economy program to become a fully circular city by 2050. The program includes several initiatives to increase resource efficiency and reduce waste, such as circular procurement and promoting circular business models [6].
  • Glasgow (Scotland, UK) has developed a circular economy route map, including indicators to measure progress towards a more circular economy [7]. A set of metrics proposed by Domenech and Borrion [8] quantitatively assess the extent to which circular economy principles are embedded in urban regeneration and waste management practices in the West London region.
  • For the region surrounding and including the City of Porto, Portugal, Cavaleiro de Ferreira and Fuso-Nerini [9] have developed a Circular City Analysis Framework (CCAF) that uses macro- or meso-level indicators to track circularity across a range of sectors.
  • The waste circularity index aims to compare the circularity performance of different waste streams among different EU member states [10].
  • An urban circular (economy) development index (UCDI) provides a score for 40 cities in China [11].
  • A green transition index called the Circular City Index (CCI) determines the circularity of Italian municipalities by benchmarking energy, material, and information flows [12].
In 2023, at the time of this writing, and despite an elevated level of global activity promoting the circular economy, measuring circularity in cities presents serious challenges. Academic and policy documents focusing on political, social, and/or economic issues advocate for circularity and the circular economy as a response to a lack of resource cycling [1], but seldom draw upon evidence at the city or regional level.
The existing academic literature suggests that three main activities would be necessary to develop and operationalise an adequate set of indicators for monitoring circularity. They include:
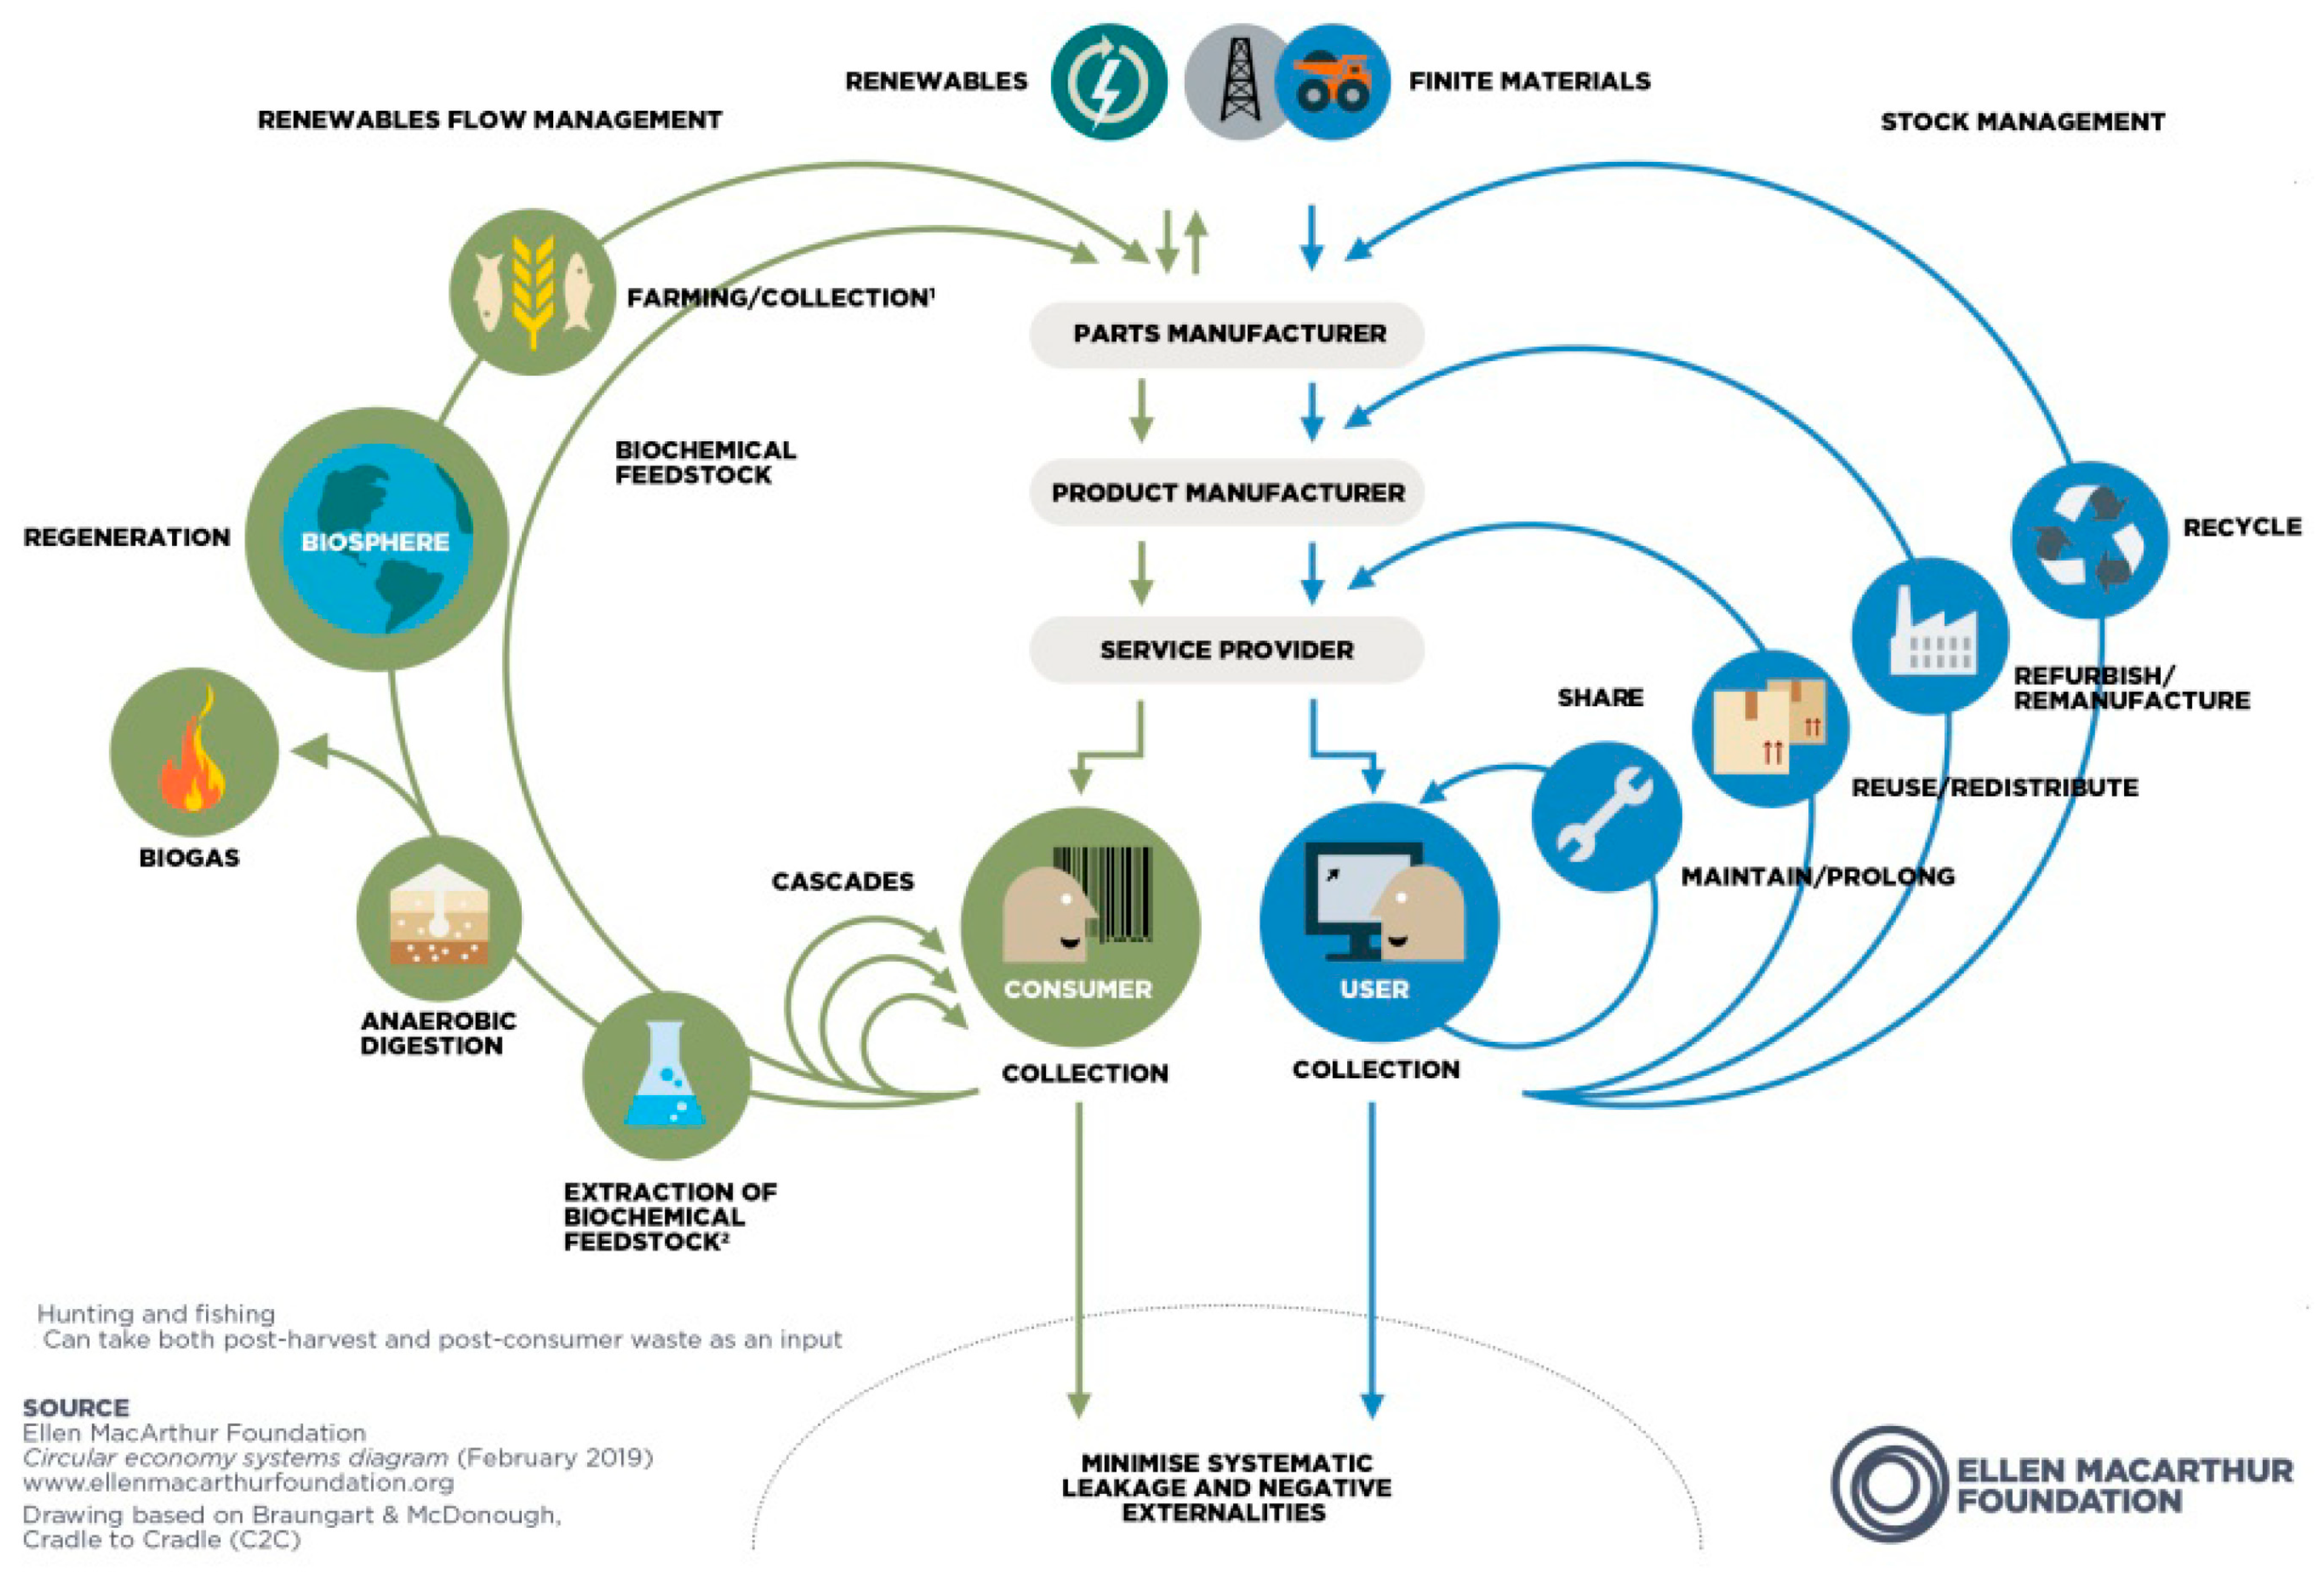
  • Enhanced monitoring of the extraction of natural resources and the balance of renewable and virgin resources to maintain sustainable levels of natural capital [13];
  • Optimisation of consumption processes through the diversion of reusable products, components, and materials from disposal paths. This will depend on the development, trading, and distribution of reusables that meet the highest level of quality [14];
  • Identification, prevention, and monetising of the negative externalities of current extraction and production activities to improve the efficiency of economic and ecological systems and reward sustainable and circular practices [15].
While this level of ambition is certainly worthwhile, it is not immediately clear how to translate it into practical actions in cities. Moreover, the limited availability of high-quality macro-level data for these proposed indicators limits their accuracy and reliability as circularity measurement instruments [16].

1.3. Focus on Six Waste Prevention Cascades

Materials, products, and packaging enter cities, are “consumed”, and become individual property via processes of being placed on the market, distribution, sale, contracting, and direct or indirect consumption. The (privately owned) materials are stocked in the city during the use, reuse, and repair phases. When the owners—users, service providers, or supply chains—no longer choose to continue to possess something, they discard the “something” into city management processes such as disposal or recycling, whether or not it has reached the end of its useful life. At this point, unless there are systems to identify still usable items and divert them to recycling, reuse, or other cascades, the useful life has ended and the materials enter a disposal process.
Alternatively, when the owner or user seeks to keep the product in use by maintaining or repairing it, the product or material can be considered to be cycling through several waste prevention cascades. In any specific city, such processes or cascades combine to form a mixed, private–public city-level management system [12]. In the CALC project of the International Solid Waste Association, these processes have been analysed as consisting of six specific waste prevention cascades, shown in Table 1 and presented in relation to their users and the process stakeholders.
The term cascading is used in circularity and circular economy discourse to describe how products and/or resources pass through specific physical and/or financial R-processes (North American and global cities outside of Europe often prefer to talk about zero waste, rather than the circular economy. The two concepts cover some of the same ground but have some important differences. Although these nuances (and the rhetorical conflicts in the NGO sector) are beyond the scope of this review, the reader is invited to explore these nuances further) that maintain their value and useability [18]. An R-process is one which (usually) begins with the prefix “RE”, such as REuse, REcycle, but also REnt or REfuse. In some articles, these are referred to as the “9-Rs” [19].
Cascading operationalises—in theoretical and empirical terms—the process of deliberately retaining value added. Most cities have most of these R-processes, but only Cascade 4—recycling—is usually considered part of the city’s solid waste system. Table 1 shows the six-cascade framework adopted by the ISWA CALC project. It extends from Cascade −1 (minus one) to Cascade 4. These six cascades roughly correspond to the blue circles on the right-hand side of the “butterfly diagram” shown in Figure 1. When cascaded sequentially, they represent an ideal consecutive flow through a complex set of city processes. When cascading processes are present in cities, and widely used, the city has maximal cycling and is on the way to achieving circularity goals.
In this review, cascading (visually represented in Figure 1 in the Ellen MacArthur Foundation’s “butterfly diagram” [20,21]) serves as an overarching framework to evaluate the extent to which circularity indicators are evidence-based, measurable, and actionable. Following Table 2, “evidence-based” is used to mean that the indicators record facts about processes that are physical, can be observed and photographed, and that materials flow analysis (MFA) can be used to analyse their functioning. “Measurable” means an indicator can be used to measure the passage of products and materials through physical processes in cities. “Actionable” means that the results of this measurement “point to” alternate actions, policies, strategies, or pathways for materials management that can contribute to make the city more circular.
Figure 1. Butterfly diagram published by the Ellen MacArthur Foundation (EMF). Copyright © Ellen MacArthur Foundation [22].
Sustainability 15 14302 g001
The CALC cascade framework puts the multiple R processes into groups based on users, providers, and transaction types. This facilitates mapping the relevant processes for evaluating circularity in real cities in real time. In case a circularity benchmarking exercise indicates a lack of one or more cascade options for a specific product stream in a specific city, these indicators are actionable; they point to specific actions to be taken or indicate that further research can identify the reason for the absence.
Repairing and rebinding books is an example of a Cascade 2 process currently under threat. At the time of writing (in 2023), physical paper books are losing their importance in favour of digital publications. Interestingly, in high-income cities, this has produced a cascade innovation where people give away or “freecycle” books in train stations and other public places. This is an example of how one cascade process is increasing in importance in part because another is decreasing or dying.

1.4. Research Questions for This Paper

This paper reviews the literature in search of evidence-based, measurable, and actionable indicators for circularity cascades, and it is built around three research questions.
1
Research Question 1: How does current scholarship, as reflected in the literature, present evidence-based, measurable, and actionable circularity indicators and metrics for waste prevention cascades in cities?
2
Research Question 2: What can be learned from this scholarship about measuring circular processes in cities?
3
Research Question 3: What is the logic behind the specific indicators identified in the literature that are used to measure waste prevention and circular processes in cities, what methods are used for the measurements, and where have they been tested?

2. Methodology

This review focused on “mining” the scholarly and grey circular economy literature for evidence-based, measurable, and actionable metrics and indicators for circularity in cities. The sources of these indicators and metrics (and the basis for this review) were found in the published scholarly literature and published or unpublished grey literature, including project results. Research on indicators and metrics not focused on cities but which were nevertheless interesting and useful (and evidence-based) were also included.
The authors used the PRISMA protocol for reviewing the published and grey literature. The basis was a series of keyword searches using Boolean operators, for example, “(Circularity) AND (Indicators OR Indices OR Metrics OR Analysis OR Index OR Measure OR Assessment OR Evaluation) AND (Cities OR Region OR Town OR Institutions OR Countries)”. The first round of screening was divided between published works in the Google Scholar and Scopus databases and the grey literature publications from key contributors to the circular economy discourse, such as the Ellen MacArthur Foundation, the International Resource Panel, UN agencies, the OECD, the World Bank, the European Academies’ Science Advisory Council (EASAC), EU portals, and the World Business Council for Sustainable Development (WBCSD) databases. The team also screened articles and reports from universities, sustainability reporting organisations such the Global Reporting Initiative (GRI), and standardisation agencies such as the International and British Standards Organisations (ISO and BSO). “Snowball research” formed a primary methodological basis for identifying publications, supplemented by a network query approach for contacting experts and researchers.
The review of the published academic literature had an initial focus on articles published between 2018 and 2022. The search using the Scopus database resulted in 4014 articles, and the Google Scholar search turned up an additional 11,000, including a small number of duplicates. The authors systematically screened all 15,014 articles, classified them by topic and author, and either eliminated them or accepted them for further analysis.
The main criteria for accepting articles for this review were that they presented and/or analysed indicators, indicator frameworks, or indicator sets that met the definitions of being evidence-based, measurable, and actionable. For the grey literature and project reports, the basis for screening was the eclectic methodology adopted by Noll et al. [23]. The grey literature search also included some documents released and/or produced before 2018. Some additional publications were identified as references in one or more published papers or had been cited in earlier CALC project documents. Successive searches for circularity indicators, reports from key organisations and institutions participating in the discourse about the circular economy and circularity, and snowball research contributed to the list that was screened.

2.1. Primary Search: Academic Databases

Starting with the more than 15,000 articles from Scopus and Google Scholar, plus the grey literature, the authors applied four strict criteria for inclusion in the next stage of the review:
1
The paper, to qualify for inclusion, presents at least one measurable indicator.
2
The indicator or indicators presented are evidence-based.
3
The indicator is suitable for measuring cascade processes at a city level.
4
The indicator measures at least one of the six CALC cascade processes.
The keyword results from the Scopus database produced 4014 papers, from which 201 duplicates were dropped immediately and an additional 3781 were eliminated due to not meeting all of the criteria. The resulting 32 papers were included in this review and analysis.
A parallel search in the Google Scholar database using the same keywords produced 11,000 hits, including 289 duplicates, leading to 92 publications for review.

2.2. Screening the Grey Literature

The team used the key words “circularity and cities measuring standards”, “UN indicators for circularity in cities”, “OECD indicators for circularity in cities”, “EU indicators for circularity”, “Circular indicators developed by universities”, and “Circular indicators cities of global south” to search the grey literature, and identified 67 additional qualifying publications to be analysed, as they featured circularity indicators, indicator frameworks, and methodologies and metrics suitable for measuring the cascades in cities. The screening eliminated any indicators that failed the criteria except when they were judged to be suitable to define and interpret the circularity of cities on some other level.
This preliminary screening produced a list of 191 documents accepted for the Level 2 reviewing process. In Level 2, the authors read each of the documents and applied the selection criteria presented in Figure 2. Papers focusing primarily or exclusively on qualitative observations were rejected in the third screening. The papers included in this review, classified by type and year, are shown in Figure 3.

2.3. Review and Elimination of Articles Not Meeting the Criteria

The papers were reviewed with the goal of finding evidence-based, measurable, and actionable indicators, indicator sets, or frameworks. Table 3 details the screening process for including the final papers for the review. Papers providing suggestions and recommendations for circular economy strategies (as opposed to metrics), or focusing on processes other than the CALC cascades, were classified as out of scope, as were explanatory reviews of circularity indicator frameworks. The team also eliminated publications from the academic, non-academic, and grey literature that focused on the gaps and challenges of circular economy policies. Additional publications were eliminated when they failed to demonstrate an evidence-based circularity measurement approach or to provide at least one indicator useful for cities.

3. Indicator Systems for Benchmarking Circularity in Cities

The early phases of the review showed that “measurability” usually takes one of two forms, as shown in Table 4. These are:
  • Individual indicators that produce a single score or value.
  • Multiple indicators used together in an indicator set, or a framework.
Individual indicators are specific measures that can track the progress in circularity. They can be used alone or combined with the other indicators to provide a more comprehensive picture of circularity.
Some examples of individual indicators for measuring circularity in cities include:
  • Waste Diversion Rates—High waste diversion rates indicate circularity as they reflect more efficient use of resources and reduced waste [24].
  • Material Efficiency—Higher material efficiency indicates less resource use in production, a critical aspect of circularity [25].
An indicator set or indicator framework is a combination of indicators put together by one or more researchers to benchmark multiple aspects of a city or circularity system. Applied together in a unified process, the indicator set provides a composite score that compares the system across countries or regions.

3.1. First-Level Results

All of the papers accepted for review either presented specific individual indicators that met the criteria, or described indicator sets or frameworks consisting of multiple indicators used together. One of the most important (and representative) indicator sets was that of the European Union Circular Economy Framework.
The strict criteria shed interesting light on the European Union Circular Economy Framework (EUCEF), one of the most frequently discussed indicator sets. EU member states use the EUCEF to report circularity at the national level to the European Union. The framework includes ten indicators divided into four categories:
(1)
Production and consumption.
(2)
Waste management.
(3)
Secondary raw materials.
(4)
Competitiveness and innovation (Aceleanu et al. [26]).
The EUCEF indicators are obligatory for EU member states and benchmark their progress in implementing the obligatory Circular Economy Action Plan, assessing national progress using direct observations or measurements of absolute achievements in relation to the circular economy (Fernández-Braña et al. [27]). Recycling is the only cascade that is represented.
Calculating the individual indicators in the EUCEF requires gathering and processing large amounts of (big) data but does not touch any other waste prevention processes. For this reason, our assessment suggested that the EUCEF offers little to cities seeking to understand waste prevention cascades or circularity at the city level.

3.2. Other Multiple-Indicator Systems

Other indicator sets and frameworks assessed during the review offered a variety of lenses through which to view the drivers, agendas, and concepts of the circular city, including the scope of circular ambitions and the specific circular actions pursued in practice. Unlike the EUCEF, direct comparison between cities using these indicators is not (generally) possible, because the frameworks differ in scope and intentions.
The researchers were able to classify the frameworks, indicator sets, and multiple-indicator systems according to three features that most of them shared:
  • Level of abstraction. Some frameworks are broad and high-level, providing overarching principles and goals for promoting circularity in cities. Others are more specific and/or practical and can be used to provide guidance on implementing circular practices in particular sectors or areas [28].
  • Purpose of design or use. Some frameworks aim to guide policy development and decision making at the local or regional level. In contrast, others support cross-sectoral collaboration or encourage private sector involvement in circular economy initiatives [29].
  • Scope and methodology. Some indicator sets limit their scope to specific sectors or aspects of circularity, such as waste management or material flows. Others provide a more holistic view of circularity in a city, encompassing a range of economic, social, and environmental factors [30].
In the literature on multiple-indicator systems, indirect or intentional “soft” indicators were dominant. In Table 5, the authors have classified and grouped the papers on such indicator systems into five themes: economic, social, environmental, legal/governance, and technical and physical, to aid in understanding both intentions and usefulness.
To summarise, the scholarship on measurability is limited, and the commitment to evidence-based tracking of progress towards circularity in cities is rare or difficult to find.

3.3. Classification of Individual Indicators for Circularity Indices

The mix of individual indicators included both stand-alone and complex or composite indicators or indices, which combined measurements in order to reduce multiple data points to a single score or value. Indices allow comparability by producing a comprehensive score of a city’s circularity performance. The sub-indicators used in these indices can be classified based on their alignment with circular economy principles, relevance to specific sectors or areas, methodology, and data availability. Commitment to evidence-based and actionable varied widely in the component individual indicators. The researchers found 18 such indicators, listed in Table 6, which appeared to directly meet the criteria.
Of the indicators listed in Table 6, only seven gave a score that could be compared between cities. Four of these indicators were of direct interest as they were designed to measure cascading in cities. Kapoor [31] discussed the CALC indicator, which produces a score by weighing all of a city’s circular processes, considering extended life and circularity impacts of higher processes such as maintenance. The indicators presented by Kakwani and Kalbar [39] were limited to the water sector only.

3.4. Methodologies behind Multiple-Indicator Systems

In addition to the indicators, this review had a secondary focus on evidence-based benchmarking systems and methodologies. Few methodologies for quantification (Table 7), monitoring, and evaluating the impact of implementing circularity strategies were found in this review. Material flow analysis (MFA) appeared consistently as one of the only measurable approaches for circularity assessments. MFA Sankey diagrams appear to be popular because they are practical communication tools, but it is questionable whether they qualify as measurements; the numbers behind the visuals are not usually provided and that weakens their value as evidence. Material or mass flow diagrams organised in a standard structure create comparable and more clearly measurable indicators of the performance of city processes [45].

3.5. The Influence of Geography on Circularity Indicators

In an attempt to understand the influence of geographic and political factors, the authors classified the qualifying papers by place of origin, based on a hypothesis that the impulse to work on circularity indicators for a city may be related to policy guidelines and practical experiments in the country or region. Figure 4 shows the distribution of publications. The highest number of publications was from the Netherlands (11, mostly from the City of Amsterdam), followed by the UK (5) and China (4). The City of Amsterdam’s circularity assessment was based on three core indicators: value preservation, economic impact, and ecological impact. These core indicators (supported by other indicators) gave an initial idea of how cities could monitor circularity [46].
China has a policy commitment to circular economy, anchored in the “Development Strategy and the Immediate Action Plan of Circular Economy, 2013”. Chinese cities have a goal to achieve a circular economy by enhancing the efficiency of material usage, reducing waste flows, sand promoting recycling. Other cascades are not mentioned but may be implied in the idea of material efficiency. The key element in China’s vision of circularity is ecological civilisation, an intriguing concept even if the definition and degree of measurability remain somewhat unclear.
China has a three-phase circular economy policy for cities and regions. The phasing is based, in part, on the economic value of the materials.
  • Phase 1 focuses on Reduce, Reuse, and Recycle.
  • Phase 2 emphasises new models for production and consumption for government and private enterprises [47].
  • Phase 3 moves in the direction of the Chinese commitment to urban industrial symbiosis with closed systems, with goals to improve GDP, living standards, and general well-being.
London, the capital of the United Kingdom (UK), promotes reliance on a resource-efficient circular economy. They are developing a more flexible and sustainable approach to products, housing, office space, and the critical infrastructure crucial to London’s ability to adapt and grow. In the document ‘Towards a circular economy’, five focus areas for the city are identified, and they include:
  • Built environment.
  • Food.
  • Textiles.
  • EEE (electric and electronic equipment).
  • Plastics.
London’s policy frameworks include collaboration on supply chains between cities at the community level, and policies for improving recycling rates and creating more jobs through reuse, remanufacturing, and materials innovation [48].
The city of Melbourne, Australia, commissioned an assessment of the city services and quality of life in relation to circularity.
The city of Brussels (Belgium, also the capital of the European Union) has a strategy for a circular economy transition being applied in the Brussels-Capital Region. The strategy offers a framework to “encourage the transformation of a linear economy (extract–produce–consume–discard) into a Circular Economy (recover–produce–consume–reuse) within its administrative boundaries” [46,49].
Both Brussels and Recife (Brazil) use economy-wide material flow analysis (EW-MFA), an indicator framework which facilitates an understanding of material cycling in early adopter cities committed to circularity and the circular economy, although it is not a legal requirement.
The International Standards Organization (ISO) and the British Standards Organisation (BSO) have produced standard 37120, which establishes definitions and methodologies for a set of city indicators to steer and measure the delivery of city services and quality of life [50].

3.6. Sectors Represented by City-Level Circularity Indicators

The papers selected for review identified and presented circularity measurements that had been developed for and applied to a broad range of product and material streams, as shown in Figure 5. Some focused on products such as textiles (housewares, clothing, industrial textiles), EEE (electronic and electric equipment), rechargeable batteries, bicycles, books, furniture, and building materials. Others—particularly those focusing on Cascade 4, recycling—zoomed in on materials used to produce rigid and flexible plastics, ferrous and non-ferrous metals, paper, and organic waste. The CALC project’s pending publication on circularity in Muscat, Oman, focuses on cascading for automobiles and mobile telephones.
Circularity indicators for food, water, and other systems could be relevant and applicable to all six cascades that were the focus of this review, as the methods of measurement and analysis appeared to be broadly applicable to various other sectors. This was true even if they had seldom been tested outside of the sector for which they were developed.

4. Results and Conclusions

4.1. It Is All about Recycling

Recycling emerged from this review as the only circular process broadly considered to be measurable and actionable. In total, 61 articles, or around 85% of the accepted papers, presented indicators for recycling. This review produced significantly fewer indicators for the other five cascades, as shown in Figure 6. To be clear, it was not possible to know, from the Prisma methodology, whether measurable indicators for Cascades -1 to 3 were absent from the real-world landscape, or absent from the review because they had not yet become the subject of scholarly research.
Virtually all of the evidence-based, measurable, and actionable circularity and circular economy indicators encountered in this review were created and used for measuring recycling (Cascade 4), even though in some cases the methodology, approach, or definitions could be expanded to other cascades. After some reflection, the authors suggest the following reasons for the dominance of recycling when it comes to indicators that are measurable, evidence based, and actionable [51].
  • Recycling, unlike most of the other cascades, is either within the institutional landscape of solid waste management or closely related to it. The solid waste sector in high-income countries is the sector having the most interest in, and the most “demand for”, recycling. Especially when there are “targets” based in legislation or policy, it is public institutions that are interested in measuring what is being recycled, composted, and otherwise diverted from disposal. So, it is somehow logical that the solid waste sector looks at “its own” experience with Cascade 4 recycling as the basis for expanding to a wider definition of circularity.
  • The broad-based public sector institutional ownership of recycling in high-income countries means that recycling can be easily and reliably measured at several points in the flow of materials under the city’s control, such as:
    • When deposited in a recycling container on the street or in a drop-off centre.
    • When sold to an itinerant buyer or to a junk shop in the value chain.
    • When discharged by a collection vehicle for post-collection sorting.
    • During (separate) collection, in the first process(es) where the collected materials are pre-processed.
    • At the transaction where the materials are sold to a private sector recycler.
    • When reported to regulatory regimes such as the Basel Convention.
Many public institutions in various countries and regions make use of these possibilities for measuring recycling, and so, when asked to measure circularity, they base it on their experience with recycling.
In contrast to recycling, virtually all of the other cascades are normally private sector processes, with the occasional exception of Cascade −1, rental or borrowing systems. Cascade −1 is probably the most difficult to measure, and measurability of its impacts is difficult to conceptualise. The likeliest units of measurement are “rental transactions” or “hours of use”, or other benchmarks which are not possible to measure in an MFA approach.
Measuring Cascades −1, 0, 1, 2, and 3, therefore, depends on the willingness of a range of micro-, small-, medium-, and large-sized private parties to provide data on their operations and participate in monitoring, something which can be complex for a city solid waste authority to organise.
The situation is complicated by the fact, mentioned above, that the term “reuse” lacks a clear definition and is often used in a generic way as referring to all non-recycling cascade processes, especially second-hand trade, but sometimes also to repair and refurbishment.

4.2. Ways of Measuring Recycling and Their Usefulness as Circularity Indicators

The framing and methodological approach to measure recycling does meet all the criteria; it is evidence-based, measurable, and actionable. The following section explores recycling to determine its suitability as a basis for indicators for the other five cascades covered in Figure 6.
Different parts of the world measure recycling based on different types of evidence and interpretations of the same facts. In most of North America, the “recycling rate” is a weight-based “positive” indicator, measured at the point that recycling materials have been collected, pre-processed, and sold or delivered to the value chains. This is a direct evidence-based measurement, usually in tonnes, used for designated recyclables, yard wastes, and sometimes household hazardous wastes. It is actionable in combination with policy-driven recycling or waste prevention targets. Recycling rate calculations are often supported by sub-indicators, such as the relationship between waste delivered for disposal, materials separately collected for recycling, materials delivered to a materials recovery facility (MRF) for pre-processing, residues from pre-processing, and, in the case of kitchen and garden wastes, water weight lost in evaporation or as a result of composting activity.
In addition to “tonnes recycled”, another common indicator is a negative indicator, namely, material or waste “diverted from disposal”. Regarding this scheme, we would say that it is evidence-based, and if the quantities that are going to recycling, reuse, composting, or other cascades are also measured and weighed, then it is measurable as well. In most European Union countries, the recycling rate is modelled, rather than measured, as the difference between the average amount of waste generated per capita (or per household) and the amount per capita (or per household) delivered to a disposal facility. At the time of this writing (2023), in the Netherlands, for example, municipal waste departments and para-statal waste management companies are evaluated based on whether the amount of waste per capita is more (bad) or less (good) than 100 kg per person per year. The aggregate amount actually delivered to the disposal system is used to make the determination and then modelled to arrive at an average per household, which leaves a lot of questions unanswered. With this indicator, it is not possible to know whether the waste goes elsewhere and might (for example) be being littered or incorrectly placed in bins for packaging materials, kitchen and garden waste, or paper. The amounts actually being diverted (in the above Dutch example) are sometimes but not always measured. This way of calculating is evidence-based, but because it relies for some degree on modelling, our team considered it less actionable than the North American “positive” recycling rate calculation [51].

4.3. Some Examples of Evidence-Based, Measurable, and Actionable Indicators for the Other Cascades

Figure 6 shows that “second place” belonged to papers offering indicators for waste prevention (the “refuse” cascade). “Reuse” (Cascade 1 in Table 1) does not have a standard definition in the literature and is often used as an umbrella term, covering repair, second-hand trade, refurbishing, and sometimes even rental or platform share activities. Elbersen et al. [52] indicate that reuse potential can reduce pollution, create jobs in reselling sectors, and minimise waste. Arora et al. [53] uses the term reuse to showcase the potential of water circularity in urban systems, such as wastewater reuse, substitution for primary water supply, and consumption and waste perspectives. Feiferytė-Skirienė and Stasiškienė [54] give some examples of national policies encouraging the use of secondary materials and waste as productive resources, but this is not specifically about reuse.
The authors concluded that the Flemish report entitled Reuse, the Under-studied Circular Economy Strategy is one of the few examples of research in the literature offering methods for quantifying the impact of reuse [55]. The study suggests that some second-hand sales could supplement, rather than replace, new product purchases for the purpose of creating “reserve” or “spare” products for the office or household. Its authors use the term “rebounding” and challenge the assumption that second-hand sales can replace extraction on a one-to-one basis. In the EU, this question of rebounding (and the discounting associated with it) means that reuse indicators are not fully actionable at this time, even though they are evidence-based and measurable.
The socio-economic metabolism (SEM) indicator framework represents an evidence-based approach to circularity that has been used for measuring progress towards the EU’s circular economy goals for the Greek island of Samothraki. That model provides long-term estimates for the dynamics of biophysical stocks, resource use, and material output in terms of waste and emissions through indicators for domestic extraction, imports, exports, and domestically processed output [56]. The SEM framework may be evidence-based if the “long-term estimates” are based on actual measurements (as opposed to assumptions) about stocks and flows, and if the estimates are translated into yearly measurements. This is easier for an island or island nation because imports and exports can be quite precisely measured, but it is not clear from this particular paper whether imports are in fact being measured, monitored, modelled, or estimated (or a combination of these). In any case, the actionability is severely limited unless the government is willing to introduce export/import controls, and this is almost certainly not allowed within the European Union.
The London (UK) Waste and Recycling Board (LWARB) commissioned a study to develop metrics that could measure London’s future progress towards becoming a more circular city [57]. The indicators start with a baseline and are set up to monitor changes in values over time. The report includes the following key thematic areas: resource productivity and consumption, waste generation and recycling, and business and employment opportunities in the CE. There are metrics being used, but not any specific reporting requirements, and the degree of actionability is not clear.
Moreover, an indicator that relies on measuring consumption is complicated because it requires analysing consumption as a process, and this type of analysis is rarely available. In many sectors, put on market is the most widely available measure of consumption. This is the industry metric for what they have produced and sold per country, that is, the total number or volume of products or packages offered for sale in a country. Unfortunately, the way that POM is recorded—by constituent material—does not facilitate following these products or packages in circular processes. Other plausible measurement points include the point of retail sale, the length of time in ownership, the intensity of use, and/or the (apparent) age and condition of products at the time of disposal. But, as the CALC bicycle project [58] showed, measuring the consumption of a bicycle is dependent not only upon its length of time in ownership, but also on defining and measuring or modelling concepts such as intensity of use and frequency of maintenance (Cascade 1).

4.4. Evidence-Based Measurable Indicators in Research

Nearly half of the specific indicators featured in Table 5 above are the result of research alone and have not yet (at the time of this writing) been implemented in practice. The authors of those studies are doing interesting work, looking forward, performing thought experiments and projections, and advocating innovation. Thomlinson [59] examines the potential for circular food systems in four London boroughs through policy analysis combined with a data review that is based on 21 KPIs that evaluate the reduce, reuse, and recycling potentials of food systems, but it is not clear what the KPIs are and how replicable this approach is.
Singkran [43] offers the consumption inefficiency index (CII) to assess the behaviour of owners/users in relation to the consumption of products in five product groups: food, plastic, paper, textiles, and glass. That work follows Thailand’s National Economic and Social Development Plan on urban development, which seeks to determine and steer Bangkok’s consumption patterns. The results of the CII scoring are presented as supporting the improvement of regulations and practices in waste management in Bangkok.
Othman [19] presents a research study to develop indicators for a regional CE index that measures the degree of a country’s transformation from a linear to a circular economy in the Arab region based on the 9R CE framework. Kapoor [31] proposes a scoring indicator for a city’s circularity that has been tested for paper and battery streams in Rotterdam, Nairobi, and Santiago. A similar system was adopted to develop a methodology for indicators for circularity in the use and maintenance of bicycles in the Romanian city of Cluj-Napoca [58].

4.5. The Recyclability Paradox

Readers will notice that this review does not address indicators for recyclability, a concept associated with circularity and circular economy and an important element in the EUCEF [26]. Recyclability indicators have been excluded from this review because, while recyclability is (in principle) measurable, it is neither evidence-based nor actionable under normal circumstances.
That is because, while the technical fact that something (a product, package, or material) is recyclable refers to its physical composition (which is measurable), this says nothing about whether that something will ever enter any city cascade processes. Recyclability is a pre-condition for something to be accepted into a recycling process, but there is no guarantee that it ever will be. Glass or PET packaging—both technically recyclable—can end up on the bottom of the sea; garden and kitchen waste can end up being burned rather than composted or digested. The probability of an object actually entering a physical city recycling process cannot be known unless it is observed in real time. And, therefore, recyclability cannot be considered to be an evidence-based indicator. This recyclability paradox is critical to understanding why circularity must meet measurable, evidence-based, and actionable criteria.

5. Conclusions and Recommendations

It is clear from this review that the kind of practical, empirical indicators that the authors are seeking are scarce. Marjanović [60] concurs that the development of circularity at the city level is still in its infancy and lacks shared definitions and approaches.
Only a tiny fraction of the massive number pf publications on circular economy offer reliable circularity measurements, and even fewer of those are relevant for cities, despite the high level of interest in progressive European cities (and other cities elsewhere in the world) in the circular economy (North American and global cities outside of Europe often prefer to talk about zero waste, rather than the circular economy. These two concepts cover some of the same ground but have some important differences. Although these nuances (and the rhetorical conflicts in the NGO sector) are beyond the scope of this review, the reader is invited to explore these nuances further). Most existing city circularity initiatives are limited to making Sankey diagrams, publishing ambitions, experimenting with pilot activities, and strategizing about policies. Where there are national guidelines and criteria for circularity, as in the Netherlands, there are likely to be practical experiments, but the lack of clear indicators makes them difficult to compare or evaluate.

5.1. Evidence-Based, Measurable, and Actionable Indicators Are a Priority if a Circular Economy Is to Become a Reality

For a local, regional, national, or global circular economy to become a truly operational concept, as well as a climate change abatement strategy, evidence-based, measurable, and actionable indicators are a priority. At this time, few cities have a well-defined quantifiable CE strategy [61], and the word circularity is not commonly linked with the word policy (in some of the discourse, the phrase resource efficiency is used interchangeably or in place of the phrase circular economy).
If it is correct that the circular transition relies on gathering evidence, measuring impacts, and taking action regarding the ways materials and products are used, cascaded, and ultimately disposed, then there is a long way to go. As part of working on their own city-level indicators, cities with circular ambitions can adapt indicators used at the national scale, developed by countries such as Finland, Scotland, and China as part of their national circular economy strategies.

5.2. Cities and Researchers Need to Get Together to Elaborate, Apply, and Test the Measurable Indicators Produced in Research or Thought Experiments

Based on this review, the authors noticed that the research on circularity assessment is promising, but the researchers and the cities are working on separate tracks. Research leading towards more measurable indicators and indicator sets is promising and could support cities in their ambitions to become more circular. Testing, evaluating, and mainstreaming these indicators in ambitious early-adopter, high-recycling, and zero-waste cities offers an opportunity to both the researchers and the cities. If cities are willing to integrate the theoretically interesting indicators into their required reporting systems, progress in evidence-based, measurable, and actionable circular measurement could come quickly. Even for cities where circularity and circular economy reporting already exists, the measurable and actionable indicators found in this review could improve the assessments and offer useful pointers for becoming more circular in the short-, middle-, and long-term.
One interesting opportunity could be to choose priority sectors, and test the existing or proposed indicators in Table 5 in real places and with measurable material streams, if possible in co-operation with the researchers and authors of those studies. In the summer of 2023, the first author of this paper participated in such an exercise in testing the CALC indicators in Muscat, Oman, on two priority streams, automobiles and mobile phones. The process of gathering evidence and sharpening the calculations provided the waste management organisation of Oman, be’ah, with many new insights.
Additional actions that cities and regions can take to benchmark their progress towards becoming more circular include:
1
Investigating their own procurement and use patterns for durable and non-durable goods ranging from electronics to carpets to furniture, using available indicators profiled in this paper. For example, checking whether office furniture or vehicles are being regularly maintained and repaired.
2
Setting up systems for tracking the lengths of the useful lives of durable goods, and comparing these with new warranty policies, enhanced maintenance contracts, and commitments to trading equipment second-hand.
3
Exploring potentials via Cascade −1 for renting or sharing certain supplies and equipment.
4
Introducing reporting requirements for maintenance, recycling, reuse, refurbishing, and Cascade −1 rental or sharing, and comparing these across cities.
5
Where cascading is not possible, providing feedback to the supply chains, especially designers and producers, on where and how their products and materials are losing value and skipping cascades. This could give suppliers to cities deadlines for improving length of life and repairability, introducing more durable design, changing replacement norms and schedules so that products can be used for a longer time, requiring guarantees for a longer period, and in general supporting policies to improve circularity [12].

6. Answers to the Research Questions

6.1. Research Question 1: How Does Current Scholarship, as Reflected in the Literature, Present Indicators and Metrics for Waste Prevention Cascades in Cities?

In the massive pool of English-language work on circularity in cities, only 72 works, out of 15,000, presented indicators and indicator systems that are evidence-based, measurable, and actionable. The level of activity in this field is high, but the authors concluded that measurability is not a primary goal or ambition of most of the stakeholders whose work is featured in the literature. An alternative conclusion is that benchmarking real circular processes in real time and place is so challenging that those doing it have little time to write about it. The authors leave aside the obvious next question: what is the primary goal of the circular economy discourse and policy impulse if it does not focus on evidence, measurability, or action?

6.2. Research Question 2: What Can Be Learned from This Scholarship about Measuring Circular Processes in Cities?

The experience with measuring and benchmarking recycling and integrating the consequences into policy and practice is much more developed for recycling than for any other cascade processes. The authors have a strong hypothesis that this relates to the institutional commitment of public sector stakeholders to achieve recycling targets and reduce waste reaching disposal. If this hypothesis is correct, then one of the key take-aways would be that cities with circularity ambitions need to set binding targets for their citizens, businesses, and own operations, create reporting requirements and measurement systems to follow the progress on the ground, and introduce consequences for when targets are not met. This has the potential to create stronger motivations for researchers and policymakers to develop, test, and use evidence-based, measurable, and actionable indicators and indicator sets. The multiple indicator sets presented in Table 5, and the 18 papers in Table 6 presenting individual indicators, point the way and provide some inspiration and examples for cities.

6.3. Research Question 3: What Is the Logic behind the Specific Indicators Identified in the Literature That Are Being Used to Measure Waste Prevention and Circular Processes in Cities, What Methods Are Used for the Measurements, and Where Have They Been Tested?

The indicator systems that ‘qualified‘ and their associated methodologies all measure a range of elements like budgets for circular activities in cities, jobs created, levels of education about circularity, policies and rules for circularity, and consumer behaviour. The more technical measurements use MFA- and LCA-based approaches to measure or model GHG emissions, energy demand, material flows, input, stocks, and outputs. Even when these types of indicators are evidence-based and measurable, there are few of them that can be understood as actionable. And, the LCA-based measurements in particular can also be contested—one set of stakeholders (such as producers) will interpret the results to prove circularity, while other groups (such as environmental watchdog organisations) will interpret them as maintaining the status quo. From this, the authors were forced to conclude that there are conflicting interests in the circular economy landscape, with some groups of stakeholders interested in taking action and others even more committed to preventing change. In this regard, the circular economy landscape is not so different from many other institutions in the modern world.

Supplementary Materials

The following supporting information can be downloaded at: https://www.mdpi.com/article/10.3390/su151914302/s1. A note of 72 papers reviewed in this paper.

Funding

The CALC project of the International Solid Waste Association’s Scientific and Technical Committee, was partially financed by the NVRD, the Dutch Association of (Public) Waste Management Institutions, and this funding has also contributed to the research and writing of this paper. Other than that, this research received no external funding.

Informed Consent Statement

Not applicable.

Data Availability Statement

Conflicts of Interest

The authors declare no conflict of interest.

References

  1. United Nations. Sustainable Development Goals Report 2020; United Nations: San Francisco, CA, USA, 2020. [Google Scholar]
  2. European Commission. The Circular Economy Action Plan. 2020. Available online: https://ec.europa.eu/environment/circular- (accessed on 5 February 2023).
  3. Geissdoerfer, M.; Savaget, P.; Bocken, N.M.P.; Hultink, E.J. The Circular Economy—A new sustainability paradigm? J. Clean. Prod. 2017, 143, 757–768. [Google Scholar] [CrossRef]
  4. United Nations. Sustainable Development Goals Report 2018; United Nations Pubns: New York, NY, USA, 2018. [Google Scholar]
  5. Tsui, T.; Peck, D.; Geldermans, B.; van Timmeren, A. The Role of Urban Manufacturing for a Circular Economy in Cities. Sustainability 2021, 3, 23. [Google Scholar] [CrossRef]
  6. Duncan-Cox, C. Circular Amsterdam. Evaluating the Sustainability of a Pioneering Circular City; Cameron Duncan-Cox: Atlanta, Georgia, 2021. [Google Scholar]
  7. Zero Waste Scotland. Zero Waste Scotland. 2023. Available online: https://www.zerowastescotland.org.uk/resources/circular-glasgow (accessed on 5 February 2023).
  8. Domenech, T.; Borrion, A. Embedding Circular Economy Principles into Urban Regeneration and Waste Management: Framework and Metrics. Sustainability 2022, 14, 1293. [Google Scholar] [CrossRef]
  9. Cavaleiro de Ferreira, A.; Fuso-Nerini, F. A Framework for Implementing and Tracking Circular Economy in Cities: The Case of Porto. Sustainability 2019, 11, 1813. [Google Scholar] [CrossRef]
  10. Colasante, A.; D’Adamo, I.; Morone, P.; Rosa, P. Assessing the circularity performance in a European cross-country comparison. Environ. Impact Assess. Rev. 2022, 93, 106730. [Google Scholar] [CrossRef]
  11. Wang, N.; Lee, J.C.K.; Zhang, J.; Chen, H.; Li, H. Evaluation of Urban circular economy development: An empirical research of 40 cities in China. J. Clean. Prod. 2018, 180, 876–887. [Google Scholar] [CrossRef]
  12. Muscillo, A.; Re, S.; Gambacorta, S.; Ferrara, G.; Tagliafierro, N.; Borello, E.; Rubino, A.; Facchini, A. Circular City Index: An Open Data analysis to assess the urban circularity preparedness of cities to address the green transition—A study on the Italian municipalities. arXiv 2021, arXiv:2109.10832. [Google Scholar]
  13. Nasr, N.; Hilton, B.; Kreiss, C.; Russell, J.; Gries, N.; Bringezu, S.; Hellweg, S. Redefining Value. The Manufacturing Revolution. Remanufacturing, Refurbishment, Repair and Direct Reuse in the Circular Economy. A Report of the International Resource Panel; United Nations Environment Programme: Nairobi, Kenya, 2018. [Google Scholar]
  14. Selim, A.M.; Saeed, D.M. Infrastructure Projects for Green Cities between Implementation Challenges and Efficiency Indicators. Civ. Eng. Archit. 2021, 9, 347–356. [Google Scholar] [CrossRef]
  15. Peng, Q.; Lin, W. Measurement and Analysis of Ecological Efficiency in Fujian Province Based on DEA-Malmquist Index Model. IOP Conf. Ser. Earth Environ. Sci. 2021, 692, 32074. [Google Scholar] [CrossRef]
  16. Korhonen, J.; Honkasalo, A.; Seppälä, J. Circular Economy: The Concept and its Limitations. Ecol. Econ. 2018, 143, 37–46. [Google Scholar] [CrossRef]
  17. CALC Project Presentations 2022. Available online: www.iswa.org (accessed on 1 January 2023).
  18. Campbell-Johnston, K.; Vermeulen, W.J.V.; Reike, D.; Brullot, S. The Circular Economy and Cascading: Towards a Framework. Resour. Conserv. Recycl. 2020, 7, 100038. [Google Scholar] [CrossRef]
  19. Othman, A. Towards a Circular Economy in The Arab Region: Development of Transformation Measurement Index; Arab Monetary Fund: Abu Dhabi, United Arab Emirates, 2022. [Google Scholar]
  20. EMF. Material Circularity Indicator (MCI). 2019. Available online: https://ellenmacarthurfoundation.org/material-circularity-indicator (accessed on 5 February 2023).
  21. EMF. Measure Business Circularity: Circulytics. EMF. 2022. Available online: https://ellenmacarthurfoundation.org/resources/circulytics/overview (accessed on 5 February 2023).
  22. Ellen MacArthur Foundation. Circular Economy Systems Diagram. Available online: www.ellenmacarthurfoundation.org (accessed on 4 February 2023).
  23. Noll, D.; Lauk, C.; Haas, W.; Singh, S.J.; Petridis, P.; Wiedenhofer, D. The sociometabolic transition of a small Greek island: Assessing stock dynamics, resource flows, and material circularity from 1929 to 2019. J. Ind. Ecol. 2022, 26, 577–591. [Google Scholar] [CrossRef]
  24. EMF. Circular Economy Introduction. Available online: https://ellenmacarthurfoundation.org/topics/circular-economy-introduction/overview (accessed on 5 February 2023).
  25. EU. More from Less—Material Resource Efficiency in Europe. 2015 Overview of Policies, Instruments and Targets in 32 Countries; EEA Report; EUR-OP: Luxembourg, 2016. [Google Scholar]
  26. Aceleanu, M.I.; Serban, A.C.; Suciu, M.-C.; Bitoiu, T.I. The Management of Municipal Waste through Circular Economy in the Context of Smart Cities Development. IEEE Access 2019, 7, 133602–133614. [Google Scholar] [CrossRef]
  27. Fernández-Braña, Á.; Sousa, V.; Dias-Ferreira, C. Are municipal waste utilities becoming sustainable? A framework to assess and communicate progress. Environ. Sci. Pollut. Res. Int. 2019, 26, 35305–35316. [Google Scholar] [CrossRef]
  28. European Commission. Report from the Commission to the European Parliament, the Council, the European Economic and Social Committee and the Committee of the Regions the implementation of the Circular Economy Action Plan. Available online: https://ec.europa.eu/environment/pdf/circular-economy/report_implementation_54_actions.pdf (accessed on 5 February 2023).
  29. Kaza, S.; Yao, L.; Bhada-Tata, P.; van Woerden, F.A.; Ionkova, K. What a Waste 2.0. A Global Snapshot of Solid Waste Management to 2050; Urban Development Series; World Bank Group: Washington, DC, USA, 2018. [Google Scholar]
  30. Circle Economy. Available online: https://www.circle-economy.com/digital/circle-city-scan-tool (accessed on 5 February 2023).
  31. Kapoor, K. Cities Approach on Circular and Low Carbon Economy. A Study to Test Methodology for Scoring and Implementing Circularity in the World Cities; Technical University of Munich: Munich, Germany, 2021. [Google Scholar]
  32. Kasztelan, A. How Circular Are the European Economies? A Taxonomic Analysis Based on the INEC (Index of National Economies’ Circularity). Sustainability 2020, 12, 7613. [Google Scholar] [CrossRef]
  33. Plastinina, I.; Teslyuk, L.; Dukmasova, N.; Pikalova, E. Implementation of Circular Economy Principles in Regional Solid Municipal Waste Management: The Case of Sverdlovskaya Oblast (Russian Federation). Resources 2019, 8, 90. [Google Scholar] [CrossRef]
  34. Wang, H.; Schandl, H.; Wang, X.; Ma, F.; Yue, Q.; Wang, G.; Wang, Y.; Wei, Y.; Zhang, Z.; Zheng, R. Measuring progress of China’s circular economy. Resour. Conserv. Recycl. 2020, 163, 105070. [Google Scholar] [CrossRef]
  35. Zore, Ž.; Čuček, L.; Kravanja, Z. Synthesis of sustainable production systems using an upgraded concept of sustainability profit and circularity. J. Clean. Prod. 2018, 201, 1138–1154. [Google Scholar] [CrossRef]
  36. Smitha, J.S.; Thomas, A. Integrated Model and Index for Circular Economy in the Built-Environment in the Indian Context. Constr. Econ. Build. 2021, 21, 198–220. [Google Scholar] [CrossRef]
  37. Clodniţchi, R.; Tudorache, O. Resource efficiency and decarbonisation of economies in the European Union. Manag. Mark. Chall. Knowl. Soc. 2022, 17, 139–155. [Google Scholar] [CrossRef]
  38. Havas, V.; Falk-Andersson, J.; Deshpande, P. Small circles: The role of physical distance in plastics recycling. Sci. Total Environ. 2022, 831, 154913. [Google Scholar] [CrossRef] [PubMed]
  39. Kakwani, N.S.; Kalbar, P.P. Measuring urban water circularity: Development and implementation of a Water Circularity Indicator. Sustain. Prod. Consum. 2022, 31, 723–735. [Google Scholar] [CrossRef]
  40. Kayal, B.; Abu-Ghunmi, D.; Abu-Ghunmi, L.; Archenti, A.; Nicolescu, M.; Larkin, C.; Corbet, S. An Economic Index for Measuring Firm’s Circularity: The Case of Water Industry. J. Behav. Exp. Financ. 2019, 21, 123–129. [Google Scholar] [CrossRef]
  41. Madaster. Madaster Circularity Indicator; Madaster Services B.V.: Utrecht, The Netherlands, 2018. [Google Scholar]
  42. Mantalovas, K.; Di Mino, G. Integrating Circularity in the Sustainability Assessment of Asphalt Mixtures. Sustainability 2020, 12, 594. [Google Scholar] [CrossRef]
  43. Singkran, N. Assessment of urban product consumption and relevant waste management. J. Mater. Cycles Waste Manag. 2020, 22, 1019–1026. [Google Scholar] [CrossRef]
  44. UNEP. Food Waste Index Report 2021; UNEP: Nairobi, Kenya, 2021. [Google Scholar]
  45. Tanzer, J.; Rechberger, H. Setting the Common Ground: A Generic Framework for Material Flow Analysis of Complex Systems. Recycling 2019, 4, 23. [Google Scholar] [CrossRef]
  46. Urban Agenda Partnership on Circular Economy. Indicators for Circular Economy (CE) Transition in Cities. Issues and Mapping Paper; Urban Agenda for the EU: Brussels, Belgium, 2019. [Google Scholar]
  47. US Chamber of Commerce. 2017. Available online: https://www.uschamberfoundation.org/event/2017-sustainability-and-circular-economy-summit (accessed on 5 February 2023).
  48. Luomi, M.; Yilmaz, F.; Alshehri, T.; Howarth, N. The Circular Carbon Economy Index—Methodological Approach and Conceptual Framework; King Abdullah Petroleum Studies and Research Center: Riyadh, Saudi Arabia, 2021. [Google Scholar]
  49. Papangelou, A.; Achten, W.M.J.; Mathijs, E. Phosphorus and energy flows through the food system of Brussels Capital Region. Resour. Conserv. Recycl. 2020, 156, 104687. [Google Scholar] [CrossRef]
  50. ISO 37120:2018; Sustainable Cities and Communities—Indicators for City Services and Quality of Life. International Organization for Standardization: London, UK, 2018.
  51. Scheinberg, A.; Wilson, D.C.; Ljiljana, R. Solid Waste Management in the World’s Cities; UN-Habitat: Nairobi, Kenya, 2010. [Google Scholar]
  52. Elbersen, W.; Schultze-Jena, A.; Berkum, S.; Dengerink, J.; Naranjo-Barrantes, M.; Obeng, E. Identifying and Implementing Circular Applications of Agri-Residues: A Circular Evaluation Framework for Assessing Impacts and Circularity of Different Agri-Residue Applications; Wageningen Food & Biobased Research: Wageningen, The Netherlands, 2022. [Google Scholar]
  53. Arora, M.; Yeow, L.W.; Cheah, L.; Derrible, S. Assessing water circularity in cities: Methodological framework with a case study. Resour. Conserv. Recycl. 2022, 178, 106042. [Google Scholar] [CrossRef]
  54. Feiferytė-Skirienė, A.; Stasiškienė, Ž. Seeking Circularity: Circular Urban Metabolism in the Context of Industrial Symbiosis. Sustainability 2021, 13, 9094. [Google Scholar] [CrossRef]
  55. Delanoeije, J.; Bachus, K. Reuse. The Understudied Circular Economy Strategy; HIVA-KU Leuven: Leuven, Belgium, 2020. [Google Scholar]
  56. Nikanorova, M.; Stankevičienė, J. Development of environmental pillar in the context of circular economy assessment: Baltic Sea Region case. Entrep. Sustain. Issues 2020, 8, 1209–1223. [Google Scholar] [CrossRef]
  57. LWARB. London’s Circular Economy Route Map; London Waste and Recycling Board: London, UK, 2017. [Google Scholar]
  58. CALC Project. CALC Research Report. Circularity Assessment of Bicycles in Cluj-Napoca; CALC: Leipzig, Germany, 2021. [Google Scholar]
  59. Thomlinson, M. The Potential for a Circular Food System in an Urban Environment—The Case of Four South London Boroughs; University College London: London, UK, 2020. [Google Scholar]
  60. Marjanović, M.; Wuyts, W.; Marin, J.; Williams, J. Uncovering the Holistic Pathways to Circular Cities—The Case of Alberta, Canada. Highlights Sustain. 2022, 1, 65–87. [Google Scholar] [CrossRef]
  61. Dhawan, P. Circular Economy Guidebook for Cities; CSCP: Wuppertal, Germany, 2020. [Google Scholar]
  62. Atkins, F.; Flügel, T.; Hugman, R. The urban water metabolism of Cape Town: Towards becoming a water sensitive city. S. Afr. J. Sci. 2021, 117, 1–11. [Google Scholar] [CrossRef]
  63. Aziz, R.; Fitria, D.; Ruslinda, Y. Environmental Impact Evaluation of Improved Market Waste Processing as Part of Municipal Solid Waste Management System Using Life Cycle Assessment Method. Ecol. Eng. Environ. Technol. 2022, 23, 60–69. [Google Scholar] [CrossRef] [PubMed]
  64. CALC Project. CALC Presentation for ISWA World Congress; ISWA: Singapore, 2022. [Google Scholar]
  65. Cham, O.M.; Bojang, O.M. Cultural History of Sukuta; Ousman Muhammed Cham & Ousman Mamakeh Bojang: Sukuta, The Gambia, 2016. [Google Scholar]
  66. Constantinescu, A.; Platon, V.; Surugiu, M.; Frone, S.; Antonescu, D.; Mazilescu, R. The Influence of Eco-Investment on E-Waste Recycling-Evidence from EU Countries. Front. Environ. Sci. 2022, 10, 928955. [Google Scholar] [CrossRef]
  67. Diaz-Balteiro, L.; Romero, C.; García de Jalón, S. An analysis of the degree of circularity of the wood products industry in Europe. J. Ind. Ecol. 2022, 26, 1350–1363. [Google Scholar] [CrossRef]
  68. Ekins, P.; Domenech, T.; Drummond, P.; Bleischwitz, R.; Hughes, N.; Lotti, L. The Circular Economy: What, Why, How and Where; The OECD Centre for Entrepreneurship: Paris, France, 2019. [Google Scholar]
  69. EPA. National Waste Statistics Summary Report for 2020. 2022. Available online: https://www.epa.ie/publications/monitoring--assessment/waste/national-waste-statistics/national-waste-statistics-summary-report-2020.php (accessed on 5 February 2023).
  70. EU. Circular Economy Action Plan. For a Cleaner and More Competitive Europe; Publications Office of the European Union: Luxembourg, 2020. [Google Scholar]
  71. Haupt, M.; Hellweg, S. Measuring the environmental sustainability of a circular economy. Environ. Sustain. Indic. 2019, 1–2, 100005. [Google Scholar] [CrossRef]
  72. Ikiz Kaya, D.; Dane, G.; Pintossi, N.; Koot, C.A.M. Subjective circularity performance analysis of adaptive heritage reuse practices in the Netherlands. Sustain. Cities Soc. 2021, 70, 102869. [Google Scholar] [CrossRef]
  73. De Jesus, A.; Antunes, P.; Santos, R.; Mendonça, S. Eco-innovation pathways to a circular economy: Envisioning priorities through a Delphi approach. J. Clean. Prod. 2019, 228, 1494–1513. [Google Scholar] [CrossRef]
  74. Koppelmäki, K.; Helenius, J.; Schulte, R.P.O. Nested Circularity in food systems: A Nordic case study on connecting biomass, nutrient and energy flows from field scale to continent. Resour. Conserv. Recycl. 2021, 164, 105218. [Google Scholar] [CrossRef]
  75. De Kraker, J.; Kujawa-Roeleveld, K.; Marcelo, J.V.; Pabón-Pereira, C. Decentralised Valorization of Residual Flows as an Alternative to the Traditional Urban Waste Management System: The Case of Peñalolén in Santiago de Chile. Sustainability 2019, 11, 6206. [Google Scholar] [CrossRef]
  76. Li, J.; Ding, J.; Zhang, Y.; Li, S. Study on spatial-temporal characteristics and influencing factors of urban environmental resource efficiency in the Yangtze River Basin of China. Front. Environ. Sci. 2022, 10, 997605. [Google Scholar] [CrossRef]
  77. Liu, X.; You, S.; Liu, H.; Yuan, B.; Wang, H.; James, E.K.; Wang, F.; Cao, W.; Liu, Z.K. Diversity and Geographic Distribution of Microsymbionts Associated with Invasive Mimosa Species in Southern China. Front. Microbiol. 2020, 11, 563389. [Google Scholar] [CrossRef] [PubMed]
  78. Lonca, G.; Lesage, P.; Majeau-Bettez, G.; Bernard, S.; Margni, M. Assessing scaling effects of circular economy strategies: A case study on plastic bottle closed-loop recycling in the USA PET market. Resour. Conserv. Recycl. 2020, 162, 105013. [Google Scholar] [CrossRef]
  79. Muñoz, H.; Esteban, M.; Novak, M.; Gil, S.; Dufourmont, J.; Goodwin Brown, E.; Confiado, A.; Nelemans, M. Tracking a Circular Economy Transition Through Jobs: Method Development and Application in Two Cities. Front. Sustain. Cities 2022, 3, 787076. [Google Scholar] [CrossRef]
  80. Pamučar, D.; Behzad, M.; Božanić, D.; Behzad, M. Designing a fuzzy decision support framework for assessing solid waste management in the South European region. Environ. Sci. Pollut. Res. Int. 2022, 29, 42862–42882. [Google Scholar] [CrossRef]
  81. Papangelou, A.; Mathijs, E. Assessing agro-food system circularity using nutrient flows and budgets. J. Environ. Manag. 2021, 288, 112383. [Google Scholar] [CrossRef]
  82. Przydatek, G. Assessment of changes in the municipal waste accumulation in Poland. Environ. Sci. Pollut. Res. Int. 2020, 27, 25766–25773. [Google Scholar] [CrossRef]
  83. Talens Peiró, L.; García Fernández, B.; I Durany, X.G. Investigating a repair workshop: The reuse of washing machines in Barcelona. Sustain. Prod. Consum. 2022, 29, 171–179. [Google Scholar] [CrossRef]
  84. UN. SDG 11.6.1. 2015. Available online: https://unstats.un.org/wiki/display/sdgehandbook/indicator+11.6.1 (accessed on 1 January 2020).
  85. Zisopoulos, F.K.; Schraven, D.F.J.; De Jong, M. How robust is the circular economy in Europe? An ascendency analysis with Eurostat data between 2010 and 2018. Resour. Conserv. Recycles. 2022, 178, 106032. [Google Scholar] [CrossRef]
Figure 2. Overview of the screening process.
Sustainability 15 14302 g002
Figure 3. Selected literature statistics: (a) published papers and grey literature; (b) selected publications by year.
Sustainability 15 14302 g003
Figure 4. The national origin of circularity indicators and benchmarking systems.
Sustainability 15 14302 g004
Figure 5. Sectoral distribution of the indicators in the reviewed papers.
Sustainability 15 14302 g005
Figure 6. Incidence of specific indicators relevant to the six waste prevention cascades.
Sustainability 15 14302 g006
Table 1. Six waste prevention cascades elaborated in the ISWA CALC project.
Cascade ProcessesUsersService Providers/Stakeholders
Cascade −1
(minus one):
Refuse, Rent, Share
Are not owners, cannot or do not want to be, do not have space or skills, occasional use is enough.Platform sharing (Uber, Airbnb, CityBike), rental companies, insurers, platforms, neighbours, OE (new) dealers, libraries, rent-a-tool, costume rent.
Cascade 0 (zero):
Maintenance
Owners or users having a certain level of knowledge, skill, interest, motivation, and/or access to providers of tools, parts, maintenance, instruction, trade-in, or direct services.Dry cleaners and tailors, shoemakers, “handymen”, those in domestic service, social enterprises, retailers (bike and mobile phone shops), garages, small parts suppliers, grandfathers and grandmothers, skilled or knowledgeable owners.
Cascade 1:
Re-buy, Second-hand sales
Potential users who prefer not to buy new and choose to buy second-hand for their needs/utility. Auction houses, private sellers, internet trading (E-bay, Ali Baba), antique traders, NGOs, churches, charities, vintage clothiers, second-hand shops, private traders, charity shops, flea and open markets.
Cascade 2:
Repair
As original owners, consumers looking for inexpensive but specific options.Professionals and/or hobbyists restoring and returning products or materials to original functionality and use, charity repair cafés.
Cascade 3:
Refurbish
Buyers, renters, retailers, and institutional users of products or parts restored to compete with the original equipment.Licensed refurbishers, remanufacturers, re-installers, OEM service providers, hobbyists, social workplaces, auctioneers.
Cascade 4:
Recycle
Secondary materials traded, replacing extraction, production, and value added.Cities, waste service providers, recycling units.
Source: [17].
Table 2. Key definitions.
TermDefinition
Evidence-basedThe inputs to calculate the indicator can be witnessed, counted, and measured in real time and physical space, or they can be drawn from documents such as reports that are supported by previous measurements.
Measurable
Indicator
It is possible to count or document the quantity, type, and number of materials or products that pass through city cascade processes. This is a high standard and excludes—deliberately—a very large number of the circularity indicators in the literature, which “measure” or count intentions, actions, events, policy documents, people, laws, meetings, and the like. In some cases, we chose to include evidence-based and measurable indicators that, instead of materials, are focused on the number of employees, number and type of operations, and/or amounts of money. We excluded indicators whose numbers are estimated, imagined, prescribed, predicted, or stated without reference to any physical coordinates.
Measurable
Process or
Intervention
It is possible to measure, count, or analyse the availability and number of specific, operating cascade processes in a city and the number of tonnes or items passing through them daily, weekly, or annually. A statement by a CEO about an intention to change to circular packaging is interesting, and in a court of law it might be evidence, but in relation to circularity it is neither measurable nor actionable.
ActionableActionable is used in this paper to mean that the indicator values will change when and if a city takes specific action in relation to circularity. For example, an indicator that measures and establishes evidence that 20% of the metal found in the residual waste (going to a waste-to-energy incinerator) consists of working electronic devices is actionable because the city can control what is accepted as residual waste and/or require its incineration service provider to take steps to remove devices before burning, and there is an alternative destination available (or one could be created)
Table 3. Selection and screening process for evidence-based, measurable, actionable, and cities.
Phase of
Research
Paper Focus, Contents, and CriteriaExcludeInclude
Primary
Accept paper if it:
  • is not a duplicate
  • provides qualitative or quantitative interpretations or outputs during preliminary screening
  • is applicable at a level of cities and institutions
  • does not derive from/replicate a previous work
  • is relevant to at least one cascade
  • presents an indicator, methodology, or framework
Not
Applicable
191
Secondary
Reject paper if it:
presents a discussion on needs, gaps, design phase, or consumption patterns65126
Tertiary
Accept paper if it:
provides quantitative interpretations or outputs5472
Tertiary
Accept paper if it:
demonstrates evidence-based measurement of circularity through process flow or material balance approach072
Table 4. Two approaches to measurability found during the review.
Multiple-Indicator Systems:
frameworks or indicator sets54
Individual indicators 18
Table 5. Key features of multiple-indicator systems to measure circularity.
ThemeKey Measurements by IndicatorsRelation to Circularity
EconomicBudgets and investments for city circular activities.Assess the city’s commitment to promoting circularity but do not make a convincing case to measure the transition towards circularity.
Social and GenderJobs created by circular activities in cities.
Education on circularity.
Claim to represent some kind of indicator of level of economic activity, but in practice are more likely to be about the institutional characteristics of the city itself.
EnvironmentGHG emissions and renewable energy.Indicators of share of energy that is renewably generated claim to be indirect measurements of circularity. Those reviewed lack precision as to what is meant by GHG measurements and do not necessarily make a clear link with circular processes.
Legal and GovernancePolicies/laws/targets for city circularity. Indicators are about the ecosystem but do not connect to actual progress in circularity.
Technical and PhysicalMaterial flows, inputs, stocks, and outputs by MFA-based approaches; recycling and waste hierarchy.Well related, but the focus is limited to recycling. Intentions are stated to measure reuse, but neither cascades nor operations are clearly defined.
Table 6. Individual indicators found in this review.
ReferenceIndicator NameDetailsSectoral
Focus
Comparable
(Yes/No)
Colasante [10] Waste Circularity Index (WCI)Waste Circularity Index (WCI) to quantify waste management performance.Built
environment
Yes
Kapoor [31] CALC IndicatorMeasures performance of circular cascade process in the city.Multiple
sectors
Yes
Kasztelan [32] Index of National Economies’ Circularity (INEC)Facilitates ranking of countries based on their circularity performance through INEC.Multiple
sectors
Yes
Muscillo et al. [12] Circular City
Index
Index to assess cities’ circularity and green transition potential.E-wasteYes
Othman [19] CE IndexAssesses circular transition potential at country level.Multiple
sectors
Yes
Plastinina et al. [33] Circular Economy Development Index CEDI)Assesses the development level of circular economy in the region.Municipal solid wasteYes
Wang et al. [34] Urban Circular
Development
Index (UCDI)
Evaluates cities in China and produces circularity score for cities.Resource consumptionYes
Zore et al. [35] Sustainability ProfitEco- and social profit analysis as a decision-support tool for evaluating sustainable production systems.Multiple
sectors
No
JS and Thomas [36] Circular Economy Potential Index (CEPI)Measures circularity potential in construction materials.EEE, end-of-life vehicles, municipal solid wasteNo
Clodniţchi and Tudorache [37] Resource Efficiency and GHG Emission IndicatorsMeasures EU member states’ carbon and resource intensity.Resource
consumption
No
EMF [20] Material Circularity IndicatorMeasures product- and company-level circularity, for internal reporting, procurement, and as a criterion for design decisions.Multiple
sectors
No
Havas et al. [38] Small Circle
Indicator
Calculates circularity indicators in the plastic waste management sector.Multiple
sectors
No
Kakwani and Kalbar [39] Water Circularity Indicator (WCI)Assesses and monitors the circularity of urban water flows, useful by example.Heating/cooling systemsNo
Kayal et al. [40] Circonomics
Index
Measures the circularity of the wastewater sector, based on the environmental benefits of the treatment process and the reuse and recycling efficiency of the wastewater treatment plant (WWTP).Agri-foodNo
Madaster [41] Madaster
Circularity
Indicator
Assigns a circularity score to buildings and measures the circularity of both technical and biological lifecycles.Construction
sector
No
Mantalovas and Di Mino [42] Environmental Sustainability and Circularity IndicatorMeasures circular flows in recycling and
the use of recycled materials and their
environmental impacts.
Product
wise
No
Singkran [43] Consumption Inefficiency IndexEvaluates the consumption performance of Bangkok city for various product groups.FoodNo
UNEP [44] Food Waste
Index
Provides insights into the scale of food waste, establishes baselines, and tracks progress in meeting the SDG target 12.3.FoodNo
Table 7. Classification and analysis of indicator set methodologies.
MethodologyNumber of PapersApproachesAdvantages of UseDisadvantages of Use
MFA21Material footprintThe MFA approach has the most direct relevance for CE indicators specifying and quantifying material flows within a system.Data availability for higher R flows.
LCA4GHG footprintLCA helps assess CE strategies’ environmental impacts and facilitates identifying the least environmentally burdensome choices.Lack of consensus in the LCA community on terminology, technical and scientific shortcomings in assessing CE strategies.
Survey and observation38Multiple correspondence analysis, consolidated frameworks, literature reviewReduces the need for assumptions in CE assessment and allows a reflective understanding through broader involvement of relevant stakeholder opinions.Quantifying circular processes is impossible, there is difficulty in gathering data, and there is a lack of support and transparency of target entities in sharing information.
Mathematical modelling9Econometric analysis, Malmquist Index Model, MACBETH linear modelCan help identify how various factors such as legal, economic, innovation, environmental awareness, etc., can influence CE transitions.The authenticity of data used in the analysis and assumptions made may impact the accuracy and consistency of results.
Disclaimer/Publisher’s Note: The statements, opinions and data contained in all publications are solely those of the individual author(s) and contributor(s) and not of MDPI and/or the editor(s). MDPI and/or the editor(s) disclaim responsibility for any injury to people or property resulting from any ideas, methods, instructions or products referred to in the content.

