Article

SPOT: A Strategic Life-Cycle-Assessment-Based Methodology and Tool for Cosmetic Product Eco-Design

1
L’Oréal Research & Innovation, 1 Avenue Eugène Schueller, 93600 Aulnay-Sous-Bois, France
2
CIRAIG, Department of Chemical Engineering, Polytechnique Montreal, 3333 Queen Mary Rd Suite 310, Montreal, QC H3V 1A2, Canada
3
Quantis, 15 Rue de Cléry, 75002 Paris, France
4
L’Oréal Opérations, 9 Rue Pierre Dreyfus, 92110 Clichy, France
*
Author to whom correspondence should be addressed.
Sustainability 2023, 15(19), 14321; https://doi.org/10.3390/su151914321
Submission received: 14 August 2023 / Revised: 6 September 2023 / Accepted: 18 September 2023 / Published: 28 September 2023
(This article belongs to the Section Sustainable Materials)

Abstract

:
The cosmetics industry is facing growing pressure to offer more sustainable products, which can be tackled by applying eco-design. This article aims to present the Sustainable Product Optimization Tool (SPOT) methodology developed by L’Oréal to eco-design its cosmetic products and the strategies adopted for its implementation while presenting the challenges encountered along the way. The SPOT methodology is based on the life cycle assessment (LCA) of a finished product and its subsystems (formula, packaging, manufacturing and distribution). Several environmental indicators are assessed, normalized and weighted based on the planetary boundaries concept, and then aggregated into a single footprint. A product sustainability index (a single rating, easy to interpret) is then obtained by merging the environmental product rating derived from the single environmental footprint with the social rating (not covered here). The use of the SPOT method is shown by two case studies. The implementation of SPOT, based on specific strategic and managerial measures (corporate and brand targets, Key Performance Indicators, and financial incentives) is discussed. These measures have enabled L’Oréal to have 97% of their products stated as eco-designed in 2022. SPOT shows how eco-design can be implemented on a large scale without compromising scientific robustness. Eco-design tools must strike the right balance between the complexity of the LCA and the ease of interpretation of the results, and have a robust implementation plan to ensure a successful eco-design strategy.

1. Introduction

The cosmetics industry is facing sustainability concerns regarding the choice of sustainable ingredients, the energy and water use during manufacturing, the choice of packaging, the product safety for the consumer, the emissions into water, and packaging waste [1]. In addition, from a life cycle perspective, the environmental impacts of the cosmetics use phase due to heated water and of the end-of-life (EoL) due to freshwater ecotoxicity are often pointed out in the literature [2,3].
There is growing pressure from consumers and legislation for the cosmetics sector to adopt more sustainable practices and products [1]. Cosmetics manufacturers have to differentiate their products and improve them towards customers’ expectations, which include a growing demand for natural products and products manufactured in a sustainable way and/or according to fair-trade principles [4]. This pressure encourages cosmetics companies to improve their environmental sustainability through new integrated strategies, using concepts from corporate social responsibility and circular economy in product design, manufacturing, and distribution [5]. Some sustainability concerns can be addressed upstream during the design phase of a new product using eco-design.
Eco-design is defined by the ISO 14006 norm as: “activities within the design and development process that aim to reduce environmental impacts and continually improve the environmental performance of the products, throughout their life cycle” [6]. The life cycle perspective is essential in eco-design to prevent burden shifting between life cycle stages or impact categories and to ensure improvements in the overall value chain. The selection of a so-called eco-friendly material might result in a less preferable environmental profile based on a life cycle perspective [7]. For example, a change of material can make a product heavier and therefore its transport more polluting. It could also shorten its lifespan or limit its recyclability.
The two key factors for a successful product eco-design are to integrate environmental aspects into the early stages of the design process and to balance the environmental requirements against other traditional product requirements [8]. Eco-design might lead to a paradox to cope with the following principle: the higher the knowledge of design, the lower the design degree of freedom and the environmental improvement potential [9]. Several types of eco-design tools exist: life cycle assessment (LCA), simplified LCA, computer-aided design (CAD) integrated tool, diagram tools, checklist and guidelines, and the design for X approach [10]. The most exhaustive tool in terms of environmental impacts is the LCA: a method that allows the evaluation of the potential environmental impacts of a product system throughout its life cycle [11]. It is well suited to identifying potential shifts of environmental burdens when designing a specific product. LCA is thus one of the most relevant tools for eco-design. However, conducting a complete LCA can be expensive, time-consuming, and require a lot of data, which makes it difficult to apply at the beginning of the design process [10]. Fortunately, some strategies can be implemented to overcome these barriers [9]. A good balance between the difficulty level and the scope of the method to evaluate the environmental performance of a product is very important when developing an eco-design tool based on LCA [8].
Several eco-design tools have already been developed, but few have been published in the scientific literature or have been made available publicly. Some eco-design tools are focused specifically on the packaging industry like EnvPack [12,13], PIQET [14], and Sustainable Packaging Initiative for CosmEtics (SPICE) [15] for the cosmetics industry. However, those tools have a narrow scope, focusing only on the packaging and excluding the product (the cosmetic formula in the case of the cosmetics industry). The Sustainability Consortium developed the Beauty and Personal Care Rating system, which is based on a qualitative assessment of 32 Key Performance Indicators (KPIs) aggregated into a rating [16], thus not relying on LCA. Finally, Bom et al. [17] have developed the Sustainability Calculator that assesses the sustainability of cosmetic products. The tool is an excel sheet giving a rating from 1 to 100 to cosmetic products based on the user opinion inputs on the production, the packaging, the distribution, and the post-consumer use fate. The calculation of the final rating is based on experts’ knowledge in the cosmetics industry instead of being based on LCA calculation, thus limiting the scientific robustness of the rating. Furthermore, no explanation of how those kinds of tools can be implemented in a cosmetic company is included.
Regarding eco-design tool implementation in companies, Baldassare et al. [18] have identified a large gap in knowledge about the implementation of theory in business practices. Despite the multitudes of eco-design tools, some common barriers to their implementation in companies exist like the need for specific knowledge (such as LCA expertise), the time-consuming effort of performing eco-design, the difficulty of choosing among a large number of existing tools, and finally, the over-formalization of methods and tools in comparison with the complexity of product design [10]. To overcome these barriers, a successful eco-design transition in a company needs to be accompanied by efficient change management [19], a continuous improvement approach [20], and dynamic cycles of action and learning between stakeholders [21,22].
Knowing the actual limit of the literature and the lack of eco-design tools available that integrate a life cycle perspective tailored to the cosmetics industry, one might ask the following research question: How to develop and implement an eco-design tool respecting the life cycle assessment principles and adapted to the reality of large cosmetics companies with a wide range of products? L’Oréal addressed this question by developing an eco-design tool balancing the complexity of LCA and the usability of the tool. This article aims to present the method behind the tool, two case studies, and to describe the management efforts needed to implement such a tool where many stakeholders must interact with it.
The eco-design tool developed is called the Sustainable Product Optimization Tool (SPOT) and has been deployed to support L’Oréal in achieving its sustainability commitments. In this paper, the context of SPOT’s development is explained in Section 2, the methodology used in the SPOT is described in Section 3, the results from case studies illustrating the eco-design process using SPOT are provided in Section 4, the implementation of the tool within L’Oréal is described in Section 5, the limitations of the tool and its implementation challenges and strategies are discussed in Section 6, and concluding remarks are found in Section 7. Although SPOT covers both the environmental and social impacts of a product, this article focuses only on the environmental dimension.

2. Context of SPOT Development

2.1. Company Sustainable Commitments

Starting in 2013, L’Oréal launched two successive global sustainability commitment programs: the “Sharing Beauty With All” program now continuing as the “L’Oréal For The Future” program. These programs have been driven by Group CEOs and set corporate targets to improve product sustainability. One of the company’s objectives is to improve the environmental and social impacts of all products on the market with a target of 100% eco-designed products by 2030.

2.2. Prior Experience in Eco-Design

Before the implementation of SPOT in 2016, the company had already started to develop its experience in eco-design applied to cosmetic formulas and packaging, even if the term eco-design was not necessarily used.
Regarding formulas, substantial efforts have been deployed since 1995 to limit environmental impacts during their end-of-life based on the criteria of environmental hazards and to promote the sustainable sourcing [23] and sustainable transformation of bio-based raw materials [24]. Guidelines were also developed to promote the naturalness [25] and biodegradability of cosmetic formulas [26] while limiting their potential aquatic ecotoxicity.
Regarding packaging, an LCA-based hotspot analysis of new packaging was performed before major launches. Since 2007, guidelines have also been developed for packaging eco-design based on the 3R principles: reduce, recover, recycle. In addition, efforts have been deployed by the company since 2005 to reduce GHG emissions from their factories and distribution centers. Starting in 2014, a pilot project based on a few criteria for a better environmental or social profile of products was launched [26] and tested with four brands. While this first approach had some limitations in terms of product and impact coverage, it raised brand manager interest and acted as a kickstarter for future SPOT development.

2.3. Goals of SPOT

SPOT has been developed to assess cosmetic products. The main objectives of SPOT are the following: (1) Assess the product’s environmental (and social) footprint during its development and provide its sustainable performance relative to a benchmark; (2) Support product development teams composed of marketers, product developers, formulators, and packagers in product eco-design to achieve sustainability commitments; (3) Capture impact difference between products to discriminate between them; (4) Assess a wide range of products; (5) Allow for a systematic assessment of products with a large deployment on a group scale (several product categories, several brands, and several world regions).
The SPOT development was driven by three fundamental principles: (1) scientific robustness, i.e., relying on the best science available; (2) simplicity, i.e., accessibility for all users; (3) sincerity, i.e., developing a truly efficient tool as it aims to tackle fundamental sustainability issues considering a comprehensive list of environmental issues.

3. Description of SPOT Methodology for Environmental Impacts

3.1. Scope of the SPOT Methodology

During the development of the SPOT methodology, a stakeholder panel composed of internal and external sustainability experts has been consulted to establish the initial requirements and to challenge the methodology based on the most recent methodological advances: (1) The assessment should be conducted at the product life cycle level, i.e., not only focusing on a specific step like the end-of-life; (2) The methodology should align with the European Product Environmental Footprint (PEF) requirements as much as possible [27]; (3) The sustainability assessment should include indicators covering environmental and social dimensions; (4) The sustainability measurement should be expressed as a single rating to facilitate user’s interpretation.
Therefore, the overall SPOT methodology is based on the ISO 14040 [11] and ISO 14044 [28] standards for LCA, the PEF guidelines [27], and the Product Environmental Footprint Category Rules (PEFCR) «shadow» group for shampoo led by Cosmetics Europe [3]. These standards and guidelines have been adapted when needed for better alignment with the cosmetics context and to anticipate future methodological developments. The main differences between the SPOT methodology and the PEF requirements are described in Appendix A.

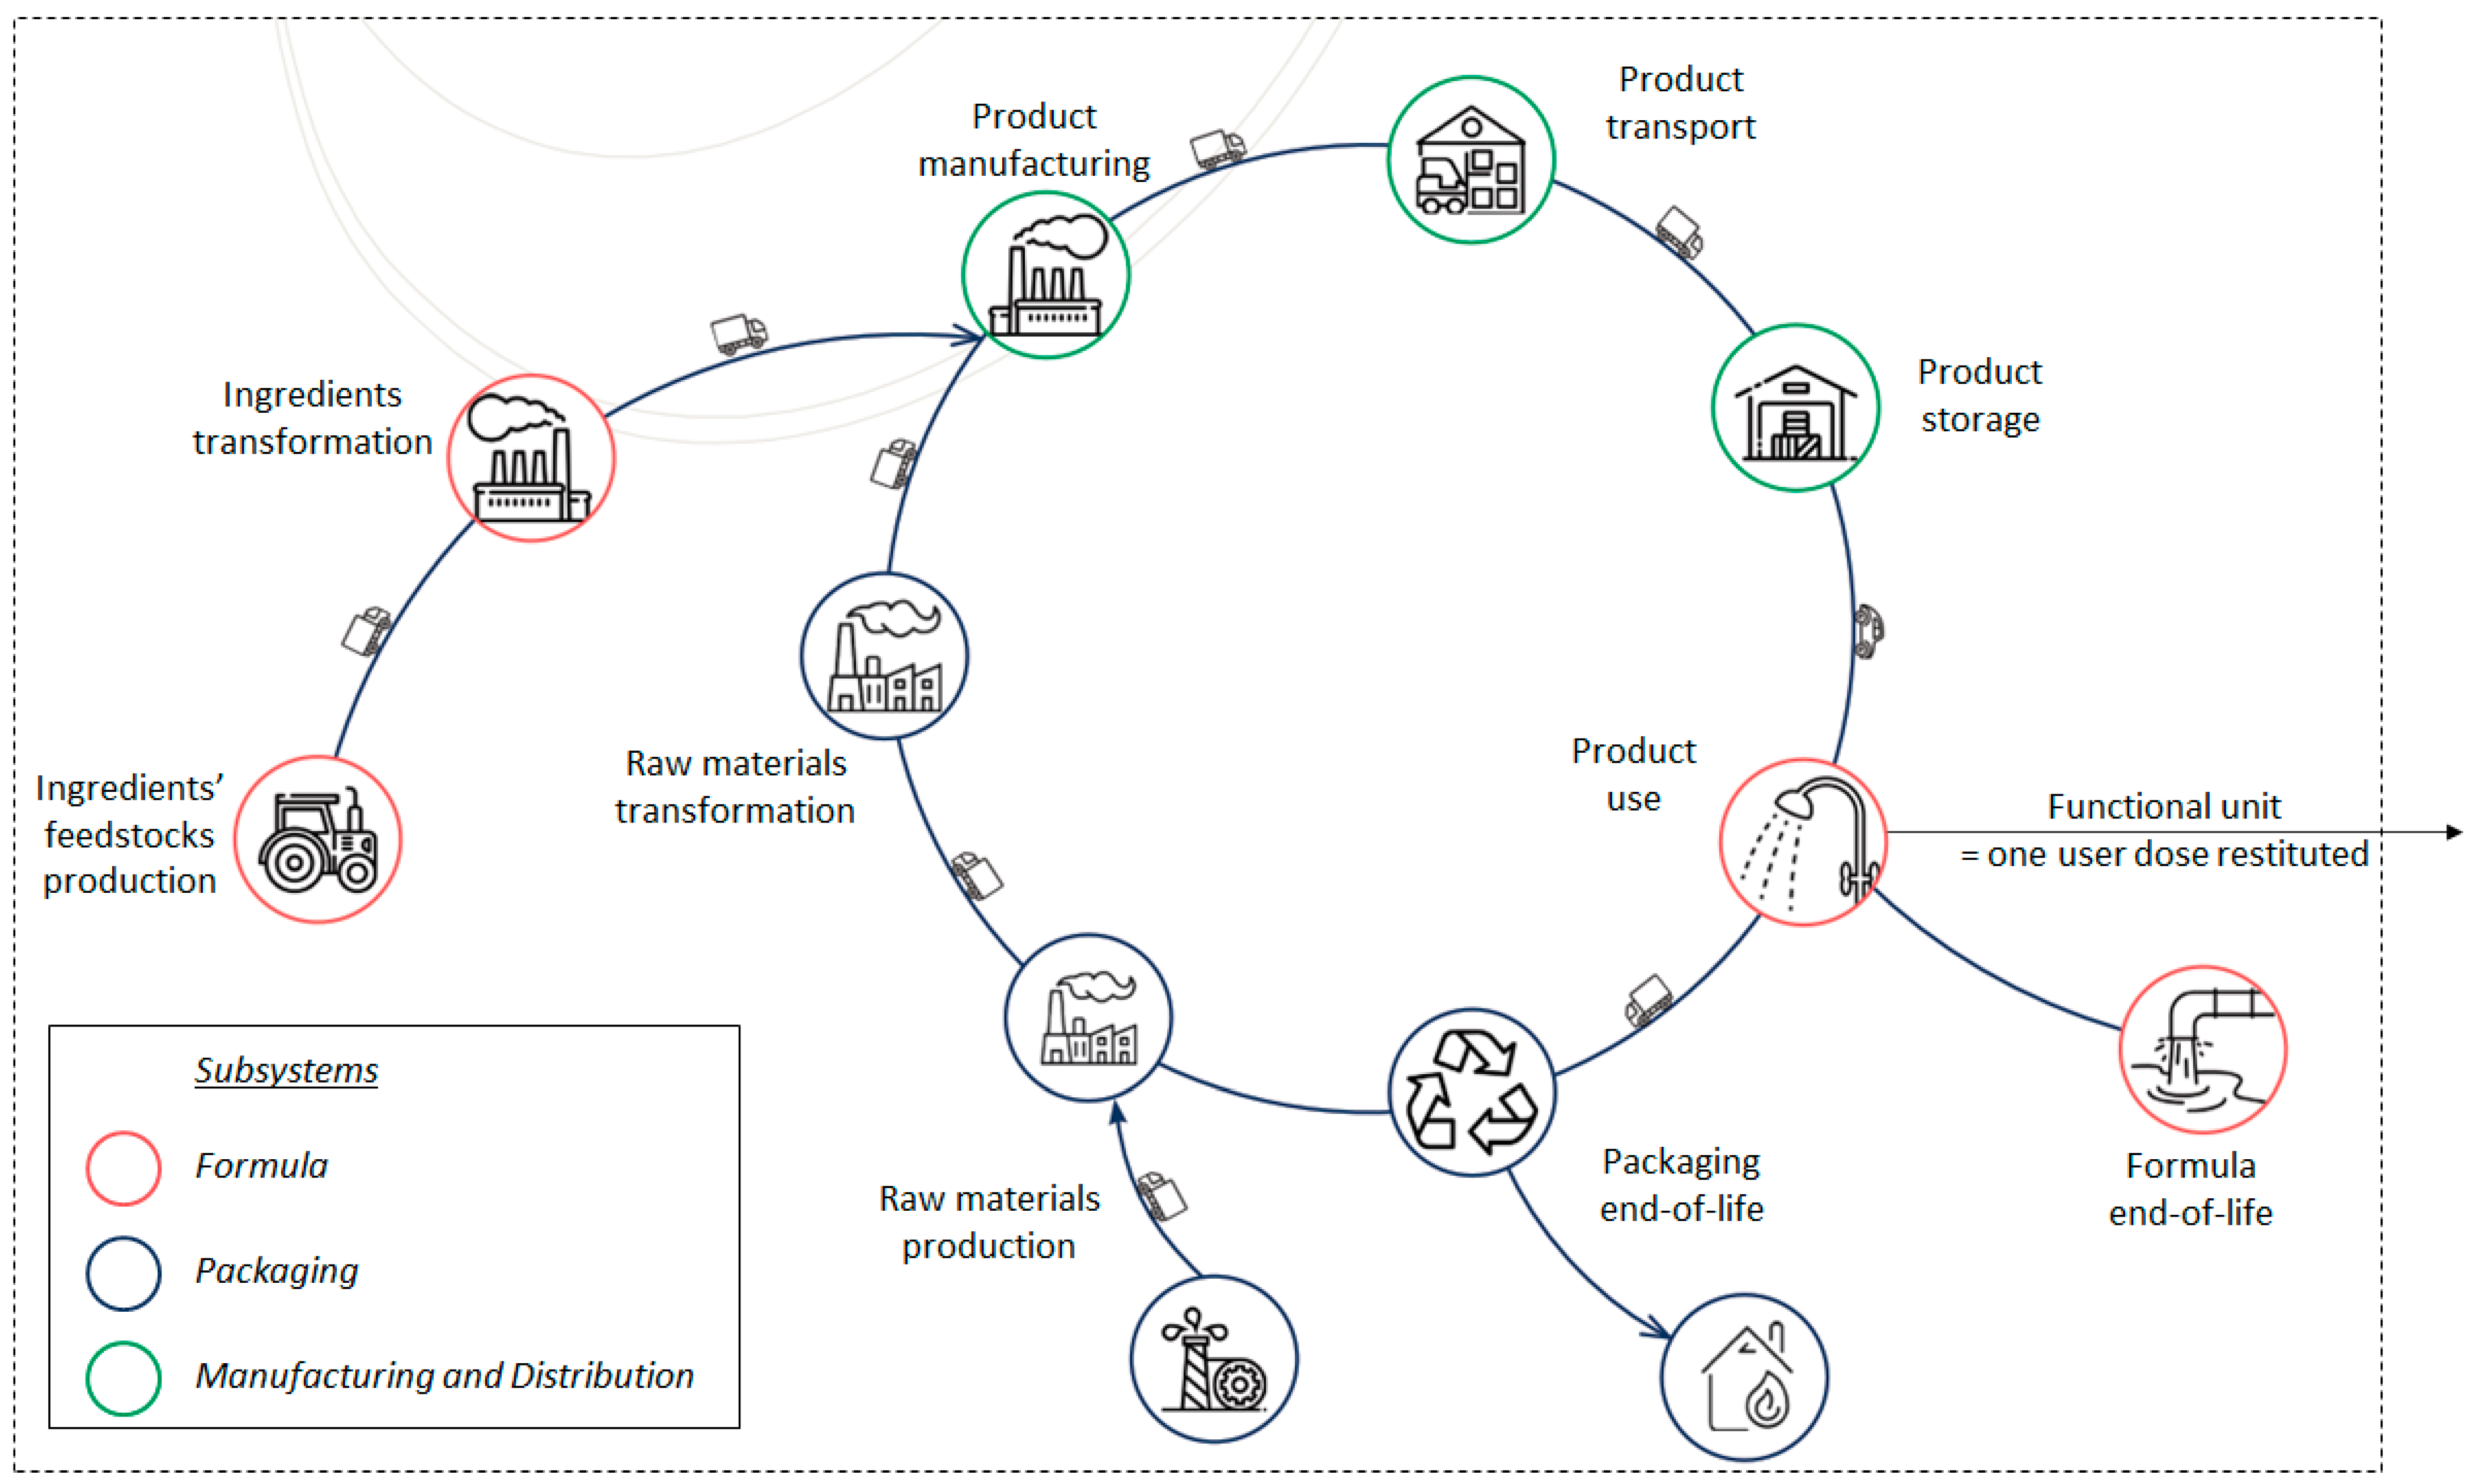
3.2. System Boundaries and Functional Units

The system boundary of a cosmetic product as a finished product assessed by SPOT is defined as cradle-to-grave, and is divided into three subsystems (Figure 1): (1) the formula that is part of the cosmetic product providing the service (e.g., cream, shampoo); (2) the packaging, which includes the containers and/or applicators of the formula (e.g., tube, bottle); (3) the manufacturing and distribution of the finished product. LCA results are obtained separately for the three subsystems and for the overall system.
The first subsystem focuses on the formula and covers the production of ingredient feedstocks (e.g., shea), their transformation into formula ingredients (e.g., shea butter) and assembly into the formula, the transport of feedstocks and formula ingredients, the formula use phase (covering water used for a rinsed-off product [29], and energy consumption for heating that water), and formula end-of-life. See Appendix A for additional information and a description of the assumptions made for the end-of-life of a formula. The functional unit (FU) of this subsystem is one user dose, i.e., the quantity in g of formula used by the consumer to provide the services targeted by the cosmetic. For instance, the user dose of shampoo is 10.46 g. The user dose is based on the standard dose, i.e., the observed quantity of formula used by a consumer, determined from the Scientific Committee on Consumer Safety (SCCS) methodology [30], but accounts for a potential improvement of the formula efficiency during the eco-design by formulators leading to a user dose reduction to achieve the same function (e.g., formula more concentrated).
The second subsystem covers the packaging, which includes the production of raw materials, their transformation into packaging, the finishing process (decoration), multiple transportation steps, and end-of-life stages of packaging. Primary packaging (i.e., the one in contact with the formula and delivering a formula dose to the user), secondary packaging (i.e., the one first seen by the consumer and used to protect the primary packaging), and tertiary packaging (i.e., the one called pack-in used to protect packaging items arriving at the product manufacturing plant and the other one called pack-out used to group products and protect them during transport, storage, and handling) are included. The FU of this subsystem is 1 mL of formula restituted by the packaging. This FU integrates how packagers can influence product environmental impact when optimizing the packaging capacity, the rate of restitution (ROR), and the dispensing improvement rate (DIR). While the entire formula is accessible to the consumer, the ROR (as opposed to the leftover) reflects the capacity of a packaging to deliver its contained formula until the last mL, thus minimizing formula losses. For example, the ROR is 85% for a standard bottle of shampoo, which means that out of the 200 mL claimed, SPOT considers that only 170 mL are used. The DIR reflects the capacity of innovative packaging to deliver more easily to the consumer an exact amount of formula at each use, and therefore with minimum loss at each use. Multi-functionality due to the use of recycled materials in packaging follows the requirements of the Circular Footprint Formula (CFF), as defined by PEF.
The third subsystem covers the stages of manufacturing, transport (from the manufacturing site to the distribution center, then to retail, and then to the consumer), and storage of the finished product. The environmental impacts are assessed per mL of formula restituted, similar to the packaging subsystem. This unit integrates how packagers and formulators can influence product environmental impacts when optimizing packaging weight, formula density, etc.
As required in LCA, SPOT does not directly compare two products but rather the functionality of those two products. The comparison is thus made according to an FU, which is a quantification of the functions delivered to the consumer during the use phase of a cosmetic. Using cosmetics often provides several main functions. For instance, one shampoo can wash, unravel, treat hair, and treat the scalp at the same time. In addition, there are other benefits associated with cosmetics like soap and shampoo that help maintain hygiene and prevent disease spread, the social aspects of make-up, and the importance of sunscreens to prevent skin cancers. These secondary functions are beyond the scope of SPOT.
To encompass all the main functions of a cosmetic, the FU of a finished cosmetic product in SPOT is defined as one user dose delivered by the finished product to deliver the services targeted by the cosmetic. As those services might be different from one cosmetic to another, the impacts of a finished product per FU can only be compared for eco-design purposes with finished products from the same consumer category, i.e., products achieving the same function for consumers. There are currently 30 categories defined by consumer benefits (e.g., wash hair, moisturize skin, color lips) divided into about 120 consumer categories at L’Oréal (e.g., shampoos, shower gels, hair dyes, face moisturizers, sun protection products, deodorants, lipsticks, make-up foundations, etc.). Losses due to product lifetime or during production, distribution, or manufacturing are not considered eco-design levers in this context and are therefore out of the scope of SPOT.
The amount of FU per finished product is calculated as shown in Equation (1). V r e s t i t u t e d b y p a c k a g i n g is the volume of the formula restituted by the packaging expressed in mL per unit of packaging. V p a c k a g i n g is the volume of formula contained in one unit of packaging. V u s e r d o s e is the volume of the formula in one user dose, corresponding to the mass of the user dose divided by its density. V s t a n d a r d d o s e is the volume of the formula in one standard dose determined by the SCCS methodology [30], i.e., the 90th percentile based on consumer observations, which is specified in the literature or calculated by the company from the literature or internal studies.
F U   p e r   f i n i s h e d   p r o d u c t = V r e s t i t u t e d   b y   p a c k a g i n g V u s e r   d o s e = V p a c k a g i n g × R O R × D I R V s t a n d a r d   d o s e
For a given finished product, the environmental impacts of 1 FU are calculated by dividing the overall impacts of the finished product along its life cycle by the number of FU per finished product. For instance, a 200 mL bottle of a finished product with a density of 1, an ROR of 85%, and a DIR of 100% can provide 17 FUs, i.e., 17 user doses of 10 mL each. The impacts for 1 FU will then be equal to 1/17 of the impacts of the finished product. See Figure A1 in Appendix A for an illustration of the influence of dose-related parameters on the number of units of services of specific finished products.

3.3. Collection of Life Cycle Inventory (LCI) Data

The amount of data to collect to cover the entire life cycle of all types of cosmetics produced by L’Oréal is very large. Therefore, LCI data collection has been prioritized according to its influence on the results. Specific LCAs have been conducted internally to identify hotspots that require specific data or more negligible contributions, which can be represented by more generic data. For formula ingredients, more robust data are also required if the ingredient is used in large quantities in formulas or if it is often used in formulas, even in small quantities.
For foreground LCI data, primary data are preferred to ensure the best representativeness and robustness possible. Three levels of data representativeness have been defined depending on the company sphere of influence: (1) product-specific data, (2) company-specific data, and (3) generic data. Product-specific data correspond to data specific to each finished product or consumer category at L’Oréal (e.g., formulation, dose, or rinsing water). Product-specific data can be changed by SPOT users and are the main levers for eco-design (e.g., type and quantity of formula ingredients or packaging raw materials, percentage of bio-based or recycled materials in packaging). Company-specific data are collected from Group facilities and supply chains or reflect company product average sales and usages but are not differentiated by finished product (e.g., the electricity mix for heating rinsing water, the scenario for packaging EoL, impacts of manufacturing per finished product). Product-specific data and company-specific data are based on primary data. Generic data correspond to data not specific to the L’Oréal context, hence mostly the world average that will be used for all products because company supply chain, facilities, and customers are located worldwide (e.g., distance driven by a consumer to buy a product).
Background LCI data mainly come from secondary data extracted from LCI databases with some adaptations when needed and with inventory regionalization for bio-based material production. The updated versions of the main LCI databases used are Ecoinvent [31], Agribalyse [32], and World Food LCA Database [33], as well as specific sources for some ingredients, materials, and finishing processes. It must be mentioned that the use of LCI databases that are not free of charge, like Ecoinvent, is not compliant with the PEF requirements. When no LCI data are available in the literature, which is the case for many ingredients, full data generation (i.e., ingredient specific/proxies LCI data or more generic LCI data generated using chemical or functional similarities for instance) is performed to avoid data gaps.

3.4. Life Cycle Impact Assessment (LCIA) toward Single Footprint

To facilitate the interpretation for SPOT users during eco-design, the different environmental indicators assessed are aggregated into a single footprint. First, the LCI is characterized by several environmental indicators to provide a full overview of the potential environmental impacts of a cosmetic. Then, the environmental indicator results are aggregated after normalization and weighting into a single environmental footprint considering the severity of each environmental indicator based on planetary boundary weighting values (see methodological details in Section 3.4.3).

3.4.1. Characterization of Environmental Indicators

The selection of environmental indicators is based on the PEF guidelines, which recommend the use of the Environmental Footprint (EF) LCIA methodology [27]. SPOT considers 14 environmental indicators at the midpoint level as listed in Table 1. The second column of Table 1 shows the impact methods used to assess the different indicators.
Some impact methods used in SPOT are different from the ones used in EF version 3.0 because they have been adapted for cosmetic products (see list of differences in Appendix A). For instance, the impact method to evaluate the freshwater ecotoxicity indicator has been adapted to address the aquatic impacts of cosmetic products during formula end-of-life and to be more relevant from an ecological point of view (see details in Section 3.4.2). Indeed, freshwater ecotoxicity impacts mainly come from the formula end-of-life, and this indicator is one of the most relevant impact categories identified for shampoos [3] and many other product categories according to the SPOT initial results; thus, it needs to be assessed as accurately as possible. It is worth noting that the impacts on human toxicity come from emissions in the cosmetic life cycle but not from the direct usage of the cosmetic product. Indeed, LCA methodologies, as well as PEF guidelines, do not currently include the direct exposure of the consumer during the use phase, but there is ongoing research on that topic [37,38]. Hence, direct potential impacts, such as potential health benefits associated with hygiene or direct exposure to specific chemical ingredients, are not quantified in the assessment.

3.4.2. LAIM: Adapted LCIA Method for Freshwater Ecotoxicity

The Life Cycle Aquatic Impact Model (LAIM) has been developed to evaluate more accurately the freshwater ecotoxicity indicator in SPOT during the formula end-of-life step, as it is one of the most relevant impact categories for this step. It has been adapted from the USEtox model to overcome some shortcomings of USEtox in the context of SPOT. First, USEtox does not provide enough data to cover all cosmetic ingredients, and the LAIM attempts to have a better coverage of cosmetic ingredients. Second, the USEtox model for ecotoxicity has been built to ensure the statistical robustness of the results, but it underestimates the impacts on the most sensitive species [39]. However, protecting these species to preserve trophic chains is one of the main principles of ecology, so it was decided to be reflected in the SPOT.
The LAIM modifies the effect factor (EF) of USEtox to the target concentration increase inducing a significant chronic effect (EC50chr) on the most sensitive trophic level for the preservation of aquatic ecosystems, instead of on 50% of species as applied by USEtox. This means that the HC50EC50chr, which is the concentration affecting 50% of aquatic species calculated as the geometric mean of chronic EC50 on freshwater aquatic species, is replaced by HC5EC50chr extrapolated from the lowest EC50 or EC10/NOEC obtained, respectively, in acute or chronic aquatic toxicity tests. An example of a visualization of the extrapolation procedure for the ecotoxicological effect factor in USEtox and additional details regarding the LAIM are presented in Appendix B. Note that the most up-to-date guidelines regarding freshwater ecotoxicity from the UNEP-SETAC Life Cycle Initiative [39] and the PEF [40,41] recommend moving from HC50EC50chr to HC20EC10chr, affirming the interest in the LAIM approach.
In practice, for the freshwater ecotoxicity indicator of the formula end-of-life, all emissions into water are characterized by the LAIM and other emissions are characterized by the USEtox model. It would have been relevant to use the LAIM instead of USEtox to characterize all emissions along the life cycle, but the HC5EC50chr data to compute the EF for all substances emitted were not available.

3.4.3. Normalization and Weighting

Having multiple indicators allows one to draw a complete environmental profile of the product, but makes it difficult to interpret the results due to a large amount of information. Despite their existing limitations and the loss of information generated by their application, normalization and weighting are needed to obtain a single footprint easily interpretable by SPOT users for decision making [42].
SPOT normalization is conducted according to the global annual impacts per person as provided by EF version 3.0 [43], except for human toxicity, ecotoxicity and resource indicators, for which the global annual impacts are extrapolated from the European value using a ratio of 14.12 as provided by the Joint Research Centre (JRC). Normalization factors per impact category are available in Table 1. Due to adaptations compared to EF 3.0, normalization factors have been recalculated for the following indicators: human toxicity, freshwater ecotoxicity, and resource depletion.
The normalized results are aggregated into a single footprint by accounting for different weighting values for the different environmental indicators. SPOT weighting factors are derived from the planetary boundaries concept [44,45]. This concept based on natural science has been selected because it appears more scientifically robust and relevant than panel-based weighting factors as proposed for the EF methodology by the JRC [46]. The planetary boundaries concept is to assess environmental impacts in terms of thresholds where the planet remains within suitable conditions for human development. The weighting factors applied in SPOT come from the work of Vargas-Gonzalez et al. [47] based on Bjørn and Hauschild [48] and are presented in Table 1. See Section 6.3 for a comparison of the results obtained with weighting factors based on planetary boundaries and an expert panel.
Single footprints for the subsystems and the entire system are calculated as described in Equation (2), where F P , s is the single footprint for the product P and the system s (subsystem or entire system) expressed in points (person·year equivalent); I P , s , i is the LCA results for the environmental indicator i expressed in indicator units; N F i is the normalization factor for the environmental indicator i expressed in indicator units per person per year; w i is the weighting factor for the environmental indicator i and is unitless.
F P , s = i I P , s , i N F i × w i

3.5. Environmental Ratings and Sustainability Index

The single footprint measures the magnitude of the impacts on the environment but does not inform on the relative performance of the product compared to the best or worst possible footprint for the product category. Such information is of importance for SPOT users to internally facilitate the communication of the environmental performances of a product, easily position the product within the product portfolio, and encourage teams to find a better design to lower the environmental footprint, thus reaching the highest ratings. Therefore, single environmental footprints are converted into environmental ratings to rate the product and its subsystems from 0 (worst performance) to 10 (best performance) compared to products from the same product category. Then, the environmental product rating is merged (see Section 3.5.2) with the social rating (not covered in this article) to obtain the product sustainability index (PSI) ranging from 0 to 10. The aggregation process of single footprints into environmental ratings and a product sustainability index is illustrated in Figure 2 (the aforementioned ratings are also called environmental and social scores internally).

3.5.1. Environmental Rating

Single footprints for all three subsystems and the entire system are translated into single environmental ratings. These four environmental ratings are presented to SPOT users and allow product developers, formulators, and packagers to easily understand the environmental performance of a product and identify potential burden shifts between the subsystems.
The rating approach is built upon an internal benchmark, meaning that the environmental performance of a product is compared to the performances of existing products from the same category. Therefore, environmental ratings for a product can only be compared with products from the same category.
To meet the specific requirements described in Appendix A to ensure the right balance in terms of sensitivity and discrimination potential between products, different functions on [0;1], [1;9] and [9;10] intervals have been defined to calculate environmental ratings from single footprints, as illustrated in Figure 3. The ratings of 1 and 9 are calculated based on benchmark products from a category while 0 and 10 are theoretical values representing the best and worst footprints possible by category. More details about the rating approach are available in Appendix A.
It is worth noting that a reduction in the environmental footprint is not reflected by a proportional reduction in the environmental rating. The relation between the footprint and the rating is not linear and depends on the product category and on the footprint distribution of products belonging to that product category, as explained in Section 3.5.1. Therefore, a higher rating reflects an improvement but does not directly inform the designer of the magnitude of this improvement of the environmental footprint.

3.5.2. Product Sustainability Index

In addition to the environmental rating, a social rating is also assessed by SPOT using an internal methodology that is outside the scope of this article.
Finally, the PSI is calculated by calculating a weighted average of 3/4 for the environmental rating and 1/4 for the social rating (see Figure 2). This weight compensates for the difference between environmental and social assessment methodologies based upon the following approach: the two ratings are weighted so that the PSI varies with the same order of magnitude for comparable action levers in terms of operational efforts. The chosen action levers to establish the weighted average were: (1) an environmental footprint reduced by 5% (e.g., through a mass reduction of the packaging by 10%) and (2) a component linked to the product becoming solidarity sourcing (i.e., corporate initiative to support our suppliers’ commitment to local communities in their value chain).

4. Application of SPOT for Cosmetic Eco-Design to Mitigate Environmental Impacts

The next section shows how the SPOT methodology is applied to cosmetic eco-design to lower the environmental impacts, with examples from specific case studies.

4.1. Interpretation of Environmental Ratings for Eco-Design

During product eco-design, the improvement of a product is assessed by comparing its environmental ratings to the ones of a referent product in the case of a product renovation or a baseline product in the case of a new product launch.
In the case of product renovation, the reference product is the existing product that is being renovated (i.e., new version of an existing product keeping the same function). The renovated product settings will be based on the referent product settings (e.g., transportation zone to zone scenario) with changes due to the activation of eco-design levers.
In the case of a new product launch, a baseline product is a fictitious product that is a combination of a formula baseline, a packaging baseline, and the equivalent of a baseline for manufacturing and distribution corresponding to the same factory and marketing area as the new product so that these steps do not influence the difference between the environmental ratings of the new product and its baseline product. A formula baseline is available for each consumer category, and it corresponds to the company’s average of formulas for this consumer category produced during a year and weighted by their volumes. The packaging baseline corresponds to the company’s packaging average per category and per weight claim within a signature (three criteria). If a material mix can be used (e.g., one part of packaging being glass and another part plastic) for a specific criteria combination (packaging category; weight claim; signature), a fourth criterion based on the type of cosmetic (e.g., hair care, skincare, make-up, etc.) is taken into consideration to select the adequate packaging baseline.
A finished product is considered environmentally improved in SPOT if its environmental rating for the entire system is higher than the one of the referent product or baseline product. Ratings are displayed in SPOT with two decimals. Although a complete uncertainty analysis would be required to conclude on the improvement of the rating [49], if the changes during eco-design do not affect the shown decimals, then it is to be considered that the ratings are equal and that the product has not been improved. As soon as the environment rating is degraded, irrespective of the variation of PSI, the product is not considered improved. The developers’ key eco-design objective is therefore to improve the SPOT rating of the renovated or newly finished product compared to the rating of the referent product, or at least to obtain an equivalent rating.
SPOT users can also compare environmental ratings for each subsystem. For instance, formulators will try to improve the formula rating in priority, and the same for packagers with packaging ratings. Most eco-design levers will only affect one subsystem (see Section 4.2). Thus, focusing on optimizing one subsystem can be a way to leverage formulators’ or packagers’ specific levers. However, some levers might affect several subsystems, and activating an eco-design lever can decrease the environmental rating of one subsystem but increase the environmental rating of another. For example, on one hand, shifting from a liquid shampoo to a solid shampoo could be an opportunity to lower the environmental rating of the packaging by using lighter cardboard packaging instead of heavier plastic packaging. However, on the other hand, this will lead to an increase in the environmental rating of the formula, because the formula of the solid shampoo has a higher environmental footprint per user dose to achieve the same cosmetic performance.
The life cycle perspective is essential to ensuring that such trade-offs will not increase the environmental impacts of the finished product. Therefore, SPOT users always have access to the environmental ratings of the three subsystems and the entire system.

4.2. Levers for Eco-Design Available in the SPOT

The levers for eco-design available to SPOT users have been chosen based on what can differentiate products in the sphere of influence of product development teams (product developers, formulators, packagers, and marketers). The main eco-design objectives of SPOT users are the following: for formulators, develop the most efficient formula with the least environmental impacts; for packagers, develop packaging that delivers as much product as possible with the least environmental impacts.
Table 2 presents the eco-design levers directly available to SPOT users, which can be activated to improve the environmental ratings of a new or renovated product. Levers are the same for new product launches, except the ones on manufacturing and distribution, which cannot be activated. Note that the quantity in a user dose and the volume of rinsing water, which are product-specific data and potential eco-design levers, can only be changed by a few experts qualified to do so, subject to a scientifically robust study proving the effectiveness of that specific dose or volume of rinsing water.

4.3. Eco-Design Case Studies

Two cosmetic products have been selected to demonstrate the environmental effect of some levers for their eco-design during product renovation: (A) a rinse-off hair conditioner for sensitive hair and (B) a deodorant with aerosol-delivering packaging. For product A, the formula represents 83% of the total environmental footprint mainly coming from the heating of rinsing water used during product usage (Figure 4). For product B, the packaging represents 66% of the total environmental footprint, and the formula represents 30% coming from the formula production and the potential freshwater ecotoxicity during the end-of-life of the formula (Figure 4). Detailed results for the environmental profiles of each product are provided in Appendix C.
Table 3 describes the three eco-design case studies showcasing how the SPOT methodology can be applied to cosmetic eco-design.
The evolution of the environmental footprint and environmental ratings before and after eco-design for products A and B are displayed in Figure 4. Environmental ratings can only be compared within a product category, but not across product categories. In other words, the environmental rating of hair conditioners cannot be compared with that of deodorant aerosol.
For product A (hair conditioner), the formula eco-design by creating a leave-on hair conditioner instead of a rinse-off one has improved the formula rating from 2.68 to 8.70, which corresponds to a reduction in the formula environmental footprint including the use phase by 88%. The packaging eco-design has improved the packaging rating from 8.43 to 9.36 by reducing its weight by 66%, which corresponds to a reduction in the packaging environmental footprint by 54%. Due to formula modifications, the formula density has increased by 2%, which may have increased the product distribution footprint, but it has been largely compensated for by the packaging weight reduction. Therefore, the manufacturing and distribution footprint has also been reduced by 5%. Overall, the complete product system rating has been improved from 3.98 to 8.66, which corresponds to a reduction in the product’s environmental footprint by 81%.
For product B (deodorant aerosol), the formula’s eco-design by replacing an ingredient that was the largest contributor to the formula’s end-of-life footprint and adapting the formula to deliver an equivalent functional performance has improved the formula rating from 1.14 to 3.45, which corresponds to a reduction in the formula environmental footprint by 28%. The eco-design of the packaging has improved the packaging rating from 3.93 to 4.25 by reducing its weight, which corresponds to a reduction in the packaging’s environmental footprint by 35%. The manufacturing and distribution footprint has also been reduced by 1%, due to the packaging weight reduction. Overall, the complete product system rating has been improved from 3.34 to 3.94, which corresponds to a reduction in the product’s environmental footprint by 14%.

5. Implementation of the SPOT at L’Oréal

The overall SPOT methodology described in the previous sections has been implemented in a specific tool that is now available to all company product development teams in every world region. Since its global deployment in 2017, all new or renovated products put on the market, representing 2000–3000 products per year, are assessed with SPOT. The first results obtained in 2017 after the complete implementation of SPOT showed that 76% of new or renovated products had an improved environmental or social profile (higher PSI than the internal benchmark). This value increased to 79% and 85% in 2018 and 2019, respectively. From 2020, this rate has risen to a high level between 96% and 97%, showing that the development and implementation efforts have paid off.

5.1. SPOT Functionalities and Structure

The SPOT is designed to support its user during the eco-design process. Its main functionalities are the following: (1) Quantify the PSI, environmental, and social ratings of a finished product and its associated environmental ratings for subsystems (formula, packaging, manufacturing and distribution); (2) Simulate different design options to test and identify measures for rating improvement; (3) Monitor performance progress.
The six above-mentioned ratings are made available to regular SPOT users: four environmental ratings (for formula, packaging, and manufacturing and distribution subsystems, and the finished product), the social rating of the finished product, and its product sustainability index (PSI) combining the environmental and social ratings (see Figure 5). A color code is also used during the display to guide rating interpretation, i.e., green for better than or equivalent to the reference product and red for worse than the referent product. In addition to environmental ratings, superusers (see definition in Section 5.3) can also access environmental footprints.
Besides, a specific eco-design assistant (named herewith EDA) has been developed to support eco-design for formulators. In addition to the SPOT ratings, the EDA provides the following functionalities: (1) Display several indicators (e.g., biodegradability %, bio-based %, and naturality %) to compare the formula being assessed with its referent or baseline formula; (2) Display the contribution analysis of the formula footprint per raw material (single ingredient or a mixture of ingredients used by formulators to create formulas) and per life cycle stage (production, use, end-of-life); (3) Propose a simulator to compare formula scenarios.
The SPOT enables users to perform systematic screening LCAs on a massive scale by relying on automation and requiring little data from the user. Concretely, the SPOT calculations are made on an IT server that is interconnected with (1) existing IT systems to collect knowledge data and user data as inputs and (2) several user interfaces, each one being adapted to specific users as outputs. This structure ensures consistency across departments and facilitates the monitoring of improvements and performances.
The SPOT is developed and maintained by a specific development team made up of internal LCA and sustainability experts, formula and packaging experts, and IT developers. This team also benefits from the external support of LCA and sustainability experts. A steering committee ensures the governance of SPOT.

5.2. Integration of SPOT in the Innovation Process

Specific strategic and managerial measures have been established to support the implementation of product eco-design using the SPOT at different levels of the company, via corporate and brand targets, KPIs, and financial incentives, as described below.
First, a corporate target of 100% eco-designed products by 2030 has been defined, providing a quantifiable objective and a strong incentive to use SPOT. Then, each brand implements sustainability in its business model and sets its sustainable targets to contribute to the corporate objectives. This way each brand can embed the sustainability concept and apply it in line with their constraints.
Second, to ensure the full integration of sustainability aspects during a product development project, “Sustainability” has been added as a new KPI, in addition to the classical KPI tryptic of quality/cost/time. This new KPI is now part of the project milestones. It is based on the sustainability performance measured by the SPOT and should reach the sustainability requirements set for product developers (“SPOT OK” means that the SPOT ratings meet the sustainability requirements and so the sustainability KPI is validated). This new sustainability KPI enables the anticipation of potential sustainability issues and the sharing of accountability for sustainability performances between each member of a product development team, fostering their engagement and collaboration. As represented in Appendix D, the operational teams are using the SPOT for eco-design from the early stage of product development to the product release, in close collaboration with other product development team members.
Third, a financial incentive has been implemented. The brand directors’ bonus decreases with the number of launched products with a SPOT rating not reaching the sustainability performance target. This measure ensures that the top management is also accountable for product sustainability and that they will put efforts into improving product sustainability.

5.3. Support for SPOT Users

Providing good support to SPOT users is essential to guaranteeing the adoption and correct use of the SPOT by product development teams. The SPOT’s main users are operational teams (formulators and packagers). However, other product development team members may use the results of the SPOT and need specific support to interpret and use these results.
There are different tools available for user support. First, all SPOT users receive onboarding training on eco-design with the SPOT (basic eco-design concept, SPOT methodology, life cycle thinking, how to use the SPOT (e-learnings), results interpretation, and levers for eco-design). Second, a hotline, i.e., dedicated human resources for tailored support at the formula level, packaging level, or global product level, is available as there are too many specific use cases to have just a handbook. Third, newsletters are regularly sent to all users for regular updates.
In addition, some people act as sustainability relays in the company. On one hand, some users in product development teams, called superusers or LKUs (local key users), receive more intensive training on the use and interpretation of the SPOT. This way, they can support regular users, and help bridge the gap between the SPOT development team and regular users. On the other hand, there are sustainability leaders in the different brands and units to support operational teams in implementing sustainability in their operations.

5.4. SPOT Updates and Continuous Development

L’Oréal product portfolios and supply chains are constantly evolving, as well as LCI data and, to a lesser extent, LCIA methodologies and normalization and weighting factors. To ensure the relevance and good representativeness of its results, the SPOT is regularly updated on different aspects: LCI data, SPOT methodology, and data based on internal benchmarks, i.e., the definition of baseline products and rating bounds. Updates can be minor or major. Before any update, the consequences of the updates are anticipated with a test procedure and explained to the stakeholders before their integration into the SPOT.
The update of LCI data is performed according to two modes: (1) continuously, e.g., the addition of a new ingredient or packaging material data, as long as there is no influence on baseline formulas or baseline packaging, and (2) yearly updates where external reference sources (e.g., Ecoinvent or Eurostat data), company operational data (e.g., data on manufacturing sites), and ingredient or packaging material data influencing baseline formulas or baseline packaging are updated.
Each change, whether methodological or data-related, is traced and dated in the SPOT to be able to restart the calculations and reproduce the results from any date.

5.5. Links with Other Sustainable Initiatives

Thanks to its ability to quantify the environmental performances of products, SPOT results also serve as input environmental data for other internal and external sustainability initiatives beyond eco-design purposes. SPOT results are used for internal reporting to track progress on portfolios and communicate their sustainability performances. SPOT data are also used to track the evolution of the life cycle GHG emissions of cosmetics and check compliance with company science-based climate targets [50]. The results for different environmental indicators calculated by SPOT are used as environmental information for communication to consumers thanks to the Group initiative Product Impact Labelling [51]. The tool has been considered to feed the common SPICE initiative as one of the advanced methodological and dataset bases to develop an eco-design tool that is publicly available and adapted to cosmetic packaging [15]. In turn, the SPICE methodology and datasets are now being considered by the EcoBeautyScore Consortium [52], which aims to provide environmental information to consumers on cosmetic products of the many companies engaged in this ongoing industry initiative.

6. Discussion

6.1. Challenges during SPOT Development and Implementation

The development of the SPOT methodology and the deployment of the tool have made it possible to include eco-design in all stages of product development and to familiarize all the teams involved with the need to improve the environmental footprint of new and renovated products, which has undeniably been a success. However, L’Oréal has faced some challenges during SPOT development and implementation in different aspects:
  • Tool development team: Big data management expertise was required but was missing in the company. The development of this new skill in the tool development team forced team members to systematize and adapt their work method to align with big data requirements. Beyond the expertise in data management, the provision of all the necessary data in the right format and at the right time was also a challenge for the development of this tool.
  • Data availability: There was a lack of specific LCI data for cosmetics, and the company had to develop its own datasets, especially for cosmetic ingredient production.
  • Implementation of eco-design in the existing procedure: When the SPOT was launched, having to include environmental and social criteria in the decision process of the product launch added additional complexity to the management of the classical criteria, which are quality, cost, and timing. Teams realized that before, they had not always been doing everything right, which can be perceived as learning or as judgment, depending on the people. Therefore, this shift needed to be accompanied by training sessions, user support, as well as the appropriate wording not to emphasize what was done badly, but what can be improved now.
  • Tool adoption by users: User buy-in was difficult at the beginning as the tool was new, sometimes perceived as too complex, and required additional workload for the user, even if the tool automation made it easier. Specific measures put in place helped to overcome this challenge like the involvement of top management with the introduction of the sustainability KPI, the increase in top management accountability, the specific training sessions organized for operational teams, and the technical support. As the SPOT encompasses a wide variety of eco-design levers, the improvement in the product rating associated with the activation of a lever was sometimes not up to the user’s expectations; training and explanation were then required. In addition, all efforts were made to make the tool user-friendly and intuitive for its adoption by non-experts in LCA, while keeping the methodology scientifically robust.
  • User accessibility: Finding a reasonable balance between the precision of data and results and tool complexity was a challenge. Trials and errors, as well as user feedback, were crucial to tackling that issue. Involving users (like former formulators and packagers) in the tool development team was also a good way to guide development by accounting for user constraints from the beginning.
  • User support: Communicating the complexity of the approach based on LCA in a way that is understandable to operational teams required efforts for pedagogy during training sessions and user support.
  • Data evolution management: Data evolution influences the results, which can cause difficulties for users in integrating changes that may affect their work. There is a need for user support to keep a critical mind and to accompany changes carefully by explaining the resulting differences to users (transparency). In addition, performing regular audits is key to reinforcing tool credibility.
  • Tool adaptation capacity: Dealing with disruptive innovation (i.e., development that creates a break with the current market based on innovative use, innovative technology, or both) is challenging because of the difficulty of determining what they are being compared to in terms of environmental progress as no baseline product is available. In addition, a committee is responsible for the creation of new product categories and specific expertise to determine the corresponding baseline products.

6.2. Strategies for SPOT Implementation Compared with the Literature

Rossi et al. identified the main barriers mentioned in the literature that prevent the implementation of eco-design approaches in industrial companies [10]. The main “tool-related barriers” identified are (1) the high number and high specificity of existing methods and tools, (2) extra resources for eco-design needed in terms of economy, staff, time, and data, and (3) the absence of a multi-objective analysis preventing the respecting of all product requirements. Rossi et al. [10] proposed several strategies to overcome the mentioned barriers.
Brones et al. also identified transition management principles of eco-design integration at different levels [21]: (1) A strategic level defined as “Defining corporate and long-term objectives of innovation and environmental sustainability, based on life cycle thinking principles”; (2) a tactical level defined as “Deploying and piloting the environmental strategy in the innovation processes and instruments”; (3) an operational level defined as “Applying eco-design principles to all related activities for decision making and product performance”.
Table 3 and Table 4 show a comparison of the strategies proposed by Rossi et al. [10] or Brones et al. [21] and the ones applied at L’Oréal during SPOT implementation. The company adopted most of the recommended strategies to favor the implementation of eco-design tools in companies. In particular, it has set a global strategy supported by the sustainable development programs “Sharing Beauty With All” from 2013 onwards, and then “L’Oréal For The Future” from 2020 onwards, which aims to place L’Oréal activity within the framework of the planetary boundaries.
In complement to the adopted strategies mentioned in Table 4 and Table 5, the company used additional strategies for eco-design implementation using the SPOT. First, there was a substantial financial and human resource investment for eco-design tool development, which was in line with the ambitious corporate target for eco-design. Second, increasing the accountability of top management for meeting sustainable targets fostered tool adoption by users. Finally, the SPOT can easily be adapted since its continuous development and the improvement of background datasets via regular updates keep it relevant, while simulation tools help anticipate the effects of updates.

6.3. Main Methodological Limitations of SPOT

Despite the careful design of the SPOT methodology, some limitations remain, partly due to the needed trade-offs between accuracy and simplicity.
Defining a functional unit (FU) with a scope adequately reflecting the different functions of cosmetics is not straightforward, and the FU proposed here does not account for all cosmetic specificities. First, the effect of the frequency of use on the product efficiency is not considered (e.g., the more you use a cosmetic, the more efficient it is, and the smallest the user dose is). Second, the long-lasting effect of cosmetics is not considered (e.g., deodorants and lipsticks). Third, because the joint use of different cosmetic products is not considered, a 2-in-1 product might not be proposed over two separate products as an eco-design lever. One way to integrate this aspect would be to enlarge the assessment scope at the beauty routine level to include the frequent use of different cosmetic products at the same moment, instead of the use of a single product.
Some secondary functions during the use phase are not accounted for. For instance, “the hot water may also serve other functionalities, such as comfort and rinsing of other cosmetics” [3]. In addition, other cosmetic functions like preventing disease or the social aspects of make-up are also not considered. All impacts during the use phase are attributed to cosmetic use, thus probably overestimating its environmental impacts.
The dynamics of biogenic carbon storage for estimating GHG emissions from bio-based materials are not considered. Therefore, the impacts on climate change of bio-based materials, especially when used for packaging, can be overestimated or underestimated depending on the type of biomass used and the temporal perspective chosen [53].
Regarding LCI data, each L’Oréal supplier has its internal method and tool to optimize their environmental impacts. Therefore, the company cannot directly use impact results calculated by their suppliers because of inconsistencies between their methods and the SPOT. When necessary, the company is thus recalculating the impacts of their suppliers’ formula ingredients or packaging materials thanks to LCI data collection by their suppliers. The direct involvement of suppliers on a global scale in the creation of LCI or LCIA datasets usable in the SPOT is not realistic in the absence of an international standard to generate harmonized LCA data and results on cosmetic products. The EcoBeautyScore Consortium [52] is currently paving the road for such a standard.
The application of global average values in inventories of some life cycle stages like the manufacturing and use phase of cosmetic products or the connection to wastewater treatment plants is another limitation of the SPOT methodology. However, this limitation is known and assumed to focus on the major challenges of eco-design on a global scale, and to maintain a manageable level of complexity. The goal of the SPOT is not to produce a complete, specific, and exhaustive LCA for every product but rather to help designers in their eco-design approach.
As described in Section 3 and Appendix A, the LCI modeling of the formula end-of-life and the assessment of its environmental impacts follow a simplified and conservative approach and will be improved in the future. The compartments of formula end-of-life emissions (from effluent wastewater, solid waste, or emissions during use of the product) need to be more product-specific, the impacts of the wastewater treatment itself should be added, and all the impact indicators assessed should be covered.
Regarding the environmental indicators covered, some potential environmental issues are not currently covered by LCIA methods. For instance, the potential impacts of plastic leakage on ecosystem quality and human health are not yet assessed in LCA but could also be an issue of importance for cosmetic products. Ongoing research work from the MARILCA group to integrate potential environmental impacts of marine litter into LCA could be integrated into the SPOT in the future [54].
Normalization and weighting, which are optional in LCIA according to ISO standards, are applied for the calculation of a single environmental footprint in the SPOT to facilitate decision making during eco-design by reducing the number of environmental indicators and resolving potential trade-offs between those indicators. However, the choice of the normalization reference, as well as the choice of weighting factors, can strongly influence the conclusions during product comparison [42]. An external normalization approach based on a global normalization reference is adopted in the SPOT by using normalization factors recommended by the PEF. A distance-to-target weighting approach based on planetary boundaries is used in SPOT, which is a science-based approach compared to other approaches often based on value choice, like expert panels. The weighting approach is different from the one recommended by the PEF, but our sensitivity analysis comparing the cosmetic environmental footprint obtained with weighting factors from SPOT or from EF 3.0 [46] (see Appendix C) suggests that the ranking of products during eco-design remains the same. Normalization and weighting factors have inherent uncertainty. Therefore, the SPOT implements the consensual normalization factors proposed by the PEF and the weighting factors using a science-based approach (planetary boundaries) rather than a panel-based approach.
Only ratings (and not footprints) are directly displayed in the SPOT to regular users. However, ratings do not reflect the relative importance of each subsystem to the overall system, which can prevent those users from prioritizing their improvement efforts to the most impacting subsystems. Even if it can be seen as a limitation, L’Oréal chose to only display ratings to regular users for the following reasons. As the largest footprint contributions are often associated with the formula, displaying footprints can discourage packagers from putting efforts into improving packaging as it often has a smaller influence on the overall product footprint than improving the formula. The philosophy advocated by the Group is that every member of the product development team should contribute to the efforts to reduce product environmental footprints, no matter how important their influence is. The idea is not only to have better performance but to achieve the best performance possible on every subsystem of a finished product. This is one of the reasons why ratings are split into three subsystems to optimize each of them. In addition, superusers have access to the footprints of each subsystem and thus can provide the needed support to regular users. In addition, developers of a subsystem (formula, packaging or manufacturing and distribution) have access to more detailed results than the ratings in their subsystem, but not in other subsystems. For instance, formulators have access to the footprint contributions of the different ingredients in the formula in their specific eco-design tool.
Using a KPI approach to optimize products by product category can prevent designers from more radical eco-design. Indeed, environmental ratings can only be compared for the same product category, so the way product categories are defined is critical in guiding the eco-design potential improvements. For instance, deodorants with aerosol packaging and deodorants with roll-on packaging are two separate product categories. Therefore, even if moving from aerosol packaging to roll-on packaging may reduce the environmental footprint of the deodorant aerosol thanks to the removal of aluminum packaging and propellant gases, this type of improvement cannot be reflected in ratings.
Finally, uncertainty is not assessed in the SPOT, and the extent to which a reduction in environmental impacts when performing eco-design can be considered significant is not evaluated. Exploring uncertainty to define significance thresholds, i.e., how big the impact difference between referent and eco-designed products should be to be considered as improved, would help designers to better define their eco-design targets.

6.4. Other Eco-Design Levers for Cosmetic Products

In addition to the eco-design levers directly available in the SPOT (see Section 4.2), some indirect levers might also be activated by marketers: the choice of packaging appearance, which influences the finishing processes used; claims about the recommended usage of the product (user dose, rinsing water amount, frequency of use, etc.) to help to reduce the potential impacts induced by the consumer if the product is misused; claims about the sustainable performance of the product to encourage consumers to choose the best products. Other initiatives at L’Oréal aiming at reducing environmental impacts, like the choice of the best suppliers for ingredient and raw material sourcing, or the improvement of environmental performances of company facilities, will also positively influence the eco-design, although those levers are not the targets of the SPOT.

6.5. Future Perspectives for SPOT Development

So far, the development and evolution of the SPOT have always been driven by the willingness to make available an easy-to-use tool hiding the complex methodology behind it. For users, environmental footprints as well as ratings and color codes to guide the rating interpretation displayed in the tool are calculated automatically based on a limited number of filled data: packaging characteristics, formula code, and manufacturing and commercial zones. This was made possible thanks to an efficient interface between our formula design, packaging design, and supplier monitoring tools.
To better guide eco-design, a new major challenge is to enable the SPOT user to better identify possible further reductions in the environmental footprint by displaying the eco-design levers already activated and the ones that could still be activated. To do so, one development axis lies in bringing more science and technology into SPOT screens, by displaying environmental footprints, the reason why the eco-design target is not reached, and the projection of eco-design lever activation on SPOT ratings. Another development axis is to move from a tool for simulating a defined product design to a tool for predicting the product design to achieve an eco-design target.
To drive eco-design efforts, SPOT developers are also planning to show not only the environmental footprint per product but also the environmental footprint at scale when sold on the market. The environmental footprint magnitude of a new product will also be evaluated using the forecast launch quantity to challenge the marketing expectations and sensitize the brands to the total environmental footprint of their portfolio. To illustrate: if a product has a 1% reduction in its footprint and a forecast of 10 million units sold, then its absolute footprint (i.e., environmental footprint per product unit multiplied by 10 million) will be more important than the absolute footprint of a similar product with a 10% decrease in its footprint and a forecast of 100,000 units sold.
With the practical experience the SPOT has gained over the last few years and the evolution of L’Oréal commitments in the area of sustainable development, two major changes to the SPOT are also expected in the relatively short term: (1) the removal of the SPOT social rating assessment, as the new challenges of social and societal progress associated with the company’s actions in these areas could be managed with greater specificity and adaptability using another approach; (2) the removal of the scoring system to open the possibility of making direct use of environmental footprints to assess product performance. The SPOT would thus become a tool focused solely on the eco-design of products based on their environmental footprint.
Another potential development in the longer term is the integration of beauty routine into the SPOT, defined as a set of cosmetic products used and actions carried out by the consumer on skin or hair for care or beautification. This project is a mid- or long-term perspective due to the practical and technical complexity of capturing the multitude and diversity of beauty routines.
In parallel to these development perspectives, the company is closely following the various initiatives in the cosmetic sector based on the environmental footprints of products calculated by LCA and applied for eco-design like the SPICE initiative [15], or communication to consumers such as its own initiative Product Impact Labelling [51] or the industry initiative EcoBeautyScore Consortium [52]. This will certainly lead to further evolution of the SPOT and an internal eco-design process to consider these initiatives and their methodological approaches.

7. Conclusions

While cosmetics companies (as companies from other industrial sectors) face pressure from consumers and other stakeholders to adopt more sustainable practices, eco-design allows them to develop new products considering environmental and social aspects. L’Oréal has developed and implemented an eco-design tool, called the SPOT, respecting the LCA principles and adapted to the reality of large cosmetics companies with a wide range of products. To our best knowledge, the SPOT is the first LCA-based eco-design methodology and tool tailored to cosmetic products.
The SPOT methodology calculates environmental ratings for the formula, the packaging, the manufacturing and distribution, and the overall system, based on LCA. These ratings are derived from different environmental indicators assessed throughout the product life cycle, which are normalized, weighted based on the planetary boundaries concept, and then aggregated into environmental footprints. Another aggregation is made by combining the overall product environmental rating and the social rating to have a product sustainability index ranging from 0 to 10. These SPOT indicators are used to guide eco-design and assess the sustainability performance evolution of products. Ultimately, the SPOT provides the information needed to achieve one of the company’s sustainability targets of 100% of eco-designed products by 2030. The implementation of an eco-design tool on a large scale in a company must be accompanied by incentives and enablers to ensure success. L’Oréal’s approach to the implementation of eco-design is in line with recommendations from the literature.
Based on this concrete experience in developing and implementing an eco-design tool of cosmetic products at L’Oréal, the joint effort by all levels of management appears to be a key driver to ensuring the successful adoption of such a tool by the different stakeholders within a company. In terms of tool exploitation and evolution, it is essential that the calculation is based on the most recent and rigorous scientific knowledge, but that the tool’s interface shows simple results (for example, a single rating and color codes) to facilitate understanding and embedment of the tool by different users. Finally, it turns out to be fundamental that tool users receive appropriate support. For example, the company has developed training courses, set up a hotline, sent out newsletters, and trained superusers in each team. Support needs to take different forms and be adapted as needed over time.
Internal strategies used to develop and implement the SPOT eco-design tool could inspire other companies to pursue a similar road toward more sustainable business. On the other hand, researchers in the fields of eco-design and LCA could benefit from the concrete experience and feedback of a company. Finally, the scientific knowledge and experience acquired by the company on the deployment of the eco-design of cosmetic products on a large scale thanks to the SPOT was essential to initiate the communication of environmental information on its products to consumers (Product Impact Labelling initiative). It should also be helpful for the industrial sector within the framework of the EcoBeautyScore Consortium, which is aimed at communicating to consumers environmental information on all cosmetic products on the market.

Author Contributions

Conceptualization: P.B., A.-M.B. and L.G.; methodology: P.B., L.G., A.H., J.L., M.V.-G. and F.W.; software: T.B. and G.G.; validation: T.B., P.B., A.-M.B., L.G., A.H., I.R. and F.W.; resources: L.P. and J.P.; data curation: T.B., G.G., J.L. and L.P.; writing—original draft preparation: J.L., L.P. and J.P.; writing—review and editing: T.B., P.B., A.-M.B., L.G., G.G., I.R., M.V.-G. and F.W.; visualization: J.L., L.P. and J.P.; supervision: J.L. and L.P. All authors have read and agreed to the published version of the manuscript.

Funding

This research received no external funding. Co-authors of CIRAIG received financial funding from L’Oréal to help write, review, and submit this article.

Institutional Review Board Statement

Not applicable.

Informed Consent Statement

Not applicable.

Data Availability Statement

The impact results of case studies presented in this article are available in Appendix C. LCI data are confidential and are thus not provided with the article.

Acknowledgments

The 11 independent external experts involved in the development of SPOT methodology: Ganaël Bascoul (Soon Soon Soon), Anne-Marie Boulay (WULCA—international working group focusing on water use assessment and water footprinting), Andreas Ciroth (GreenDelta), Koen Boone (The Sustainability Consortium), Ian Fenn (Consumers International), Dominique Gangneux (Rainforest Alliance), Virginie Raisson (LEPAC—Laboratory for prospective and geopolitical studies), Sara Russo Garrido (CIRAIG—International Reference Center for Life Cycle Assessment and Sustainable Transition), Tomas Rydberg (IVL—Swedish Environmental Research Institute), Greg Thoma (University of Arkansas) and Alessandra Zamagni (Ecoinnovazione). The R&I L’Oréal For The Future team and Quantis team for generation, update and management of LCA-based data on formula ingredients, packaging components and distribution of final products to consumers. The L’Oréal R&I and Operations teams for operational implementation and management of SPOT data as well as their daily support to product developers. The SPOT Steering Committee members for the governance of SPOT and the continuous improvement of this tool for product developers.

Conflicts of Interest

The authors declare no conflict of interest. The authors of this publication represent different institutions, including L’Oréal which funded the development of the SPOT and supported the writing of this article.

Appendix A. Details on SPOT Methodology

Appendix A.1. Formula End-of-Life

Cosmetic products have different elimination routes during consumer use depending on the type of cosmetic product (rinse-off, leave-on) and the use routine. They are typically discharged to the sewer or disposed of via solid waste. Rinsed-off products are released into the water during product use and the majority of leave-on products are also released into the water during washing or showering (delayed rinse-off). However, make-up products have a different disposal route from other categories, mainly via solid waste [55]. In the SPOT, the impact of the rinsing water, i.e., water used to rinse the product during its use phase, is fully attributed to the use of the cosmetic. For the formula end-of-life step, all formula ingredients are assumed to be 100% emitted into the water, even for leave-on formulations, except for a few ingredients like propellant gas or other volatile organic compounds (VOCs) that are assumed to be 100% emitted into the air. This simplifying and conservative assumption was chosen for the following reasons: (1) Water is the main environmental compartment exposed to cosmetic formulas in particular for rinse-off products; (2) Most cosmetic ingredients released into the environment end up in aquatic ecosystems, including those likely to be found in soils that can reach surface water or groundwater through leaching or infiltration into the soil; (3) In the environmental risk assessment of ingredients for a regulatory purpose, whatever the cosmetic product (shampoo, hair dye, skincare, make-up, etc.) is, a 100% release down the drain of the annual tonnage used by consumers, identically distributed over the 365 days of the year, must be applied by default to predict concentrations of cosmetic ingredients in the aquatic compartment. The formula end-of-life step only covers the direct emissions of ingredients into the environment and wastewater treatment abatement, if any, but not the impacts of the wastewater treatment itself, which will be part of future improvements.
Note that the formula end-of-life step is only characterized by the four environmental indicators assumed to be the key contributors of formula impacts at this step: photochemical ozone formation mainly for formula components emitted to air (i.e., VOCs in the SPOT), freshwater ecotoxicity, freshwater eutrophication, and marine eutrophication, mainly for formula components emitted into the water (i.e., all ingredients except for VOCs in the SPOT).

Appendix A.2. Influence of Dose-Related Parameters on the Number of Units of Services

Figure A1. Illustration of the influence of dose-related parameters on the number of units of services. The consumer dose is the user dose.
Sustainability 15 14321 g0a1

Appendix A.3. Main Differences between the SPOT Methodology and the PEF Requirements

Table A1. Main differences between the SPOT methodology and the PEF requirements in April 2023.
TopicPEFSPOT 2023
Indicators and characterization methods
  • PEF 6.3 with EF 3.0
  • PEF 6.3 with EF 3.0, with the following deviations:
  • Human toxicity: USEtox V1.01, merging of cancer and non-cancer toxicity impacts
  • Freshwater ecotoxicity: USEtox V1.01, For end-of-life of formulas: LAIM method, developed by L’Oréal (cf. Appendix B)
  • Resource depletion: CML2002 ADP fossil and mineral, reserve base
  • Particulate Matter: same characterization method as PEF, expressed in PM2.5 eq
Normalization
  • Global normalization PEF EF 3.0
  • Global normalization from PEF EF 3.0. Normalization values recalculated at the global level for the following indicators: Human toxicity, Freshwater ecotoxicity, resource depletion
Weighting
  • Panel-based weighting
  • Planetary boundaries approach [47]
LCI database
  • By priority order: EF-compliant datasets, EF-compliant proxy, non-EF-compliant dataset
  • Ecoinvent 3.8 + Agribalyse 3.0 + World Food LCA Database 3.5 + specific developments
The rating approach is built upon an internal benchmark, meaning that the environmental performance of a product is positioned in comparison with the performances of existing products from the same category. Therefore, environmental ratings for a product can only be compared with products from the same category. The rating approach has been built to meet several requirements to ensure the right balance in terms of sensitivity and discrimination potential between products: a reduction by 10% of the environmental footprint shall be visible; ensure a good spreading of product ratings by avoiding a majority of the product’s rating to be too high (or too low); limit the number of categories to be able to compare products; avoid the possibility to have a rating above 10 or below 0. To meet these requirements, different functions on [0;1], [1;9] and [9;10] intervals have been defined to calculate environmental ratings from single footprints. The ratings of 1 and 9 are calculated based on environmental footprints of real benchmark products from a category while 0 and 10 are theoretical benchmark products with an environmental footprint representing respectively the worst footprint and best footprint possible by category. The calculation on each interval is made according to Equation (A1) where A and B are benchmark products for the interval and P is the product of interest; S X , s is the environmental rating for the product X (P, A or B) and the system s (subsystem or entire system); F P , s is the single footprint for the product P and the system s (subsystem or entire system). See Figure 3 for a graphical representation of the relationship between environmental single footprints and environmental ratings used by SPOT.
S P , s = S A , s + S B , s S A , s l n F A , s l n F B , s × l n F A , s l n F P , s
The formula rating is made per consumer category regrouping formulas achieving the same function for its consumer. A total of about 150 consumer categories currently exist at L’Oréal. The rating of 0 corresponds to the footprint increase by 50% of the most impacting formula within a consumer category. A rating of 1 corresponds to the footprint leading to having 5% of the existing formulas with a rating below 1. A rating of 9 corresponds to the footprint of the least impacting formula within a consumer category. A rating of 10 corresponds to the footprint decreased by 50% of the least impacting formula within a consumer category. The approach is slightly different when the number of formulas within a product category is less than 20 formulas. In such cases, a rating of 1 corresponds to the maximum footprint within the scope of formulas decreased by 5% of the difference between the maximum and the minimum footprints.
For the packaging subsystem, ten categories are defined for a rating in the SPOT: body care, face care, face cleaning, fragrances, haircare, make-up, nail cleaning, aerosol, coloration, and others.
For the manufacturing and distribution subsystem, the rating of 0 corresponds to the footprint of a rating of 1 increased by 50%. A rating of 1 corresponds to the highest footprint of manufacturing and distribution within the portfolio of products assessed in the SPOT in November 2016. A rating of 9 corresponds to the lowest footprint of manufacturing and distribution within the same portfolio of products assessed in the SPOT in 2016. Finally, a rating of 10 corresponds to a hypothetical 0 footprint.

Appendix B. LAIM Method

There were two main objectives behind the development of a specific methodology for assessing the ecotoxicity of the formula during its end-of-life stage. First, to better take into account the most sensitive aquatic species in the trophic chain (where the standard method USEtox uses a mean of ecotoxicity values of all species). Second, to use the specific environmental database on cosmetic ingredients built by L’Oréal over the last 30 years.
The Life Cycle Aquatic Impact Model (LAIM) has been developed by L’Oréal and is internally used in the SPOT. It has been developed following the structure and logic of USEtox see Equation (A2) [56]. C F is the characterization factor (PAF.m3.d.kg−1), F F is the fate factor (day), X F is the exposure factor (dimensionless), and EF is the effect factor (PAF.m3.kg−1). Improvements and modifications of the fate factor and the effect factor are made in the LAIM.
C F = F F × X F × E F
The fate factor values, in addition to the USEtox 2.12 database, are completed with COSMEDE values [57] because not all ingredients are available in the default USEtox database. If an ingredient is not available in either USEtox 2.12 or COSMEDE, then a default estimation is made based on the environmental persistence status of the ingredient.
While the EF is normally calculated based on the concentration affecting 50% of aquatic species calculated as the geometric mean of chronic EC50 on freshwater aquatic species (see Equation (A3)), the EF in the LAIM is calculated with the lowest EC50 or NOEC value of the most sensitive level of the trophic chain (see Equation (A4)). This calculation approximates an HC5 (instead of an HC50 for USEtox) as shown in Figure A2. In other words, the EF calculation in the LAIM is driven by the most sensitive species.
E F P A F × m 3 k g = P A F C m g m 3 = 1000 × 0.5 H C 50 E C 50 c h r m g m 3
E F P A F × m 3 k g = P A F C m g m 3 = 1000 × 0.05 H C 5 E C 50 c h r m g m 3
Figure A2. Example visualization of the extrapolation procedure for the ecotoxicological effect factor in USEtox.
Sustainability 15 14321 g0a2
The HC5 value is extrapolated from the lowest EC50 or EC10/NOEC obtained in acute or chronic aquatic toxicity tests, respectively. Priority is given to chronic data. However, when we have incomplete datasets not covering the three trophic levels (typically algae, invertebrates, and fish), the application of a safety factor of 5 or 10 to the H C 5 E C 50 c h r is performed when acute or chronic data are available, respectively, on only two or one species among the three standard regulatory species (algae, daphnids, and fish). These values for safety factors are aligned with the EU Environmental Risk Assessment [58] and Ecolabel principles [59].
Practically speaking, these are the equations that should be used if chronic or acute data are available:
-
Chronic data available:
o
EC10chr or NOECchr on standard regulatory species available
o
EF = 1000 × 0.05/((Lowest EC10chr/SF) × Extrapolation factor) with:
∆PAF = 0.05 for 5% of affected species
SF = safety factor (10 for 1 EC10chr or NOECchr available, 5 for 2 EC10chr or NOECchr and 1 for 3 EC10chr or NOECchr)
Extrapolation factor (EC10chr or NOECchr to EC50chr) = 5 from Payet [60]
o
EF = 10/(Lowest EC10chr or NOECchr/SF)
-
Acute data available:
o
EC50acu on standard regulatory species available
o
EF = 1000 × 0.05/((Lowest EC50acu/SF)/Extrapolation factor) with:
∆PAF = 0.05 for 5% of affected species
SF = safety factor (10 for 1 EC50 available, 5 for 2 EC50 and 1 for 3 EC50)
Extrapolation factor (EC50acu to EC50chr) = 2 for organics; 20 for metals and organometallics. Same values as used in USEtox.
o
Metals and organometallics: EF = 1000/(Lowest EC50acu/SF)
o
Others (including organics): EF = 100/(Lowest EC50acu/SF)
The use of the LAIM instead of USEtox allows us to calculate the EF based on the most sensitive species to reflect company’s choice in the SPOT to use an indicator that better reflects ecosystems preservation, where the most sensitive species and life stages must be protected, in line with the principles of the major international chemical regulations (for example REACH [61]). Therefore, the use of this mean of effect concentration of 50% in the USEtox approach is not relevant in assessing impacts in SPOT. The LAIM EFs are based on expertly verified ecotoxicity data, which are regularly updated and cover a wide range of cosmetic ingredients, which is not the case for USEtox. Finally, the EF calculation in the LAIM does not require species sensitivity distribution (SSD) as no statistical extrapolation of the ecotoxicity reference concentration (for chronic: lowest EC10chr or NOECchr, for acute: lowest EC50acu) is required to determine the EF in the LAIM, i.e., ecotoxicity test results from only the most sensitive species are directly used. The EF calculation in the LAIM is based on an ecotoxicity dataset that is generally available or relatively easy to generate on cosmetic ingredients.

Appendix C. Additional Results for Eco-Design Case Studies

Figure A3. Detailed results for eco-design case studies extracted from SPOT on 3 April 2023. The * indicates the renovated version of the product.
Sustainability 15 14321 g0a3
Figure A4. Sensitivity analysis on the choice of the weighting factors set. The * indicates the renovated version of the product.
Sustainability 15 14321 g0a4

Appendix D. Additional Information about the Implementation of SPOT at L’Oréal

Figure A5. Integration of the SPOT in a product development project.
Sustainability 15 14321 g0a5

References

  1. Bom, S.; Jorge, J.; Ribeiro, H.M.; Marto, J. A step forward on sustainability in the cosmetics industry: A review. J. Clean. Prod. 2019, 225, 270–290. [Google Scholar] [CrossRef]
  2. Kröhnert, H.; Stucki, M. Life cycle assessment of a plant-based, regionally marketed shampoo and analysis of refill options. Sustainability 2021, 13, 8478. [Google Scholar] [CrossRef]
  3. Golsteijn, L.; Lessard, L.; Campion, J.-F.; Capelli, A.; D’Enfert, V.; King, H.; Kremer, J.; Krugman, M.; Orliac, H.; Furnemont, S.R.; et al. Developing Product Environmental Footprint Category Rules (PEFCR) for shampoos: The basis for comparable life cycle assessment. Integr. Environ. Assess. Manag. 2018, 14, 649–659. [Google Scholar] [CrossRef] [PubMed]
  4. Łopaciuk, A.; Łoboda, M. Global Beauty Industry Trends in the 21st Century. In Proceedings of the Management, Knowledge and Learning International Conference, Zadar, Croatia, 19–21 June 2013; pp. 1079–1087. [Google Scholar]
  5. Morea, D.; Fortunati, S.; Martiniello, L. Circular economy and corporate social responsibility: Towards an integrated strategic approach in the multinational cosmetics industry. J. Clean. Prod. 2021, 315, 128232. [Google Scholar] [CrossRef]
  6. ISO:14006; Environmental Management Systems d Guidelines for Incorporating Ecodesign. ISO: Geneva, Switzerland, 2010.
  7. Secchi, M.; Castellani, V.; Collina, E.; Mirabella, N.; Sala, S. Assessing eco-innovations in green chemistry: Life Cycle Assessment (LCA) of a cosmetic product with a bio-based ingredient. J. Clean. Prod. 2016, 129, 269–281. [Google Scholar] [CrossRef]
  8. Bovea, M.D.; Pérez-Belis, V. A taxonomy of ecodesign tools for integrating environmental requirements into the product design process. J. Clean. Prod. 2012, 20, 61–71. [Google Scholar] [CrossRef]
  9. Bhander, G.S.; Hauschild, M.; McAloone, T. Implementing Life Cycle Assessment in Product Development. Environ. Prog. 2003, 22, 255–267. [Google Scholar] [CrossRef]
  10. Rossi, M.; Germani, M.; Zamagni, A. Review of ecodesign methods and tools. Barriers and strategies for an effective implementation in industrial companies. J. Clean. Prod. 2016, 129, 361–373. [Google Scholar] [CrossRef]
  11. ISO 14040:2006; Environmental Management—Life Cycle Assessment—Principles and Framework. ISO: Geneva, Switzerland, 2006.
  12. Ligthart, T.N.; van Velzen, E.U.T.; Brouwer, M. EnvPack an LCA-based tool for environmental assessment of packaging chains. Part 1: Scope, methods and inventory of tool. Int. J. Life Cycle Assess. 2019, 24, 900–914. [Google Scholar] [CrossRef]
  13. Ligthart, T.N.; Ansems, T.M. EnvPack, an LCA-based tool for environmental assessment of packaging chains: Part 2: Influence of assessment method on ranking of alternatives. Int. J. Life Cycle Assess. 2019, 24, 915–925. [Google Scholar] [CrossRef]
  14. Verghese, K.L.; Horne, R.; Carre, A. PIQET: The design and development of an online ‘streamlined’ LCA tool for sustainable packaging design decision support. Int. J. Life Cycle Assess. 2010, 15, 608–620. [Google Scholar] [CrossRef]
  15. Sustainable Packaging Initiative for CosmEtics. Introducing the SPICE Tool. 2020. Available online: https://open-spice.com/tool/ (accessed on 15 July 2022).
  16. The Sustainability Consortium. Beauty and Personal Care Product Sustainability Rating System. 2019. Available online: https://sustainabilityconsortium.org/project/beauty-and-personal-care-product-sustainability-rating-system/ (accessed on 15 July 2022).
  17. Bom, S.; Ribeiro, H.M.; Marto, J. Sustainability Calculator: A Tool to Assess Sustainability in Cosmetic Products. Sustainability 2020, 12, 1437. [Google Scholar] [CrossRef]
  18. Baldassarre, B.; Keskin, D.; Diehl, J.C.; Bocken, N.; Calabretta, G. Implementing sustainable design theory in business practice: A call to action. J. Clean. Prod. 2020, 273, 123113. [Google Scholar] [CrossRef]
  19. Boks, C. The soft side of ecodesign. J. Clean. Prod. 2006, 14, 1346–1356. [Google Scholar] [CrossRef]
  20. Pigosso, D.C.; Rozenfeld, H.; McAloone, T.C. Ecodesign maturity model: A management framework to support ecodesign implementation into manufacturing companies. J. Clean. Prod. 2013, 59, 160–173. [Google Scholar] [CrossRef]
  21. Brones, F.A.; de Carvalho, M.M.; Zancul, E.d.S. Reviews, action and learning on change management for ecodesign transition. J. Clean. Prod. 2017, 142, 8–22. [Google Scholar] [CrossRef]
  22. Kemp, R.; Loorbach, D.; Rotmans, J. Transition management as a model for managing processes of co-evolution towards sustainable development. Int. J. Sustain. Dev. World Ecol. 2009, 14, 78–91. [Google Scholar] [CrossRef]
  23. L’Oréal. Sustainable Sourcing Guidebook for Raw Materials Suppliers; L’Oréal: Paris, France, 2022; pp. 1–27. [Google Scholar]
  24. Philippe, M.; Didillon, B.; Gilbert, L. Industrial commitment to green and sustainable chemistry: Using renewable materials & developing eco-friendly processes and ingredients in cosmetics. Green Chem. 2012, 14, 952–956. [Google Scholar] [CrossRef]
  25. Philippe, M.; Didillon, B.; Gilbert, L. Naturalness: Its assessment in the development of sustainable and green chemistry ingredients. An industrial commitment 1. Ann. Des Falsif. De L’expertise Chim. Toxicol. 2016, 985, 36–43. [Google Scholar]
  26. L’Haridon, J.; Martz, P.; Chenéble, J.-C.; Campion, J.-F.; Colombe, L. Ecodesign of cosmetic formulae: Methodology and application. Int. J. Cosmet. Sci. 2018, 40, 165–177. [Google Scholar] [CrossRef]
  27. Manfredi, S.; Allacker, K.; Pelletier, N.; Chomkhamsri, K.; de Souza, D.M. Product Environmental Footprint (PEF) Guide; European Commission—Joint Research Centre: Ispra, Italy, 2012. [Google Scholar]
  28. ISO14044:2006; Environmental Management—Life Cycle Assessment—Requirements and Guidelines. International Organization for Standardization (ISO): Geneva, Switzerland, 2006; Volume 2006.
  29. Morizet, D.; Aguiar, M.; Campion, J.; Pessel, C.; De Lantivy, M.; Godard, C.; Dezeure, J. Water consumption by rinse-off cosmetic products: The case of the shower. Int. J. Cosmet. Sci. 2023, 1–9. [Google Scholar] [CrossRef] [PubMed]
  30. SCCS (Scientific Committee on Consumer Safety). SCCS Notes of Guidance for the Testing of Cosmetic Ingredients and Their Safety Evaluation 9th Revision. 29 September 2015, SCCS/1564/15, Revision of 25 April 2016. 2015, p. 151. Available online: https://ec.europa.eu/health/scientific_committees/consumer_safety/docs/sccs_o_190.pdf (accessed on 15 June 2022).
  31. Wernet, G.; Bauer, C.; Steubing, B.; Reinhard, J.; Moreno-Ruiz, E.; Weidema, B. The ecoinvent database version 3 (part I): Overview and methodology. Int. J. Life Cycle Assess. 2016, 21, 1218–1230. [Google Scholar] [CrossRef]
  32. Colomb, V.; Amar, S.A.; Mens, C.B.; Gac, A.; Gaillard, G.; Koch, P.; Mousset, J.; Salou, T.; Tailleur, A.; van der Werf, H.M. AGRIBALYSE®, the French LCI Database for agricultural products: High quality data for producers and environmental labelling. OCL 2015, 22, D104. [Google Scholar] [CrossRef]
  33. Nemecek, T.; Bengoa, X.; Rossi, V.; Humbert, S.; Lansche, J.; Mouron, P. World Food LCA Database: Methodological Guidelines for the Life Cycle Inventory of Agricultural Products. Version 3.5. 2019, p. 88. Available online: https://simapro.com/wp-content/uploads/2020/11/WFLDB_MethodologicalGuidelines_v3.5.pdf (accessed on 1 June 2022).
  34. Beck, T.; Bos, U.; Wittstock, B.; Baitz, M.; Fischer, M.; Sedlbauer, K. LANCA®—Land Use Indicator Value Calculation in Life Cycle Assessment; Fraunhofer Institute for Building Physics: Stuttgart, Germany, 2010. [Google Scholar] [CrossRef]
  35. Fantke, P.; Evans, J.; Hodas, N.; Apte, J.; Jantunen, M.; Jolliet, O.; McKone, T.E. Health impacts of fine particulate matter. In Global Guidance for Life Cycle Impact Assessment Indicators Volume 1; United Nations Environment Programme: Nairobi, Kenya, 2016. [Google Scholar]
  36. Van Zelm, R.; Huijbregts MA, J.; Den Hollander, H.A.; Van Jaarsveld, H.A.; Sauter, F.J.; Struijs, J.; Van Wijnen, H.J.; Van De Meent, D. European characterization factors for human health damage of PM 10 and ozone in life cycle impact assessment. Atmos. Environ. 2008, 42, 441–453. [Google Scholar] [CrossRef]
  37. Fantke, P.; Ernstoff, A.S.; Huang, L.; Csiszar, S.A.; Jolliet, O. Coupled near-field and far-field exposure assessment framework for chemicals in consumer products. Environ. Int. 2016, 94, 508–518. [Google Scholar] [CrossRef]
  38. Fantke, P.; Chiu, W.A.; Aylward, L.; Judson, R.; Huang, L.; Jang, S.; Gouin, T.; Rhomberg, L.; Aurisano, N.; McKone, T.; et al. Exposure and toxicity characterization of chemical emissions and chemicals in products: Global recommendations and implementation in USEtox. Int. J. Life Cycle Assess. 2021, 26, 899–915. [Google Scholar] [CrossRef]
  39. Owsianiak, M.; Hauschild, M.Z.; Posthuma, L.; Saouter, E.; Vijver, M.G.; Backhaus, T.; Douziech, M.; Schlekat, T.; Fantke, P. Ecotoxicity characterization of chemicals: Global recommendations and implementation in USEtox. Chemosphere 2022, 310, 136807. [Google Scholar] [CrossRef]
  40. European Commission. Commission Recommendation of 16.12.2021 on the Use of the Environmental Footprint Methods; European Commission: Brussels, Belgium, 2021. [Google Scholar]
  41. Saouter, E.; Biganzoli, F.; Ceriani, L.; Versteeg, D.; Crenna, E.; Zampori, L.; Sala, S.; Pant, R. Environmental footprint: Update of Life Cycle Impact Assessment Methods—Ecotoxicity Freshwater, Human Toxicity Cancer, and Non-Cancer; Publications office of the European Union: Luxembourg, 2020. [Google Scholar] [CrossRef]
  42. Pizzol, M.; Laurent, A.; Sala, S.; Weidema, B.; Verones, F.; Koffler, C. Normalisation and weighting in life cycle assessment: Quo vadis? Int. J. Life Cycle Assess. 2017, 22, 853–866. [Google Scholar] [CrossRef]
  43. Crenna, E.; Secchi, M.; Benini, L.; Sala, S. Global environmental impacts: Data sources and methodological choices for calculating normalization factors for LCA. Int. J. Life Cycle Assess. 2019, 24, 1851–1877. [Google Scholar] [CrossRef]
  44. Steffen, W.; Richardson, K.; Rockström, J.; Cornell, S.E.; Fetzer, I.; Bennett, E.M.; Biggs, R.; Carpenter, S.R.; De Vries, W.; De Wit, C.A.; et al. Planetary boundaries: Guiding human development on a changing planet. Science 1979, 347, 1259855. [Google Scholar] [CrossRef]
  45. Rockström, J.; Steffen, W.; Noone, K.; Persson, Å.; Chapin, F.S., III; Lambin, E.F.; Lenton, T.M.; Scheffer, M.; Folke, C.; Schellnhuber, H.J.; et al. A safe operating space for humanity. Nature 2009, 461, 472–475. [Google Scholar] [CrossRef] [PubMed]
  46. Sala, S.; Cerutti, A.K.; Pant, R. Development of a Weighting Approach for the Environmental Footprint; Publications Office of the European Union: Luxembourg, 2018. [Google Scholar] [CrossRef]
  47. Vargas-Gonzalez, M.; Witte, F.; Martz, P.; Gilbert, L.; Humbert, S.; Jolliet, O.; van Zelm, R.; L’Haridon, J. Operational Life Cycle Impact Assessment weighting factors based on Planetary Boundaries: Applied to cosmetic products. Ecol. Indic. 2019, 107, 105498. [Google Scholar] [CrossRef]
  48. Bjørn, A.; Hauschild, M.Z. Introducing carrying capacity-based normalisation in LCA: Framework and development of references at midpoint level. Int. J. Life Cycle Assess. 2015, 20, 1005–1018. [Google Scholar] [CrossRef]
  49. Beltran, A.M.; Prado, V.; Vivanco, D.F.; Henriksson, P.J.G.; Guinée, J.B.; Heijungs, R. Quantified Uncertainties in Comparative Life Cycle Assessment: What Can Be Concluded? Environ. Sci. Technol. 2018, 52, 2152–2161. [Google Scholar] [CrossRef] [PubMed]
  50. Science-Based Target Initiative. Over 100 Global Corporations Using Science-Based Targets to Align Strategies with Paris Agreement. 2018. Available online: https://sciencebasedtargets.org/news/over-100-global-corporations-using-science-based-targets-to-align-strategies-with-paris-agreement (accessed on 1 June 2022).
  51. L’Oréal. Product Environmental & Social Labelling Methodologies; L’Oréal: Paris, France, 2020; pp. 1–32. [Google Scholar]
  52. L’Oréal. The EcoBeautyScore Consortium is Now Live with 50 Industry Players in a Breakthrough Initiative to Enable More Sustainable Consumer Choices. 2022. Available online: https://www.loreal.com/en/press-release/commitments/ecobeautyscore-consortium/ (accessed on 1 May 2022).
  53. Albers, A.; Collet, P.; Benoist, A.; Hélias, A. Back to the future: Dynamic full carbon accounting applied to prospective bioenergy scenarios. Int. J. Life Cycle Assess. 2020, 25, 1242–1258. [Google Scholar] [CrossRef]
  54. Woods, J.S.; Verones, F.; Jolliet, O.; Vázquez-Rowe, I.; Boulay, A.-M. A framework for the assessment of marine litter impacts in life cycle impact assessment. Ecol. Indic. 2021, 129, 107918. [Google Scholar] [CrossRef]
  55. European Chemicals Agency. Committee for Risk Assessment (RAC) Committee for Socio-economic Analysis (SEAC) Background Document to the Opinion on the Annex XV Report Proposing Restrictions on Intentionally Added Microplastics; European Chemicals Agency: Helsinki, Finland, 2022; p. 207. [Google Scholar]
  56. Rosenbaum, R.K.; Bachmann, T.M.; Gold, L.S.; Huijbregts, M.A.; Jolliet, O.; Juraske, R.; Koehler, A.; Larsen, H.F.; MacLeod, M.; Margni, M.; et al. USEtox—the UNEP-SETAC toxicity model: Recommended characterisation factors for human toxicity and freshwater ecotoxicity in life cycle impact assessment. Int. J. Life Cycle Assess. 2008, 13, 532–546. [Google Scholar] [CrossRef]
  57. Cycleco, “Environmental Footprinting with USEtox—Characterization Factors for Cosmetic, Detergent, Pesticide. 2014. Available online: http://efwithusetox.tools4env.com/dashboard (accessed on 14 December 2022).
  58. Echa. Chapter R.10: Characterisation of dose [concentration]-response for environment. In Guidance on Information Requirements and Chmical Safety Assessment; European Chemicals Agency: Helsinki, Finland, 2008; pp. 1–65. [Google Scholar]
  59. EU. Regulation (EC) No 66/2010 of the European Parliament and of the Council of 25 November 2009 on the EU Ecolabel. 2010. Available online: https://eur-lex.europa.eu/legal-content/EN/TXT/?uri=celex%3A32010R0066 (accessed on 19 December 2022).
  60. Payet, J. Assessing Toxic Impacts on Aquatic Ecosystems in Life Cycle Assessment (LCA). Ph.D. Thesis, École Polytechnique Fédérale De Lausanne, Lausanne, Switzerland, 2004. [Google Scholar]
  61. ECHA. Understanding REACH. 2022. Available online: https://echa.europa.eu/en/regulations/reach/understanding-reach (accessed on 19 December 2022).
Figure 1. System boundaries and representation of the three subsystems of a finished cosmetic product.
Sustainability 15 14321 g001
Figure 2. Graphical representation of the aggregation process from single footprints into environmental ratings and sustainability index. The subsystems ratings are scaled according to their respective FU and summed to obtain the cosmetic product rating. The ratings highlighted in yellow are the ones presented to regular SPOT users.
Sustainability 15 14321 g002
Figure 3. Graphical representation of the relation between environmental footprint and environmental rating used by SPOT (packaging, formula, or final product).
Sustainability 15 14321 g003
Figure 4. Environmental footprints and environmental ratings for products A (product category: hair conditioner) and B (product category: deodorant aerosol) before and after eco-design (A*, B*). Detailed results are available in Appendix C. The columns with color and white dots represent the result of the complete product system (formula + packaging + manufacturing and distribution) with all improvements made. The * indicates the renovated version of the product.
Sustainability 15 14321 g004
Figure 5. Ratings as displayed to the designers.
Sustainability 15 14321 g005
Table 1. Overview of the LCIA indicators, impact method, normalization, and weighting factors.
LCIA IndicatorsImpact MethodIndicator UnitNormalization Factor (Unit per Person per Year)Weighting Factors
Climate ChangeGWP 100 years from IPCC 2013 kg CO2 eq.8.10 × 10325.50%
Water ScarcityAWaRe 100L of water eq. of deprived water1.15 × 1071.40%
Freshwater EcotoxicityFor emissions in water during formula end-of-life: LAIMFor other emissions: USEtox v1.01CTUe99.00 × 1032.31%
Freshwater EutrophicationEUTREND modelkg P eq.1.61 × 1008.78%
Marine EutrophicationEUTREND modelkg N eq.1.95 × 1011.50%
AcidificationAccumulated Exceedance modelmol H+ eq.15.56 × 1011.45%
Land UseSoil Organic Matter (SOM) model, LANCA [34]points8.19 × 10525.43%
Terrestrial EutrophicationAccumulated Exceedance modelmol N eq.1.77 × 1020.83%
Resource Depletion (Mineral and Fossil)CML2002 ADP fossil and mineral, reserve basekg Sb eq.1.93 × 10−111.12%
Human ToxicityHuman toxicity (cancer and non-cancer) from USEtox v1.01 CTUh5.87 × 10−43.16%
Particulate MatterRiskPoll, UNEP recommended model [35] expressed in kg PM2.5 eq.kg PM2.5 eq.2.50 × 10016.27%
Ionizing RadiationHuman Health effect modelkBq U235 eq.4.22 × 1030.03%
Photochemical Ozone FormationLOTOS-EUROS model [36] as applied in ReCiPe)kg NMVOC eq.44.06 × 1011.47%
Ozone DepletionEDIP model based on the ODPs of the World Meteorological Organization (WMO) over an infinite time horizon.kg CFC11 eq.5.36 × 10−20.76%
Table 2. Eco-design levers directly available to the SPOT user.
Subsystem OptimizedDesign Change on the New Finished ProductExample
FormulaCompositionformula ingredients
Quantity of ingredientingredients concentration
Quantity of water for rinsing one dose7 L to 5 L for shampoo
User dose by increasing formula efficiency10.46 g for liquid shampoo to 2.59 g for solid shampoo
Manufacturing and distributionZone of salesNorth America to Western Europe
Zone of company manufacturing siteNorth Asia to Western Europe
Weight claim40 mL to 50 mL
Quantity of raw material for packaging22 g to 18 g
PackagingType of raw material for packagingPET to HDPE
Quantity of raw material for packaging22 g to 18 g
Rate of restitution85% to 90%
Dispensing improvement rate (DIR)1 to 1.5
Percentage of recycled material0% to 100%
Percentage of bio-sourced material0% to 100%
Weight claim40 mL to 50 mL
Process typeInjection to extrusion
Type of finishing process Metallization to None
Decorated surface10 cm2 to 5 cm2
Country of supplierFrance to Spain
Presence of disruptorYes to No
Presence of a main materialNo to Yes
Is rechargeable/refillableNo to Yes
Number of recharge cycles1 to 5
Is a rechargeNo to Yes
The fact that packaging is designed to be reusable
(while considering when relevant impacts from transport/clean/refill of the reused primary packaging)
No to Yes
Zone of company manufacturing siteNorth Asia to Western Europe
Table 3. Description of the eco-design case studies. The * indicates the renovated version of the product.
Subsystem OptimizedReferent ProductEco-Design Levers ActivatedRenovated Product
Formula and packaging(A) a rinse-off hair conditioner for sensitive hair
  • Removal of water for rinsing
  • Adaptation of the formula (type and quantity of ingredients) to deliver an equivalent functional performance
  • Weight reduction of packaging (−66%)
(A*) a leave-on hair conditioner for sensitive hair with an eco-designed packaging
Formula and packaging(B) a deodorant with an aerosol delivering packaging
  • Adaptation of the formula ingredients to deliver an equivalent functional performance: weight reduction of silicon (−73%), and replacement of Zinc PCA by Magnesium oxide
  • Weight reduction (−15%) of plastic and aluminum in the packaging
(B*) an eco-designed deodorant with an aerosol-delivering packaging
Table 4. Comparison of the strategies proposed by Rossi et al. [10] and the ones applied at L’Oréal during SPOT implementation.
Tools Related BarriersProposed Strategies from Rossi et al. [10]Strategies Adopted by L’Oréal during SPOT Implementation
The high number and high specificity of eco-design toolsSelection of tools adequate for the company and project objective🗸Tool and method selection guided by an advisory stakeholder panel composed of internal and external experts
Use of customized eco-design tools 🗸Creation of SPOT eco-design tool specifically adapted to cosmetics in the L’Oréal context
Use of integrated tools🗸Integration of SPOT results into the existing product development tools
Use of tools integrated with traditional design tools🗸SPOT has been implemented while continuing consistently to build on other previously developed tools to deploy the use of key eco-design levers of formulas and packaging
Use of simplified tools🗸SPOT is an operational and automatic eco-design tool allowing the user to perform a simplified LCA with little data but based on a full LCA modeling, which strongly reduces the workload for users compared to other approaches
Use of tools that consider the entire life cycle of products🗸SPOT is an LCA-based tool including all life cycle steps
Selection of tools that can conduct multi-criteria analysis 🗸SPOT is based on the multi-criteria indicators recommended by the PEF initiative [27]
Establishment of a close relationship with suppliers 🗸SPOT uses data collected from suppliers
Development of a good international network🗸Consultation of a stakeholder panel composed of internal and external sustainability experts
Good involvement of supplier expertise in the product development process🗸Suppliers are actors in the product development process by proposing new formula ingredients or packaging that meet eco-design needs
Analysis of the complete supply chain to identify criticalities🗸All product life cycle steps are included
Resources (time, economic, staff)Timing re-organization to train personnel🗸All SPOT users are trained
Good level of education and training provided to personnel🗸Different tools available for user support (onboarding training, hotline, newsletters) help to improve user skills and foster user involvement
Establishment of clear environmental goals🗸Definition of a measurable sustainability target for eco-design at the product, brand, and company levels
Address environmental considerations as business issues🗸Preserving the environment is identified among the company’s top objectives
Development of cross-functional teams 🗸The tool development team is a cross-functional team (product developers + sustainability experts + IT): the main stakeholders are involved in the tool development to better meet the needs, and a steering committee ensures governance
Support from environmental experts in the design and development activities 🗸Sustainability relies on product development teams and operational teams
Establishment of good contacts between departments about environmental issues🗸Collaborative work in product development teams (formulators, packagers, product developers, and marketers)Technical teams play an important role in educating the marketing team
Identification of key roles🗸Roles related to eco-design are assigned
Absence of multi-objective analysisStandardization of the product development process🗸The product development process is standardized with checkpoints and milestones
Formalization of the product development process and inclusion of eco-design activities🗸The use of SPOT is included in the product development process
Consideration of environmental issues at the beginning of the product design process🗸Sustainability requirements are set at the beginning of the product design
Integration of environmental issues in the conventional product development process🗸Addition of a new KPI “Sustainability” based on SPOT results during a product development project
Introduction of environmental checkpoints, reviews and milestones into the product development process🗸The sustainability KPI is part of the project milestones
Adoption of a life cycle perspective🗸SPOT is an LCA-based tool
Evaluation of the complete product life cycle🗸SPOT covers the complete product life cycle
Table 5. Comparison of the strategies proposed by Brones et al. [21] and the ones applied at L’Oréal during SPOT implementation.
Transition Management LevelProposed Strategies from Brones et al. [21]Strategies Adopted by L’Oréal during SPOT Implementation
StrategicDefine or update the long-term ambition of the organization in environmental sustainability🗸Definition of a measurable sustainability target for eco-design at the company level
Align product innovation strategy with the environmental ambition🗸Creation of the SPOT eco-design tool and adaptations of the innovation process to achieve the corporate sustainability target
Monitor the long and midterm plan, and maintain coherence between corporate vision and business processes🗸SPOT results are used to monitor the corporate sustainability target achievement
TacticalEngage/influence the different groups involved in the deployment of environmental goals and procedures (middle management)🗸Accountability of top management for meeting sustainable targets and awareness/training of all managers and SPOT users
Formalize a plan for progressing toward a higher integration of environmental sustainability within Product innovation processesStrategy not implemented
Monitor and evaluate results, progresses and gap🗸Product innovation and SPOT results are monitored and analyzed to identify progress and gaps
OperationalAdapt and experiment eco-design tools and practices to company culture in pilot projects🗸Pilot projects before SPOT official implementation
Engage the different groups involved in product development to understand and apply eco-design principles and tools (internally and externally/supply chain and innovation partners)🗸All SPOT users are trained, and the addition of a new KPI “Sustainability” based on SPOT results during a product development project
Capacity building and associated monitoring🗸Different tools available for user support (onboarding training, hotline, and newsletters) help to improve user skills and foster user involvement
Disclaimer/Publisher’s Note: The statements, opinions and data contained in all publications are solely those of the individual author(s) and contributor(s) and not of MDPI and/or the editor(s). MDPI and/or the editor(s) disclaim responsibility for any injury to people or property resulting from any ideas, methods, instructions or products referred to in the content.

