Article

Effect of Biochar Application and Mineral Fertilization on Biomass Production and Structural Carbohydrate Content in Forage Plant Mixture

by
Wojciech Stopa
,
Barbara Wróbel
*,
Anna Paszkiewicz-Jasińska
and
Maria Strzelczyk
Institute of Technology and Life Sciences-National Research Institute, Falenty, 3 Hrabska Avenue, 05-090 Raszyn, Poland
*
Author to whom correspondence should be addressed.
Sustainability 2023, 15(19), 14333; https://doi.org/10.3390/su151914333
Submission received: 25 August 2023 / Revised: 13 September 2023 / Accepted: 25 September 2023 / Published: 28 September 2023

Abstract

:
Biochar, a fine-grained porous material, exhibits properties that improve soil quality on agricultural land. Biochar, in combination with mineral fertilizers in perennial mixed crops, has so far not been studied for its effect on biomass production and feed value. The study, conducted in 2021 and 2022, aims to investigate the impact of different biochar application rates (alone and in combination with high and low NPK (nitrogen, phosphorus, potassium) fertilizer dosages) on the yield and structural carbohydrate content in grass–legume mixtures. Thus, a two-factorial pot study consisting of 36 pots was established in 2021. The study was set up in a randomized block design with nine fertilization treatments in four replicates. The factors studied were the rate of biochar (0, 5, and 10 Mg ha−1) and the rate of NPK mineral fertilizer application (0, 105, and 185 kg ha−1). First, biochar was applied and then the grass–legume mixture was sown, consisting of Lolium perenne L., Festuca arundinacea Schreb., Dectylis glomerata L., Lolium multiflorum Lam., Phleum pratense L., Festuca rubra L., Festuca ovina L., Poa pratensis L., Trifolium repens L., and Medicago sativa L. In both years of the study, during the growing season, plant biomass was harvested three times to assess biomass production and structural carbohydrate content. In the collected samples, neutral detergent fiber (NDF), acid detergent fiber (ADF), and acid detergent lignin (ADL) were examined, and, based on these, dry matter digestibility (DDM), dry matter intake (DMI), and relative feed value (RFV) were calculated. Compared to the control, the biochar addition increased the biomass production by 6.7–14.4% in the first year and by 49–59% in the second year after application. The addition of biochar in combination with NPK fertilization caused an increase in biomass production—22–45% in the first year and 71–136% in the second year after application. The structural carbohydrate content in the mixture depended neither on the biochar dose nor on fertilization. On the other hand, the most significant differences for the studied parameters were observed due to different harvest dates.

1. Introduction

Globally, grasslands cover the largest area of agricultural land. They occur on more than 30% of agricultural land in Europe and almost 70% worldwide, serving many important roles in the environment [1]. Due to high plant species richness, they have high biological and productive value [2]. Their proper maintenance and utilization affect the activation of anti-erosion processes [3] and restoration and purification of the environment [4]. They also contribute to carbon sequestration [5,6] and provide a constant source of roughage for herbivores [7]. In agricultural practice, many pratotechnical treatments are used to increase the production potential of grassland plants. They include fertilization, reseeding or grazing [8], growth stimulators including biochar [9], and adjusting the time of harvests to maximize forage yields [10].
The push for sustainable grassland management is particularly important since agri-food systems both significantly contribute to the global economy and are a source of greenhouse gas emissions, biodiversity loss, and water and soil pollution [11]. The use of mineral fertilizers to increase forage production on grasslands involves the use of finite sources of raw materials such as phosphorus (P), or electricity to produce nitrogen (N). From a technological and social perspective, it is presumed that the use of these raw materials in sustainable efficient biomass production would be beneficial to minimize their loss [12,13].
Recent droughts occurring across Europe caused declines in yields on permanent grassland and attracted attention to the cultivation of grass–legume mixtures in grasslands established on arable land. For instance, grass–legume mixtures are used on meadows, grasslands, and pastures. Usually, plant species used in commercially available seed mixtures have a high yield and are grown mainly in pastures with perennial use [14,15]. Legumes are characterized by a high ability to form grassland communities with other species and high retention rates in swards, and are a source of secondary metabolites [16,17]. Often, mixtures consisting of three–four species of grasses and one–two species of legumes are used when establishing grasslands. The grasslands can consist of the following species: Lolium perenne L., Lolium multiflorum L., Dactylis glomerata L., Phleum pratense L., Festuca pratensis L., Festuca arundinacea L., Arrhenatherum elatius L., Trifolium pratense L., Trifoliumrepens repens L., and Medicago sativa L., depending on the duration of cultivation and purpose. The mixtures have also proven successful in meadow and pasture restoration systems, prior to reseeding and artificial regeneration [18].
The plant species richness of the grass–legume mixtures has an impact on the dry weight of forage produced (especially on nutrient-poor grasslands) [19], as well as increasing biodiversity [20], reducing variability in aboveground plant biomass harvested from year to year [21], reducing the incidence of weeds [22], improving soil fertility [23] and the activity and stability of the soil microbial community [24], and increasing the net profits of farmers [25]. These factors also depend on the plant species used in the mix, land management practices, and general environmental characteristics. To restore meadows and increase hay production, species-rich mixtures of grasses and legumes are sown on ex-arable fields (e.g., after cereal crops). Their effect persists for at least eight years [20]. Particularly under nutrient-poor conditions, grass–legume mixtures rich in larger numbers of species are able to harvest more limited resources and convert them into biomass more efficiently [26].
Biochar is a fine-grained porous material formed by the thermal conversion of organic matter. Depending on the material of production and the course of the pyrolysis process, it can have different physical and chemical properties [27,28,29]. Usually, it decomposes 10 to 100 times slower than non-pyrolyzed organic matter [30]. Soil application of biochar can sequester carbon dioxide and reduce greenhouse gas emissions [31], improve the properties of the soil matrix [32,33], promote plant growth [34], and reduce fertilizer losses [35,36]. Biochar, thanks to its porous structure, usually alkaline pH, and large active surface area, increases the availability of plant nutrients in the soil [37,38]. It is also used as a product that helps restore natural conditions in grasslands. By using biochar produced from low-cost biomass (e.g., wood waste), farmers’ expenditure can be offset by the beneficial effects of biochar [39]. Also, many studies have shown that combining biochar with organic and mineral fertilizers has positive effects on plant growth and nutrient availability [40,41,42].
The key forage parameters of grasses and legumes found in grass–legume mixtures are structural carbohydrates (cellulose, hemicelluloses, and lignin) divided into fractions that include: neutral detergent fiber (NDF), which determines the amount of feed the animal is able to consume; acid detergent fiber (ADF), whose content affects the digestibility of feed; and acid detergent lignin (ADL), that determines the fraction of lignin in ADF. They have a direct impact on livestock production, which is crucial to livelihoods and socioeconomic development around the world and to achieving the goals set in the UN Agenda 2030 (UN Agenda for Sustainable Development 2030 [43]). Their content depends on the plant species, the developmental stage of the plants at the time of harvest, and, most importantly, the conditions of plant growth and development (mainly rainfall deficit).
A review of the available literature shows that there are few studies on the effects of biochar on improving crop yields and quality. To date, most studies have focused on the effects of biochar application primarily on annual crops [44,45,46,47,48]. In contrast, few have looked at the effectiveness of biochar application on perennial crops including perennial grasses and legumes (meadows) [49,50,51,52]. The results of these experiments indicate that biochar can significantly improve plant growth, fodder yield, quality, and the biological properties of the soil. After its application, the impact of biochar varies from year to year, being the smallest in the first year and increasing subsequently. Therefore, this study aims to investigate the impact of different biochar application rates, alone and in combination with different NPK fertilizer dosages, on the yield and structural carbohydrate content of the grass–legume mixture in the first and second year after biochar application and NPK fertilization.

2. Materials and Methods

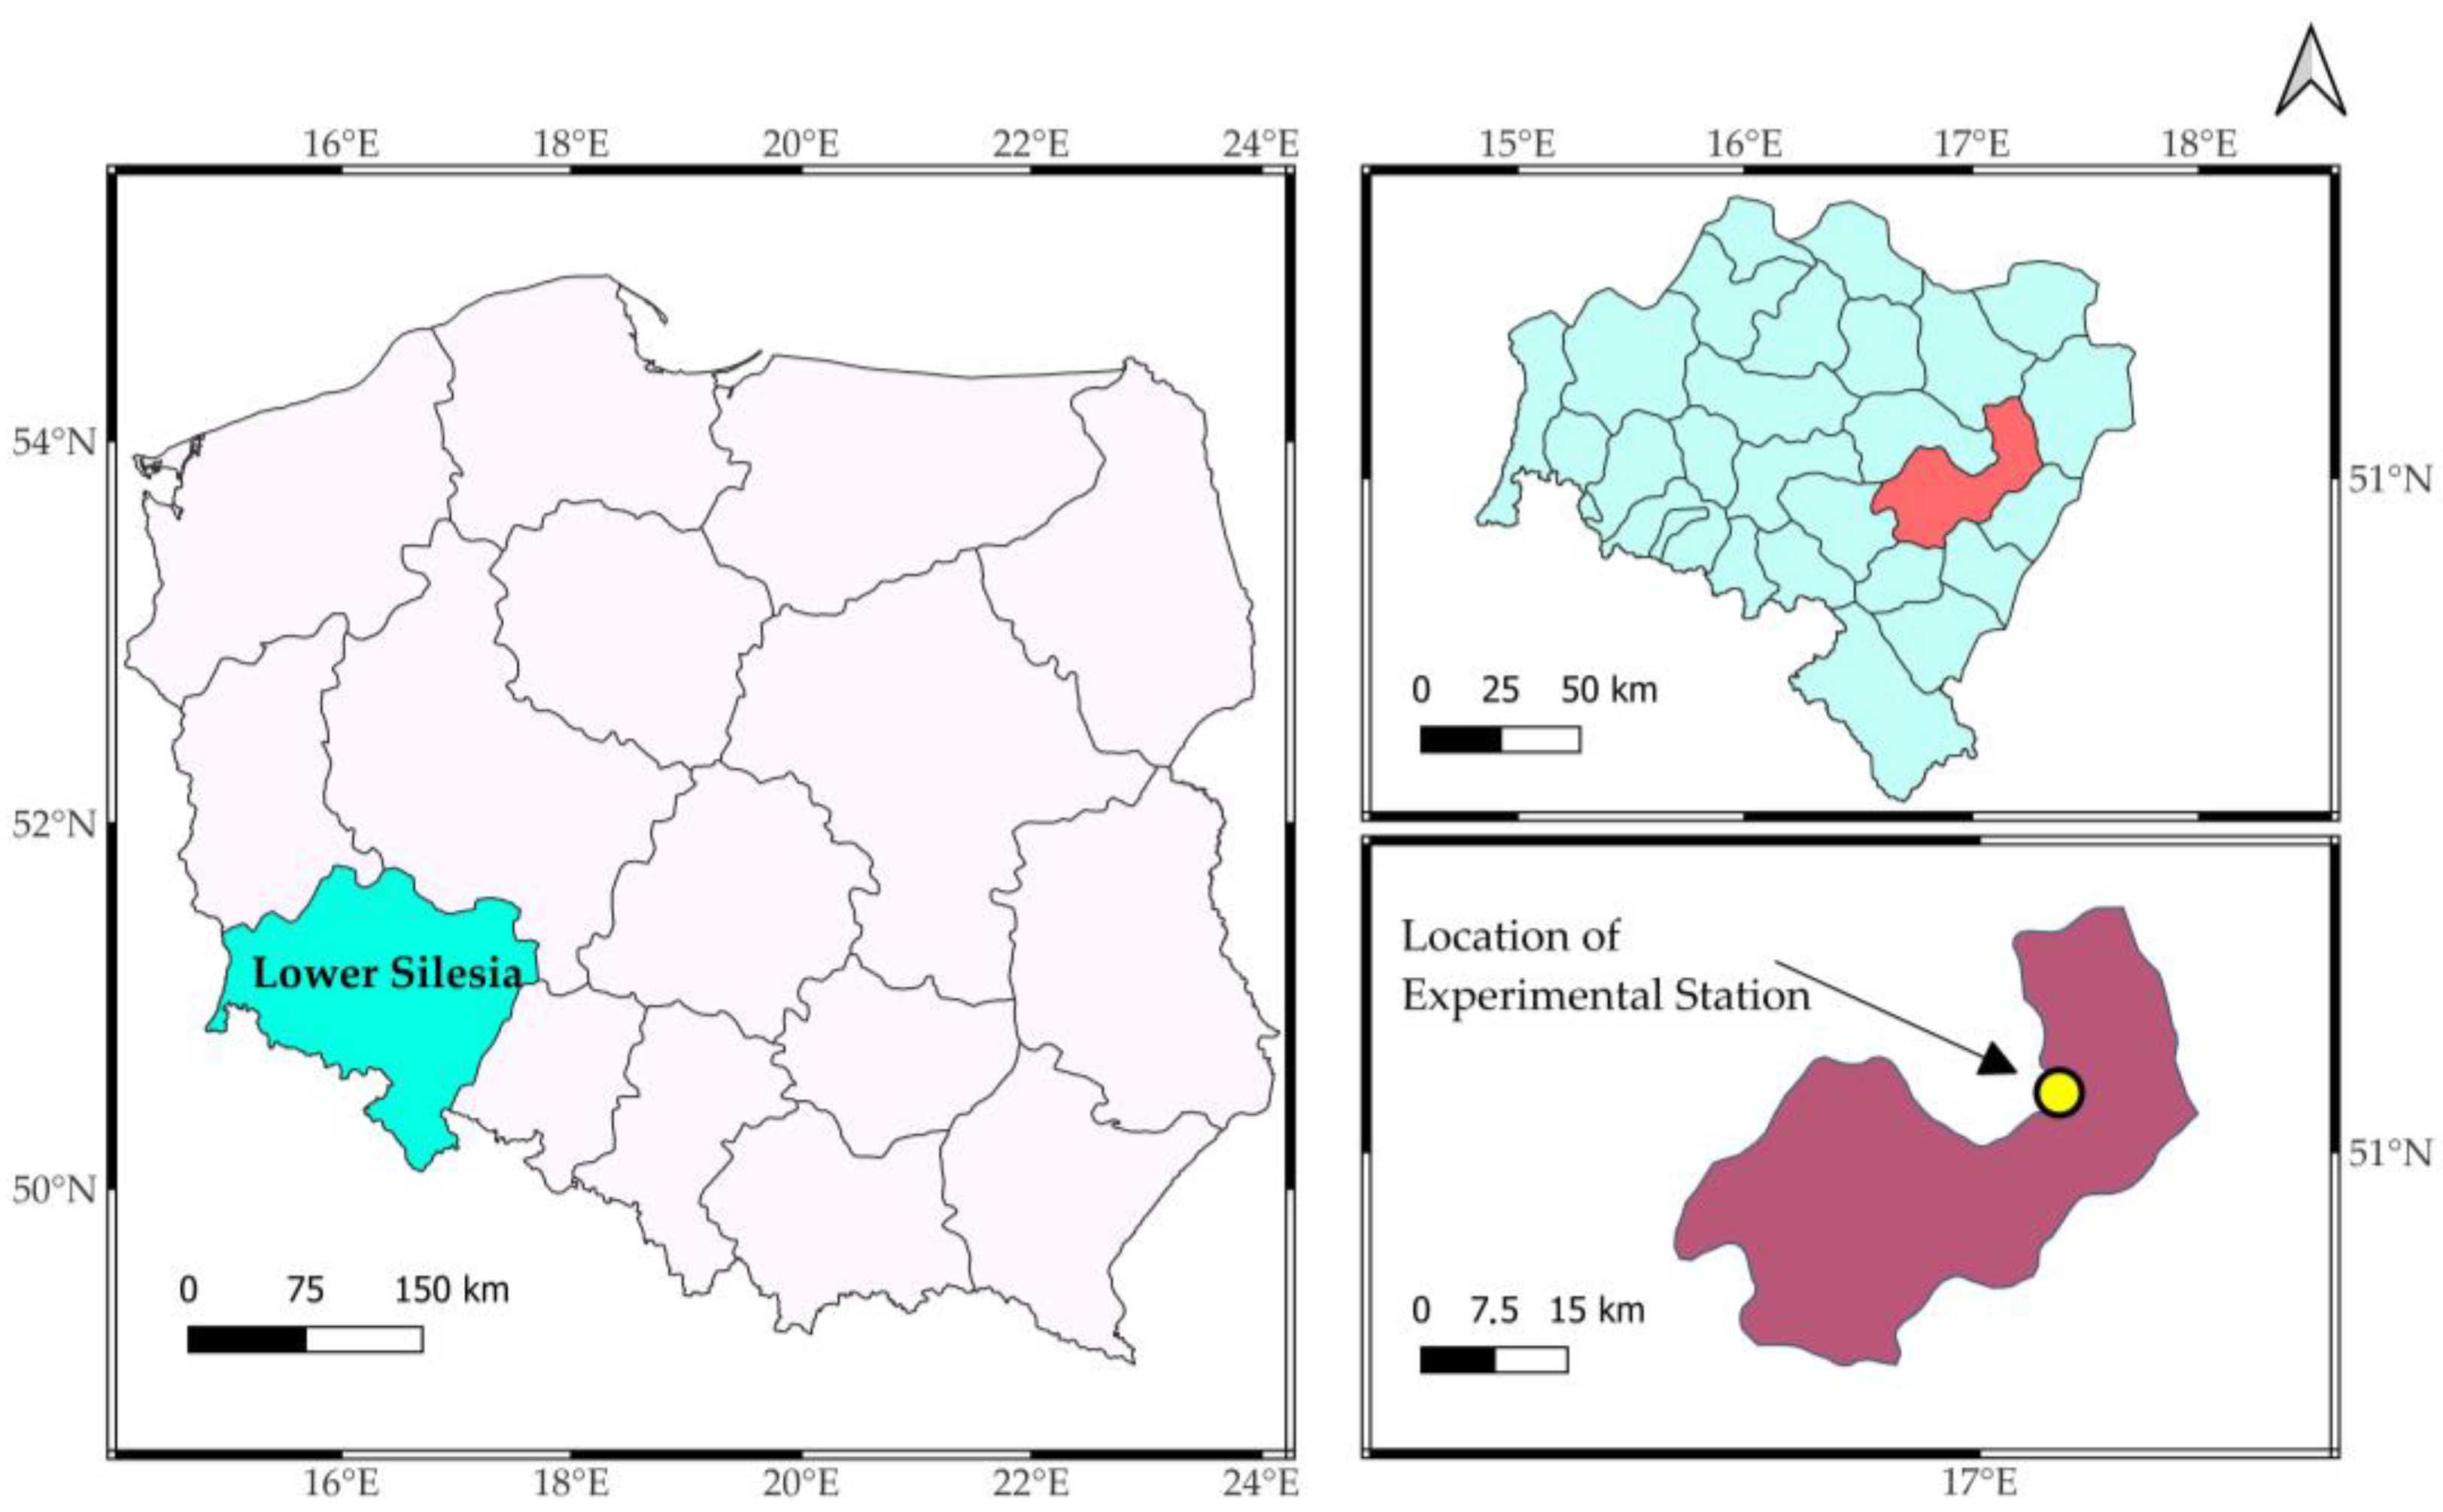
2.1. Study Area Characteristics

This research was carried out in 2021 and 2022 as a pot experiment at the research station of the Institute of Technology and Life Sciences—National Research Institute in Kamieniec Wrocławski (51°05′43.9″ N 17°10′03.9″ E), Lower Silesia, Poland. The location of the study site is shown in Figure 1.

2.2. Description of the Biochar (BC)

The biochar used in the study was purchased from a company specializing in the production of biochar and biomass processing. The biochar was produced in a coalification reactor using a cogeneration process. Sunflower husks were substrates in the process. The pellet obtained from the thermal conversion of organic matter was prepared for soil application by grinding with a cutting mill using a screen mesh, with a of size 0.01–0.1 mm. An abbreviated characterization of the biochar used in the study is presented in Table 1.

2.3. Grass–Legume Mixture

A grass–legume mixture consisting of 8 species of grasses and 2 species of legumes (common throughout Europe) was sown in the pots.
The percentage of species in the seed mix is shown in Table 2.

2.4. Study Design and Conduct

A two-factor study with a randomized block design was conducted with three biochar doses (0, 5, and 10 Mg ha−1) as a first factor and three mineral NPK fertilization levels (0, 115, and 185 kg ha−1) as a second factor. The experiment was set up in four replications. The list of treatments is shown in Table 3.
The study was conducted in pots with a diameter of 34 cm, an area of 0.09 m2 and a volume of 18 dm3. The pots were buried in the ground to replicate growing conditions close to natural conditions, including thermal conditions. There were thirty-six pots used in the study, arranged in four rows of nine each. The pots were filled with soil, taken from the topsoil of an arable field localized at the Experimental Station site (Figure 1). According to the WRB (World Reference Base for Soil Resources) classification, the soil was classified as podzols [53]. Before proceeding further, cumulative soil samples were taken from each pot for chemical analysis (1 kg total). The soil’s abundance of basic macronutrients (in g kg−1 dry mass soil) was as follows: nitrogen (N) 1.25, phosphorus (P) 0.93, potassium (K) 0.23 and pHH2O 5.87.
After filling the pots with soil, biochar and fertilizers were applied. This was carried out on the 20th of April 2021. The biochar was applied in 24 pots at 45 g (treatments: V1, V4, V7) and 91 g (treatments: V2, V5, V8) of biochar per pot, which equaled 5 Mg and 10 Mg of biochar per hectare. Then, the biochar was mixed evenly with a 30 centimeter layer of soil and a mixture of grass and legumes (Table 2) at 0.36 g of seeds per pot, in accordance with the manufacturer’s sowing standard of 40 kg ha−1; the first of three fertilization treatments was made (Table 4). In treatments V6, V7, and V8, 0.89 g of ammonium nitrate, 0.58 g of superphosphate, and 0.45 g of potassium salt was used, while in treatments V3, V4, and V5, reduced doses of 0.5 g of ammonium nitrate, 0.35 g of superphosphate, and 0.3 g of potassium salt were applied, which corresponded to 20 kg N ha−1, 15 kg P ha−1, and 20 kg K ha−1. The second and third fertilizations were carried out after the first and second biomass harvests. Correspondingly, 0.60 g of urea fertilizer and 0.3 g of potassium salt (30 kg N ha−1 and 20 kg K ha−1) were used in treatments V6, V7, and V8. In treatments V3, V4, and V5, 0.39 g of urea and 0.16 g of potassium salt (20 kg N ha−1 and 10 kg K ha−1) were used. The total fertilization rates (Table 4) were applied during the study year. The same rates of fertilizer were applied in the second year of the study.
In both years of the study, the plant material was sampled three times during the growing season. The biomass was harvested on the following dates: 16 July, 29 September, and 12 November 2021; and 26 May, 25 July, and 4 October 2022. Biomass was manually cut from each pot at about 5 cm. The harvested plant material was weighed and then segregated into three groups: grasses, legumes, and others (weeds). Biomass production (DM per pot) and the percentage of each group were determined for each pot. The percentages are shown in Figure 2.

2.5. Analytical Methods Used

Chemical analyses of the soil were performed using the following methods: total nitrogen by the Kjeldahl indophenol colorimetric method (UV/VIS 916 spectrophotometer, GBC, Melbourne, Australia); phosphorus by colorimetric method using ammonium molybdate and sodium pyrosulfate; potassium by flow analysis (CFA) using a flow spectrophotometer (Skalar Analytical BV, Breda, The Netherlands); and soil pH, measured in H2O, by the potentiometric method (Cyber Scan PCD6500, Eutech Instruments, Nijkerk, The Netherlands).
The harvested plant biomass was dried at 70 degrees Celsius and milled. In the harvested biomass, the content of NDF, ADF, and ADL was determined by the NIRS method using an NIRFlex N-500 near-infrared spectrometer (BuchiLabortechnik AG, Flawill, Switzerland) with INGOT® meadow hay calibrations. In addition, RFV, DDM%, and DMI% of body weight were calculated. The following formulas were used to calculate the RFV, using estimations of the forage’s digestible dry matter (DDM%) and potential dry matter intake (DMI%) based on the ADF and NDF fractions [54]:
DDM = 88.9 − 0.779 × ADF (% of DM)
D M I = 120 N D F ( %  of body weight )
R F V = D D M · D M I 1.29
The obtained results from the above formulas were assigned (based on the RFV index) to each quality class: RFV > 151 (prime); RFV 151–125 (1st); RFV 124–103 (2nd); RFV 102–87 (3rd); RFV 86–75 (4th); and RFV < 75 (5th).

2.6. Statistical Analysis

The Statistica v. 6.0 (Statsoft, Poland) and XLSTAT programs were used for the statistical processing of the results. The Shapiro–Wilk test and the Levene test were used to statistically determine the data’s normality and variance homogeneity prior to the analysis. The results allow us to conclude that the distributions of the measured variables do not differ significantly from the normal distribution. The model included the fixed effects of biochar dose (BC), NPK fertilization level (NPK), and harvest number (H). The random effects were BC*NPK, BC*H, NPK*H, and BC*NPK*H. A three-way analysis of variance (ANOVA) was then used to look at the differences between treatments. If the treatment effect was significant, Tukey’s pairwise comparison was performed to isolate the treatment means that were significantly different at a 5% significance level. The significance of the effect of the experimental factors studied was verified using the Tukey test at the significance level of α = 0.05. The XLSTAT program was used for the principal component analysis (PCA).

3. Results

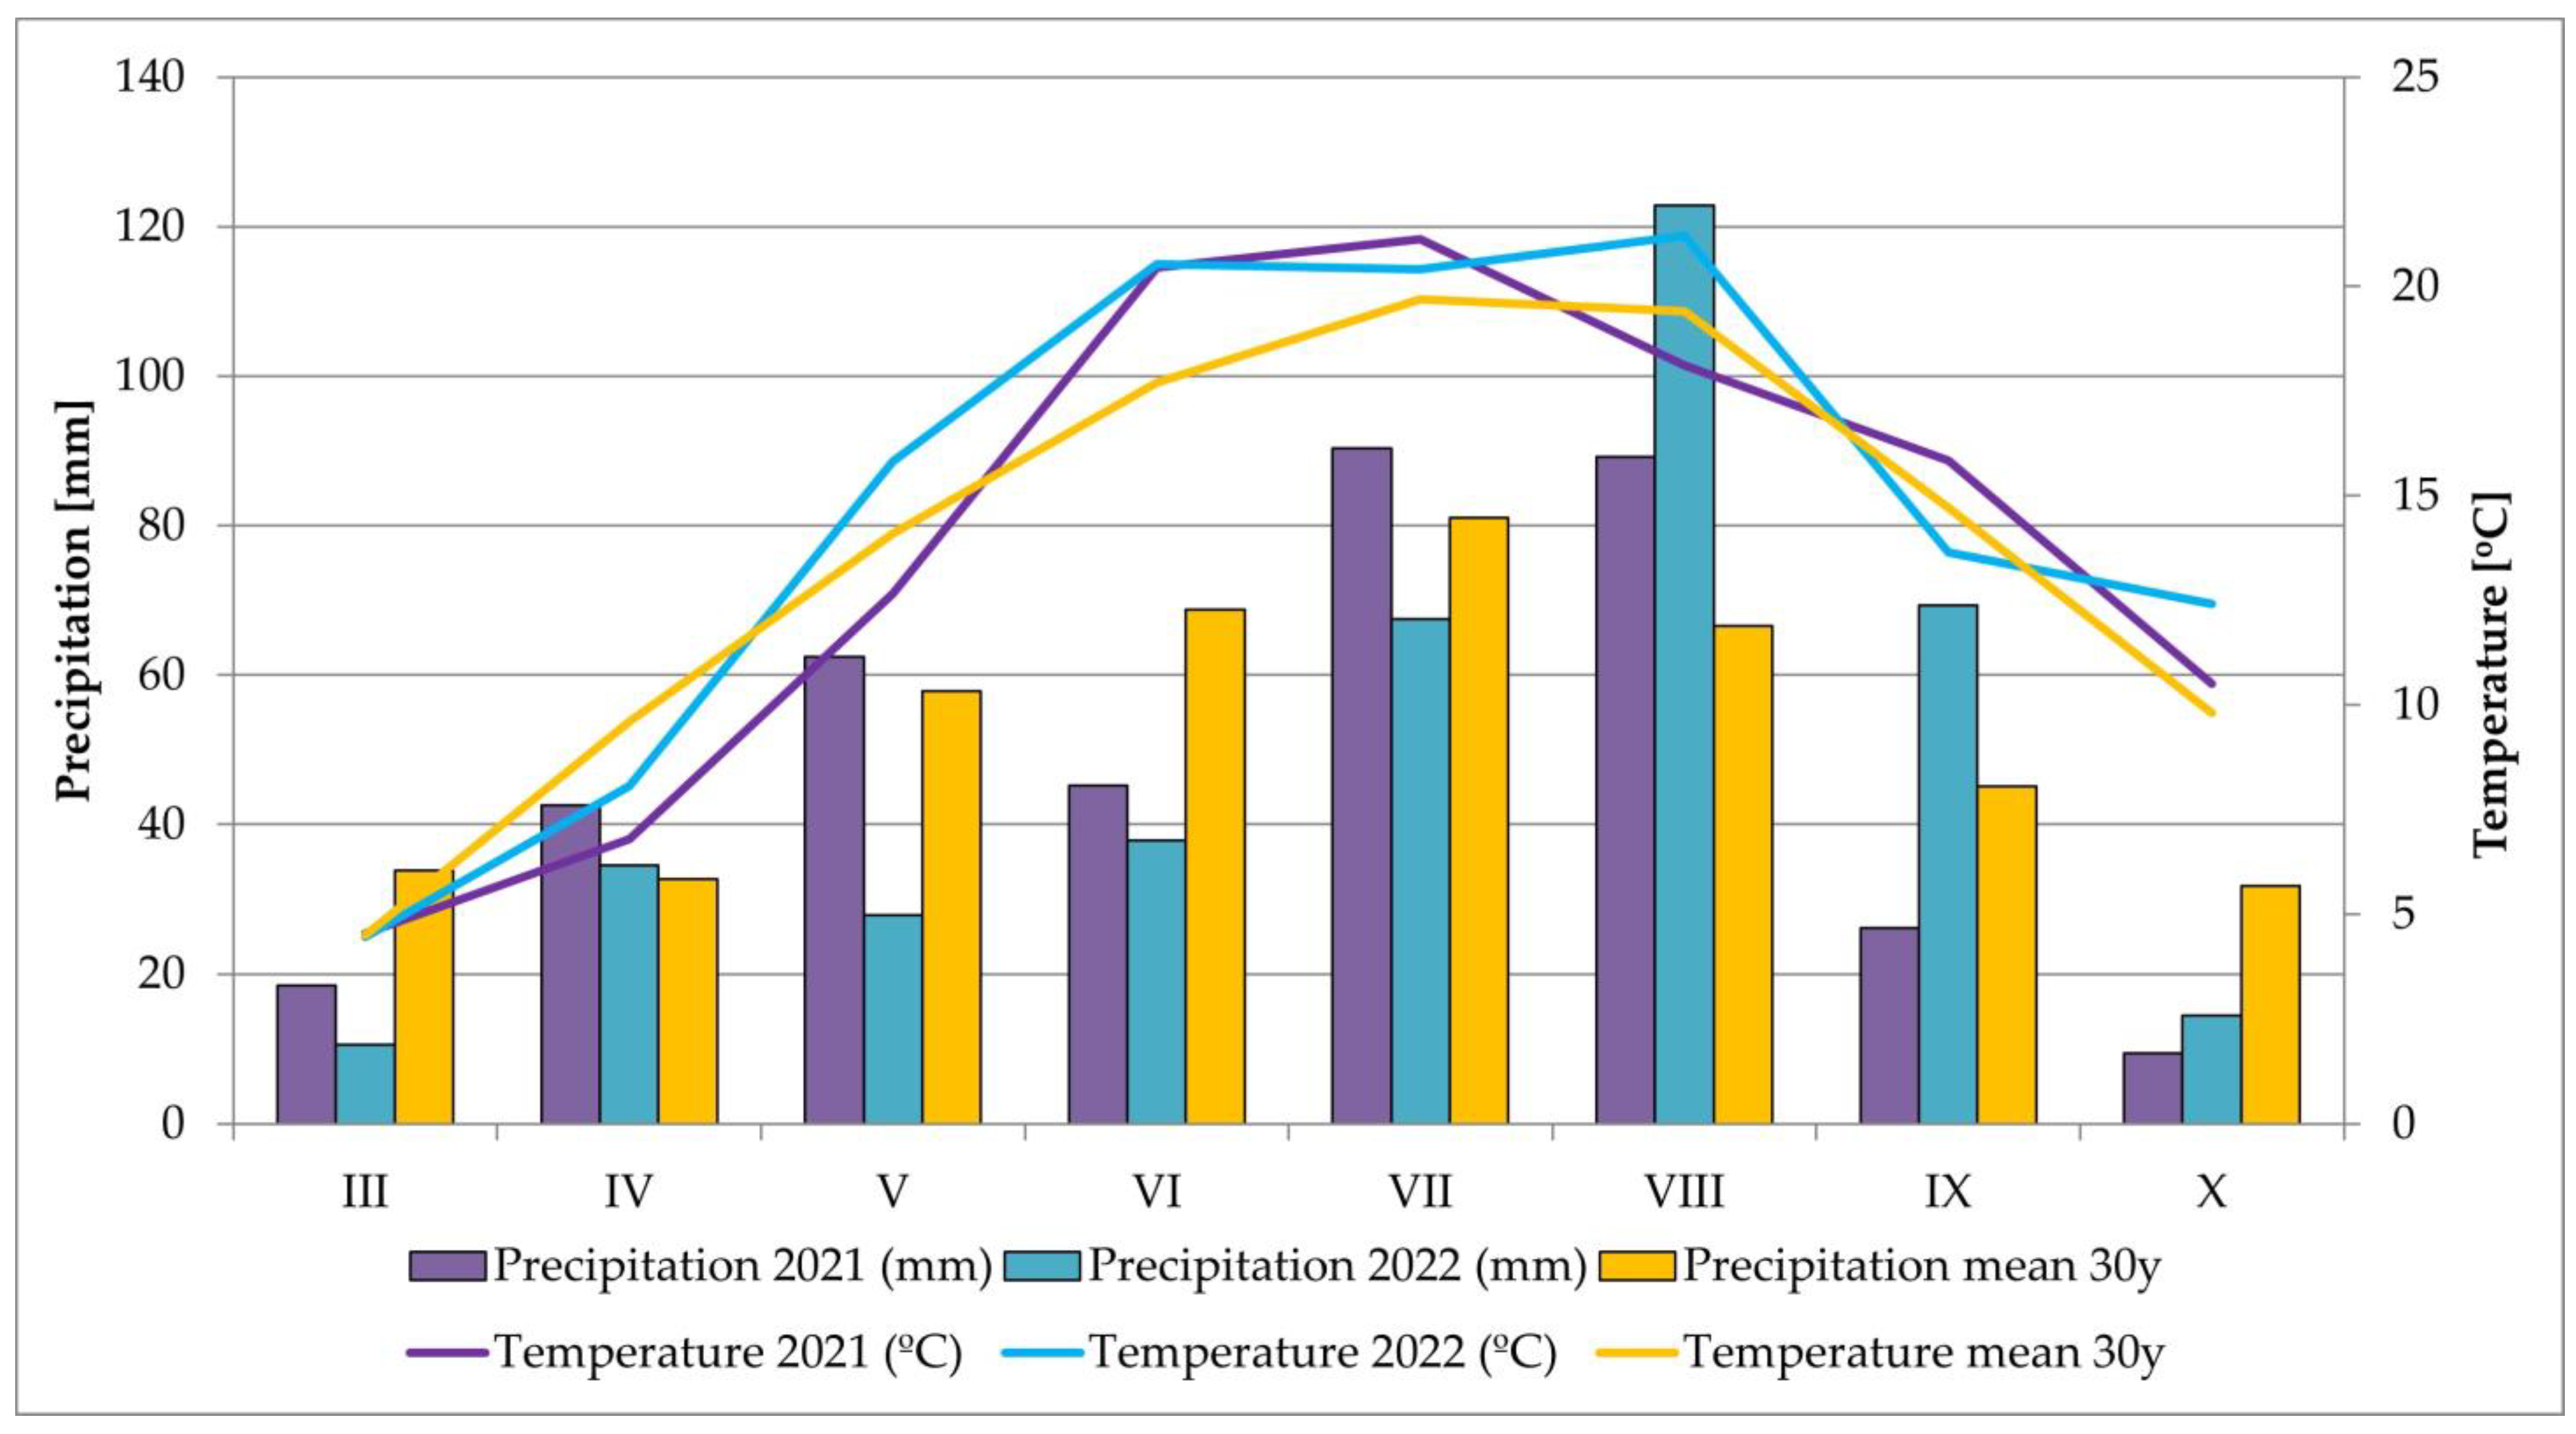
3.1. Weather Conditions

Weather conditions are one of the factors determining the amount and quality of the yields obtained. For the purpose of this article, the analysis of the precipitation and the temperature was performed on the period from III to X (March to October)—the period of grass vegetation. Meteorological data was obtained from a publicly accessible database made available by the Institute of Meteorology and Water Management—National Research Institute [55] of weather conditions. The temperature and precipitation of the years covered by the study has been compared to averages from 1991 to 2020 and is presented in Figure 3.
In the first year of the study, the average temperature in the period from III (March) to X (October) was 13.7 °C—equal to the multi-year average temperature in this period. In 2022, it was 0.2 °C lower. Despite the similar average values per year and the multi-year average, the distribution of the temperatures in the study period was slightly different from that of the multi-year period when the temperature changes were noticeably gentler. In both 2021 and 2022, the beginning of the growing season was cooler than in the multi-year period, especially in the first year of the study when lower temperatures persisted until May. Also, the greatest difference in average monthly air temperature was recorded in May; it reached 15.8 °C in 2022, which was 1.7 °C higher than the multi-year average, and as much as 3.2 °C higher than the average value recorded in the first year of the study. June 2021, July 2021, and August 2022, with an average temperature of 21.2 °C, were noticeably warmer than the multi-year average. The largest difference in average monthly temperatures during the study period, compared to the multi-year period, occurred in June and equaled 2.8 °C when it reached 20.5 °C in both years of the study. Also, September, with an average temperature of 15.8 °C, was warmer than the corresponding period from the multi-year period by 1.1 °C in 2021 and by 2.2 °C in 2022. In both years of the study, the end of the growing season was 9.8 °C warmer than the multi-year average temperature.
The amount of precipitation that occurred in the individual study years varied significantly from the multi-year average precipitation total for the period in question. In the analyzed period, 2021, with a total precipitation of 580.8 mm, was exceptionally wet since the total exceeded the multi-year average by 163 mm. Probably, the high availability of water and the fairly even distribution of precipitation during the growing season had a favorable effect on the yield achieved in 2021 (Figure 3), whereas 2022 was characterized by a much larger amplitude of monthly precipitation sums than the first year of the study and a different distribution of precipitation. Similarly to 2022, the months with the lowest precipitation were III (March) and X (October)—the beginning and the end of the growing season. In May, June, and July 2022, the precipitation was definitely lower than both the multi-year average and 2021 (by 27.9 mm, 37.9 mm, and 67.5 mm, respectively). Undoubtedly, low precipitation affected the biomass harvested this year. In 2022, the month with the highest precipitation was VIII—the monthly total reached 122.9 mm and was 56.3 mm higher than the average monthly July precipitation for the multi-year period. In 2022, the total precipitation for the III–X period was 446.7 mm, which was 28.9 mm higher than the multi-year average.

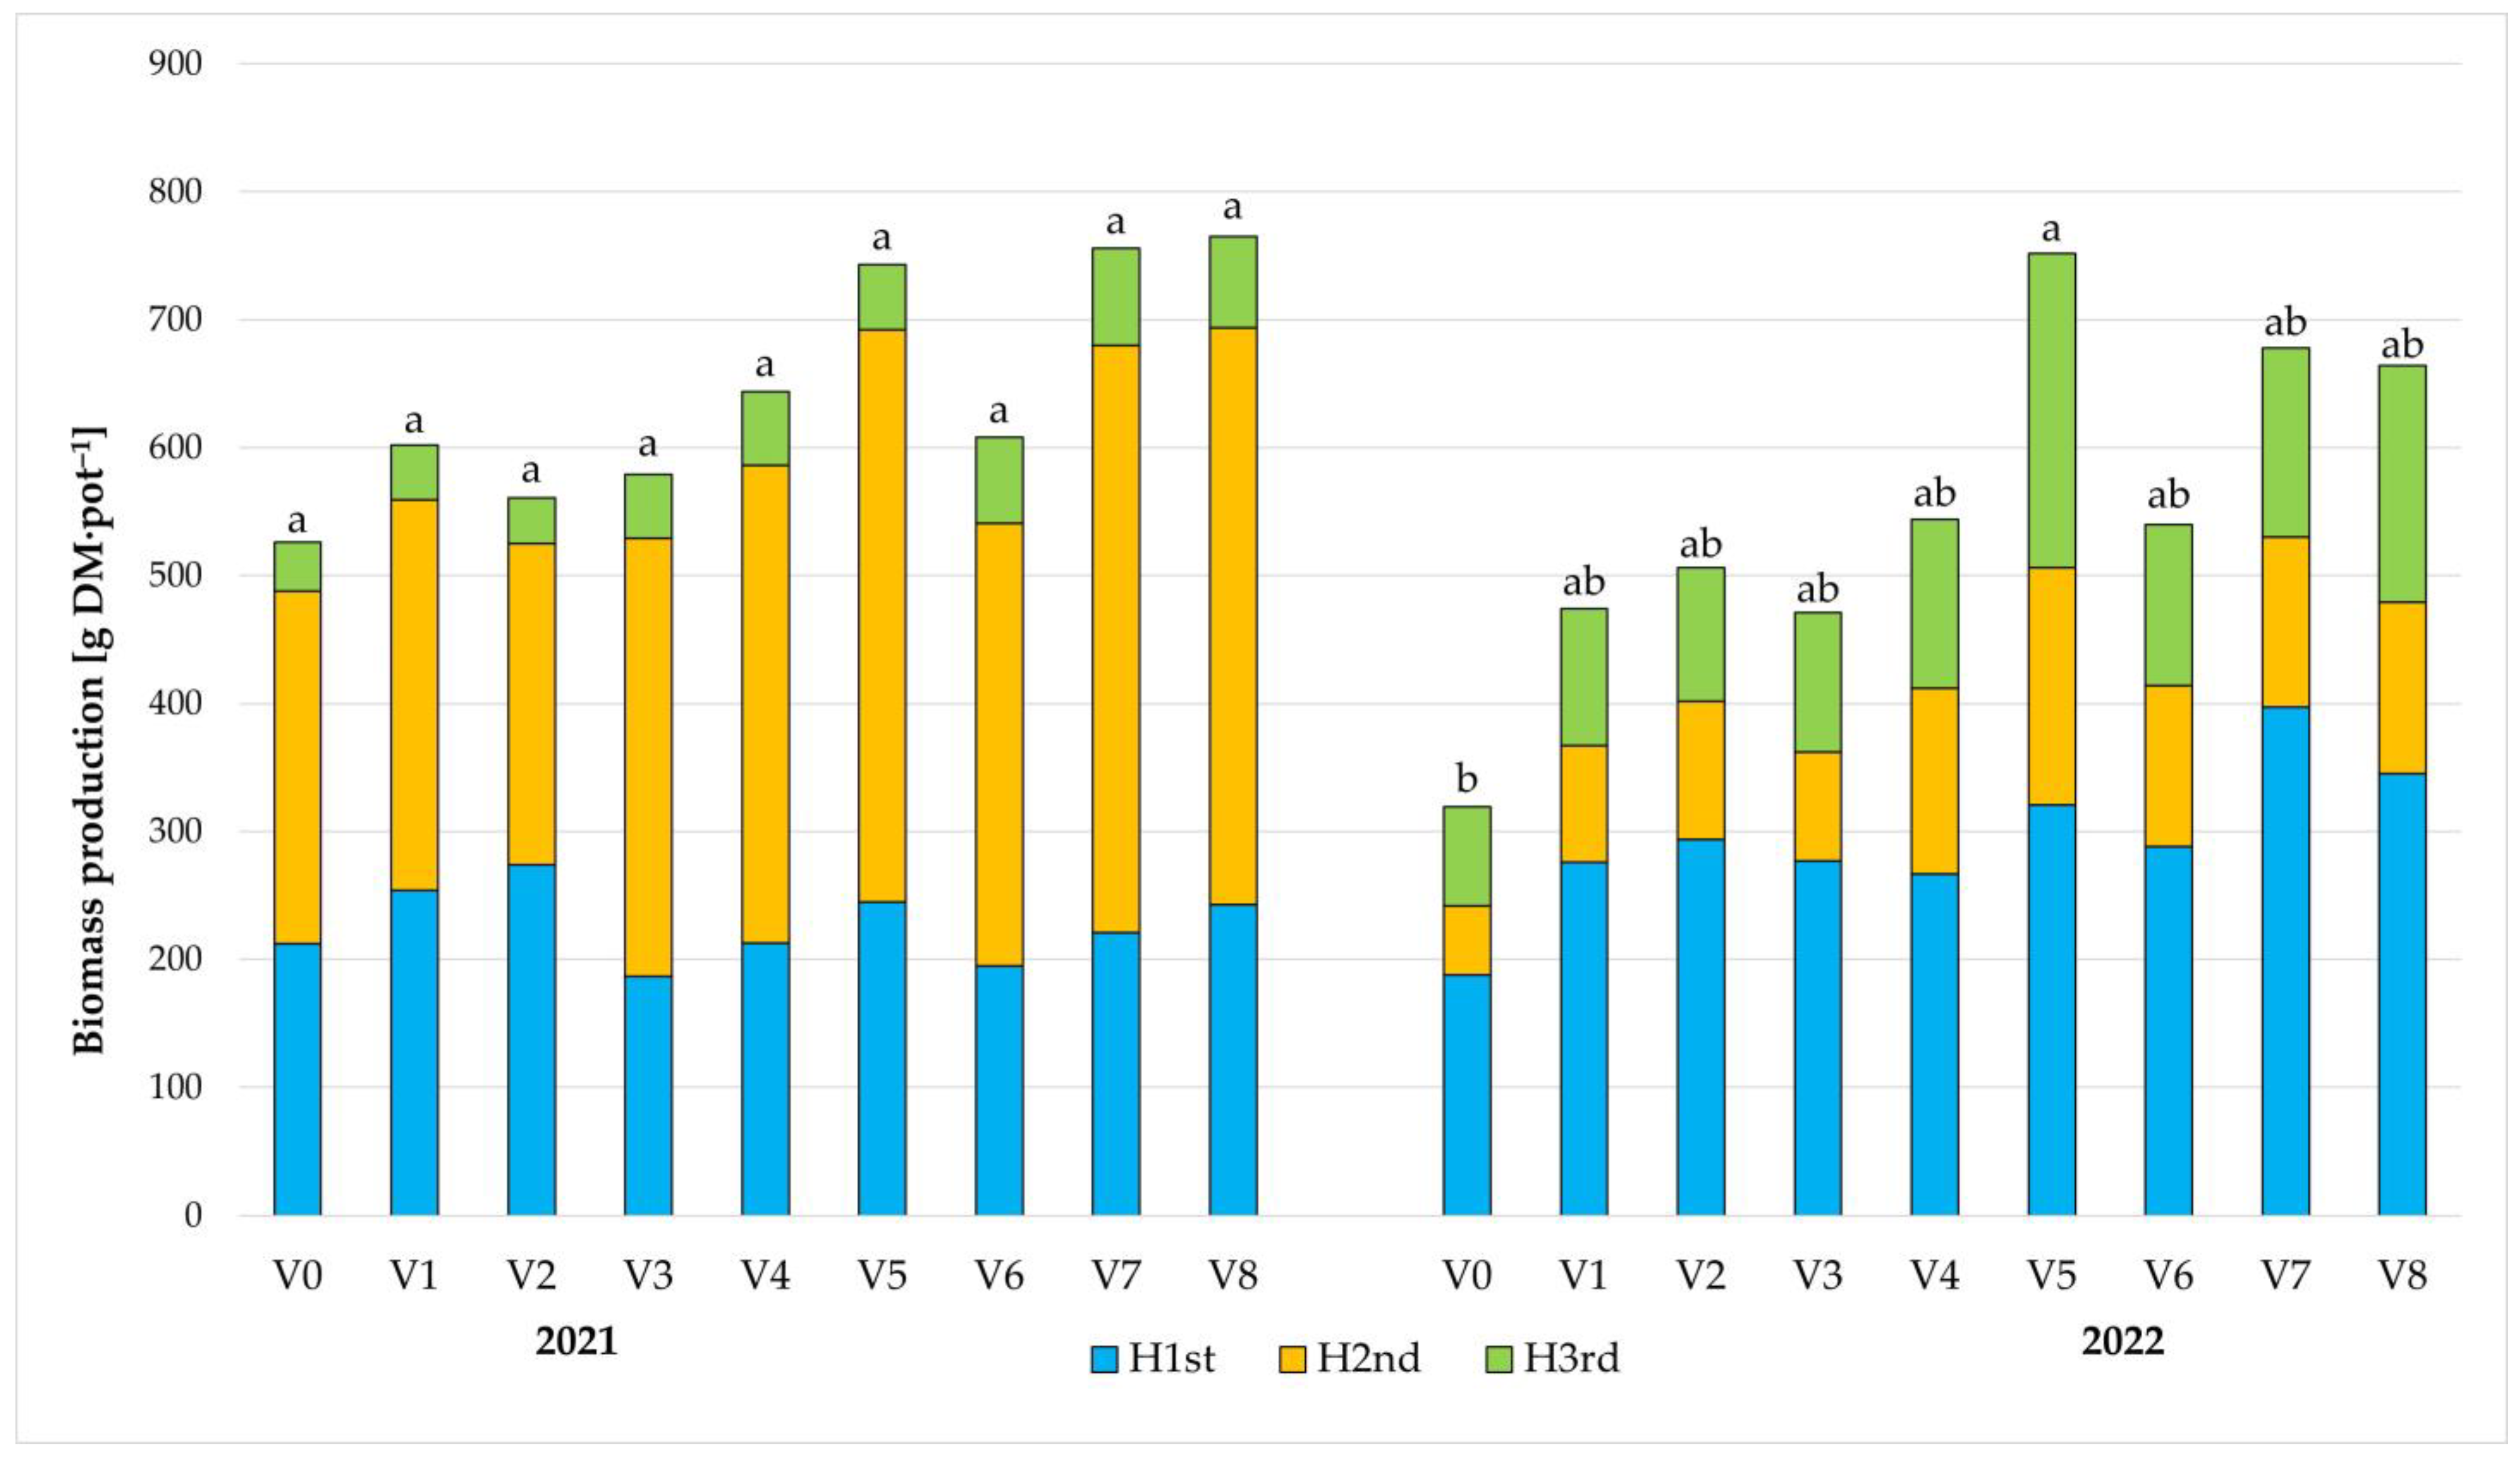
3.2. Biomass Production

On average, plants, regardless of the treatment and sampling date, produced 49.7 g DM of biomass per pot. The statistical analysis indicates a significant effect of all the factors studied on the average biomass production (Table 5). The highest biomass production, regardless of the years of treatment, was observed in the treatments with the highest dose of biochar, i.e., 10 Mg BC, as well as for fertilization with a higher dose of mineral fertilizers i.e., 185 kg ha−1 NPK. On average, regardless of the treatment, the highest biomass production was obtained for the first and the second harvest dates. Significantly, the lowest biomass production was recorded for the third harvest date. Significant variation in biomass production was also observed between the years of the study. The obtained biomass production of the tested grass–legume mixture was significantly higher in the first year of the study (53.6 g DM per pot). In the second year, on average, biomass production, regardless of the BC rate and NPK fertilization rate, was lower by nearly 15%. Furthermore, for both years on average, the following interactions were found: BC*NPK, NPK*H, BC*H, and BC*NPK*H. For both years individually, the analysis of the effect of the studied factors (BC dose and NPK fertilization) showed significant differences in biomass production only in the second (2022) year of the study (Table 5).
The obtained biomass production of the studied mixture was significantly higher in the first year of the study (53.6 g DM per pot). Depending on the treatments in the first year, it ranged from 9.0 ± 4.1 g per pot in the V2 on the third harvest date to 114.8 ± 15.9 g DM per pot in the V8 on the second date (Figure 4). In the second year of the study, the dry biomass was lower, ranging from 13.5 ± 6.0 g DM per pot for V0 on the second harvest date to 99.3 ± 26.9 g per pot for V7 on the first date. The highest total dry weight was obtained in the first year of treatment for V8, totaling 191.3 g per pot, and in the second year for V5, totaling 188 g per pot. In both years of treatment, the lowest annual dry weight was obtained for the V0 treatment—131.5 g per pot in 2021 and 79.8 g per pot in 2022.
The highest biomass production, regardless of the year of treatment, was observed in the treatments with the highest dose of 10 Mg BC, as well as for fertilization with a dose of 185 kg ha−1 NPK.
In the treatments where no biochar was applied (0 t ha−1 BC), after treatment with 115 kg ha−1 NPK, an increase in biomass production was observed—10% in 2021 and 48% in 2022. After the application of 185 kg ha−1 NPK, an increase in biomass production of 16% (2021) and 69% (2022) was observed. In the treatments where 5 t ha−1 BC was applied without NPK fertilization, an increase in biomass production was observed—14% in 2021 and 49% in 2022, compared to the control (treatment V0). For the treatments with a biochar rate of 10 t ha−1 BC, the increase totaled 7% and 59%. In the treatments with a rate of 115 kg ha−1 NPK for pots with 5 t ha−1 BC, yield increases of 22% and 71% were observed for 2021 and 2022. In pots with a rate of 10 Mg ha−1 BC, the increase was 41% in 2021 and 136% in 2022. In the treatments with the highest fertilization of 185 kg ha−1 NPK, biochar at 5 Mg ha−1 increased the biomass by 44% (2021) and 113% (2022), while biochar at 5 Mg increased the biomass by 45% (2021) and 108% (2022).

3.3. Structural Carbohydrate Content

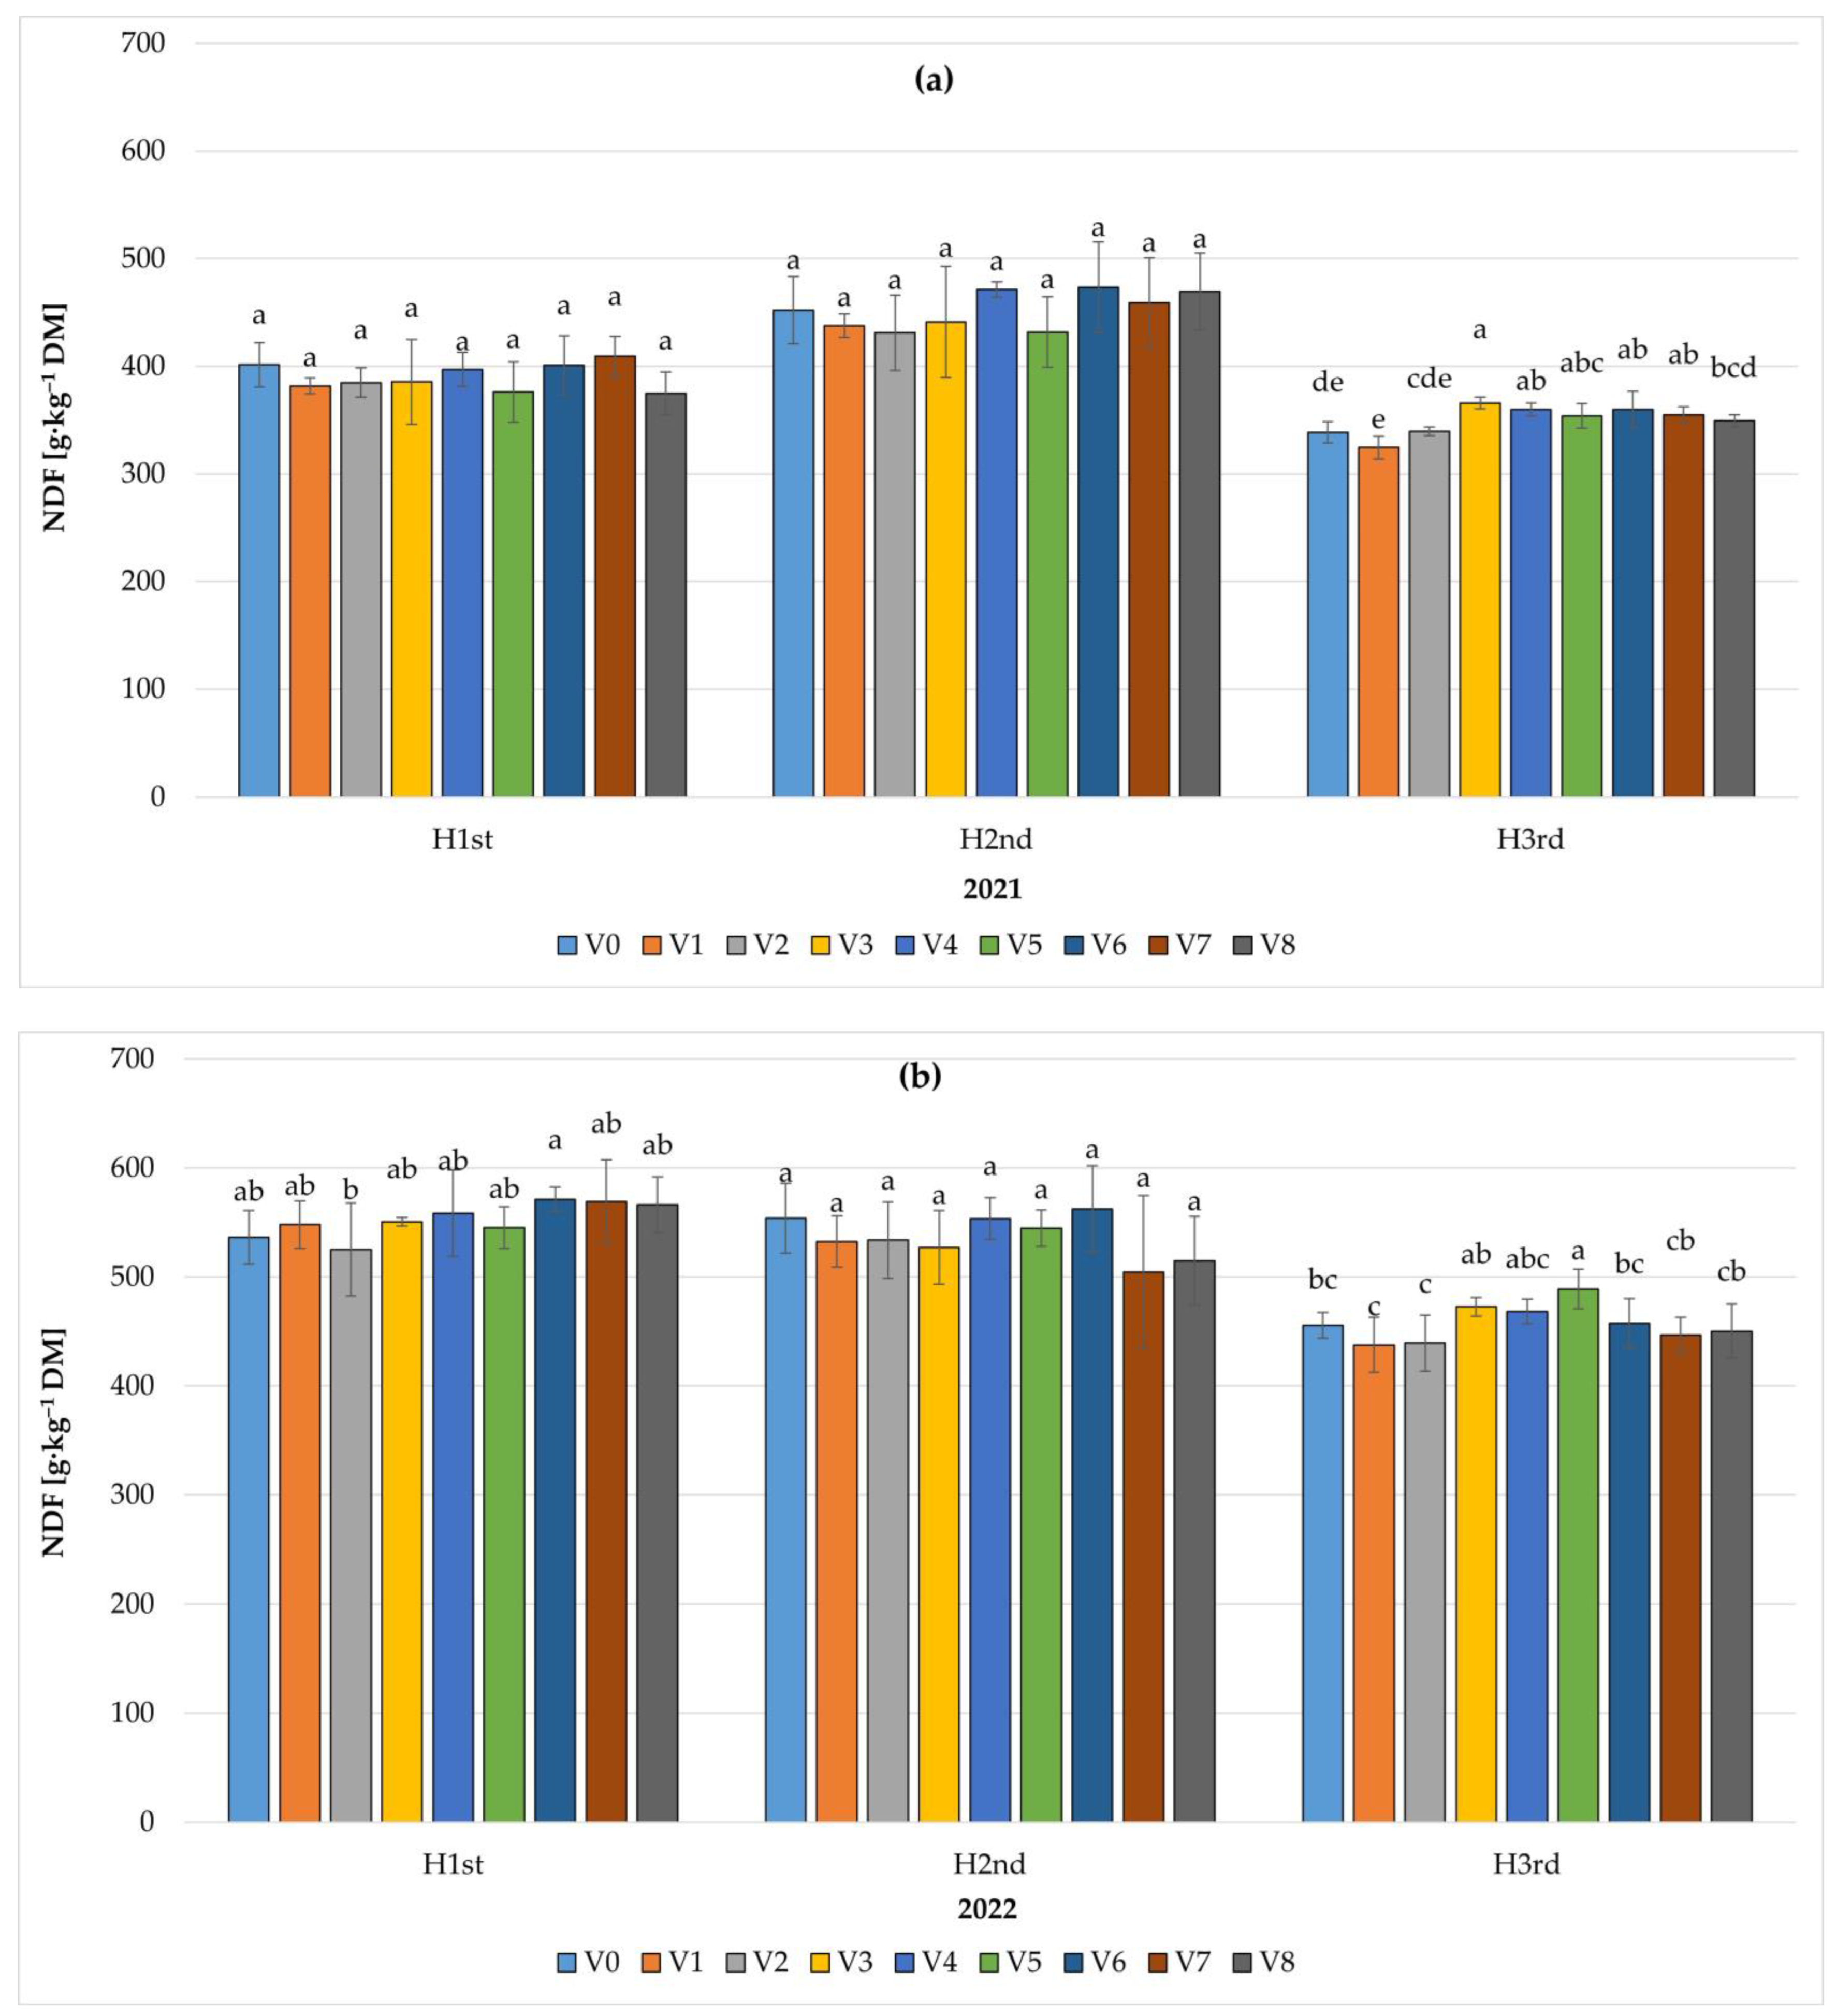
3.3.1. Neutral Detergent Fiber (NDF)

The NDF content of the dry weight of the harvested plants averaged 456.2 g kg−1 DM. The content of the fibrous fraction depended significantly on the harvest date and the year of study. It was also influenced by the following interactions: BC*NPK, NPK*H, BC*H, and BC*NPK*H. Significantly higher average NDF content was found on the second harvest date (494.1 g kg−1 DM). The analysis of the harvest dates in the first year of the study showed that the significantly highest average NDF content occurred on the third harvest date. In the second year, the content of this component was the highest on the first harvest date, and a decrease was noted on subsequent dates. The average content of NDF in the first year of the study was significantly lower (by 118.2 g kg−1 DM) than that obtained in the second year, and totaled 397.1 g kg−1 DM (Table 6).
The NDF contents for different treatments are presented in Figure 5. In all treatments, the NDF contents were lower in the first year of the study and at the third harvest date. In the first year, NDF content ranged from 324.4 ± 25.2 g kg−1 (in the V1 treatment on the third harvest date) to 473.4 ± 42.1 g kg−1 DM (in the V6 treatment on the second date). In the second year, the NDF content was, similarly to the first year, the lowest in the V1 treatment on the third harvest date (437.6 ± 25.2 g kg−1 DM) and the highest (571.4 ± 11.2 g kg−1 DM) in the V6 treatment on the first date. At all harvest dates, in the first year of the study the NDF content relative to the control (V0) was higher in the V7 treatment, and in the second year higher in the V6.

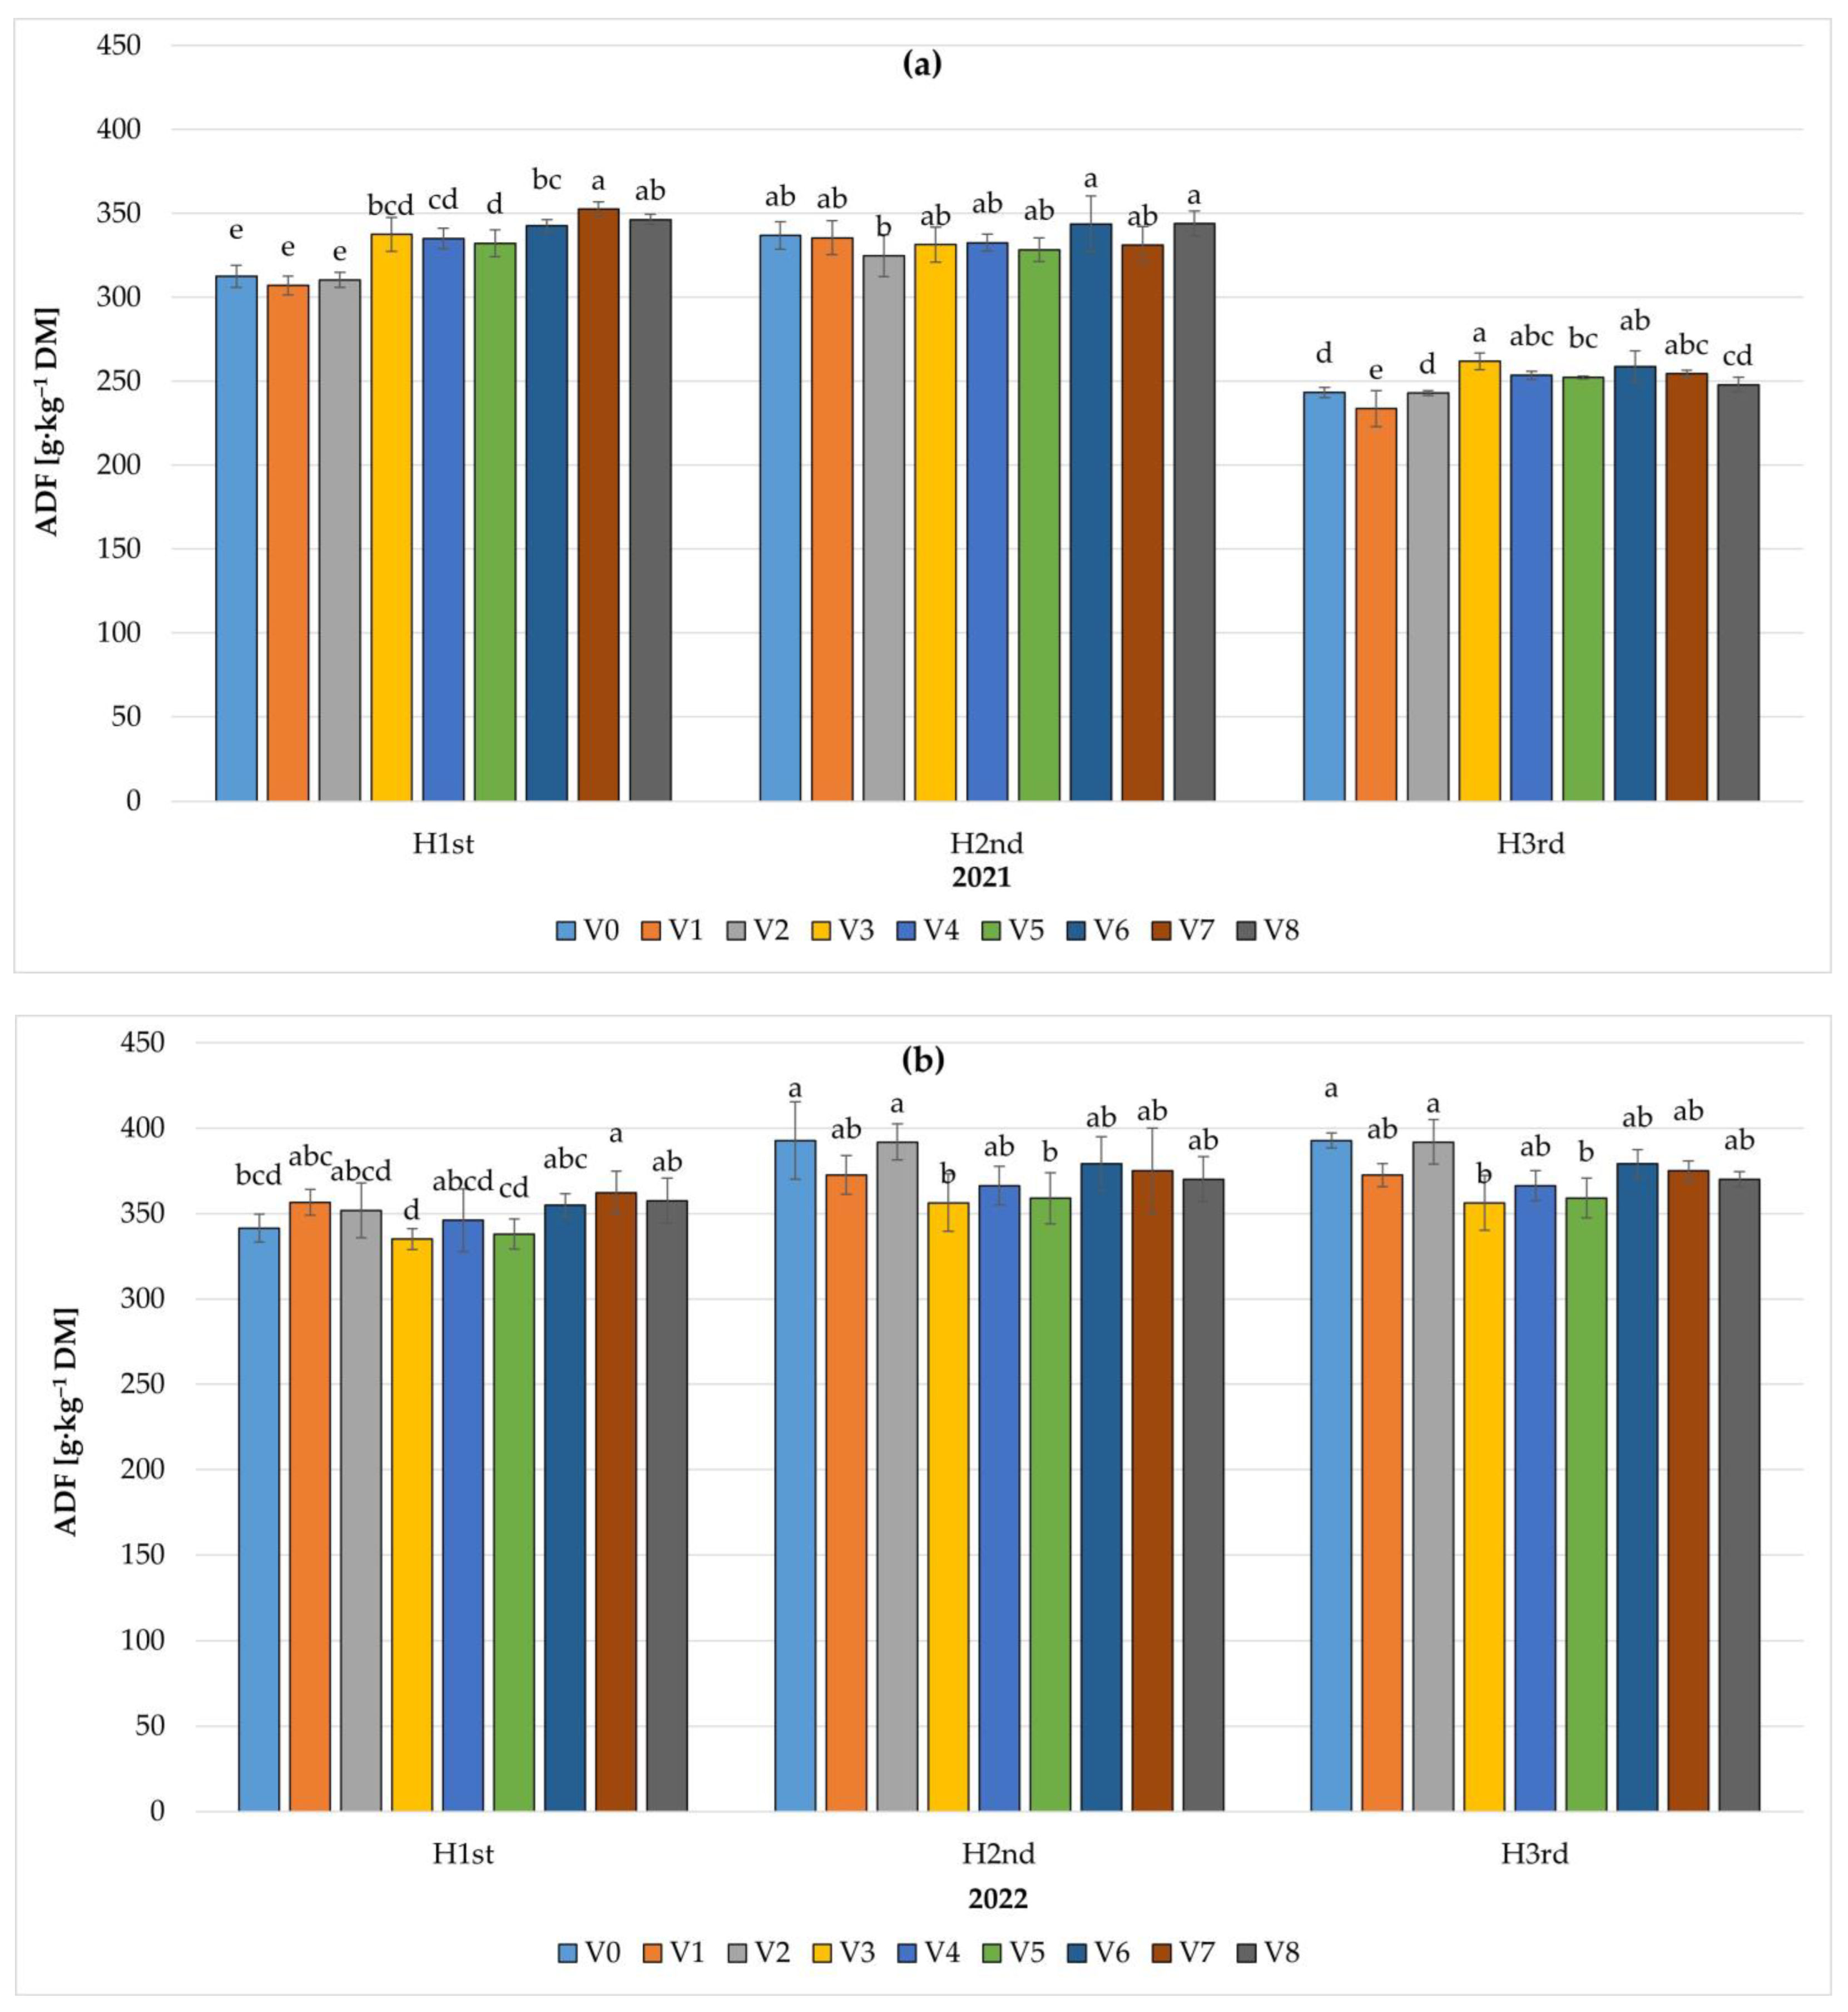
3.3.2. Acid Detergent Fiber (ADF)

On average, the ADF content of harvested plants was 326.1 g kg−1 DM. The analysis of the results indicates that, among the factors studied, the harvesting date had a significant effect on ADF content and significantly depended on the interaction of NPK*H, BC*H, and BC*NPK*H (Table 7). The average ADF content of the plants was the highest on the second harvest date (354.0 g kg−1 DM) and the lowest on the third date (69.6 g kg−1 DM lower). The study also showed that the year of the study had a significant effect on the ADF content of the cell wall of harvested plants; higher contents were obtained in the second year of the study.
Each year, the different nitrogen fertilization and the harvesting date were factors affecting the ADF content. In the first year of the study, compared to the control (0 kg ha−1), significantly higher ADF contents were obtained when 185 kg ha−1 NPK was applied, both on the first and second harvest date. In the second year of the study, the significantly highest contents were found for the control and the fertilization with 185 kg ha−1 NPK. That year, it was the highest on the second harvest date and the lowest on the third.
Regardless of the year of the treatment, the ADF content in all treatments was lower in the first year at the third harvest date (Figure 6). In the first year, the lowest content was recorded in treatment V1 on the third harvest date (233.6 ± 10.6 g kg−1 DM), while the highest content was recorded in treatment V7 on the first harvest date (352.6 ± 4.3 g kg−1 DM). In the second year of the study, all treatments had the lowest ADF content on the third harvest date, and the highest on the second. ADF content ranged from 308.4 ± 8.9 g kg−1 DM in the V0 treatment to 392.7 ± 22.7 g kg−1 DM in the V5 treatment. In treatments V6 and V8, compared to V0, the ADF content on all harvest dates was higher only in the first year of the study.

3.3.3. Acid Detergent Lignin (ADL)

The average ADL content in the harvested mixture was 45 g kg−1 DM (Table 8). The analysis showed a significant effect of fertilization and harvesting date on the average content (concentration) of ADL and on the interaction between NPK*H, BC*H, and BC*NPK*H (Table 8). The ADL content was the highest in the control and after fertilization, with a rate of 185 kg ha−1 NPK. The highest significant mean ADL concentration was found in plants harvested on the second harvest date; the ADL content was lower on the first, and the lowest on the third harvest date. Additionally, the harvested plants differed significantly in their ADL average content between years; a higher content characterized those harvested in the second year of the study.
In both years of the study, the factor significantly affecting ADL content was the harvest date and, in the second year of the study, it was also fertilization. In the first year of the study, the ADL content was the highest on the second harvest date, while a decrease was observed on subsequent dates. In the second year of the study, the highest ADL content was found at 185 kg ha−1 NPK on the second harvest date, with the control.
In both years of the study, the highest ADL content in most of the treatments was recorded on the second harvest date, and the lowest on the third (Figure 7). In the first year, the ADL concentration in harvested plants varied from 28.5 ± 1.0 g kg−1 DM (V2 on the third harvest date) to 49.8 ± 2.7 g kg−1 DM (V1 on the second date). In the second year of the study, it ranged from 38.9 ± 1.9 g kg−1 DM (V5 on the third harvest date) to 67.2 ± 5.1 g kg−1 DM (V2 on the second harvest date). In both years of the study and at all harvest dates, the highest ADL values were obtained only in the V0 treatment.

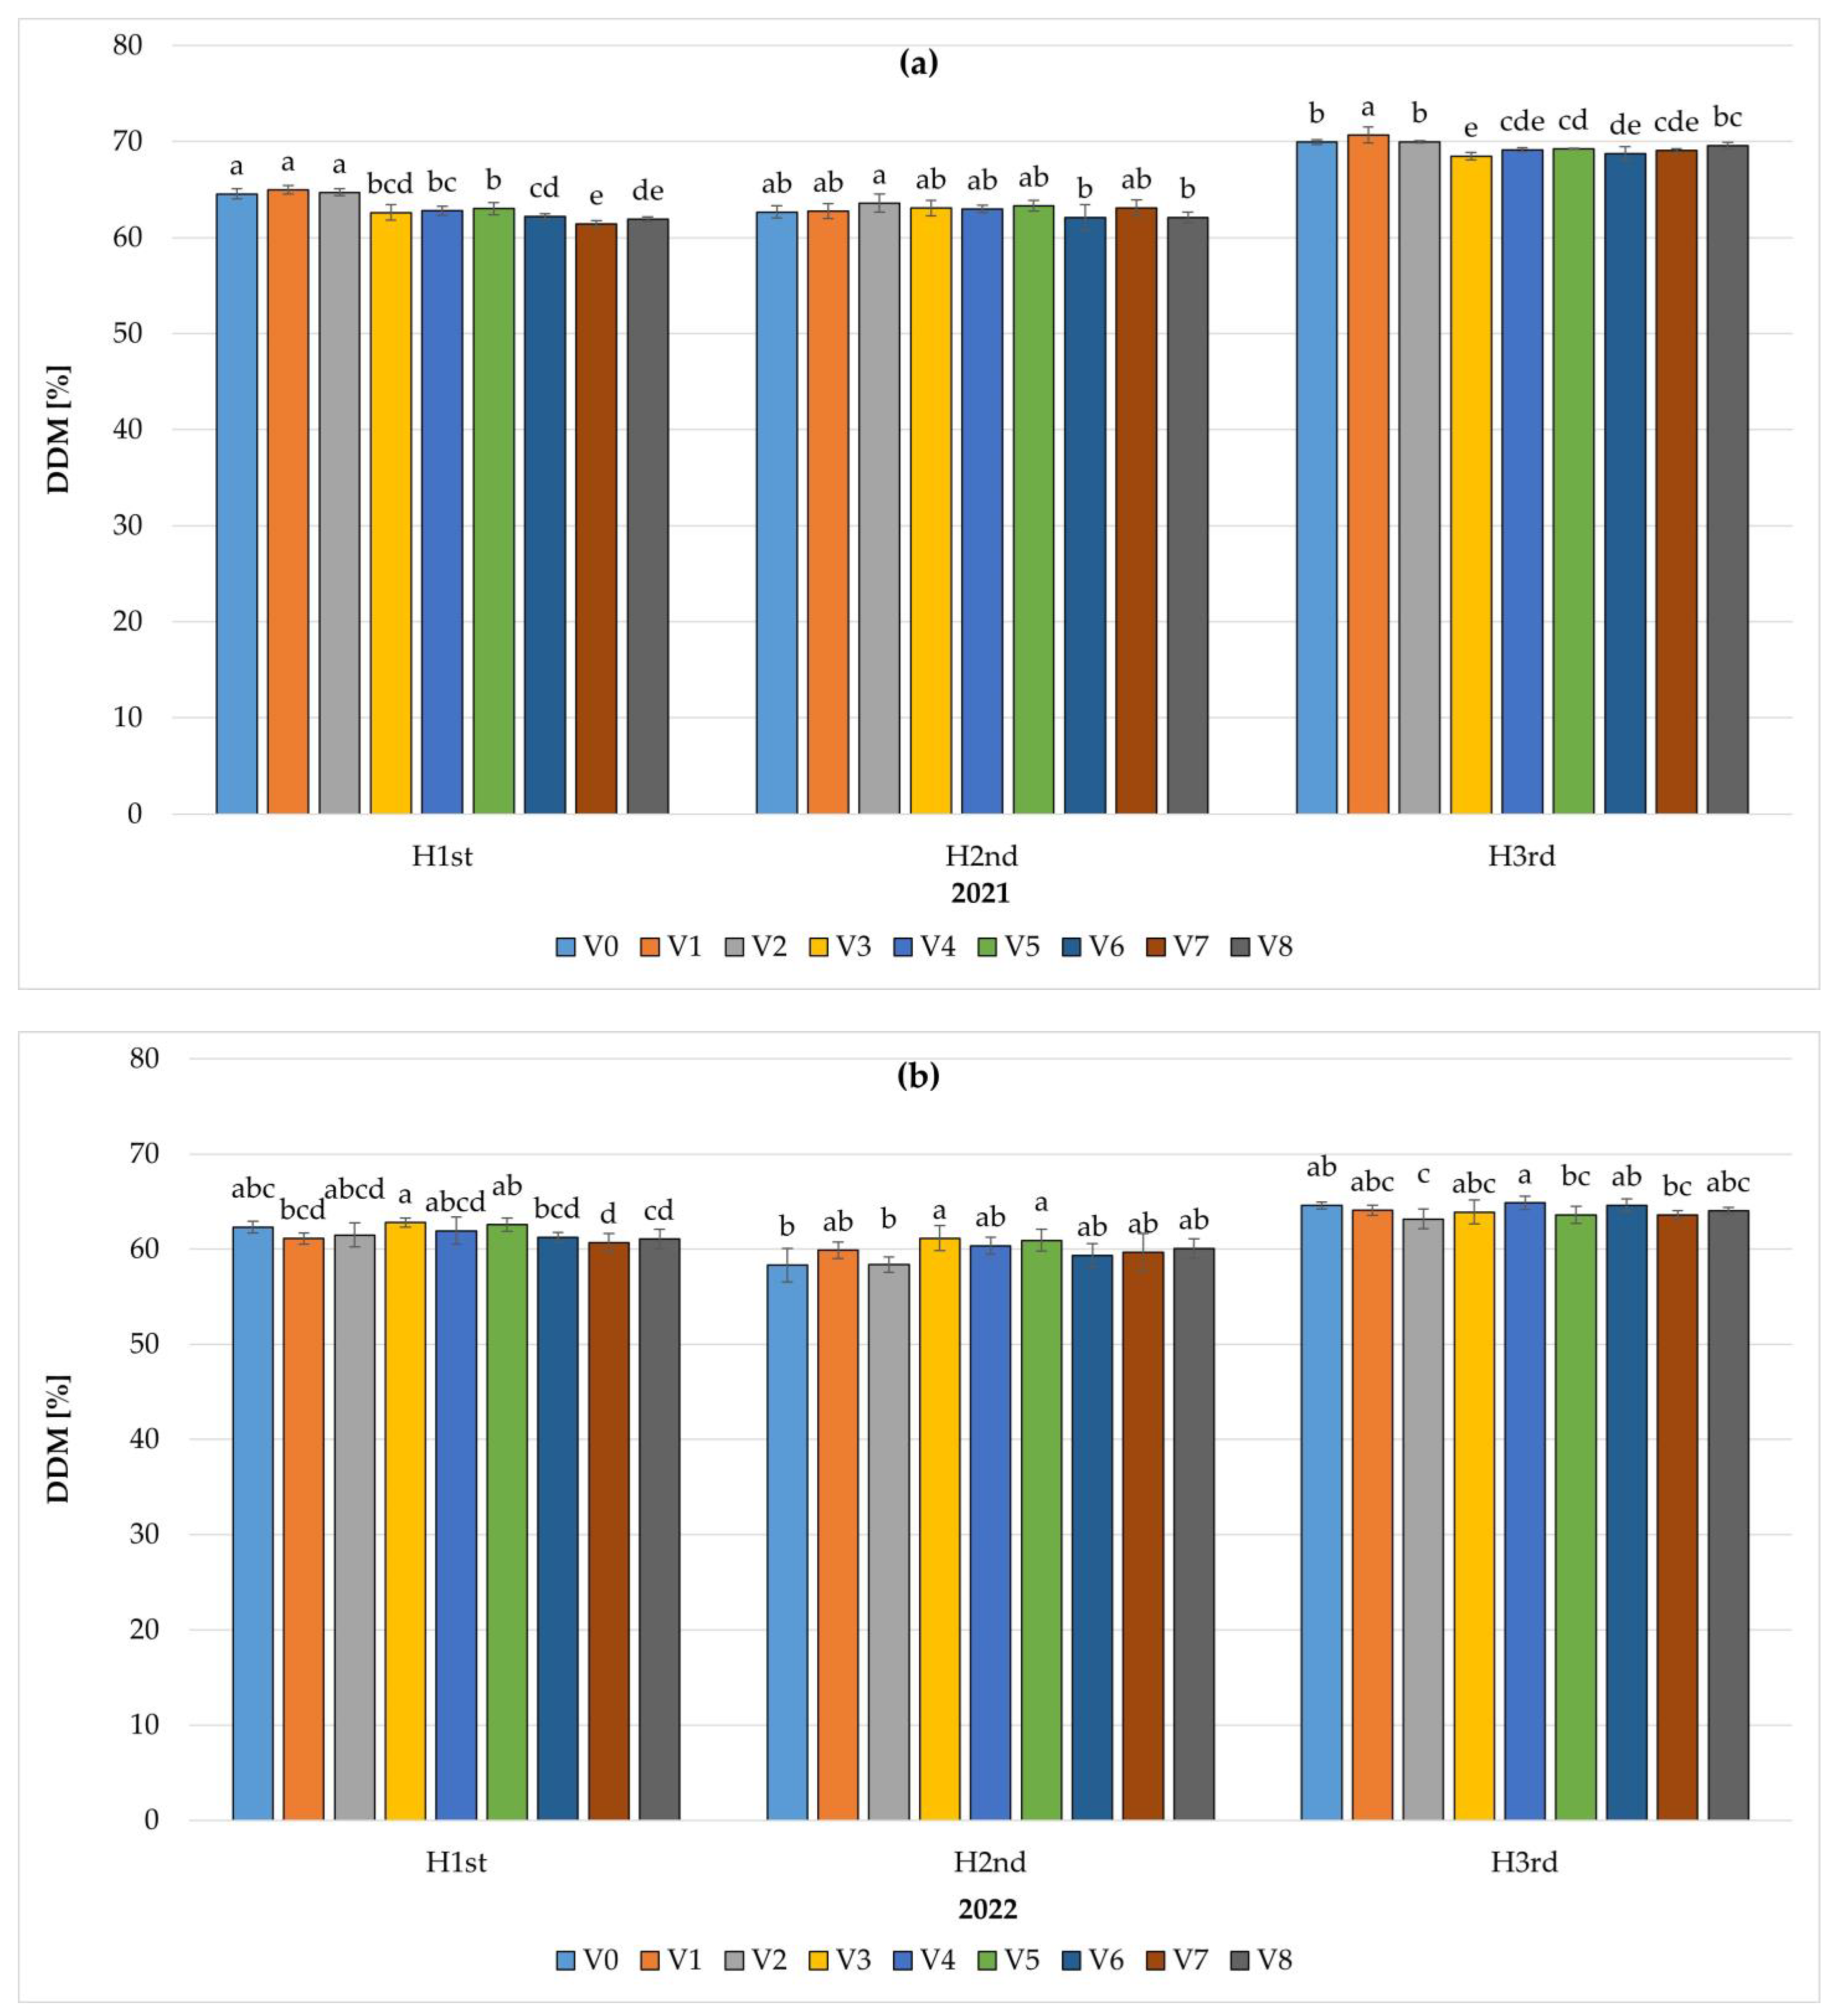
3.3.4. Digestible Dry Matter (DDM)

The harvested mixture had an average DDM value of 63% (Table 9). Significant differences were found for harvest date and year of study. Regardless of the year of testing, the highest average DDM characterized plants on the third harvest date (66.7%), and the lowest on the second (61.3%). In addition, the average DDM value was significantly higher in the first year of the study.
Each year of the study, fertilizer application rates and harvesting dates had a significant effect on DDM. In the first year, the highest value was obtained in the control. In the second year, a significantly higher digestibility was recorded in the mixture treated with a dose of 115 kg ha−1 NPK. In both years, compared to the first harvest, significantly highest values were found for the third harvest date.
In both years of the study, the DDM content in all treatments used was the highest at the third harvest date. In the first year of the study, DDM ranged from 61.4 ± 0.3% in the V6 treatment to 70.7 ± 0.8% in V1. In the second year of the study, the lowest DDM was obtained in the V0 treatment and the highest in the V4 treatment—58.3 ± 1.8% and 64.9 ± 0.7%, respectively. Only in 2021, at all harvest dates, were the DDM values in the V1 and V2 treatments higher compared to those obtained for the control (V0) (Figure 8).

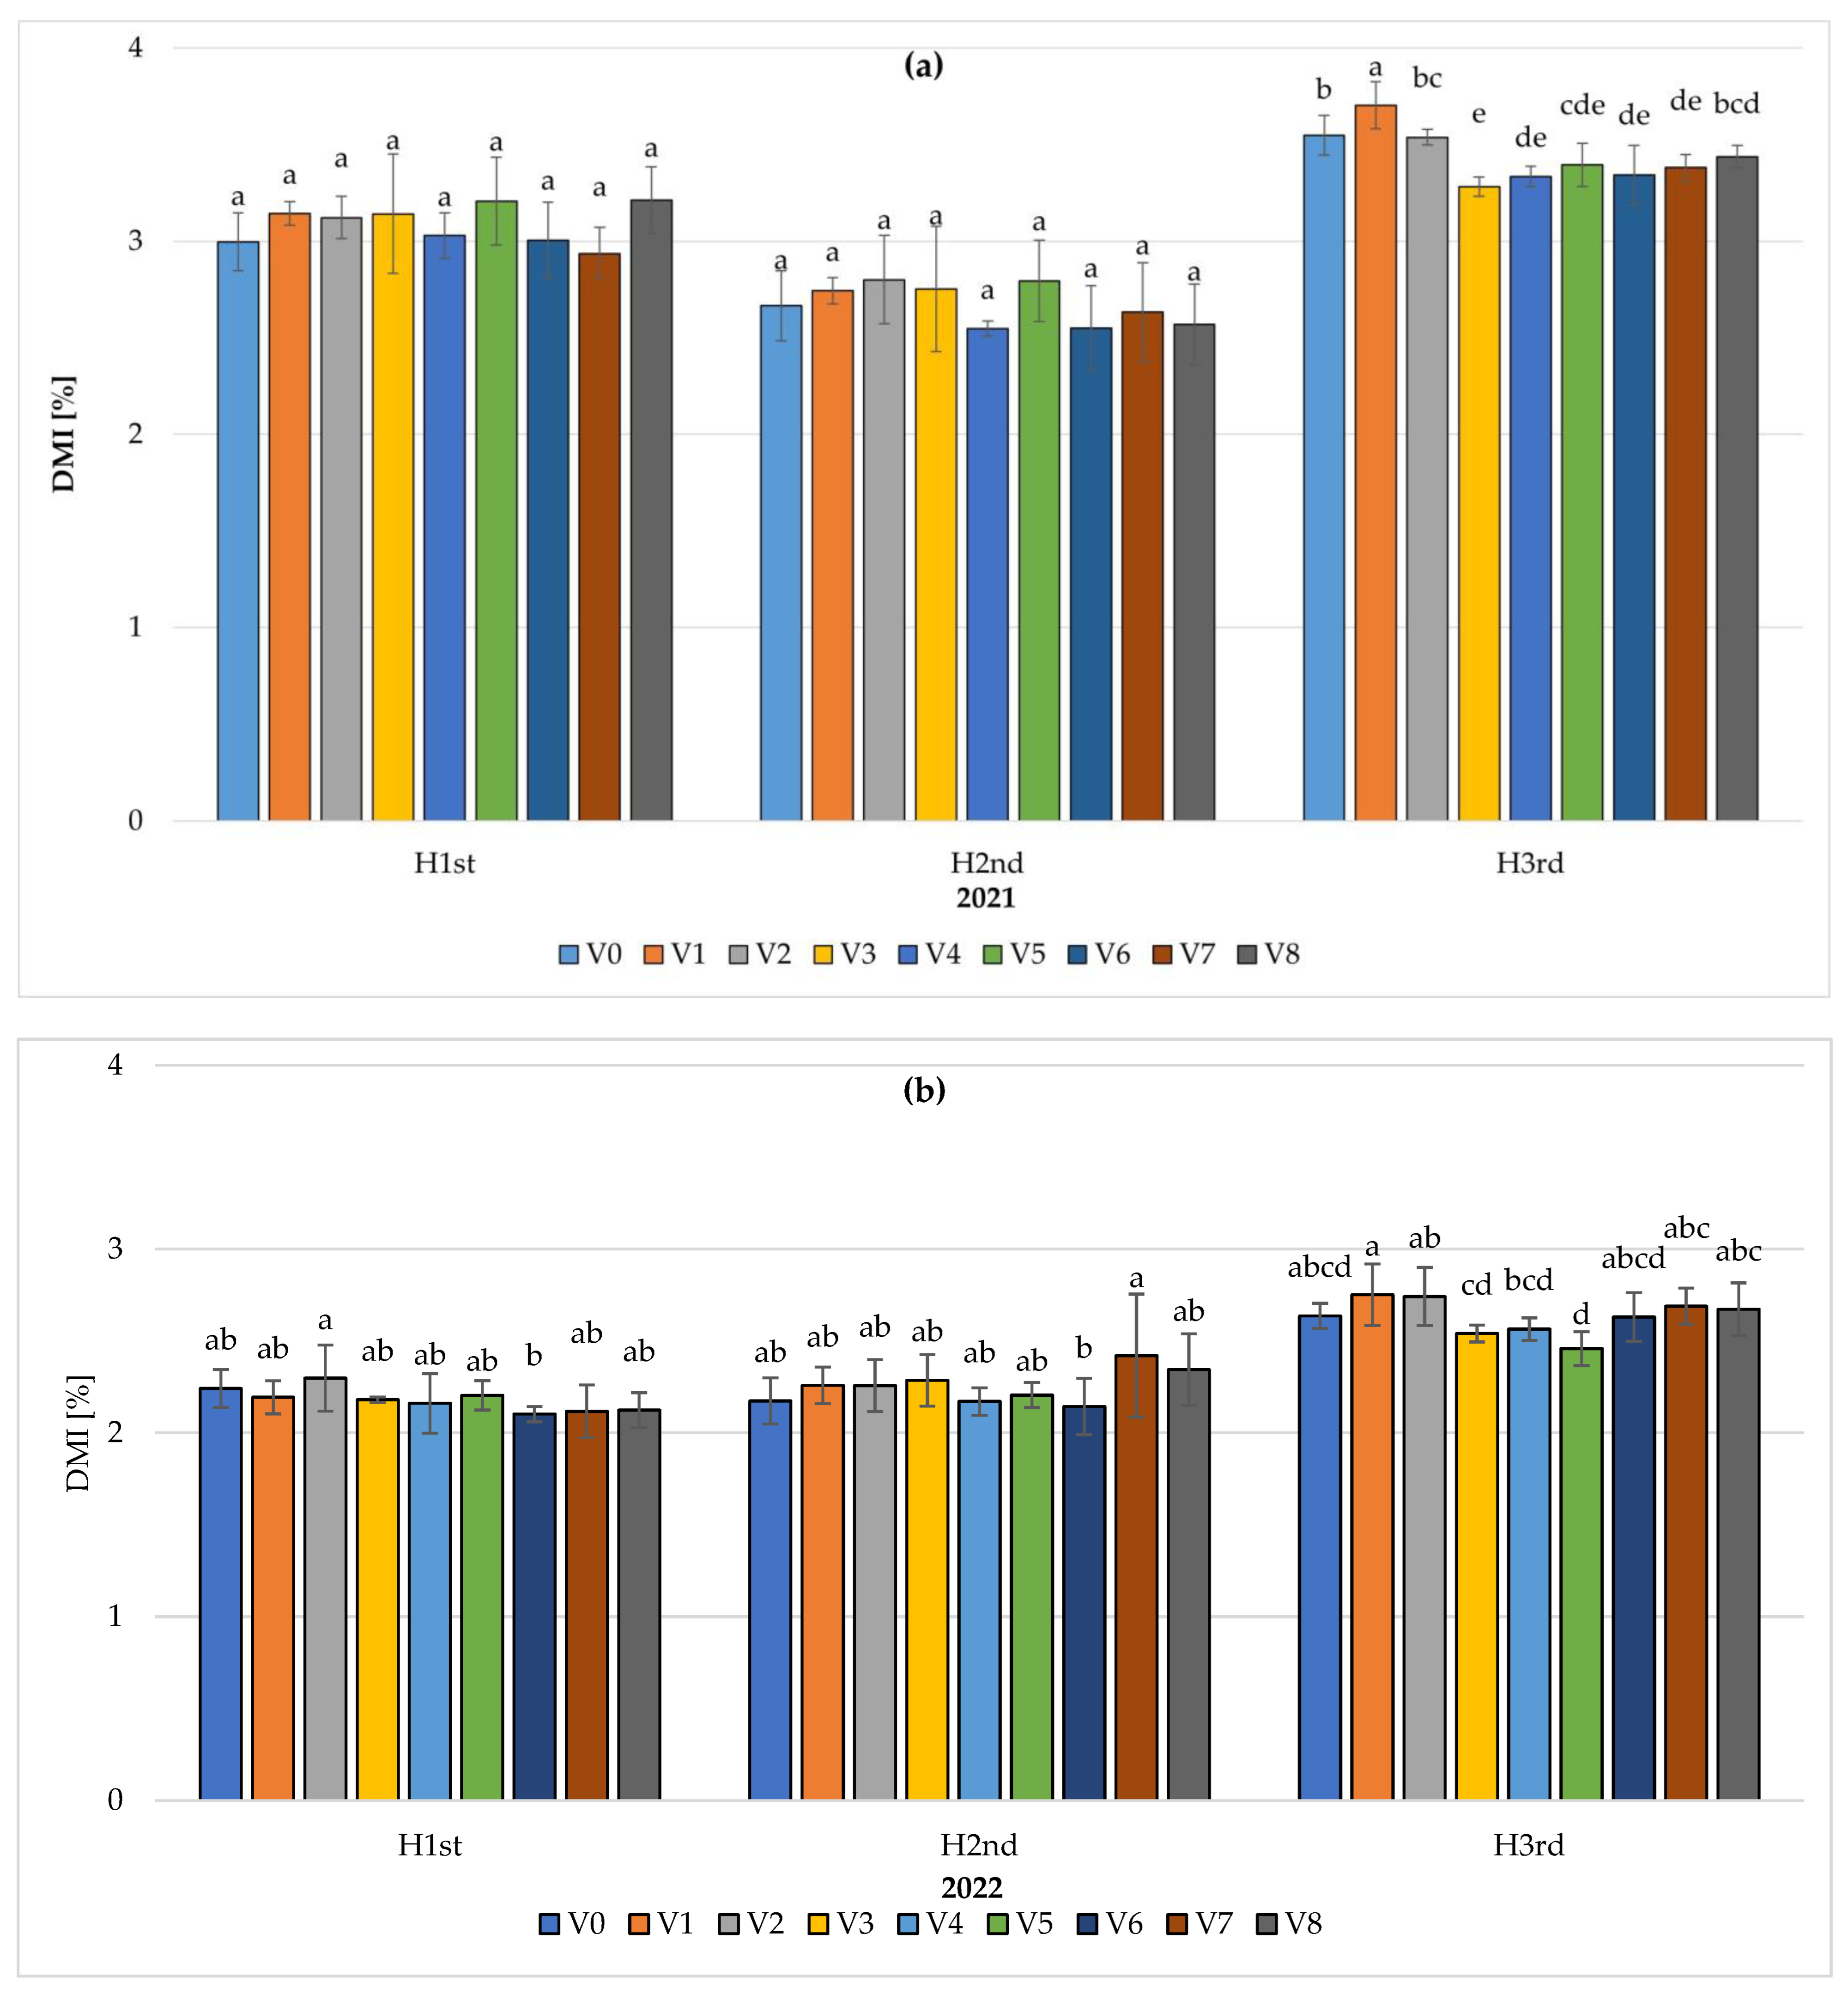
3.3.5. Dry Matter Intake (DMI)

Analyzing the effect of the studied factors on the average DMI showed a significant effect only of the harvest date and the interaction between NPK*H, BC*H, and BC*NPK*H (Table 10). The highest value was found on the third harvest date (3.0%), and the lowest on the first. The obtained average DMI value was significantly higher in the first year of the study—3.1%.
Significant differences were found between harvest dates in both years of the study, with the highest values obtained on the third harvest date (3.4% in 2021 and 2.6% in 2022).
In all treatments, the DMI content was higher in the first year of the study and was the highest also on the third harvest date in both years of the study (Figure 9). In the first year, for individual treatments, DMI ranged from 2.5 ± 0.04% (V4, second harvest) to 3.7 ± 0.12% (V1, third harvest). In the second year of the study, the lowest DMI (2.1%) was recorded in several treatments: V6, V7, and V8 (on the first harvest), and V6 (on the second harvest). The highest DMI (2.8 ± 0.17%) was obtained for one treatment—V1 on the third harvest date. In 2022, the DMI at all harvest dates was higher only in the V2 compared to the values obtained for these dates in the control (V0).

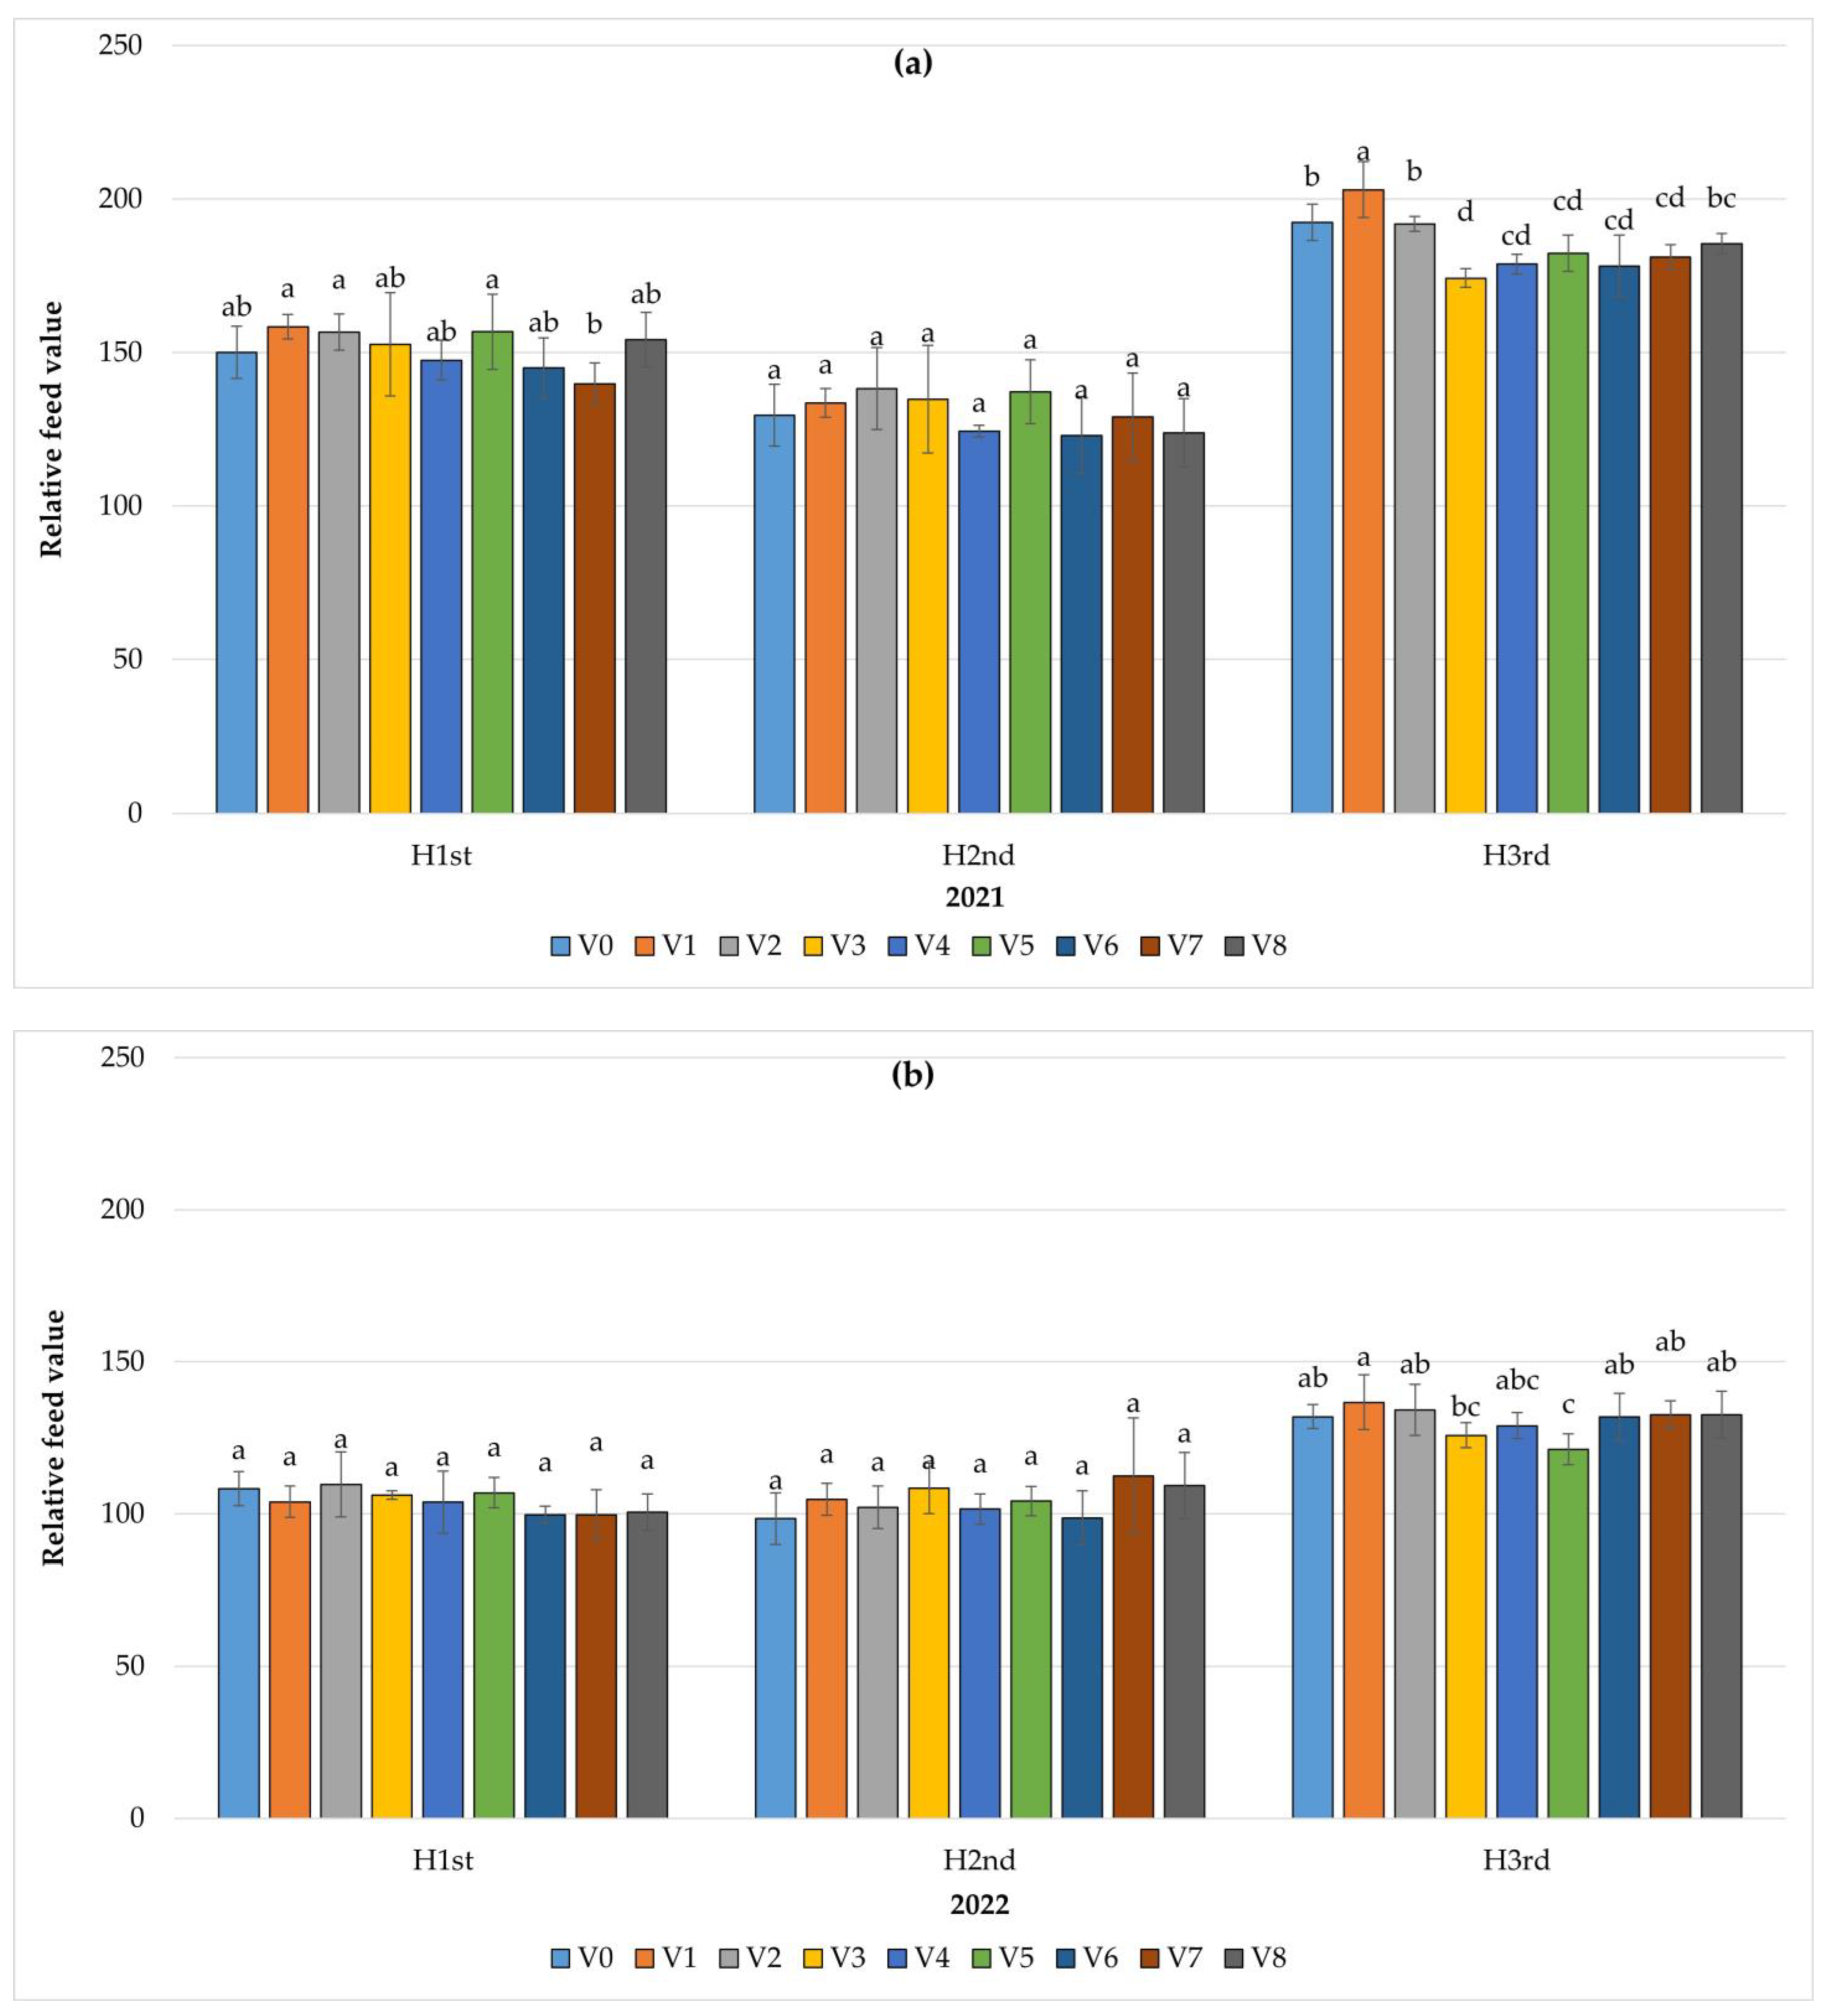
3.3.6. Relative Feed Value (RFV) and Quality Class

The RFV index determines the relative feed value or total feed quality. The average value of the RFV index was 134.4 (Table 11). The average value of the index in the study depended significantly on the harvest date and the years of the study. The average highest value of RFV was recorded for the feed obtained from the third harvest, and the lowest from the second. When analyzing the years of the study, higher quality feed, as indicated by the values of the RFV index, was obtained in the first year of the study. In both years of the study, the average value of the RFV index was significantly influenced by harvesting dates, with the highest value recorded on the third date. In addition, the fertilizer application rate had a significant effect in the first year of the study; compared to the control, the highest value of the RVF index was obtained after the application of 185 kg ha−1 NPK.
Knowing the RFV index, it is possible to assign feeds to different quality classes. The feeds obtained were characterized by varying quality from prime class to the 2nd quality class. The forages obtained in the first year of the study on the first and third harvest dates can be classified as prime class, and on the second date as the 1st quality class. In the second year of the study, only the forage obtained on the third harvest date was classified as the 1st quality class, while that obtained on the second and third dates was classified as the 2nd quality class.
For all treatments used in the study, the highest RFV value in both years was obtained on the third harvest date (Figure 10). The lowest RFV value in both years of the study was obtained on the second harvest date for the V6 treatment in 2021 (123 ± 12.5) and for the V0 in 2022 (203 ± 9.1). Compared to V0, the RFV in all swaths harvested was higher only in the V1 treatment (in 2021) and in the V2 treatment (in 2022). In both years of the study, the highest forage quality was recorded for the V1 treatment on the third harvest date.

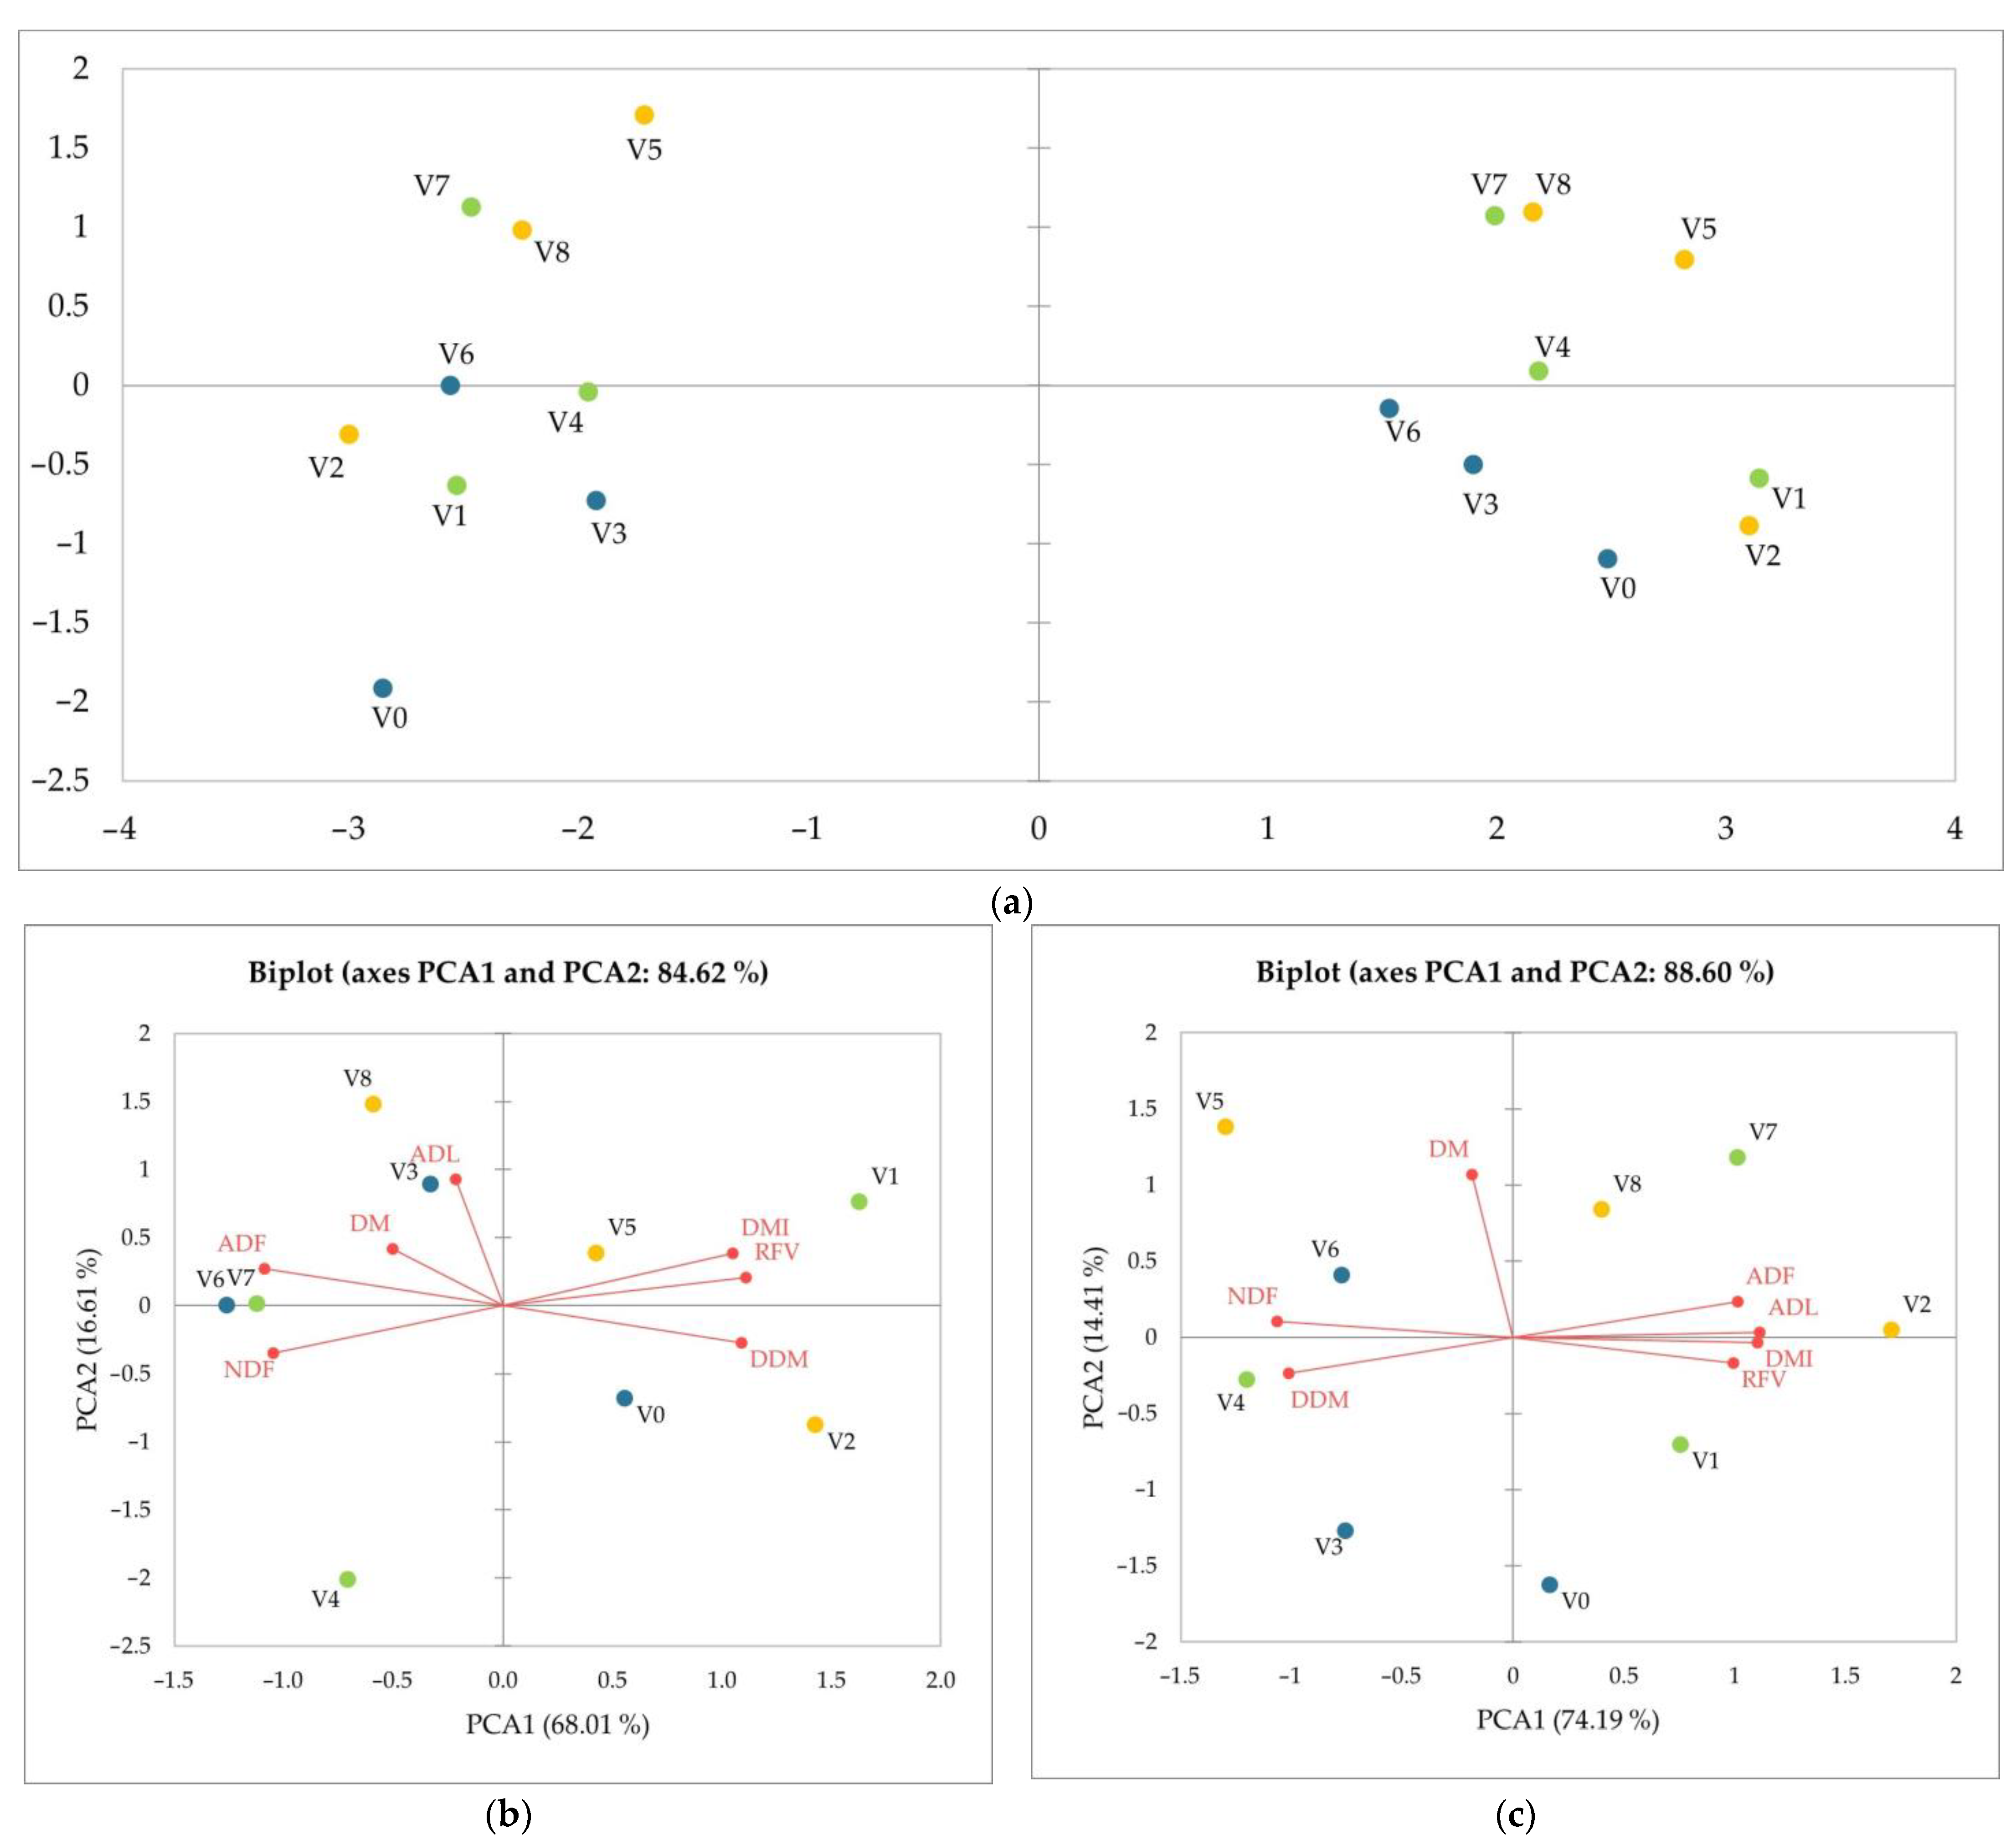
3.4. Principal Component Analysis

The Principal Component Analysis (PCA) was conducted separately for each of the two years of the study due to the formation of two large, separate treatments groups (a), between which there were statistically significant differences (Figure 11). In the first year (b) the PCA1 and PCA2 axes explained 84.62% of the total variance in the study variables. In the second year (c) they contributed 88.6% of the total variance. The PCA analysis showed differences between the distribution and correlation of variables in both years. The strongest correlation with the main variation (PCA1) was observed in the first year in the variables ADF (negative effect), and RFV and DDM (positive effect). It was also observed in the treatments V6 and V7 with a negative effect. In the second year, it was observed in the variables NDF (negative effect), and ADL and DMI (positive effect). It was also observed in the treatments V4 (with negative effect) and V2 (with positive effect). The secondary direction of variation (PCA2) in the first year was strongest only in the ADL variable (positive effect) and in the treatments V4 (positive effect), and V8 and V3 (negative effect). In the second year it was observed in the DM variable (positive effect) and in the treatments V0 (positive effect) and V8 (negative effect). Based on these PCA results, the biochar dose did not increase or decrease the first and second principal component in the first year of the study, but increased the first principal component in treatments with both 5 Mg ha−1 BC and 10 Mg ha−1 BC.

4. Discussion

To date, most research has been concerned with the effect of biochar application on the cultivation of annual crops [56]. Several studies have examined its long-term effect on plant growth when applied to previous crops. Only a few studies relate to the use of biochar in perennial crops including meadows [49,50]. These studies aimed to determine how biochar affected certain soil characteristics. This is the first study intended to evaluate the effect of different biochar application rates, alone and in combination with low and high NPK fertilizer dosages, on yield and structural carbohydrate content in the dry biomass of a grass–legume mixture.
In the previous studies assessing the effectiveness of biochar, different types of biochar were used at different doses [56]. In the case of low-nutrient biochar, higher doses (10–50 Mg ha−1) were used to improve the chemical and physical properties of the soil. Biochar at lower doses (<1 Mg ha−1) was applied as a nutrient carrier to increase fertilizer use efficiency and reduce nutrient losses [56]. Studies reporting positive effects have commonly used biochar application rates of 5–20 Mg ha−1 [57]; however, applications of biochar at low rates (<1 Mg ha−1) with fertilizer have also increased yields [56]. The doses used in this study ranged from 5 to 10 Mg ha−1 and were comparable to the biochar doses used in other studies [56,57].
The biochar addition to the soil, at 5 and 10 Mg ha−1, increased biomass production in the first year—by 14.4% for the lower biochar dose and by 6.7% for the higher one, compared to the control. In the second year, the increase was even higher—49% and 59%, respectively. According to numerous research studies, biochar increases plant productivity; the average yield increase ranges from 10% to 42% [53,57,58,59,60,61]. The observed increase in yields results from the fact that, in the rhizosphere, biochar can create conditions that increase the supply and uptake of nutrients, immobilize or inactivate phytotoxic organic and mineral substances, release bioactive compounds that stimulate plant growth and development, promote beneficial organisms, and inhibit pathogens. Thus, biochar can promote plant growth, health, and resistance to disease and environmental stressors.
There is research reporting that biochar may not affect yields, especially when low nutrient biochar has been used without adding fertilizer, or when the biochar has been applied to fertile soils [57]. Through binding mechanisms, a decrease in N and P availability in soil may have negative effects [62,63], especially at high rates of high-temperature biochar [64].
An even better yield-generating effect was obtained by applying NPK mineral fertilizer with the addition of biochar. In relation to the control, NPK fertilizers with the amount of 115 kg ha−1, in combination with a lower biochar dose (i.e., 5 Mg ha−1), resulted in a 22% increase in the first year and a 71% increase in the second year. In the treatments with an application rate of 10 Mg ha−1, it was 41% in 2021 and 136% in 2022. The biomass production increase resulting from the co-application of biochar and NPK fertilizers (185 kg ha−1) was the most evident in the second year after biochar application. The observed increase in biomass production was over two-fold.
The results of the study are consistent with the results of a meta-analysis concerning short-term (one year) field responses to biochar additions (≤20 t ha−1) in crop yield, performed by [57]. Compared to the control, a 26% yield increase was observed when only mineral fertilizer was used, whereas biochar with mineral fertilizer caused a 48% increase. Compared to the use of mineral fertilizer alone, the biochar and mineral fertilizer caused a 15% increase in yield, indicating that biochar was as effective as fertilizers in increasing crop yields when added in combination. According to the authors [57], the biochar alone did not increase crop yield regardless of the control.
According to [65], the yield increase caused by the co-application of biochar with NPK fertilizers confirms the previous evidence that biochar can increase fertilizer N-use efficiency and suggests that the addition of biochar could maintain crop N uptake at lower doses of N fertilizers.
The biochar doses used in the experiment, ranging from 5 to 10 Mg ha−1, increased biomass production by a maximum of 45% in the first year after biochar application, in the treatment with the highest biochar dose and the highest NPK fertilization. A substantial increase in biomass production resulting from the biochar application was recorded in the second year of the study when, in some treatments, the increase in biomass production exceeded 200%. It is consistent with the results obtained by [49], who studied the effect of biochar on the growth of alpine meadows. Their results showed that biochar application in moderate rates (2–6 Mg ha−1), in combination with NPK fertilizer, caused a significant increase in fresh and dry biomass production during the second and third year of the study, compared to the control and the application of biochar alone. It was also reported by [57] that yield responses were greater in the third year after a single biochar application when additional fertilizer was applied. The response most likely reflects the physicochemical and microbial changes that improve soil health as biochar ages.
An important criterion for evaluating the nutritive value of forage crops is the content of structural carbohydrates [66,67]. The content of structural carbohydrates in forage determines its nutritional value, digestibility, and intake by animals [68,69]. The content of structural carbohydrates depends on many independent factors including, among others, plant species and their development stage during the harvest and climatic conditions (mainly the amount of rainfall) [10,70,71,72]. The results of the study showed that biochar amendment, regardless of the dosage, had no effect on ADF, NDF, and ADL concentrations. Generally, the results of this study are in line with those of other authors. For example, the results of the experiment on alfalfa conducted by [51] showed that neither biochar alone, nor in combination with rainwater harvesting methods, significantly affected the NDF and ADF content during the two-year experimental period. However, the study on fodder oats showed that 10 Mg ha−1 biochar, along with inorganic fertilizers applied in lowered doses, significantly increased fodder yield (green ~8% and dry ~7.8%) and decreased ADF and NDF by 5.70 and 6.04%, compared to the full dose of inorganic fertilizers [52].
Relative feed value (RFV) is an index which combines important nutritional factors (potential intake (DMI) and digestibility (DDM)) into a single number, providing a quick and effective method for evaluating feed value or quality. The findings of the study showed that biochar amendment, regardless of the dosage, had no effect on DMI, DDM, and RFV. Nonetheless, ref. [73] found that soybean and forage yields were improved, although forage quality expressed by RFV index was lower by 4–10% when biochar was applied.
The year of the study proved to be a significant factor in shaping the content of the analyzed parameters. In the second year of study (2022), significantly lower biomass production with higher ADF, NDF, and ADL concentration was recorded. It affected the lower values of DDM, DMI, and RFV and resulted from the differences in weather conditions in each year of the study. According to the literature [10,74,75,76,77,78], weather conditions during plant growth, particularly the temperature and the sum of precipitation, can significantly affect biomass production and the chemical composition of plants. The weather conditions in 2021 were optimal for plant development while 2022 was quite dry; hence, the observed differences in the chemical composition of the plants were the effect of moderate drought stress.
For many years, there has been a huge imbalance between the emission of carbon into the atmosphere and its absorption. The use of biochar in soils should be treated as one of the simplest ways to sequester carbon. Currently, adopting biochar in agriculture comes with considerable expense. When considering the economic assessment of the use of biochar in agriculture, not only the beneficial effect of BC addition to soil properties, resulting in an increase in yields, should be taken into account. The long-term consequences, predicted to last for thousands of years, and the environmental costs of long-term carbon sequestration in the soil are both significant factors. To combat climate change, pollutant emissions, and droughts, biochar production and soil application should be taken into consideration [79].
Although scientific interest in biochar has grown tremendously recently, it is not yet used on a large scale in agricultural practice. This is mainly due to its economic unfeasibility compared to fertilizers and because farmers are dubious about the effects of utilizing biochar because of the relatively high biochar cost [80]. The location, the kind of raw material used to make the biochar, the volume of production, the pyrolysis conditions, the cost of the biochar, the type of crop, and other variables all affect how cost-effective the biochar is. However, the use of biochar has many potential environmental benefits, such as mitigating climate change and reducing nutrient leaching [81]. All of these factors should be carefully taken into account on a case-by-case basis in order to progress the broad usage of biochar in agricultural production [82]. The use of biochar as a soil improver would become more practical if it could be manufactured on-site from regional bio-waste in the area. This would eliminate the need for transportation and drastically reduce the overall cost [83].
The results of this study have practical significance and lay the foundation for further research, by showing that biochar can be used to improve the yield and quality of forage crops, including grass–legume mixtures.
Further studies investigating the long-term effects of biochar amendment on the nutritional quality of forage crops are recommended to improve guidelines for agricultural practice.

5. Conclusions

The results of the study show that biochar combined with NPK fertilization has a positive effect on biomass production. The highest values were obtained for the treatments with the highest doses of BC and fertilizer.
In the studied grass–legume mixture, the fertilization rate and the biomass harvest date had the greatest influence on the content of structural carbohydrates NDF, ADF, and ADL. The addition of biochar alone did not have a significant effect on the studied parameters; however, taking into account its interaction with the harvest date and the NPK fertilization, a positive effect was observed (i.e., the effect of biocarbon application has an impact on the interaction between harvest date and fertilization).

Author Contributions

Conceptualization, W.S. and B.W.; methodology, W.S., B.W., A.P.-J. and M.S.; software, W.S. and B.W.; validation, W.S., B.W., A.P.-J. and M.S.; formal analysis, W.S., B.W. and A.P.-J.; investigation, W.S.; resources, W.S.; data curation, W.S. and B.W.; writing—original draft preparation, W.S., B.W. and A.P.-J.; writing—review and editing, M.S. and A.P.-J.; visualization, W.S.; supervision, A.P.-J.; project administration, W.S.; funding acquisition, W.S. and B.W. All authors have read and agreed to the published version of the manuscript.

Funding

This research received no external funding.

Institutional Review Board Statement

Not applicable.

Informed Consent Statement

Not applicable.

Data Availability Statement

Not applicable.

Conflicts of Interest

The authors declare no conflict of interest.

References

  1. EUROSTAT. Share of Main Land Types in Utilised Agricultural Area (UAA) by NUTS 2 Regions (Tai05). Available online: https://ec.europa.eu/eurostat/cache/metadata/en/tai05_esmsip2.htm (accessed on 9 February 2023).
  2. Yan, Y.; Jarvie, S.; Liu, Q.; Zhang, Q. Effects of fragmentation on grassland plant diversity depend on the habitat specialization of species. Biol. Conserv. 2022, 275, 109773. [Google Scholar] [CrossRef]
  3. Gallé, R.; Happe, A.-K.; Baillod, A.B.; Tscharntke, T.; Batáry, P. Landscape configuration, organic management, and within-field position drive functional diversity of spiders and carabids. J. Appl. Ecol. 2019, 56, 63–72. [Google Scholar] [CrossRef]
  4. Milazzo, F.; Fernández, P.; Peña, A.; Vanwalleghem, T. The Resilience of Soil Erosion Rates under Historical Land Use Change inAgroecosystems of Southern Spain. Sci. Total Environ. 2022, 822, 153672. [Google Scholar] [CrossRef] [PubMed]
  5. Han, F.; Ren, L.; Zhang, X.C. Effect of biochar on the soil nutrients about different grasslands in the Loess Plateau. Catena 2016, 137, 554–562. [Google Scholar] [CrossRef]
  6. Bai, Y.; Cotrufo, M.F. Grassland soil carbon sequestration: Current understanding, challenges, and solutions. Science 2022, 377, 603–608. [Google Scholar] [CrossRef]
  7. Gabryszuk, M.; Barszczewski, J.; Wróbel, B. Characteristics of grasslands and their use in Poland. J. Water Land Dev. 2021, 51, 243–249. [Google Scholar] [CrossRef]
  8. Wróbel, B.; Zielewicz, W.; Staniak, M. Challenges of Pasture Feeding Systems—Opportunities and Constraints. Agriculture 2023, 13, 974. [Google Scholar] [CrossRef]
  9. Sosnowski, J.; Wróbel, B.; Truba, M. Effect of Tytanit on selected morphological, physiological and chemical characteristics of Lolium multiflorum dry matter. J. Water Land Dev. 2023, 56, 7–13. [Google Scholar] [CrossRef]
  10. Wróbel, B.; Zielewicz, W.; Paszkiewicz-Jasińska, A.; Spychalski, B.; Jakubowska, Z. Effect of harvest date on structural carbohydrates and lignin content in meadow sward in different pluvio-thermal conditions. J. Water Land Dev. 2022, 55, 60–66. [Google Scholar] [CrossRef]
  11. EEA. The European Environment—State and Outlook 2020 Knowledge for Transition to a Sustainable Europe; European Environment Agency (EEA): Luxembourg, UK, 2019.
  12. de Boer, I.J.; van Ittersum, M.K. Circularity in Agricultural Production; Wageningen University &Research: Wageningen, The Netherlands, 2018. [Google Scholar]
  13. van Loon, M.P.; Vonk, W.J.; Hijbeek, R.; van Ittersum, M.K.; ten Berge, H.F. Circularity indicators and their relation with nutrient use efficiency in agriculture and food systems. Agric. Syst. 2023, 207, 103610. [Google Scholar] [CrossRef]
  14. Blanco-Pastor, J.L.; Manel, S.; Barre, P.; Roschanski, A.M.; Willner, E.; Dehmer, K.J.; Hegarty, M.; Muylle, H.; Ruttink, T.; Roldán-Ruiz, I.; et al. Pleistocene climate changes, and not agricultural spread, accounts for range expansion and admixture in the dominant grassland species Lolium perenne L. J. Biogeogr. 2019, 46, 1451–1465. [Google Scholar] [CrossRef]
  15. Abel, S.; Gislum, B.; Boelt, B. Path and correlation analysis of perennial ryegrass (Lolium perenne L.) seed yield components. J. Agron. Crop Sci. 2017, 203, 338–344. [Google Scholar] [CrossRef]
  16. Rafińska, K.; Pomastowski, P.; Wrona, O.; Ryszard Górecki, R.; Buszewski, B. Medicago sativa as a source of secondary metabolites for agriculture and pharmaceutical industry. Phytochem. Lett. 2017, 20, 520–539. [Google Scholar] [CrossRef]
  17. Acharya, J.P.; Lopez, Y.; Gouveia, B.T.; de Bem Oliveira, I.; Resende, M.F.R., Jr.; Muñoz, P.R.; Rios, E.F. Breeding Alfalfa (Medicago sativa L.) Adapted to Subtropical Agroecosystems. Agronomy 2020, 10, 742. [Google Scholar] [CrossRef]
  18. Barszczewski, J.; Jankowska-Huflejt, H.; Twardy, S. Metody odnawiania łąk i pastwisk. In Racjonalne Wykorzystanie Potencjału Produkcyjnego Trwałych Użytków Zielonych w Polsce w Różnych Warunkach Glebowych i Systemach Gospodarowania; Barszczewski, J., Ed.; Pub. ITP: Falenty, Poland, 2015; Volume 40. [Google Scholar]
  19. Marquard, E.; Weigelt, A.; Temperton, V.M.; Roscher, C.; Schumacher, J.; Buchmann, N.; Schmid, B. Plant species richness and functional composition drive overyielding in a six-year grassland experiment. Ecology 2009, 90, 3290–3302. [Google Scholar] [CrossRef]
  20. Bullock, J.M.; Pywell, R.F.; Walker, K.J. Long-term enhancement of agricultural production by restoration of biodiversity. J. Appl. Ecol. 2007, 44, 6–12. [Google Scholar] [CrossRef]
  21. Tilman, D. Biodiversity: Population versus ecosystem stability. Ecology 1996, 77, 350–363. [Google Scholar] [CrossRef]
  22. Picasso, V.D.; Brummer, E.C.; Liebman, M.; Dixon, P.M.; Wilsey, B.J. Crop species diversity affects productivity and weed suppression in perennial polycultures under two management strategies. Crop Sci. 2008, 48, 331–342. [Google Scholar] [CrossRef]
  23. Furey, G.N.; Tilman, D. Plant biodiversity and the regeneration of soil fertility. Proc. Natl. Acad. Sci. USA 2021, 118, e2111321118. [Google Scholar] [CrossRef]
  24. Yan, H.; Gu, S.; Li, S.; Shen, W.; Zhou, X.; Yu, H.; Lu, G. Grass-legume mixtures enhance forage production via the bacterial community. Agric. Ecosyst. Environ. 2022, 338, 108087. [Google Scholar] [CrossRef]
  25. Dhakal, D.; Islam, M.A. Grass-legume mixtures for improved soil health in cultivated agroecosystem. Sustainability 2018, 10, 2718. [Google Scholar] [CrossRef]
  26. Nyfeler, D.; Huguenin-Elie, O.; Suter, M.; Frossard, E.; Lüscher, A. Grass–legume mixtures can yield more nitrogen than legume pure stands due to mutual stimulation of nitrogen uptake from symbiotic and non-symbiotic sources. Agric. Ecosyst. Environ. 2011, 140, 155–163. [Google Scholar] [CrossRef]
  27. Wang, D.; Jiang, P.; Zhang, H.; Yuan, W. Biochar production and applications in agro and forestry systems: A review. Sci. Total Environ. 2020, 723, 137775. [Google Scholar] [CrossRef] [PubMed]
  28. Chi, N.T.L.; Anto, S.; Ahamed, T.S.; Kumar, S.S.; Shanmugam, S.; Samuel, M.S.; Pugazhendhi, A. A review on biochar production techniques and biochar based catalyst for biofuel production from algae. Fuel 2021, 287, 119411. [Google Scholar] [CrossRef]
  29. Cha, J.S.; Park, S.H.; Jung, S.C.; Ryu, C.; Jeon, J.K.; Shin, M.C.; Park, Y.K. Production and utilization of biochar: A review. J. Ind. Eng. Chem. 2016, 40, 1–15. [Google Scholar] [CrossRef]
  30. Paustian, K.; Lehmann, J.; Ogle, S.; Reay, D.; Robertson, G.P.; Smith, P. Climate-smart soils. Nature 2016, 532, 49–57. [Google Scholar] [CrossRef]
  31. Purakayastha, T.J.; Das, K.C.; Gaskin, J.; Harris, K.; Smith, J.L.; Kumari, S. E_ect of pyrolysis temperatures onstability and priming e_ects of C3 and C4 biochars applied to two di_erent soils. Soil. Tillage Res. 2016, 155, 107–115. [Google Scholar] [CrossRef]
  32. He, L.; Zhong, Z.; Yang, H. E_ects on soil quality of biochar and straw amendment in conjunction withchemical fertilizers. J. Integr. Agric. 2017, 16, 704–712. [Google Scholar] [CrossRef]
  33. Wang, X.; Zhou, W.; Liang, G.; Song, D.; Zhang, X. Characteristics of maize biochar with di_erent pyrolysis temperatures and its e_ects on organic carbon, nitrogen and enzymatic activities after addition to fluvo-aquic soil. Sci. Total Environ. 2015, 538, 137–144. [Google Scholar] [CrossRef]
  34. Głąb, T.; Gondek, K.; Mierzwa-Hersztek, M.; Szewczyk, W. Effects of straw and biochar amendments on grassland productivity and root morphology. Agronomy 2020, 10, 1794. [Google Scholar] [CrossRef]
  35. Shamim, M.I.A.; Dijkstra, F.A.; Abuyusuf, M.; Hossain, A.I. Synergistic effects of biochar and NPK fertilizer on soybean yield in an alkaline soil. Pedosphere 2015, 25, 713–719. [Google Scholar] [CrossRef]
  36. Ullah, I.; Muhammad, D.; Mussarat, M.; Khan, S.; Adnan, M.; Fahad, S.; Solaiman, Z. Comparative effects of biochar and NPK on wheat crops under different management systems. Crop Pasture Sci. 2022, 74, 31–40. [Google Scholar] [CrossRef]
  37. Sarwar, N.; Abbas, N.; Farooq, O.; Akram, M.; Hassan, M.W.; Mubeen, K.; Khaliq, A. Biochar Integrated Nutrient Application Improves Crop Productivity, Sustainability and Profitability of Maize–Wheat Cropping System. Sustainability 2023, 15, 2232. [Google Scholar] [CrossRef]
  38. Weber, K.; Quicker, P. Properties of biochar. Fuel 2018, 217, 240–261. [Google Scholar] [CrossRef]
  39. Phillips, C.L.; Meyer, K.M.; Trippe, K.M. Is biochar applied as surface mulch beneficial for grassland restoration? Geoderma 2020, 375, 114457. [Google Scholar] [CrossRef]
  40. Graber, E.R.; Meller Harel, Y.; Kolton, M.; Cytryn, E.; Silber, A.; Rav David, D.; Elad, Y. Biochar impact on development and productivity of pepper and tomato grown in fertigated soilless media. Plant Soil 2010, 337, 481–496. [Google Scholar] [CrossRef]
  41. Liu, L.; Wang, Y.; Yan, X.; Li, J.; Jiao, N.; Hu, S. Biochar amendments increase the yield advantage of legume-based intercropping systems over monoculture. Agric. Ecosyst. Environ. 2017, 237, 16–23. [Google Scholar] [CrossRef]
  42. Maiti, S.K.; Ahirwal, J. Ecological restoration of coal mine degraded lands: Topsoil management, pedogenesis, carbon sequestration, and mine pit limnology. In Phytomanagement of Polluted Sites; Elsevier: Amsterdam, The Netherlands, 2019; pp. 83–111. [Google Scholar] [CrossRef]
  43. United Nations. Department of Economic and Social Affairs. Sustainable Development. Available online: https://sdgs.un.org/goals (accessed on 17 March 2023).
  44. Gaskin, J.W.; Speir, R.A.; Harris, K.; Das, K.C.; Lee, R.D.; Morris, L.A.; Fisher, D.S. Effect of peanut hull and pine chip biochar on soil nutrients, corn nutrient status, and yield. Agron. J. 2010, 102, 623–633. [Google Scholar] [CrossRef]
  45. Domene, X.; Mattana, S.; Hanley, K.; Enders, A.; Lehmann, J. Medium-term effects of corn biochar addition on soil biota activities and functions in a temperate soil cropped to corn. Soil. Biol. Biochem. 2014, 72, 152–162. [Google Scholar] [CrossRef]
  46. Feng, W.; Yang, F.; Cen, R.; Liu, J.; Qu, Z.; Miao, Q.; Chen, H. Effects of straw biochar application on soil temperature, available nitrogen and growth of corn. J. Environ. Manag. 2021, 277, 111331. [Google Scholar] [CrossRef] [PubMed]
  47. Rogovska, N.; Laird, D.A.; Karlen, D.L. Corn and soil response to biochar application and stover harvest. Field Crops Res. 2016, 187, 96–106. [Google Scholar] [CrossRef]
  48. Lentz, R.D.; Ippolito, J.A.; Spokas, K.A. Biochar and manure effects on net nitrogen mineralization and greenhouse gas emissions from calcareous soil under corn. Soil Sci. Soc. Am. J. 2014, 78, 1641–1655. [Google Scholar] [CrossRef]
  49. Rafiq, M.K.; Bai, Y.; Aziz, R.; Rafiq, M.T.; Mašek, O.; Bachmann, R.T.; Joseph, S.; Shahbaz, M.; Qayyum, A.; Shang, Z.; et al. Biochar amendment improves alpine meadows growth and soil health in Tibetan plateau over a three year period. Sci. Total Environ. 2020, 717, 135296. [Google Scholar] [CrossRef] [PubMed]
  50. Brown, R.W.; Chadwick, D.R.; Bott, T.; West, H.M.; Wilson, P.; Hodgins, G.R.; Snape, C.E.; Jones, D.L. Biochar application to temperate grasslands: Challenges and opportunities for delivering multiple ecosystem services. Biochar 2023, 5, 33. [Google Scholar] [CrossRef] [PubMed]
  51. Mak-Mensah, E.; Zhao, W.; Zhou, X.; Zhang, D.; Zhao, X.; Wang, Q.; Obour, P.B. Influence of tied-ridge with maize straw biochar on alfalfa fodder yield, nutritional quality, and production economics. J. Soil. Sci. Plant Nutr. 2023, 23, 339–350. [Google Scholar] [CrossRef]
  52. Choudhary, P.; Prasad, M.; Choudhary, M.; Kumar, A.; Kumar, S.; Srinivasan, R.; Mahawer, S.K. Exploring invasive weed biochar as soil amendment: A study on fodder oats productivity and soil biological properties. Environ. Res. 2023, 216, 114527. [Google Scholar] [CrossRef] [PubMed]
  53. Dai, Y.; Zheng, H.; Jiang, Z.; Xing, B. Combined effects of biochar properties and soil conditions on plant growth: A meta-analysis. Sci. Total Environ. 2020, 713, 136635. [Google Scholar] [CrossRef]
  54. Linn, J.G.; Martin, N.P. Forage Quality Tests and Interpretations (Revised 1989); University Minnesota, Agricultural Extension Service: Minneapolis, MN, USA, 1989; Available online: https://conservancy.umn.edu/handle/11299/207442 (accessed on 10 February 2023).
  55. Institute of Meteorology and Water Management—National Research Institute. Available online: https://imgw.pl/ (accessed on 20 February 2023).
  56. Joseph, S.; Cowie, A.L.; Van Zwieten, L.; Bolan, N.; Budai, A.; Buss, W.; Cayuela, M.L.; Graber, E.R.; Ippolito, J.A.; Kuzyakov, Y.; et al. How biochar works, and when it doesn’t: A review of mechanisms controlling soil and plant responses to biochar. GCB Bioenergy 2021, 13, 1731–1764. [Google Scholar] [CrossRef]
  57. Ye, L.; Camps-Arbestain, M.; Shen, Q.; Lehmann, J.; Singh, B.; Sabir, M. Biochar effects on crop yields with and without fertilizer: A meta-analysis of field studies using separate controls. Soil. Use Manag. 2020, 36, 2–18. [Google Scholar] [CrossRef]
  58. Awad, Y.M.; Wang, J.; Igalavithana, A.D.; Tsang, D.C.; Kim, K.-H.; Lee, S.S.; Ok, Y.S. Biochar effects on rice paddy: Meta-analysis. Adv. Agron. 2018, 148, 1–32. [Google Scholar] [CrossRef]
  59. Biederman, L.A.; Harpole, W.S. Biochar and its effects on plant productivity and nutrient cycling: A meta-analysis. GCB Bioenergy 2013, 5, 202–214. [Google Scholar] [CrossRef]
  60. Crane-Droesch, A.; Abiven, S.; Jeffery, S.; Torn, M.S. Heterogeneous global crop yield response to biochar: A meta-regression analysis. Environ. Res. Lett. 2013, 8, 044049. [Google Scholar] [CrossRef]
  61. Jeffery, S.; Abalos, D.; Prodana, M.; Bastos, A.C.; Van Groenigen, J.W.; Hungate, B.A.; Verheijen, F. Biochar boosts tropical but not temperate crop yields. Environ. Res. Lett. 2017, 12, 053001. [Google Scholar] [CrossRef]
  62. Nielsen, S.; Minchin, T.; Kimber, S.; van Zwieten, L.; Gilbert, J.; Munroe, P.; Joseph, S.; Thomas, T. Comparative analysis of the microbial communities in agricultural soil amended with en-hanced biochars or traditional fertilisers. Agric. Ecosyst. Environ. 2014, 191, 73–82. [Google Scholar] [CrossRef]
  63. Prommer, J.; Wanek, W.; Hofhansl, F.; Trojan, D.; Offre, P.; Urich, T.; Schleper, C.; Sassmann, S.; Kitzler, B.; Soja, G.; et al. Biochar Decelerates Soil Organic Nitrogen Cycling but Stimulates Soil Nitrification in a Temperate Arable Field Trial. PLS ONE 2014, 9, e86388. [Google Scholar] [CrossRef]
  64. Kammann, C.I.; Schmidt, H.-P.; Messerschmidt, N.; Linsel, S.; Steffens, D.; Müller, C.; Koyro, H.-W.; Conte, P.; Joseph, S. Plant growth improvement mediated by nitrate capture in co-composted biochar. Sci. Rep. 2015, 5, 11080. [Google Scholar] [CrossRef]
  65. van Zwieten, L.; Kimber, S.; Morris, S.; Downie, A.; Berger, E.; Rust, J.; Scheer, C. Influence of biochars on flux of N2O and CO2 from Ferrosol. Aust. J. Soil. Res. 2010, 48, 555–568. [Google Scholar] [CrossRef]
  66. Reiné, R.; Ascaso, J.; Barrantes, O. Nutritional Quality of Plant Species in Pyrenean Hay Meadows of High Diversity. Agronomy 2020, 10, 883. [Google Scholar] [CrossRef]
  67. Paszkiewicz-Jasińska, A.; Wróbel, B.; Stopa, W.; Jakubowska, Z.; Steinhoff-Wrześniewska, A.; Zielewicz, W. Nutritional Status of Wood Melick (Melica uniflora Retz.) in a Natural Forest Stand in South-Western Poland. Forests 2023, 14, 1605. [Google Scholar] [CrossRef]
  68. Buxton, D.R.; Brasche, M.R. Digestibility of structural carbohydrates in cool-season grass and legume forages. Crop Sci. 1991, 31, 1338–1345. [Google Scholar] [CrossRef]
  69. Kuoppala, K.; Ahvenjarvi, S.; Rinne, M.; Vanhatalo, A. Effects of feeding grass or red clover silage cut at two maturity stages in dairy cows. P. 2. Dry matter intake and cell wall digestion kinetics. J. Dairy. Sci. 2009, 92, 5634–5644. [Google Scholar] [CrossRef] [PubMed]
  70. Schlegel, P.; Wyss, U.; Arrigo, Y.; Hess, H.D. Mineral concentrations of fresh herbage from mixed grassland as influenced by botanical composition, harvest time and growth stage. Anim. Feed. Sci. Technol. 2016, 219, 226–233. [Google Scholar] [CrossRef]
  71. Buxton, D.R. Quality-related characteristics of forages as influenced by plant environment and agronomic factors. Anim. Feed. Sci. Technol. 1996, 59, 37–49. [Google Scholar] [CrossRef]
  72. Rinne, M.; Nykanen, A. Timing of primary growth harvest affects the yield and nutritive value of timothy-red clover mixtures. Agric. Food Sci. Finl. 2000, 9, 121–134. [Google Scholar] [CrossRef]
  73. Barry, H.; Major, J. Commercial scale agricultural biochar field trial in Québec, Canada over two years: Effects of biochar on soil fertility, biology and crop productivity and quality. Dynamotive Energy Syst. 2010, 1–35. [Google Scholar]
  74. McDonald, I.; Baral, R.; Min, D. Effects of alfalfa and alfalfa-grass mixtures with nitrogen fertilization on dry matter yield and forage nutritive value. J. Anim. Sci. Technol. 2021, 63, 305–318. [Google Scholar] [CrossRef]
  75. Dumont, B.; Andueza, D.; Niderkorn, V.; Luscher, A.; Porqueddu, C.; Picon-Cochard, C. A meta-analysis of climate change effects on forage quality in grasslands: Specificities of mountain and Mediterranean areas. Grass Forage Sci. 2015, 70, 239–254. [Google Scholar] [CrossRef]
  76. Niyigena, V.; Ashworth, A.J.; Nieman, C.; Acharya, M.; Coffey, K.P.; Philipp, D.; Meadors, L.; Sauer, T.J. Factors Affecting Sugar Accumulation and Fluxes in Warm- and Cool-Season Forages Grown in a Silvopastoral System. Agronomy 2021, 11, 354. [Google Scholar] [CrossRef]
  77. Truba, M.; Sosnowski, J. The effect of Tytanit on fibre fraction content in Medicago x varia T. Martyn and Trifolium pratense L. cell walls. Agriculture 2022, 12, 191. [Google Scholar] [CrossRef]
  78. Truba, M.; Jankowski, K.; Wiśniewska-Kadżajan, B.; Sosnowski, J.; Malinowska, E. The effect of soil conditioners on the quality of selected forage grasses. Appl. Ecol. Environ. Res. 2020, 18, 5123–5133. [Google Scholar] [CrossRef]
  79. Bis, Z.; Kobyłecki, R.; Ścisłowska, M.; Zarzycki, R. Biochar–Potential tool to combat climate change and drought. Ecohydrol. Hydrobiol. 2018, 18, 441–453. [Google Scholar] [CrossRef]
  80. Dickinson, D.; Balduccio, L.; Buysse, J.; Ronsse, F.; Van Huylenbroeck, G.; Prins, W. Cost-benefit analysis of using biochar to improve cereals agriculture. GCB Bioenergy 2015, 7, 850–864. [Google Scholar] [CrossRef]
  81. Maroušek, J.; Minofar, B.; Maroušková, A.; Strunecký, O.; Gavurová, B. Environmental and economic advantages of production and application of digestate biochar. Environ. Technol. Innov. 2023, 30, 103109. [Google Scholar] [CrossRef]
  82. Campion, L.; Bekchanova, M.; Malina, R.; Kuppens, T. The costs and benefits of biochar production and use: A systematic review. J. Clean. Prod. 2023, 408, 137138. [Google Scholar] [CrossRef]
  83. Xiao, L.; Feng, L.; Yuan, G.; Wei, J. Low-cost field production of biochars and their properties. Environ. Geochem. Health 2020, 42, 1569–1578. [Google Scholar] [CrossRef]
Figure 1. Location of the study site.
Sustainability 15 14333 g001
Figure 2. Biomass production of grasses, legumes, and others: V0—control; V1—0 Mg biochar, 115 kg ha−1 NPK; V2—0 Mg biochar, 185 kg ha−1 NPK; V3—5 Mg biochar, 0 kg ha−1 NPK; V4—5 Mg biochar, 115 kg ha−1 NPK; V5—5 Mg biochar, 185 kg ha−1 NPK; V6—10 Mg biochar, 0 kg ha−1 NPK; V7—10 Mg biochar, 115 kg ha−1 NPK; V8—10 Mg biochar, 185 kg ha−1 NPK.
Sustainability 15 14333 g002
Figure 3. Average monthly temperatures and precipitation in 2021–2022 for the meteorological station at Wrocław-Strachowice. Source: own, based on data provided by the Institute of Meteorology and Water Management—National Research Institute [55].
Sustainability 15 14333 g003
Figure 4. Biomass production by grass–legumes mixture in successive harvests and years of study: H1st—first harvest, H2nd—second harvest, H3rd—third harvest. V0—control; V1—0 Mg biochar, 115 kg ha−1 NPK; V2—0 Mg biochar, 185 kg ha−1 NPK; V3—5 Mg biochar, 0 kg ha−1 NPK; V4—5 Mg biochar, 115 kg ha−1 NPK; V5—5 Mg biochar, 185 kg ha−1 NPK; V6—10 Mg biochar, 0 kg ha−1 NPK; V7—10 Mg biochar, 115 kg ha−1 NPK; V8—10 Mg biochar, 185 kg ha−1 NPK. a, b—the values with different superscript letters in a column are significantly different (p < 0.05).
Sustainability 15 14333 g004
Figure 5. NDF content in grass–legume mixture broken into individual harvests and years: H1st—first harvest, H2nd—second harvest, H3rd—third harvest in (a) 2021 and (b) 2022. V0—control; V1—0 Mg biochar, 115 kg ha−1 NPK; V2—0 Mg biochar, 185 kg ha−1 NPK; V3—5 Mg biochar, 0 kg ha−1 NPK; V4—5 Mg biochar, 115 kg ha−1 NPK; V5—5 Mg biochar, 185 kg ha−1 NPK; V6—10 Mg biochar, 0 kg ha−1 NPK; V7—10 Mg biochar, 115 kg ha−1 NPK; V8—10 Mg biochar, 185 kg ha−1 NPK. a, b, c, d, e—the values with different superscript letters in a column are significantly different (p < 0.05).
Sustainability 15 14333 g005
Figure 6. ADF content in grass–legume mixture broken into individual harvests and years: H1st—first harvest, H2nd—second harvest, H3rd—third harvest in (a) 2021 and (b) 2022. V0—control; V1—0 Mg biochar, 115 kg ha−1 NPK; V2—0 Mg biochar, 185 kg ha−1 NPK; V3—5 Mg biochar, 0 kg ha−1 NPK; V4—5 Mg biochar, 115 kg ha−1 NPK; V5—5 Mg biochar, 185 kg ha−1 NPK; V6—10 Mg biochar, 0 kg ha−1 NPK; V7—10 Mg biochar, 115 kg ha−1 NPK; V8—10 Mg biochar, 185 kg ha−1 NPK. a, b, c, d, e—the values with different superscript letters in a column are significantly different (p < 0.05).
Sustainability 15 14333 g006
Figure 7. ADL content in grass–legume mixture broken into individual harvests and years: H1st—first harvest, H2nd—second harvest, H3rd—third harvest in (a) 2021 and (b) 2022. V0—control; V1—0 Mg biochar, 115 kg ha−1 NPK; V2—0 Mg biochar, 185 kg ha−1 NPK; V3—5 Mg biochar, 0 kg ha−1 NPK; V4—5 Mg biochar, 115 kg ha−1 NPK; V5—5 Mg biochar, 185 kg ha−1 NPK; V6—10 Mg biochar, 0 kg ha−1 NPK; V7—10 Mg biochar, 115 kg ha−1 NPK; V8—10 Mg biochar, 185 kg ha−1 NPK. a, b, c, d, e—the values with different superscript letters in a column are significantly different (p < 0.05).
Sustainability 15 14333 g007
Figure 8. DDM content in grass–legume mixture broken into individual harvests and years: H1st—first harvest, H2nd—second harvest, H3rd—third harvest in (a) 2021 and (b) 2022. V0—control; V1—0 Mg biochar, 115 kg ha−1 NPK; V2—0 Mg biochar, 185 kg ha−1 NPK; V3—5 Mg biochar, 0 kg ha−1 NPK; V4—5 Mg biochar, 115 kg ha−1 NPK; V5—5 Mg biochar, 185 kg ha−1 NPK; V6—10 Mg biochar, 0 kg ha−1 NPK; V7—10 Mg biochar, 115 kg ha−1 NPK; V8—10 Mg biochar, 185 kg ha−1 NPK. a, b, c, d, e—the values with different superscript letters in a column are significantly different (p < 0.05).
Sustainability 15 14333 g008
Figure 9. DMI content in grass–legume mixture broken into individual harvests and years: H1—first harvest, H2—second harvest, H3—third harvest in (a) 2021 and (b) 2022. V0—control; V1—0 Mg biochar, 115 kg ha−1 NPK; V2—0 Mg biochar, 185 kg ha−1 NPK; V3—5 Mg biochar, 0 kg ha−1 NPK; V4—5 Mg biochar, 115 kg ha−1 NPK; V5—5 Mg biochar, 185 kg ha−1 NPK; V6—10 Mg biochar, 0 kg ha−1 NPK; V7—10 Mg biochar, 115 kg ha−1 NPK; V8—10 Mg biochar, 185 kg ha−1 NPK. a, b, c, d, e—the values with different superscript letters in a column are significantly different (p < 0.05).
Sustainability 15 14333 g009
Figure 10. RFV content in grass–legume mixture broken into individual harvests and years: H1st—first harvest, H2nd—second harvest, H3rd—third harvest in (a) 2021 and (b) 2022. V0—control; V1—0 Mg biochar, 115 kg ha−1 NPK; V2—0 Mg biochar, 185 kg ha−1 NPK; V3—5 Mg biochar, 0 kg ha−1 NPK; V4—5 Mg biochar, 115 kg ha−1 NPK; V5—5 Mg biochar, 185 kg ha−1 NPK; V6—10 Mg biochar, 0 kg ha−1 NPK; V7—10 Mg biochar, 115 kg ha−1 NPK; V8—10 Mg biochar, 185 kg ha−1 NPK. a, b, c, d—the values with different superscript letters in a column are significantly different (p < 0.05).
Sustainability 15 14333 g010
Figure 11. Principal Component Analysis (PCA) distribution of samples in the study period (a); biplots showing distribution of variables and samples in the first year (b) and second year of the study (c). V0—control (blue); V1—0 Mg biochar, 115 kg ha−1 NPK (green); V2—0 Mg biochar, 185 kg ha−1 NPK (orange); V3—5 Mg biochar, 0 kg ha−1 NPK (blue); V4—5 Mg biochar, 115 kg ha−1 NPK (green); V5—5 Mg biochar, 185 kg ha−1 NPK (orange); V6—10 Mg biochar, 0 kg ha−1 NPK (blue); V7—10 Mg biochar, 115 kg ha−1 NPK (green); V8—10 Mg biochar, 185 kg ha−1 NPK (orange). NDF—neutral detergent fiber; ADF—acid detergent fiber; ADL—acid detergent lignin; DDM—digestible dry matter; DMI—dry matter intake; RFV—relative feed value.
Sustainability 15 14333 g011
Table 1. Chemical composition of biochar.
CharacteristicsQuantityUnits
Ash content (550 °C)7.9% (w/w)
Phosphorus (P)0.2% (w/w)
Potassium (K)1.8% (w/w)
Sodium (Na)<0.1% (w/w)
Magnesium (Mg)0.5% (w/w)
Iron (Fe)<0.1% (w/w)
Sulphur (S)<0.1% (w/w)
Silicon (SI)0.1% (w/w)
All parameters measured as dry basis.
Table 2. Composition of the grass and legumes mixture used in the study.
GrassesShare in the Mixture
% Weight
LegumesShare in the Mixture
% Weight
Lolium perenne L.20Trifolium repens L.5
Festuca arundinacea Schreb.15Medicago sativa L.5
Dectylis glomerata L.15--
Lolium multiflorum Lam.10--
Phleum pratense L.10--
Festuca rubra L.10--
Festuca ovina L.5--
Poa pratensis L.5--
Sum90-10
Table 3. Study treatments.
TreatmentAnnual Fertilization Rates
kg ha−1
Biochar
Mg ha−1
NPKBC
V00000
V10005
V200010
V36015400
V46015405
V560154010
V69025700
V79025705
V890257010
V0—control; V1—0 Mg biochar, 115 kg ha−1 NPK; V2—0 Mg biochar, 185 kg ha−1 NPK; V3—5 Mg biochar, 0 kg ha−1 NPK; V4—5 Mg biochar, 115 kg ha−1 NPK; V5—5 Mg biochar, 185 kg ha−1 NPK; V6—10 Mg biochar, 0 kg ha−1 NPK; V7—10 Mg biochar, 115 kg ha−1 NPK; V8—10 Mg biochar, 185 kg ha−1 NPK.
Table 4. Applied NPK rates in each treatment of the study.
TreatmentApplied NPK Rates
g pot−1
Applied NPK Rates
kg ha−1
NPKBC
V0, V1, V20000
V3, V4, V50.50.350.3115
V6, V7, V80.890.580.4518
V0—control; V1—0 Mg biochar, 115 kg ha−1 NPK; V2—0 Mg biochar, 185 kg ha−1 NPK; V3—5 Mg biochar, 0 kg ha−1 NPK; V4—5 Mg biochar, 115 kg ha−1 NPK; V5—5 Mg biochar, 185 kg ha−1 NPK; V6—10 Mg biochar, 0 kg ha−1 NPK; V7—10 Mg biochar, 115 kg ha−1 NPK; V8—10 Mg biochar, 185 kg ha−1 NPK.
Table 5. Effect of analyzed factors on biomass production (g DM per pot).
FactorLevelYearAverage
20212022
BC0 Mg ha−147.6 a36.9 b42.3 b
5 Mg ha−155.6 a47.1 ab51.4 ab
10 Mg ha−157.5 a53.4 a55.4 a
NPK0 kg ha−146.9 a36.1 b41.5 b
115 kg ha−154.6 a49.1 ab51.8 ab
185 kg ha−159.1 a52.3 a55.7 a
H1st56.8 b73.7 a65.2 a
2nd90.3 a29.5 b59.9 a
3rd13.6 c34.3 b23.9 b
Average 53.6 A45.8 B
Interactions
BC 0.4520.0430.041
NPK 0.3320.0340.022
H <0.001<0.001<0.001
BC*NPK 0.8320.0640.049
NPK*H <0.001<0.001<0.001
BC*H <0.001<0.001<0.001
BC*NPK*H <0.001<0.001<0.001
BC—biochar dose; NPK—NPK fertilization; H—harvest: 1st—first harvest, 2nd—second harvest, 3rd—third harvest. a, b, c—the values with different superscript letters in a column are significantly different (p < 0.05). A, B—the values with different superscript letters in a row are significantly different (p < 0.05).
Table 6. Effect of analyzed factors on NDF content (g kg DM−1).
FactorLevelYearAverage
20212022
BC0 Mg ha−1402.0 a520.8 a461.4 a
5 Mg ha−1399.5 a513.2 a456.3 a
10 Mg ha−1389.9 a512.1 a451.0 a
NPK0 kg ha−1387.8 a506.9 a447.4 a
115 kg ha−1397.9 a523.2 a460.6 a
185 kg ha−1405.6 a515.9 a460.8 a
H1st390.1 b552.3 a471.2 b
2nd349.5 c536.4 b494.1 a
3rd451.8 a457.4 c403.4 c
Average 397.1 B515.4 A
Interactions
BC 0.5450.7990.742
NPK 0.3150.3690.461
H <0.001<0.001<0.001
BC*NPK 0.7770.8300.938
NPK*H <0.001<0.001<0.001
BC*H <0.001<0.001<0.001
BC*NPK*H <0.001<0.001<0.001
BC—biochar dose; NPK—NPK fertilization; H—harvest: 1st—first harvest, 2nd—second harvest, 3rd—third harvest. a, b, c—the values with different superscript letters in a column are significantly different (p < 0.05). A, B—the values with different superscript letters in a row are significantly different (p < 0.05).
Table 7. Effect of analyzed factors on ADF content (g kg DM−1).
FactorLevelYearAverage
20212022
BC0 Mg ha−1307.6 a344.9 a326.3 a
5 Mg ha−1304.0 a347.8 a325.9 a
10 Mg ha−1303.3 a349.2 a326.3 a
NPK0 kg ha−1294.1 b352.0 a323.1 a
115 kg ha−1307.2 ab339.5 b323.3 a
185 kg ha−1313.6 a350.5 a332.0 a
H1st330.7 a349.3 b340.0 b
2nd334.3 a373.7 a354.0 a
3rd249.9 b319.0 c284.4 c
Average 305.0 B347.3 A
Interactions
BC 0.9180.7960.999
NPK 0.1240.1160.320
H <0.001<0.001<0.001
BC*NPK 0.8290.7460.967
NPK*H <0.001<0.001<0.001
BC*H <0.001<0.001<0.001
BC*NPK*H <0.001<0.001<0.001
BC—biochar dose; NPK—NPK fertilization; H—harvest: 1st—first harvest, 2nd—second harvest, 3rd—third harvest. a, b, c—the values with different superscript letters in a column are significantly different (p < 0.05). A, B—the values with different superscript letters in a row are significantly different (p < 0.05).
Table 8. Effect of analyzed factors on ADL content (g kg DM−1).
FactorLevelYearAverage
20212022
BC0 Mg ha−141.4 a48.5 a45.0 a
5 Mg ha−139.7 a49.7 a44.7 a
10 Mg ha−139.9 a50.6 a45.3 a
NPK0 kg ha−140.1 a52.6 a46.4 a
115 kg ha−139.8 a45.7 b42.8 b
185 kg ha−141.1 a50.6 a45.9 a
H1st43.8 b44.5 b44.2 b
2nd46.7 a59.6 a53.1 a
3rd30.5 c44.9 b37.7 c
Average 40.3 B49.6 A
Interactions
BC 0.4520.0430.041
NPK 0.3320.0340.022
H <0.001<0.001<0.001
BC*NPK 0.8320.0640.049
NPK*H <0.001<0.001<0.001
BC*H <0.001<0.001<0.001
BC*NPK*H <0.001<0.001<0.001
BC—biochar dose; NPK—NPK fertilization; H—harvest: 1st—first harvest, 2nd—second harvest, 3rd—third harvest. a, b, c—the values with different superscript letters in a column are significantly different (p < 0.05). A, B—the values with different superscript letters in a row are significantly different (p < 0.05).
Table 9. Effect of analyzed factors on DDM content [%].
FactorLevelYearAverage
20212022
BC0 Mg ha−164.9 a62.0 a63.5 a
5 Mg ha−165.2 a61.8 a63.5 a
10 Mg ha−165.3 a61.7 a63.5 a
NPK0 kg ha−166.0 a61.5 b63.0 a
115 kg ha−165.0 ab62.5 a63.7 a
185 kg ha−164.5 b61.6 b63.7 a
H1st63.1 b61.7 b62.4 b
2nd62.9 b59.8 c61.3 c
3rd69.4 a64.0 a66.7 a
Average 65.1 A61.8 B
Interactions
BC 0.9180.7960.999
NPK 0.1240.1160.320
H <0.001<0.001<0.001
BC*NPK 0.8290.7460.967
NPK*H <0.001<0.001<0.001
BC*H <0.001<0.001<0.001
BC*NPK*H <0.001<0.001<0.001
BC—biochar dose; NPK—NPK fertilization; H—harvest: 1st—first harvest, 2nd—second harvest, 3rd—third harvest. a, b, c—the values with different superscript letters in a column are significantly different (p < 0.05). A, B—the values with different superscript letters in a row are significantly different (p < 0.05).
Table 10. Effect of analyzed factors on DMI content [%].
FactorLevelYearAverage
20212022
BC0 Mg ha−13.0 a2.3 a2.7 a
5 Mg ha−13.1 a2.4 a2.7 a
10 Mg ha−13.1 a2.4 a2.7 a
NPK0 kg ha−13.1 a2.4 a2.8 a
115 kg ha−13.1 a2.3 a2.7 a
185 kg ha−13.0 a2.4 a2.7 a
H1st3.1 b2.2 c2.5 c
2nd2.7 c2.3 b2.6 b
3rd3.4 a2.6 a3.0 a
Average 3.1 A2.4 B
Interactions
BC 0.5430.7760.721
NPK 0.2960.2920.433
H <0.001<0.001<0.001
BC*NPK 0.7370.7680.928
NPK*H <0.001<0.001<0.001
BC*H <0.001<0.001<0.001
BC*NPK*H <0.001<0.001<0.001
BC—biochar dose; NPK—NPK fertilization; H—harvest: 1st—first harvest, 2nd—second harvest, 3rd—third harvest. a, b, c—the values with different superscript letters in a column are significantly different (p < 0.05). A, B—the values with different superscript letters in a row are significantly different (p < 0.05).
Table 11. Effect of analyzed factors on RFV content.
FactorLevelYearAverage
20212022
BC0 Mg ha−1153.3 a112.1 a132.7 a
5 Mg ha−1155.0 a113.8 a134.4 a
10 Mg ha−1158.5 a113.4 a135.9 a
NPK0 kg ha−1161.5 a114.4 a138.0 a
115 kg ha−1154.3 ab111.9 a133.1 a
185 kg ha−1151.1 b113.0 a132.0 a
H1st151.2 b104.3 b127.7 b
2nd130.4 c104.4 b117.4 c
3rd185.3 a130.6 a157.9 a
Average 155.6 A113.1 B
Interactions
BC 0.6700.9270.816
NPK 0.1940.7120.414
H <0.001<0.001<0.001
BC*NPK 0.7590.9850.954
NPK*H <0.001<0.001<0.001
BC*H <0.001<0.001<0.001
BC*NPK*H <0.001<0.001<0.001
BC—biochar dose; NPK—NPK fertilization; H—harvest: 1st—first harvest, 2nd—second harvest, 3rd—third harvest. a, b, c—the values with different superscript letters in a column are significantly different (p < 0.05). A, B —the values with different superscript letters in a row are significantly different (p < 0.05).
Disclaimer/Publisher’s Note: The statements, opinions and data contained in all publications are solely those of the individual author(s) and contributor(s) and not of MDPI and/or the editor(s). MDPI and/or the editor(s) disclaim responsibility for any injury to people or property resulting from any ideas, methods, instructions or products referred to in the content.

