Abstract
This paper presents a Multi-Period Optimal Power Flow (MOPF) modeling applied to the minimization of energy losses in Distribution Networks (DNs) considering the reactive power control of Photovoltaic Generation (PVG) that can be applied to both short-term and long-term operation planning. Depending on the PV Power Factor () limitations, PVG may provide both active and reactive power. The optimal power factor control on the buses with PVG contributes to an economical and safe operation, minimizing losses and improving the voltage profile of the DN. The proposed MOPF was modeled in order to minimize active energy losses subject to grid constraints and limitations. The variations of loads and PVG were discretized hour by hour, composing a time horizon of 24 h for day-ahead planning; nonetheless, the methodology can be applied to any other time period, such as a month, year, etc., by simply having generation and load forecasts. To demonstrate the effectiveness and applicability of the proposed approach, various tests were carried out on 33-bus and 69-bus distribution test systems. The analyses considered the DN operating with PVG in four different cases: (a) fixed at 1.0; (b) fixed at 0.9 capacitive; (c) hourly optimization; and (d) optimization of for a single value. The results show that a single optimal adjustment of minimizes losses, improves voltage profile, and promotes safe operation, avoiding multiple adjustments during the operating time horizon. The algorithm is extremely fast, taking around 2 s to reach a solution.
1. Introduction
1.1. Motivation
Renewable energy capacity and electricity generation are expanding globally. There is a current emphasis on satisfying the increasing electricity demand in an environmentally sustainable manner. Renewable Energy Sources (RES), like PVG and Wind Generation (WG), are recognized as pivotal in achieving a sustainable energy future [1,2]. Consequently, the adoption of PVG has experienced substantial growth in recent years [3]. According to the International Energy Agency (IEA), global energy demand is projected to rise by over 30.0% by 2040 [4]. As a result, the gradual development of RES, including PVG, WG, and biomass, has gained momentum. Distributed Generation (DG) assumes a critical role in modern electric power grids. By generating electricity close to or at the consumption point, DG, such as PVG, reduces distribution losses, bolsters grid resilience, and facilitates the integration of renewable energy. This type of generation also provides increased flexibility, heightened reliability, and the potential for reducing peak demand in certain networks [5].
PVG is one of the cleanest and most abundant energy resources [6,7]. The decrease in implementation costs, the development of new inverter technologies, low environmental impact rates, and growing incentive policies are responsible for this trend. Generally, PVG operates with a unity power factor, i.e., there is no generation or absorption of reactive power by the Photovoltaic Inverter (PVI) at the Connection Point (CP) [8]. However, implementing reactive power control is an important measure for mitigating losses and managing grid voltage levels effectively in DNs [9]. As reported in [10], it is recommended that PVG must have the capability to support reactive power in the CP. In a typical PVG system, connected to DN, the conversion process follows these steps: (a) The solar module converts the sunlight into Direct Current (DC) power; (b) The inverter converts DC power to Alternating Current (AC), being the PVI responsible for making the integration between the solar modules and the DN; and (c) In energy systems without storage, the prosumer utilizes the generated energy to supply their demand, while the surplus energy is injected into the DN. Conversely, if the demand exceeds the amount of energy generated, the deficit is provided by the DN. Also, the PVI can control the power factor of the PVG, with adjustment, and thus, it is possible to absorb or inject reactive power, considering the PVI limitations.
As illustrated in Figure 1, the CP Power Factor () in a network with PVG can decrease when the PVIs work with a unity power factor, i.e., = 1. This happens because with the generation of active power from the PVGs there is a decrease in the flow of active energy from the DN at the CP; nonetheless, the reactive power demanded by the loads continues to be supplied by the DN. Therefore, as can be seen in Figure 1, there will be a degradation of the . Note that is larger than , making the decrease, since .

Figure 1.
degradation when PVG works with = 1, where P: Active power demand in CP; Q: Reactive power demand in CP; S: Apparent power demand in CP; : angle without PVG generation; : angle with PVG generation and = 1.
One way to avoid this situation, and still optimize the operation of the network in the presence of PVG, is to adjust the PVI, considering demand and generation forecasts; nonetheless, these forecasts are not within the scope of the present work.
From Figure 1, it can be concluded that injecting reactive power into the CP improves the . However, the PVI has limitations that must be considered for reactive power generation. In addition to the limitations that will be presented in the next sections, when the PVGs operate with ≠ 1, it is necessary to cut off part of the available active power of the inverter [11]. Only with this power reduction, it is possible for the inverter to either inject or absorb reactive power. That action is needed to avoid an overload of the inverter since the total apparent power needs to be maintained. This is described by Equation (1).
where:
- : Active power injected at bus by inverter;
- : Apparent power injected by inverter;
- : Reactive power injected/absorbed by inverter.
When the is optimized, it is possible to reduce technical losses of the DN, improving the voltage profile and avoiding unnecessary increments in active power cuts of the PVG. This action leads to an economic and safe operation. Energy losses constitute one of the technical parameters considered in this paper, aiming to improve the network operating conditions.
1.2. Related Works
Numerous studies have been carried out regarding the impact of PVG in DNs [12]. Several techniques are presented in the specialized literature to approach this problem, such as the use of voltage regulators, and optimal reactive power management in inverters. In [13], a two-level over-voltage control strategy is proposed to deal with DNs that feature high penetration of PVGs. In this case, the optimal management of on-load tap changers and battery energy storage systems is required at the peak of PV generation. In [14], the impact of PVG considering three penetration levels was analyzed. The analysis was performed for the steady state and evaluated the voltage levels, unbalance, and losses in a feeder. In this case, a unity was considered. In [15], the control considering the communication between inverters in the system is studied. By exchanging data between inverters, it is possible to control the of the entire network actively in real time, absorbing or inserting reactive power from one bus to another.
The authors in [16] study the integration of PVG in DN and the problems associated with it when there is no adequate planning. The article presents an implementation of Volt-Var control to reduce voltage fluctuation resulting from high PV penetration. The effect of this control on the system power losses was also studied. An algorithm was implemented to minimize system losses, keeping bus voltages within allowed limits. The study considers that in some cases, the PV active power can be reduced for greater reactive power availability. However, the paper does not consider the problem of cutting off the active power of the photovoltaic system. The algorithm was tested on the IEEE 13-bus system and on a larger Electric Power Research Institute (EPRI) distribution system known as the J1 feeder. The authors concluded that the methodology effectively minimized system losses and maintained the voltage profile within acceptable limits.
The coordination between voltage regulators and PVG is studied in [17]; the main goal is to minimize the voltage deviation in the bus considering the minimization of voltage regulator operations. In [18], the losses in a medium voltage distribution network are analyzed considering two distinct situations of PVG penetration. Initially, a Photovoltaic (PV) source was allocated in only one feeder, and then 17 sources of PV generation, one per feeder, were also allocated. A fixed value of PVG was used along with three levels of load variation (low, medium, and heavy); it was also considered that the inverters could operate with different from the unity. Furthermore, the losses in the inverters were modeled for the case of them being operating at a power factor different from the unity. The authors concluded that injecting reactive power into the grid through the inverters is a viable energy-saving solution. In [19], the authors discuss the energy management of smart DNs that include WG and PVG. The model aims at minimizing DN operating costs stated as an objective function in relation to the constraints of an optimal AC power flow. In addition, stochastic programming is adopted to model the likely behavior of loads, renewable generations, and energy market prices. The problem was tested on a 33-bus test system using General Algebraic Modeling System (GAMS). The results attained evidenced the potential of the proposed approach for minimizing power losses, voltage deviations, and energy costs compared to traditional load flow studies.
In [20], the authors presented a hybrid approach associating a mathematical programming technique with a metaheuristic approach, to optimize the electricity distribution network with PVG penetration. The optimization considered Distribution Network Reconfiguration (DNR) and the adjustment of the on the reactive power, controlling the voltage profile and minimizing the losses in the network. The methodology used a Particle Swarm Optimization (PSO) algorithm for DNR and an Optimal Power Flow (OPF) to adjust the value of the photovoltaic inverters and maintain the limits of grid operation; however, the work did not consider the global optimization of the .
A MOPF was presented in [21] to find the optimal allocation of DG seeking to minimize energy losses. The algorithm considers the voltage levels and DG power factor, aiming to increase its efficiency with extra loss reduction. The power factor range studied was 0.98 (capacitive and inductive) and 1.0. The MOPF technique presented significant benefits in terms of loss reduction.
In [22], the authors studied the impacts of high PVG penetration in DNs. To reduce the negative impact of PVG, an OPF was modeled with the objective of minimizing the technical losses and energy consumption of the network. To reach the objective function, voltage and reactive control levels at the buses are used. The power at the inverter terminals was considered with a time and load variation curve modeled as light and heavy loads. The goal was achieved through the reactive control of the inverter. A 5.0 MW PV was modeled at a randomly chosen bus. The proposed control aims to optimize the injection of reactive power in order to minimize technical losses and control the voltage amplitude so that consumption is minimized. It was verified that the technique is effective in mitigating voltage fluctuation problems and decreasing technical losses.
Drawing upon prior research, as summarized in Table 1, it is clear that optimizing the operation of DNs is particularly crucial when confronted with a large penetration of PVG. Considering the research works consulted in the literature review, the necessity and applicability of the proposed approach in DN planning become evident since this approach encompasses both a global and hour-by-hour adjustment of the . It is worth mentioning that this type of adjustment has not been explored in the specialized literature, which constitutes the main contribution of this research.

Table 1.
Overview of the reviewed works related to PV generation.
The goal of this work is to develop a MOPF to minimize active power losses in DNs. This goal is achieved by optimizing the adjustment to be set in the PVIs, thus it is possible to control the reactive power in the DN. The nature of these types of problems motivates the use of metaheuristics [27]. Nevertheless, the emergence of powerful commercial tools brings the possibility of using commercial solvers, which is more attractive for the energy industries. In this sense, we propose to solve the problem in question using A Modeling Language for Mathematical Programming (AMPL) through the Knitro [28] solver.
Hourly PVG and load curves were considered in the optimization process, which can be done in two ways. The first one is hourly, so every hour, the algorithm optimizes the values of the in the inverters. This stage is performed by running an OPF every hour. In the second one, the algorithm optimizes the for a single value that leads to the best solution for the time horizon under consideration. This second approach is more attractive because it requires only one adjustment according to the algorithm response. This proposal can be extended to longer periods, such as months and years, by simply using the load and generation curves forecast for the period of time under consideration. To implement the first option, it would be necessary to invest in technology capable of dynamically changing the of the PVG on an hourly basis. However, this technology is far from the reality of many energy companies and may require a significant investment. Therefore, the possibility of a single and optimal adjustment may be more feasible.
1.3. Article Contributions and Organization
The main contributions of the proposed research are described as follows:
- An efficient methodology to adjust the with a MOPF approach is proposed and tested in two benchmark distribution test systems.
- An analysis of technical losses is presented considering a global adjustment (across the entire time horizon) and compared with the inverter adjustment on an hourly basis.
- The proposed MOPF is developed in the commercial software AMPL and solved through the Knitro solver version 12.0.0. Therefore, results can be reproduced by the scientific community, and the methodology can be adapted for large-scale test systems.
- The methodology can be applied to both short-term planning (such as day-ahead) and longer periods, requiring only generation and demand forecasts.
The rest of this work is organized as follows. In Section 2, the grid features are presented, where the PVI and the characteristics of the PVG and the load curves are discussed. Section 3 shows the mathematical model of the MOPF and the solution methodology applied to the problem. In Section 4, the methodology is applied to two benchmark DNs with several PVGs, obtaining the adjustments. Section 5 presents the results and discussion. Finally, the conclusions of the work are presented in Section 6.
2. Grid Aspects
The network load and PVG forecasts can be generated using computational tools and historical data associated with current measurements. Given the technologies and limitations of PVG, it is possible to estimate the power, both active and reactive, generated by this intermittent energy source.
2.1. PV Generation
The global installed PVG capacity has increased more than 10 times in the last decade, from around 40 GW in 2010 to over 500 GW in 2021 [4]. PVG is becoming increasingly competitive against other energy sources such as coal and natural gas; also, government incentive policies have facilitated the expansion of PVGs in many countries.
2.1.1. The Inverter
The connection between the PVG and the DN is done through an electronic device known as the inverter. This device is necessary to transmit the power generated by the PV arrangement to the DN and with different voltage levels, depending on the location. The inverter must adjust the voltage and current signals from the PV array before entering into the DN or when supplying power to any load. The AC voltage output must have the appropriate amplitude, frequency, and harmonic content for the loads to be powered. In the case of inverters operating connected to the DN (the one analyzed in this work), the output voltage of the inverter must be synchronized to the grid. Unlike traditional strategies, this study employs the optimization of , which considers all network parameters, including load, PV generation, line characteristics, and operational limits, to ensure a safe and efficient network operation based on load and PV generation data for the specified time period.
In general, the inverters for connection to the DN with a rated power of up to 5.0 Kilowatt (kW) are single-phase. For greater powers, usually, a single three-phase inverter is implemented or a balanced bank of three single-phase inverters [29]. The inverter’s DC/AC efficiency does not have a constant value. It depends on the load connected that varies during the day according to the load curve and PVG curve [30]. If the load connected to the inverter is much lower than its rated power, the efficiency decreases [31]. The efficiency of inverters connected to network devices can reach values of up to 98% for circuits without transformers and 94% for inverters with transformers. These efficiencies declared by manufacturers usually refer to the maximum efficiency, which occurs only for a given load condition and is unusual to be close to 100% for the inverter at its nominal power. Generally, for a loading lower than 50%, the efficiency is lower, and the control is not recommended [27]. This consideration has been added to the model. When the PVG is lower than a certain percentage, the is fixed at 1.0. The inverter sizing is based on the PV generation capacity.
2.1.2. PVG Curve
Different uses of PVG forecasts require different types of data. Forecasts can be applied to a single PVG, or an arrangement of PVG systems spread over a region. The forecasts are usually of the output power of the systems, which is directly linked to the variation in solar radiation, and can be of the short and long term, as presented in [32]. The PVG normally starts at sunrise and ends when the sun goes down. Peak generation is usually reached between 12:00 and 13:00 p.m., when the irradiance is usually maximum. Figure 2 shows the reactive curve capability of inverters related to PVG. Note that the PVG starts generating energy from 6:00 a.m., and by 8:00 a.m., the PVI reaches a load of 50%, at which point it begins to provide reactive power. It is important to mention that other load percentages can also be considered. The PVG forecast, i.e., the generation curve for one day ahead, is considered as input data; it is worth mentioning that assessing the accuracy of these forecasts is out of the scope of this study.
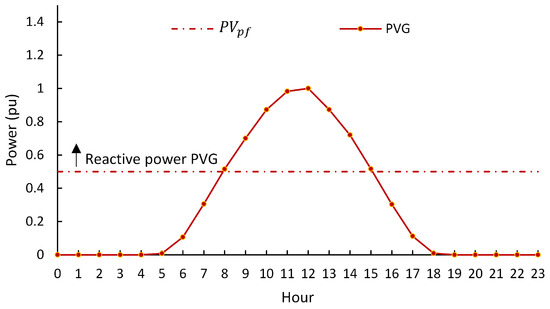
Figure 2.
PVG curve with inverter.
2.2. Load Curve
In this application, we use the load curve to obtain the active and reactive power. Load forecasting is a technique used to predict the power or energy needed to always balance load supply and demand. It is essential for the proper functioning of the electrical industry. It can be classified as short-term (a few hours), medium-term (a few weeks to a year) or long-term (more than a year). The load curve depends on several factors, such as year season, load characteristics, day of the week, holidays, etc. Figure 3 presents the residential load curve used in this paper, considering the 24 h period as analogous in [12]. The curve is used to obtain both active and reactive power, considering the power data of the analyzed networks.
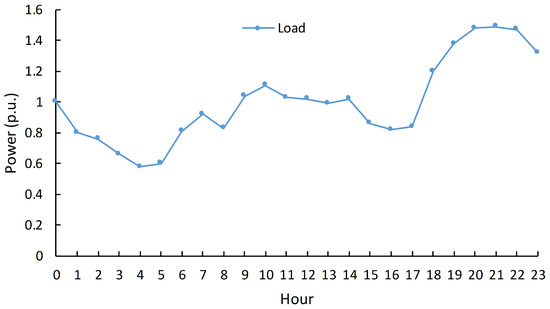
Figure 3.
Residential load curve.
3. Problem Formulation
The circuits and loads were modeled as a balanced three-phase and without harmonic distortions. The analyses were carried out at the medium voltage of the DN. Each transformer of the medium voltage is considered as a network bus. The MOPF algorithm was implemented using AMPL and the Knitro solver was used to find the optimal solution; that is, the as well as the network variables. Equation (2) is the objective function, which, in this case, represents the minimization of total energy losses within a 24 h period.
where:
- : Total active energy losses (Wh);
- : Number of lines of the system;
- : Branch resistance i;
- : Electric current circulating in branch i in the hour t;
- T: Period composed of t hours.
The objective function given by Equation (2) is subject to the following constraints.
3.1. Load Flow Constraints
Equations (3) and (4) represent the balance of active and reactive power for all buses in the network in each t hour, considering a single power factor. This modeling can be extended to an hourly adjusted power factor.
where:
- : Active power generated by substation k in time t;
- : Reactive power generated by substation k in time t;
- : Apparent power injected at bus k by PVG in time t;
- : Active power injected at bus k by PVG in time t;
- : Power factor in PVI at bus k;
- : Active power load connected to the bus k in time t;
- : Reactive power load connected to the bus k in time t;
- : Reactive power provided by PVG to the bus k in time t;
- : Real part of the admittance matrix for the branch ;
- : Imaginary part of the admittance matrix for the branch ;
- : Voltage on the bus k at time t;
- : Voltage on the bus m at time t;
- : Set of all buses connected to the bus k.
The main variable to be optimized is , in addition to the network variables for each hour t. Their values will satisfy all operational conditions of the network and minimize active energy losses. It is important to highlight that the is optimized with a single adjustment considering the entire time horizon (24 h). To compare the results, an hourly adjustment of the was also performed.
3.2. Inverter Power Factor Limitation
The limits described in Equation (5) define the range of the available settings of .
where:
- : Minimum value at bus k;
- : Maximum value at bus k.
As mentioned previously, when the inverter works with low loading, its efficiency decreases. Under this condition, it is not recommended to operate with ≠ 1. Therefore, the proposed algorithm will impose the condition described in Equation (6), where represents the percentage of PVI loading used to provide reactive power. This equation defines whether the control imposed in Equation (5) will be used. If the power factor control is not indicated, the system is solved considering = 1.
where:
- : Apparent power of PVG at bus k in time t;
- : Apparent nominal power of PVG at bus k;
- : Value related to inverter efficiency.
3.3. Voltage Constraints
- : Minimum voltage limit at bus k;
- : Maximum voltage limit at bus k.
4. Solution Methodology
The mathematical modeling presented in Section 3 is used for a time horizon discretized in 24 h. A one-hour interval is used, seeking to obtain information in Kilowatt-hour (kWh). The MOPF approach is summarized in Figure 4. The grid data as well as the load curve and the PVG curve are provided for each hour t. When a specific bus incorporates PVG capabilities, an additional analysis is undertaken, considering the PVG curve, to effectively incorporate the constraint. It is worth mentioning that PV generators are not meant to perform voltage control and therefore the buses where these are allocated are treated as load or PQ buses in the power flow. After setting up the problem with all the constraints, the model is solved using the commercial Knitro solver, aiming to minimize the energy losses of the network in the time horizon under consideration.
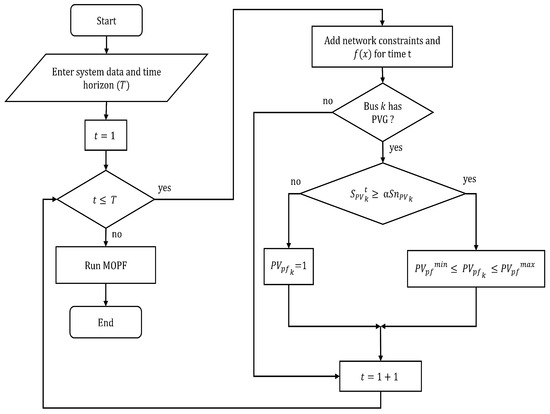
Figure 4.
Flowchart of the proposed MOPF.
The concrete steps of the MOPF approach are as follows:
The process begins with the input of the distribution system data. The next step is to specify the time horizon T, which is then discretized hour by hour. In the studies conducted in this work, we used 24 h. Following that, constraints are considered for each time period (t), such as power balance (Equations (3) and (4)) and voltage constraints (Equation (7)); furthermore, the inverter loading is checked for the buses with PVG as indicated by Equation (5), which may lead to fixing the at 1 or not, i.e., within the specified limits. After all constraints for the time horizon T are included, the MOPF is executed, and the results are analyzed.
The model was designed using continuous variables. The Knitro solver has different algorithms such as the active set method, interior point algorithm with conjugate gradient, and direct interior point algorithm, offering different options for solving nonlinear programming problems, and also allowing the possibility of combining these methods during the solution, providing greater flexibility in its use [33]. In all tests, the solver chooses the best solution strategy automatically, thus avoiding the need for parameter adjustment.
5. Results and Discussion
The results of the proposed methodology, applied to two test systems, featuring 33 and 69 buses, are presented in this section. All simulations were carried out on an Intel® Core™ i7 CPU @ 1.8 GHz computer with 8 GB of RAM and Windows 11 Home 64-bit. A tolerance of 10 × 10−7 was used in all cases. The distribution systems were tested considering four cases, as illustrated in Table 2. Case 1 represents operation with active power only, no reactive power supply. Case 2 explores the inverter providing a significant portion of reactive power, with a leading of 0.9. These extremes illustrate potential outcomes under arbitrary adjustments. Case 3 features hourly adjustments, improving loss conditions. Case 4 offers optimized adjustments covering the entire period.

Table 2.
Cases under analysis.
5.1. Results with the 33-Bus Test System
Figure 5 shows the 33-bus distribution test system used in this test, proposed by [34], with an operating voltage of 12.66 kV and voltage limits ranging from 0.90 to 1.05 p.u., except for the slack bus (substation), where the voltage was fixed at 1.0 p.u. The network was modified to include eight PVGs. The maximum power of the PVGs amounts to 3600 kW. The locations and capacity of the PVGs were randomly chosen. Seeking an intermediate adjustment of , reactive loads were limited to 60%. The power factor adjustment can range from 1 to 0.9 leading. For this system an value of 0.5 was considered, meaning that for generation less than 50%, the is set to 1.
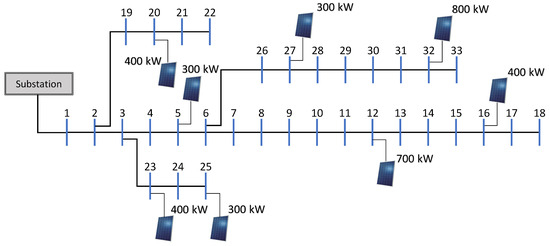
Figure 5.
One-line diagram of the 33-bus test system with PVGs.
Figure 6 shows the values of the active power of the PVGs as well as the active and reactive powers of the loads for the time horizon under consideration.
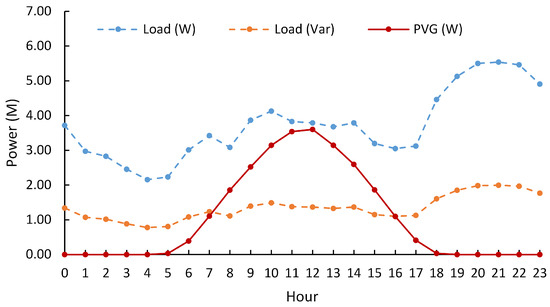
Figure 6.
Active power curves used in the analyses (33-bus test system).
5.1.1. Losses Analysis of the 33-Bus Test System
The active power losses for the solar period for the four cases, considering the period with reactive PVG, are shown in Figure 7. The losses for the whole time horizon were 29,636.48, 28,347.31, 28,276.57, and 28,278.67 kWh for Cases 1, 2, 3, and 4, respectively. The best result was obtained for Case 3. For Case 4, a small increase was observed, in the order 2 kWh in relation to Case 3. Comparing Case 4 with Cases 1 and 2, there was a reduction of 1357.8101 kWh and 68.6431 kWh, respectively.
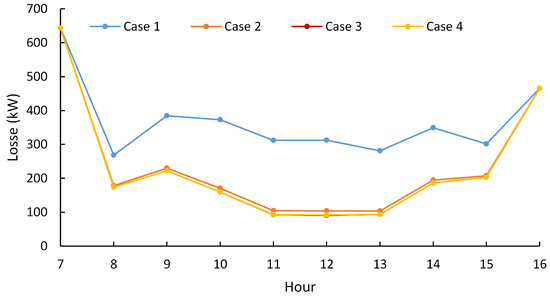
Figure 7.
Active losses in the four cases with PVG (33-bus test system).
5.1.2. Slack Bus Generation Analysis of the 33-Bus Test System
Figure 8 depicts the reactive slack bus generation for the solar period for all cases. Note that in Case 1, the system requires a larger amount of reactive power from the substation (slack bus) since the PVIs are set up to 1.0. In Case 2, considering the = 0.9 leading, the reactive power is the lowest, and between 11 and 13 h, it injects inductive power. Cases 3 and 4 represent the optimized .
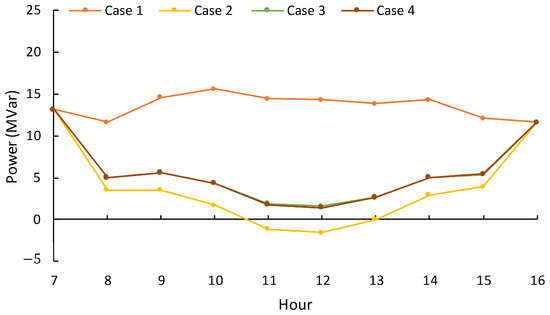
Figure 8.
Reactive slack bus generation of the 33-bus test system.
5.1.3. Reactive Generation of PVGs for the 33-Bus Test System
Figure 9 illustrates the reactive power generation of the PVGs across all cases. The PVIs supply reactive power to the Cases 2, 3, and 4 only when the power of PVG exceeds 50% of the nominal value, in other words, it starts at 8:00 a.m. and ends at 3:00 p.m.
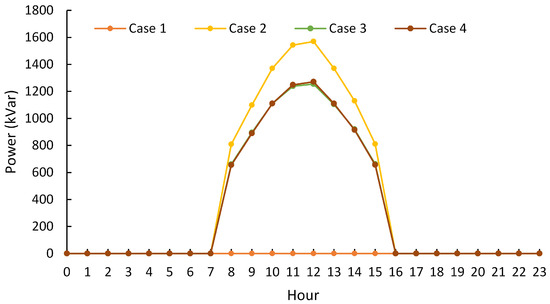
Figure 9.
Reactive generation of PVGs (33-bus test system).
The value of the reactive power is calculated according to Equation (1), taking into account the characteristic aspects of the inverter. In Case 1, the inverter is considered to supply only active power and there is not any injection of reactive power. In Case 2, the maximum reactive power is 1600 kVar when active and reactive power are supplied by a single inverter unit. In Cases 3 and 4, the amount of reactive power is basically the same, but in Case 4, it is only necessary to adjust the once during the whole period of time.
5.1.4. Power Factor Control Analysis of the 33-Bus Test System
In this subsection, the analysis of related to Cases 3 and 4 is presented. For Case 1, as already mentioned, all were set to 1.0. For Case 2, the limits were adopted in 0.9 leading. Table 3 presents the adjustment of for Case 3. Note that from 5:00 to 7:00 a.m., the PVG only dispatches active power (power factor equal to 1.0), according to Equation (5). From 8:00 a.m. to 3:00 p.m., the is optimized on an hourly basis. Table 4 presents the single adjustment of from 8:00 a.m. to 3:00 p.m. The remaining values for the other hours are identical to those presented in Table 3.

Table 3.
Optimal adjustment of for Case 3.

Table 4.
Optimal adjustment of for Case 4.
5.1.5. Voltage Profile
Figure 10 depicts the voltage profile at 12:00 h. It is observed that the injection of reactive power contributes to the improvement of the voltage profile. The average voltage magnitude for Cases 1, 2, 3, and 4 were 0.9930 p.u., 1.0001 p.u., 0.9990 p.u., and 0.9994 p.u., respectively.
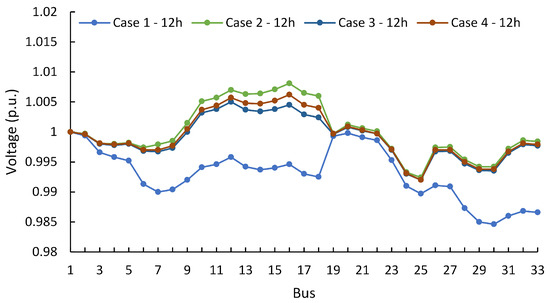
Figure 10.
Voltage profile at 12:00 (33-bus test system).
5.1.6. Mopf Convergence Analysis of the 33-Bus Test System
Figure 11 depicts the convergence process. In such a case, the y-axis is presented on a logarithmic scale. The graph indicates the objective function and the mismatches of the constraints for the 33-bus test system. As can be seen, the minimum value of the objective function is achieved in a few iterations.
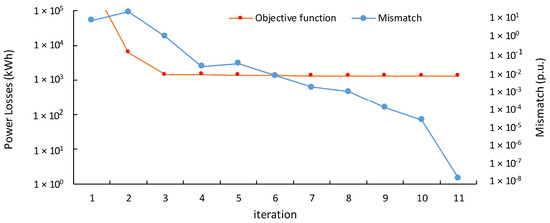
Figure 11.
Convergence for Case 3 (33-bus test system).
5.2. Results with the 69-Bus Test System
This system operates at 12.66 kV and features a total demand of 3.8021 MW and 2.6947 MVar [35]. For the cases under study, the reactive load was reduced by half (1.34735 MVar). In this system, 11 PVGs were added, with a maximum generation of 3.8 MW. The locations and capacity of the PVGs were chosen randomly. For these systems, an value of 0.2 was considered, meaning that for generation less than 20%, the is set to 1. The one-line diagram of the 69-bus test system with the PVGs is shown in Figure 12.
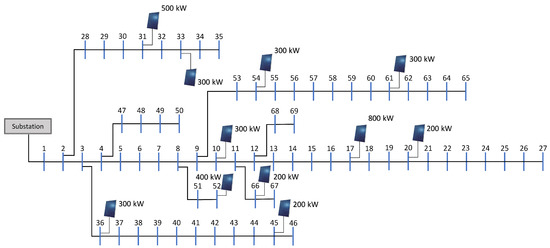
Figure 12.
One-line diagram of the 69-bus test system with PVGs.
Figure 13 illustrates the values of the active powers of the PVGs and the active and reactive powers of the loads, with an hour-by-hour discretization.
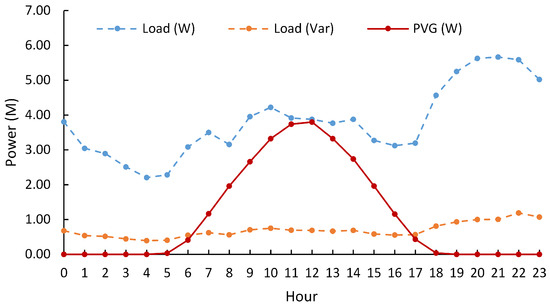
Figure 13.
Active power curves used in the analyses (69-bus test system).
5.2.1. Losses Analysis of the 69-Bus-Test System
Figure 14 illustrates the active energy losses for all cases, during the reactive PVG. The total losses during the time horizon amounted to 3696.30 kWh, 3639.55 kWh, 3631.95 kWh, and 3632.83 kWh for Cases 1, 2, 3, and 4, respectively.
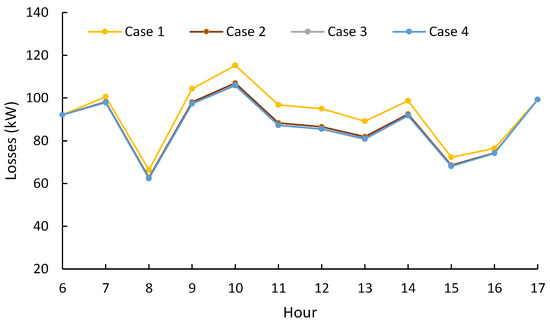
Figure 14.
Active losses in the four cases with PVG (69-bus test system).
5.2.2. Slack Bus Generation Analysis of 69-Bus Test System
The reactive slack bus generation for all cases is depicted in Figure 15. It is noteworthy that for Case 1, all reactive power is provided by the slack bus. For Case 2, the reactive power generation by the PVGs exceeded the system needs, so the slack bus had to compensate by injecting inductive power into the network, as can be seen in the midday period. The total reactive power supplied in the time horizon, in absolute value, by the slack bus was 34.0422 MVarh, 23.8187 MVarh, 26.2325 MVarh, and 25.6421 MVarh for Cases 1, 2, 3, and 4, respectively.
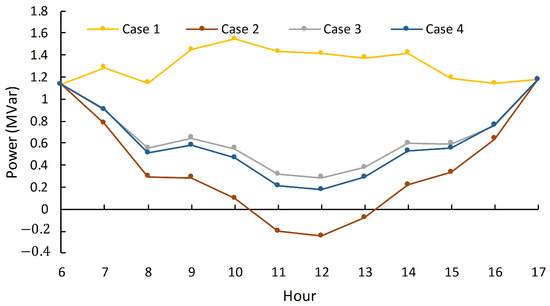
Figure 15.
Reactive slack bus generation of the (69-bus test system).
5.2.3. Reactive Generation of PVGs for the 69-Bus Test System
Figure 16 shows the generation of reactive power by the PVGs for all cases. It can be observed that the inverter supplies reactive power only when the generator operates above 20% of its nominal value, which corresponds to the time interval starting at 7:00 a.m. and ending at 16:00 p.m. As mentioned before, reactive power is obtained using Equation (1). Note that in Case 1, no reactive power is supplied. However, if the inverter is able to supply active and reactive power (Cases 2, 3, and 4) in the locations and quantities mentioned before, the losses are greatly reduced, as can be evidenced in Figure 14.
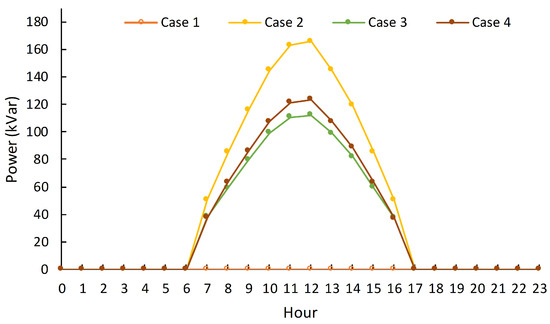
Figure 16.
Reactive power generation of the PVGs (69-bus test system).
5.2.4. Power Factor Control Analysis of the 69-bus Test System
Table 5 shows the suggested power factor values provided by the MOPF considering the PVGs in the 69-bus test system. From 7:00 to 16:00, the is optimized on an hourly basis. Table 6 presents the proposed power factor adjustment contemplating the same considerations of Case 3; however, the values refer to a unique adjustment.

Table 5.
Optimal adjustment of for Case 3 (69-bus test system).

Table 6.
Optimal adjustment of for Case 4 (69-bus test system).
5.2.5. Voltage Profile
The voltage profile at 12:00 is shown in Figure 17 for all cases under study. The graph demonstrates that the introduction of reactives plays a significant role in enhancing the voltage profile. The average voltage magnitude for Cases 1, 2, 3, and 4 was 0.9951 p.u., 0.9968 p.u., 0.9967 p.u., and 0.9968 p.u., respectively.
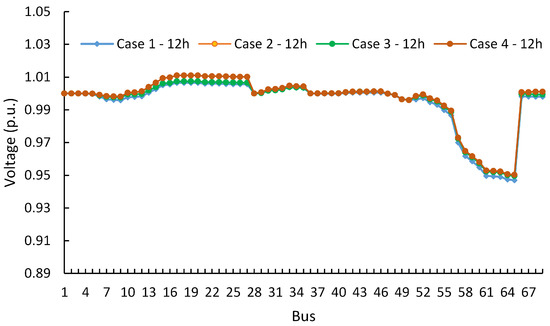
Figure 17.
Voltage profile of the 69-bus test system at 12:00 h.
5.2.6. Mopf Convergence Analysis of the 69-Bus Test System
Figure 18 illustrates the convergence of the algorithm. In this case, the y-axis is presented on a logarithmic scale. Figure 18 combines the objective function on the left side with the mismatches of the constraints on the right side for Case 3 of the 69-bus system. Among all the simulations performed, this was the one in which the algorithm converged with a greater number of iterations, 13 in total. For this case, the computational time spent was 0.219 s.
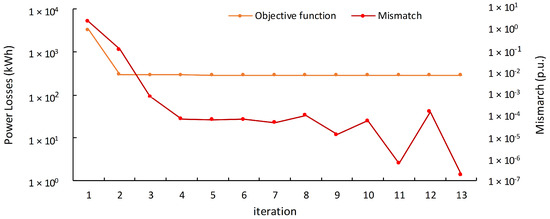
Figure 18.
Convergence for Case 3 (69-bus test system).
6. Conclusions
This paper presented the modeling and application of a MOPF for optimal management of reactive power in DN with high penetration of PVGs. The model was solved using AMPL with the commercial Knitro solver. Various tests were carried out on distribution networks featuring 33 and 69 buses within a 24 h period. It was shown that PVG can provide reactive power, but with limitations, which are considered within the proposed MOPF. Comparative analyses were presented and discussed, considering four scenarios. In Case 1, the is set to 1.0, thereby supplying only active power. In Case 2, the was fixed at 0.9, leading when the nominal power exceeds the limitations imposed by inverter efficiency. In Case 3, the was optimized for each hour, taking into account the efficiency limitations of the inverters. In Case 4, a fixed value for the period is obtained, also considering the inverter efficiency limitations. The proposed MOPF, modeled in AMPL and solved through Knitro, is robust and converges in a few iterations. Furthermore, the solution of the MOPF problem requires low computation time.
One of the advantages of the proposed approach is the fact that it can be applied to both, short and long-term planning of DNs. For short-term planning, the distribution operator can resort to an hour-by-hour adjustment of the ; nonetheless, if there are communication limitations or if long-term planning is envisaged, a single adjustment of the can also be implemented through the proposed methodology.
Finally, future studies may consider clustering algorithms to predict the generation of RES and load data. Furthermore, with the advent of smart grids, the optimal coordination between RES and battery storage systems can be an excellent strategy to improve the performance of DNs.
Author Contributions
Conceptualization, C.A.d.S., A.P. and E.A.B.; Data curation, C.A.d.S. and E.A.B.; Formal analysis, C.A.d.S., A.P., E.A.B., D.J.d.S., P.R., J.M.L.-L. and N.M.-G.; Funding acquisition, J.M.L.-L. and N.M.-G.; Investigation, C.A.d.S., A.P., E.A.B., J.M.L.-L. and N.M.-G.; Methodology, C.A.d.S., A.P. and E.A.B.; Project administration, C.A.d.S., E.A.B. and J.M.L.-L.; Resources, C.A.d.S., D.J.d.S., P.R., E.A.B., J.M.L.-L. and N.M.-G.; Software, C.A.d.S. and E.A.B.; Supervision, C.A.d.S., A.P., E.A.B., J.M.L.-L. and N.M.-G.; Validation, C.A.d.S., A.P. and E.A.B.; Visualization, C.A.d.S., E.A.B. and N.M.-G.; Writing—original draft, C.A.d.S.; Writing—review and editing, C.A.d.S., D.J.d.S., P.R., E.A.B., J.M.L.-L. and N.M.-G. All authors have read and agreed to the published version of the manuscript.
Funding
This research was funded by the Colombia Scientific Program within the framework of the called Ecosistema Científico (Contract No. FP44842-218-2018).
Institutional Review Board Statement
Not applicable.
Informed Consent Statement
Not applicable.
Data Availability Statement
Data is available through authors via e-mail.
Acknowledgments
The authors acknowledge the Brazilian National Council for Scientific and Technological Development (CNPq), grant 408898/2021-6. The authors would also like to thank FAPEMIG-APQ-03609-17, CAPES-Brazil under Grant 001, and INERGE.
Conflicts of Interest
The authors declare no conflict of interest.
Abbreviations
The following abbreviations are used in this manuscript:
| AC | Alternating Current |
| AMPL | A Modeling Language for Mathematical Programming |
| CP | Connection Point |
| CP Power Factor | |
| DC | Direct Current |
| DG | Distributed Generation |
| DN | Distribution Network |
| DNR | Distribution Network Reconfiguration |
| EPRI | Electric Power Research Institute |
| GAMS | General Algebraic Modeling System |
| IEA | International Energy Agency |
| MOPF | Multi-Period Optimal Power Flow |
| OPF | Optimal Power Flow |
| PSO | Particle Swarm Optimization |
| PV | Photovoltaic |
| PVG | Photovoltaic Generation |
| PVI | Photovoltaic Inverter |
| PV Fower Factor | |
| RES | Renewable Energy Sources |
| WG | Wind Generation |
| kW | Kilowatt |
| kWh | Kilowatt-hour |
References
- Asaad, M.; Zamora, R.; Tek Tjin, L. Integration of Electric Vehicles in the Distribution Network: A Review of PV Based Electric Vehicle Modelling. Energies 2020, 13, 4541. [Google Scholar] [CrossRef]
- Lofti, H. Multi-objective energy management approach in distribution grid integrated with energy storage units considering the demand response program. Int. J. Energy Res. 2020, 44, 10662–10681. [Google Scholar] [CrossRef]
- Vainio, A.; Pulkka, A.; Paloniemi, R.; Varho, V.; Tapio, P. Citizens’ sustainable, future-oriented energy behaviours in energy transition. J. Clean. Prod. 2020, 245, 118801. [Google Scholar] [CrossRef]
- IEA. World Energy Outlook 2018. Available online: https://www.iea.org/reports/world-energy-outlook-2018 (accessed on 1 July 2022).
- Purlu, M.; Turbay, B.E. Optimal Allocation of Renewable Distributed Generations Using Heuristic Methods to Minimize Annual Energy Losses and Voltage Deviation Index. IEEE Access 2022, 10, 21455–21474. [Google Scholar] [CrossRef]
- Ridha, H.M.; Gomes, C.; Hizam, H.; Mirjalili, S. Multiple scenarios multi-objective salp swarm optimization for sizing of standalone photovoltaic system. Renew. Energy 2020, 153, 1330–1345. [Google Scholar] [CrossRef]
- Azizivahed, A.; Barani, M.; Razavi, S.-E.; Ghavidel, S.; Li, L.; Zhang, J. Energy storage management strategy in distribution networks utilised by photovoltaic resources. IET Gener. Transm. Distrib. 2018, 12, 5627–5638. [Google Scholar] [CrossRef]
- Benedito, R.S.; Zilles, R.; Pinho, J.T. Overcoming the power factor apparent degradation of loads fed by photovoltaic distributed generators. Renew. Energy 2021, 164, 1364–1375. [Google Scholar] [CrossRef]
- Silva, D.J.; Belati, E.A.; Angelos, E.W.S. FPAES: A Hybrid Approach for the Optimal Placement and Sizing of Reactive Compensation in Distribution Grids. Energies 2020, 13, 6409. [Google Scholar] [CrossRef]
- Arash, A.; Arif, S. Overview of technical specifications for grid-connected photovoltaic systems. Energy Convers. Manag. 2017, 152, 312–327. [Google Scholar] [CrossRef]
- Collins, L.; Ward, J.K. Real and reactive power control of distributed PV inverters for overvoltage prevention and increased renewable generation hosting capacity. Renew. Energy 2015, 81, 464–471. [Google Scholar] [CrossRef]
- Silva, D.J.; Belati, E.A.; López-Lezama, J.M. A Mathematical Programming Approach for the Optimal Operation of Storage Systems, Photovoltaic and Wind Power Generation. Energies 2023, 16, 1269. [Google Scholar] [CrossRef]
- Emarati, M.; Barani, M.; Farahmand, H.; Aghaei, J.; Crespo, P. A two-level over-voltage control strategy in distribution networks with high PV penetration. Int. J. Electr. Power Energy Syst. 2021, 130, 106763. [Google Scholar] [CrossRef]
- Solanki, S.K.; Vaidyanath, R.; Vaidyanath, S. Steady state analysis of high penetration PV on utility distribution feeder. In Proceedings of the PES T&D 2012, Montevideo, Uruguay, 3–5 September 2012. [Google Scholar] [CrossRef]
- Molina-García, A.; Mastromauro, R.A.; García-Sánchez, T.; Pugliese, S.; Liserre, M.; Stasi, S. Reactive Power Flow Control for PV Inverters Voltage Support in LV Distribution Networks. IEEE Trans. Smart Grid 2017, 8, 447–456. [Google Scholar] [CrossRef]
- Kelly, N.; Kaveh, D.; Hashem, N. Loss Minimization for Distributed PV Integration using Particle Swarm Optimization with Volt-Var Control. In Proceedings of the IEEE General Meeting Power & Energy Society, Portland, OR, USA, 5–9 August 2018. [Google Scholar] [CrossRef]
- Selim, A.; Abdel-Akher, M.; Aly, M.M.; Kamel, S. Efficient time series simulation of distribution systems with voltage regulation and PV penetration. In Proceedings of the International Middle East Power Systems Conference, MEPCON, Cairo, Egypt, 27–29 December 2016. [Google Scholar] [CrossRef]
- Vlahinić, S.; Franković, D.; Komen, V.; Antonić, A. Reactive Power Compensation with PV Inverters for System Loss Reduction. Energies 2019, 12, 4062. [Google Scholar] [CrossRef]
- Mehbodniya, A.; Paeizi, A.; Rezaie, M.; Azimian, M.; Masrur, H.; Senjyu, T. Active and Reactive Power Management in the Smart Distribution Network Enriched with Wind Turbines and Photovoltaic Systems. Sustainability 2022, 14, 4273. [Google Scholar] [CrossRef]
- Rossoni, P.; Belati, E.A.; Benedito, R.S. A hybrid approach for optimization of electric power distributed networks with photovoltaic sources. Electr. Power Syst. Res. 2022, 211, 108183. [Google Scholar] [CrossRef]
- Ochoa, L.F.; Harrison, G.P. Minimizing Energy Losses: Optimal Accommodation and Smart Operation of Renewable Distributed Generation. IEEE Trans. Power Syst. 2011, 26, 198–205. [Google Scholar] [CrossRef]
- Farivar, M.; Russell, N.; Christopher, C.; Steven, L. Optimal inverter VAR control in distribution systems with high PV penetration. In Proceedings of the IEEE General Meeting Power & Energy Society, San Diego, CA, USA, 22–26 July 2012. [Google Scholar] [CrossRef]
- Gebbran, D.; Mhanna, S.; Ma, Y.; Chapman, A.C.; Verbič, G. Fair coordination of distributed energy resources with Volt-Var control and PV curtailment. Appl. Energy 2020, 286, 116546. [Google Scholar] [CrossRef]
- Abdelfatah, A.; Karar Mahmoud, M.; David, R.; Matti, L. Probabilistic Approach for Hosting High PV Penetration in Distribution Systems via Optimal Oversized Inverter With Watt-Var Functions. IEEE Syst. J. 2021, 15, 684–693. [Google Scholar] [CrossRef]
- Barrero-González, F.; Fernão Pires, V.; Sousa, J.L.; Martins, J.F.; Milanés-Montero, M.I.; González-Romera, E.; Romero-Cadaval, E. Photovoltaic Power Converter Management in Unbalanced Low Voltage Networks with Ancillary Services Support. Energies 2019, 12, 972. [Google Scholar] [CrossRef]
- Hung, D.Q.; Mithulananthan, N.; Bansal, R.C. Integration of PV and BES units in commercial distribution systems considering energy loss and voltage stability. Appl. Energy 2014, 113, 1162–1170. [Google Scholar] [CrossRef]
- Pourakbari-Kasmaei, M.; Lehtonen, M.; Fotuhi-Firuzabad, M.; Marzband, M.; Mantovani, J.R.S. Optimal power flow problem considering multiple-fuel options and disjoint operating zones: A solver-friendly MINLP model. Int. J. Electric. Power Energy Syst. 2019, 113, 45–55. [Google Scholar] [CrossRef]
- Knitro. User Guide—Artelys Knitro 12.3 User’s Manual. Available online: https://www.artelys.com/docs/knitro/2_userGuide.html (accessed on 11 January 2021).
- Pinho, J.T.; Galdino, M.A. Manual de Engenharia para Sistemas Fotovoltaicos, 2nd ed.; CEPEL-CRESESB: Rio de Janiero, Brazil, 2014; pp. 1–530. [Google Scholar]
- Rampinelli, G.A.; Krenzinger, A.; Romero, F.C.; Marzband, M. Descrição e Análise de Inversores Utilizados em Sistemas Fotovoltaicos. Rev. Cien. Exatas Nat. 2013, 15, 25–50. [Google Scholar] [CrossRef]
- Bakhshi, R.; Sadeh, J. A comprehensive economic analysis method for selecting the PV array structure in grid–connected photovoltaic systems. Renew. Energy 2016, 94, 524–536. [Google Scholar] [CrossRef]
- Kleissl, J. Solar Energy Forecasting and Resource Assessment; Academic Press Publishing House: Cambridge, MA, USA, 2013; pp. 1–416. [Google Scholar]
- Byrd, R.H.; Nocedal, J.; Waltz, R.A.L. KNITRO: An Integrated Package for Nonlinear Optimization. In Large-Scale Nonlinear Optimization. Nonconvex Optimization and Its Applications; Springer Publishing House: Boston, MA, USA, 2006; pp. 35–59. [Google Scholar]
- Baran, M.E.; Wu, F.F. Optimal Capacitor Placement on Rabelodial Distribution Systems. IEEE Trans. Power Deliv. 1989, 4, 725–734. [Google Scholar] [CrossRef]
- Das, D. Optimal placement of capacitors in radial distribution system using a Fuzzy-GA method. IEEE Int. J. Elect. Power Energy Syst. 2008, 30, 361–367. [Google Scholar] [CrossRef]
Disclaimer/Publisher’s Note: The statements, opinions and data contained in all publications are solely those of the individual author(s) and contributor(s) and not of MDPI and/or the editor(s). MDPI and/or the editor(s) disclaim responsibility for any injury to people or property resulting from any ideas, methods, instructions or products referred to in the content. |
© 2023 by the authors. Licensee MDPI, Basel, Switzerland. This article is an open access article distributed under the terms and conditions of the Creative Commons Attribution (CC BY) license (https://creativecommons.org/licenses/by/4.0/).