Article

Heterogeneous Effects of Public Procurement on Environmental Innovation, Evidence from European Companies

1
College of Humanities and Social Sciences, Nanjing University of Aeronautics and Astronautics, Jiangjun Road 29, Jiangning District, Nanjing 211106, China
2
Graduate School of Economics, Kyoto University, Yoshida-Honmachi, Sakyo-Ku, Kyoto 606-8501, Japan
3
College of Economics and Management, Nanjing University of Aeronautics and Astronautics, Jiangjun Road 29, Jiangning District, Nanjing 211106, China
*
Author to whom correspondence should be addressed.
Sustainability 2023, 15(19), 14354; https://doi.org/10.3390/su151914354
Submission received: 31 July 2023 / Revised: 18 September 2023 / Accepted: 26 September 2023 / Published: 28 September 2023

Abstract

:
Although substantial studies have discussed drivers or determinants of eco-innovation including environmental policies, research on relations between public procurement and environmental innovation is rare. This paper applies the propensity score matching (PSM) method to estimate the impact of public procurement on enterprises’ decisions to introduce innovations with environmental benefits, with 2014 Community Innovation Survey (CIS) data collected from firms in 15 European countries. The findings suggest that companies with a public contract are 5.7% more likely to introduce innovations with environmental benefits. Furthermore, this paper estimates the effects perfectly matching the types of eco-innovation, firm size, cooperative partner, nations, and industrial sectors. The firms that provide goods or services to public sectors have a larger possibility to be innovative for recycled waste, water, and material for their own use or sale (by 3.3~4.5%); for reduced energy use and CO2 footprint by end users (3.1~4.2%); for reduced air, water, noise, and soil pollution by end users (5.4~5.7%); for facilitated recycling of the product after use (2.6~3.4%); and for extended life length of the product (2.9~3.4%). The eco-innovation efforts in small (<50 employees) and large (>250 employees) companies are examined to be promoted by public procurement, with the magnitude of 5.0~6.3% and 7.5~10.6%, respectively. This study provides a creative theoretical framework of “dual-impetus” to explain the effect of public procurement on eco-innovation and is one of the first empirical research studies contributing to the discussions of the emerging topic by providing a more nuanced view of the heterogeneous effect of public procurement and companies’ eco-innovation behavior.

1. Introduction

Public procurement (PP) strongly influences the private market. This influence can be substantial, given the overall size and volume of purchasing that moves through government procurement offices. PP accounts for 12% of gross domestic product (GDP) in OECD countries and even reaches 30% in many developing countries [1]. The estimated proportion of PP out of GDP in Europe is also significant: 16% in 2004 [2], 17–18% (around 2155 billion Euro) in 2008 [3], and 19.9% in 2009 [4]. PP accounted for 40% of spending on construction and almost 100% on defense, civil security, and emergency operations. The numbers may be even underestimated, and public procurement as a percentage of GDP in the US, the UK, Italy, and the Netherlands for 2017 and 2018 ranged between 19 and 24%, 13 and 56%, 3 and 10%, and 12 and 38%, respectively [5].
PP has been developed to achieve not only purchasing goals but also horizontal aims including environmental protection and innovation promotion. The European Commission has recognized the synergetic development of eco-innovation and public procurement. The Eco-innovation Action Plan in 2011 confirmed that well-targeted policies, such as PP, could accelerate eco-innovation by creating stronger and more stable demand [6]. Green public procurement can generate dissemination of green technologies and environmental enhancement, and the adoption and fluctuation of this effectiveness are shaped by the quantity and the magnitude of the purchase [7]. However, the effect of PP on eco-innovation remains to be further tested and proved empirically.
The combination of public procurement (PP), environmental protection, and innovation promotion is one essential creation of this research, with both theoretical and practical originalities and significance. Firstly, when implementing PP, the government takes the roles of regulator and customer at the same time, which makes PP policy a “dual-impetus” strategy. There are double rationales of demand-pull and regulatory effect when explaining the effectiveness of PP policy. Theoretically, the government can engage in PP policy more profoundly than other policies, thanks to its unique role as a buyer. Secondly, eco-innovation has “double externalities” of knowledge spillover and decreased environmental impact. That, on the one hand, makes it more difficult for private sectors to invest in eco-innovation than traditional innovations. On the other hand, we can also take it as an advantage to fully release the potential of regulations. Thirdly, based on the Porter Hypothesis, innovation is the key for environmental regulations to be effective on environmental performance in the long term. There are also many articles exploring firstly the effect of regulations on innovative activities or system changes and then the effect of innovation on environmental performance [8,9].
This study examines the impact of public procurement on innovations with environmental benefits in European companies based on the 2014 Community Innovation Survey (CIS) data and propensity score matching (PSM) model. The overall result indicates that companies winning a public contract are 5.7% more likely to achieve environmental benefits via innovations. What is more important is that the taxonomy of eco-innovation is introduced and the heterogeneous effects of PP on them are delineated. Moreover, this study perfectly matches firm size, cooperation partners, nation, and industrial sectors to investigate the differences in effect among company groups. The findings reveal that PP works more easily on innovation with environmental benefits obtained during the consumption and use of goods or services than those obtained within the enterprises. Small and large firms can be stimulated to be environmentally innovative rather than medium-sized companies. This research supports the impact of PP on eco-innovation and verifies the heterogeneity in effect among company groups.

2. Literature Review

The links between environmental regulations and eco-innovation mainly involve: (1) giving the signal to companies on likely resource inefficiencies and potential improvement, (2) enhancing corporate awareness by information gathering, (3) reducing the uncertainty of investment in environmental improvement, (4) providing the pressure that incent innovation [10]. Although technological push and demand pull were the predominant drivers of innovation for the long term, in the field of eco-innovation drivers, regulations constitute the most frequently and commonly reported triggering factor in the literature [11]. The early research on environmental regulations and innovation chiefly represented environmental regulation with pollution abatement expenditure [12,13,14], and later scholars paid attention to the classification of command-and-control (CAC) instruments and market-based instruments. Sánchez and Deza [15] summarized that a clear signal was necessary for CAC instruments to impel eco-innovation, and market-based instruments could boost more incremental innovations and dissemination of existing technologies. Cai and Li [16] discovered that market-based instruments could induce eco-innovation, while CAC instruments could not.
A positive correlation between specific environmental regulations and innovation was found in many studies, such as the environmental management system [17], environmental management and auditing system [18], SO2 and NOx standards [19], subsidies [20], etc. In the meantime, some examinations found no persuasive evidence or even hindering relationships [21,22,23] sustained the distinct environmental innovation modes and explored the heterogeneous effect of different policy tools on different eco-innovation modes. Zhou et al. [24] found a reversed U-shaped relationship between formal environmental regulations and innovation. Liao et al. [25] examined the effect of public surveillance in 30 China provinces and proved its promoting impact on corporate radical eco-innovation, while not on incremental eco-innovation. Radicic and Pugh [26] examined the positive effect of EU R&D programs on innovation inputs, while not on innovation outputs. There is a trend of policy-mix effect on eco-innovation claiming that combined impact is greater than individual impact [27].
If we look into the research scope of PP and innovation, Lichtenberg [28] found that competitive procurement steered private R&D investment, while non-competitive procurement crowded out it. Aschhoff and Sofka [29] compared the innovation impact of four innovation instruments including public procurement with data from 1149 firms in Germany, finding that public procurement had an equally positive effect on innovation with universities and research institutions’ knowledge spillovers. In a working paper by Slavtchev and Wiederhold [30], it was proved that “a shift in the composition of government purchases toward high-tech industries indeed stimulates[ed] privately funded company R&D”. The research of Guerzoni and Raiteri [31] proved empirically that R&D subsidies, tax credits, and innovative public procurement could impact firms’ innovative behavior. Hribernik and Detelj [32] and Saastamoinen et al. [33] suggested that public procurement of innovation (PPI) was an influential factor in innovation development.
As aforementioned, there is a large branch of studies on the impact of public procurement on innovation but rarely with a green or environmental perspective. For the empirical studies, Krieger and Zipperer [34] claim that their paper provides the first direct empirical evidence on the impact of green public procurement on firms’ eco-innovation activities. Ghisetti [35] evaluated the role of innovative public demand in encouraging firms’ greener production choices, and the results outlined the core role of innovative public procurement to achieve decarburization and sustainability. Orsatti et al. [36] proved that GPP could positively predict the generation of green technologies, such as climate change mitigation technologies related to energy, transportation, buildings, and the production and processing of goods, etc., in US Commuting Zones. Stojčić [37] examined four public incentives and two private incentives catalyzing green innovation benefits with CIS data and deduced that procurement policy had a positive effect on the introduction of environmental innovations.
For the qualitative explorations on PP and eco-innovation, Porter and Linde [10] used various cases to explain how environmental regulations improved eco-innovation and then enhanced environmental protection, as well as the economic performance of companies. Deambrogio et al. [38] analyzed the case of purchasing innovative solutions for lighting in school buildings. They provided evidence for improving energy performance with PPI and emphasized pre-procurement actions and performance-based requirements. Morley [39] interviewed the suppliers of the Food for Life program in the UK and found the potential ability of public purchasing strategy to stimulate sustainable changes in the food business. Trindade et al. [40] proposed the “SPP Toolbox”, integrating objectives and practices from GPP, SPP (sustainable public procurement), and PPI, for emergence of socio-technical transitions.
To date, limited evidence has been collected on the positive role of public procurement in exerting green innovation activities [35,41]. The lack of environmental consideration in research on PP and eco-innovation is also supported by Kundu et al.’s [42] review paper. After examining 99 selected English-written articles on the topic of PP and innovation before 2017, they found that green orientation had not been sufficiently incorporated into study purposes on PP and innovation research. This research is one of the earliest empirical studies on the evaluation of public procurement policy on companies’ environmental innovation activities.

3. Theoretical Background

The theoretical foundation of the potential effect of PP on eco-innovation is depicted in Figure 1, which is the theoretical novelty of this research recognizing the double pathways through which PP works on eco-innovation. It is embedded in the theories on drivers of innovation and eco-innovation, involving neoclassical environmental economics, evolutionary economics, Environmental Innovation Theory, Neo-institutional Theory, and Stakeholder Theory. As demonstrated in the upper part of Figure 1, the early discussions on determinants of innovations were dominated, for a long time, by the technology push and market pull [17], especially in the traditional industrial studies. Then, along with the increasing deliberations on neoclassical environmental economics and evolutionary economics [20,43,44], Environmental Innovation Theory was further established by considering regulatory and institutional factors. The two right-pointing arrows in Figure 1 represent the two rationales whereby PP can exert an effect on eco-innovation: demand-pull and regulatory effect, or in other words, buyer-user rationale, and market failure rationale. Environmental Innovation Theory, Neo-institutional Theory, and Stakeholder Theory have different perspectives, but they all back the two rationales.

3.1. Rationale 1: Buyer and User

The public sector is a large-scale customer for companies. From this angle, some scholars discussed the influence of public procurement on innovation with a demand-side approach analysis. Demand can influence innovation in two logics. One is the “incentive effect”, meaning that a larger demand increases the expected profit from innovation. Demand acts as “a multiplier of the increased firm make-up” [45]. The other is the “uncertainty effect”, meaning that the demand is a source of information on market needs which reduces the uncertainty of innovation investment. The former is especially true for process innovation, and the latter works more on product innovation [31,45].
The discussions on the demand-pull approach center on these two basic logics. Saastamoinen [33] stated that procurement contracts can reduce market risk because they improve demand predictability. Aschhoff and Sofka [29] explained that the market risk was reduced for innovative firms since the public purchase was contracted and a certain quantity of sales was guaranteed. Combining the two, Georghiou et al. [46] said demand-side interventions made the return of innovation “sufficiently large and more certain” to propel the innovation. Marron D. [47] agreed with Geroski [48] that it was likely that a procurement policy with clear expressions of demand for services beyond current abilities could stimulate the development of those abilities.
From the perspective of general innovation theory, the demand-pull approach has been long studied from industrial and technological perspectives, together with the technology push factor. However, private-sector demand was much more explored than public-sector demand. As indicated by “arrow #1” of Figure 1, this rationale can be explained with environmental innovation theory and is also in line with the normative pressure of Neo-institutional theory. In the Stakeholder Theory, the governments here act as core influencers as customers, rather than regulators.

3.2. Rationale 2: Market Failure

Based on neoclassical environmental economic theory, double externalities of eco-innovation from knowledge spillover and environmental protection endow the public sector and regulations with crucial roles to deal with market failure problems. The value generated from the environmental innovation investment of a company is appropriated partly by other firms because of knowledge spillover and additionally by the whole society due to decreased environmental impact. As a result, the companies do not have enough required enthusiasm and motivation to improve eco-innovation. Compared with traditional innovation, more regulatory offset is necessary to reach the social equilibrium of the eco-innovation amount. The important role of environmental regulation in eco-innovation promotion is also a lesson from evolutionary economics. Regulation is one facet of the environment where the firms struggle to survive, and it can pose an effect.
Moreover, some scholars explain the public procurement’s effect through “lead in role”, “early adopter”, and impact on the private market. Large sales to public sectors enable innovative firms to achieve cost reductions more quickly. Then, the price would reduce and private demand would be extended. If public demand is large enough and the likelihood of additional private demand is sufficient, suppliers will realize significant economies of scale and be motivated to innovate. Public procurement may also increase the environmental awareness of firms, as well as private purchasers. What is discussed above can enhance the commercialization and diffusion of innovation [29,47].
General innovation theory has not recognized this regulatory effect on eco-innovation development, while Environmental Innovation Theory has. The “regulatory effect” has evolved into drivers of eco-innovation, as important as demand-side and supply-side factors. As indicated by “arrow #2” in Figure 1, this rationale is also embedded in the coercive pressure of the Neo-institutional Theory. From the view of Stakeholder Theory, the government is always a core influencer as a regulator with power.

4. Data and Methodology

This study is based on Community Innovation Survey (CIS) 2014 data from Eurostat [49]. CIS is an enterprise-based survey on their innovation activities in European countries, collecting data via questionnaires under the methodological instructions of the Oslo Innovation Manual [50,51]. The survey is carried out every two years, and the participant nations vary each time. The statistics bureau of each country administers the survey under the coordination of EUROSTAT, and the aim is to provide information on the degree of innovativeness of each sector [52]. It is a large-scale survey covering Europe and offering harmonized data from firms in various countries and sectors, and of various scales. CIS data were widely exploited in academia, and if we search “Community Innovation Survey” with Topic in Web of Science, 528 documents were displayed (searched in September 2023). We find studies applying CIS 2004, 2008, and 2012 data to explore the determinants of eco-innovation [37,53,54,55] and the impact of innovation on firm performance [56]. CIS 2014 collected information for the three years of 2012–2014 [57], and observations of key variables in our examinations can reach over 26 thousand. CIS 2016 and CIS 2018 did not collect data on public contracts and innovation with environmental benefits, as a result of which they cannot be used in this research. Companies in 15 countries answered the 2014 survey: Bulgaria, Czech Republic, Estonia, Greece, Croatia, Cyprus, Latvia, Lithuania, Hungary, Portugal, Romania, Slovakia, Spain, Norway, and Germany.

4.1. Dependent and Independent Variable

The questionnaire has 14 sections, among which the most essential ones for this analysis are sections on public-sector contracts and innovation and innovations with environmental benefits. This section was first included in 2014, because of which panel data analysis cannot be considered in this study. Participation in public procurement (PUBPRO) is measured based on the yes-or-no question “during the three years 2012 to 2014, did your enterprise have any contracts to provide goods or services for domestic public sector organizations or foreign public sector organizations?” (Table 1). The public sector here refers to government-owned organizations and government providers of services such as energy, security, housing, transport, etc. [58].
There exist several synonymous terms for eco-innovation, including green innovation and environmental innovation. For a broader connotation, scholars use sustainable innovation by including social concerns. In the survey, eco-innovation was expressed as “innovation with environmental benefits”, and the following definition was used. According to explicit survey questions, innovations related to recycling fell under the agenda of “circular innovation studies” [59].
“An innovation with environmental benefits is a new or significantly improved product (good or service), process, organizational method or marketing method that creates environmental benefits compared to alternatives. The environmental benefits can be the primary objective of the innovation or a by-product of other objectives. The environmental benefits of an innovation can occur during the production of a good or service, or during its consumption or use by the end user of a product. The end user can be an individual, another enterprise, the Government, etc.”
[58]
When the survey collected data on environmental innovation, a series of binomial sub-questions were adopted (Table 1). Eco-innovation is divided into ten types according to environmental benefits (ECOIMP, six obtained within enterprises and in short ECOIMP-within, four obtained by end users and in short ECOIMP-end), or into four categories of the product, process, organization, and marketing (ECOCAT). If the company answered “yes” to one or more ECOIMP, then it was eco-innovative during 2012–2014 (ECOINNO). The sample and response rate for the main variables of each country are shown in Appendix A.

4.2. Control Variables

Table 2 shows the potential drivers of eco-innovation based on theories and also gives the indicators. For technological push, R&D investment and high-quality human resources are included. The former is represented by the total expenditure on all innovation activities in 2014 (RD, the author deleted 17 observations for which RD > 100, the ratio of turnover). The latter is measured by the percentage of employees in 2014 with a tertiary degree (EMPRD). For organizational capability, we use the information on whether a company possesses procedures for environmental management (ENVMG) and companies’ cooperation (CO) with various actors. The cooperation is classified by actors (CO1, CO2, CO31, CO32, CO4, CO5, CO6, CO7) or countries (COA, COB, COC, COD, COE). For demand and market competition, intellectual property rights data of “application for patents, European utility model, industrial design right or trademark” are included (COMPET). The patent application is commonly regarded as a measurement for innovation, while in this research, it represents information on healthy competition. Companies can capture the returns from their eco-innovation by applying a patent or other property rights so that they are more willing to innovate. The turnovers and employee numbers in 2014 (SIZE1, SIZE2) indicate firm size. The turnovers and number of employees in 2012 and 2014 were questioned in the survey, but only those in 2014 was opened because of confidentiality issues. On the regulation side, the financial fund (FUND) from local, central governments, or the EU is available (FUNLOC, FUNGMT, FUNEU). In addition, we assume the location of the main market of the company also matters (LARMAR).

4.3. Methodologies

The propensity score matching (PSM) method is used that is quasi-experimental with a random assignment nature. This method further estimates the causal treatment effect with a matching approach. P U B P R O i is the treatment indicator equals one if company i has a public contract and zero otherwise. E C O I N N O i ( 1 ) is the potential eco-innovation outcomes for company i when it has a public contract, and E C O I N N O i ( 0 ) is the potential eco-innovation outcome when it has no public contracts.
A T T = E E C O I N N O i ( 1 ) P U B P R O i = 1 E E C O I N N O i ( 0 ) P U B P R O i = 1
P S M   A T T = E E C O I N N O ( 1 ) P U B P R O = 1 ,   P ( x i ) E E C O I N N O ( 0 ) P U B P R O = 0 , P ( x i )
The average treatment effect on the treated group (ATT) is the difference between expected eco-innovation outcomes with and without public contracts for companies who actually participated in a public contract (Equation (1)). To solve the counterfactual problem and selection bias, the matching approach has been utilized to produce a matched control group, based on a set of covariates x i , in which the distribution of covariates is similar to that of the treated group. The propensity score P combines the information of all covariates. The PSM estimator for ATT is the mean difference in eco-innovation outcomes over the common support, appropriately weighted by the propensity score distribution of participants [61,62] (Equation (2)). We chose the Logit model to estimate the propensity score.
The first step for the PSM analysis is the selection of covariates x i to estimate the propensity score P . The data for companies with and without a public contract all come from the same source, the CIS survey questionnaire, which is a backing condition for the PSM analysis. We tested on four Logit regressions with different covariates. As indicated in Table 3, regression (1) includes all general basic variables, in which the prediction rate is 75.6% and the goodness of fit is 0.076. Regression (2) further includes the sub-variables of public financial support and cooperation, where both the prediction rate and goodness of fit are improved. Moreover, regression (3) replaces the unordered categorical variable (employee number, sectors, and nations) with their dummies, which also makes the prediction rate (77.8%) and the model fitness (0.126) better. Based on regression (3), we added the square terms of each variable in regression (4), and the two indices of prediction and fitness almost do not change. What is more, for all square terms except that of largest market, their coefficients are not statistically significant, and the significance of the basic variables stays the same with regression (3). As a result, we do not consider the high power of the covariates.
All reasonable covariates available are considered in this analysis. The first reason is that eliminating one potential variable is much riskier than including an extraneous one. CIA condition for PSM analysis requires sufficient covariates to estimate the propensity score. Omitting important variables would cause bias seriously [63,64]. In contrast, including the nonsignificant variable in the propensity score model will not cause inconsistency in the p-score estimation. The second reason is that our sample is large enough to solve the support problem and variance-increasing problem resulted from the over-parameterized model [65]. Only 63 out of 9764 observations are off support when we include all variables and dummies in the p-score estimation. The standard deviations of p-score with and without insignificant variables are almost the same, approximately equal to 0.16. As a result, all available variables are included in the p-score estimation. Furthermore, based on the correct prediction rate and goodness of fit, we finally decide on the covariates with sub-variables of public financial support (PUBLOC, PUBGMT, PUBEU) and cooperation (CO1-CO7), and dummies for nations, sectors, and firm size.
Several matching algorithms can be used to match the treated individuals with their counterpart from the comparison group. The nearest-neighboring (NN) matching means that “the individual from the comparison group is chosen as a matching partner for a treated individual that is closest in terms of the propensity score” [62]. It is 3NN if three nearest-neighboring matching partners are assigned, and so on. With the concern that even the closest matching partner may be far away from the treated individual for p-score, caliper matching is proposed [62]. Combining these two guarantees, the matching partners are the closest, and they are within a certain distance for p-scores. Chen [66] recommends ( 0.25 s t d . d e v . o f p _ s c o r e ) for the caliper, and we set it at ( 0.1 s t d . d e v . o f p _ s c o r e ) more strictly in this analysis to obtain a higher-quality match. In addition, we also test with kernel matching, where the weighted average of nearly all individuals in the comparison group is used to formulate the counterfactual outcome of treated individuals.

5. Results

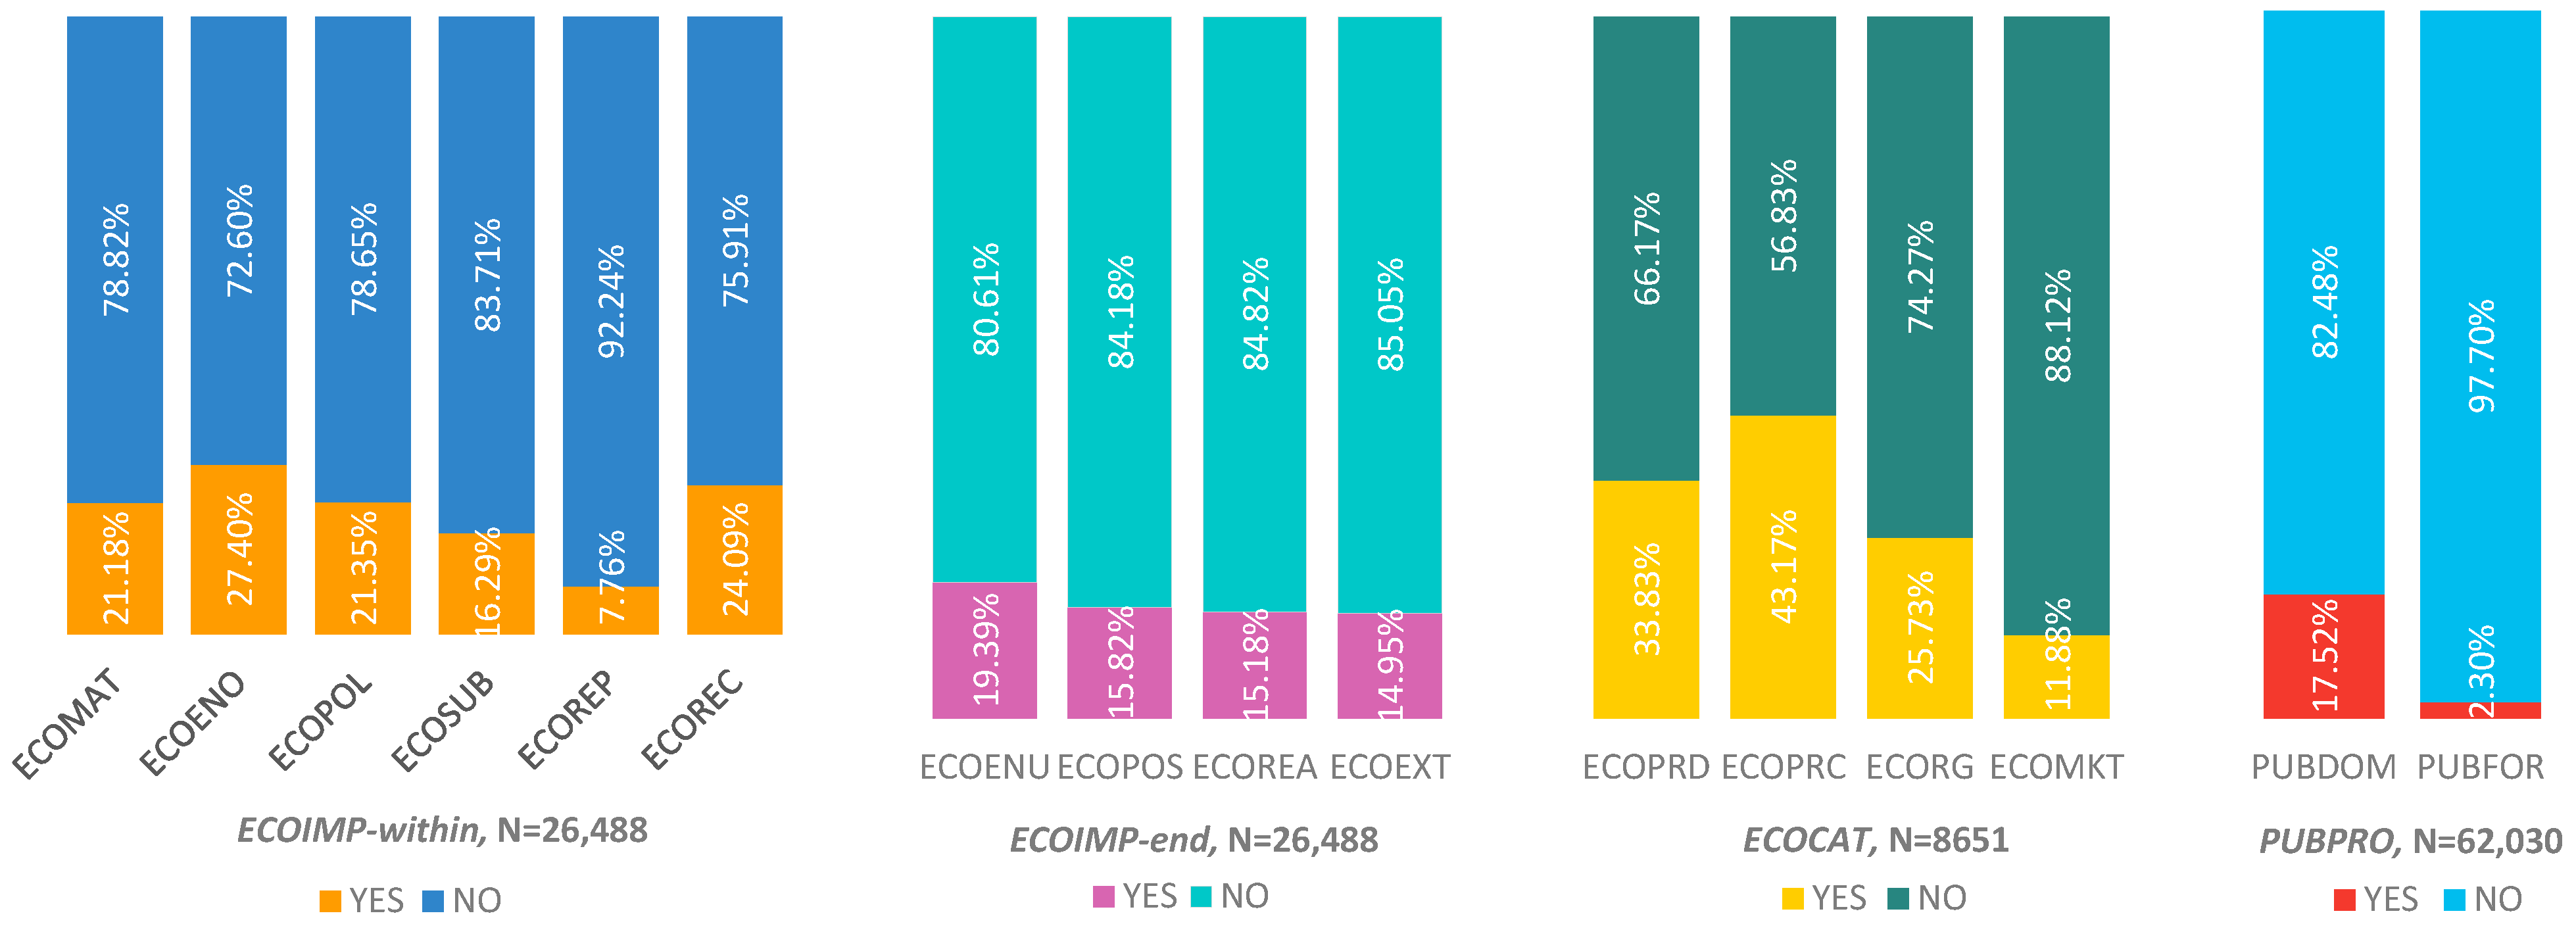
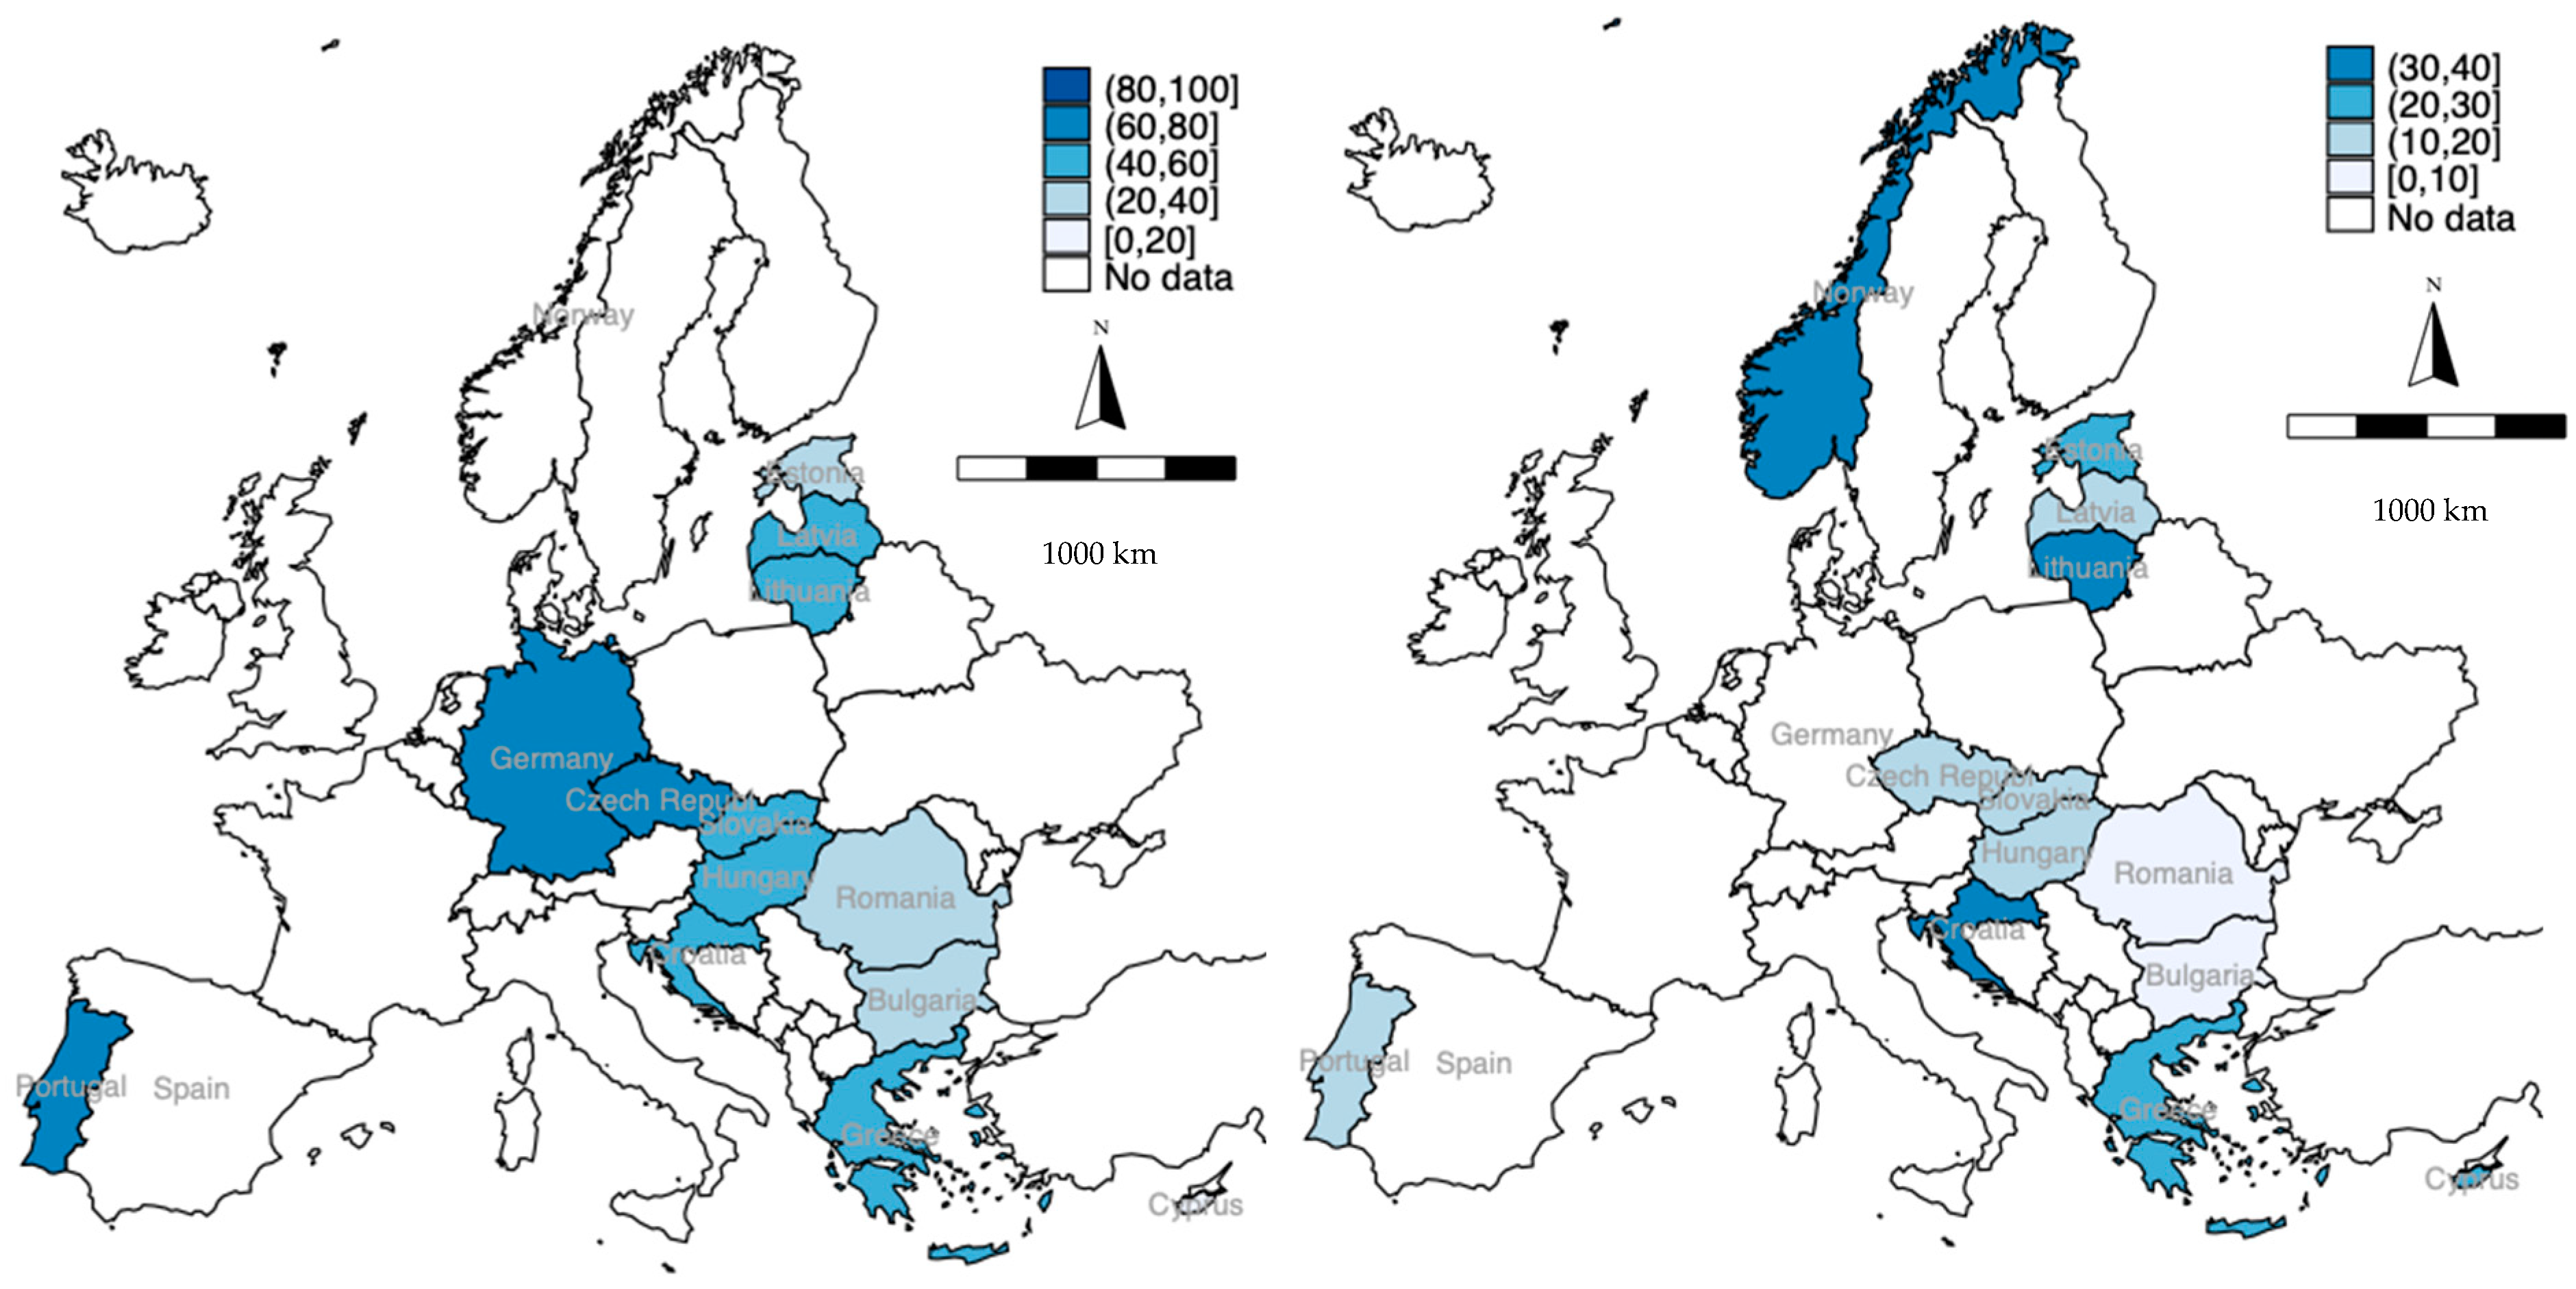
5.1. Descriptive Results

Table 4 displays the basic descriptions for the variables. As demonstrated, about 47% of the enterprises introduced at least one kind of innovation with environmental benefits during 2012–2014, and around 18% of the enterprises had a contract for domestic or foreign public sectors. On average, the firms costed 10% of their total turnovers on innovation activities in 2014, and the average high-quality human resources fell at a 5~9% interval. Approximately 20% of the companies had procedures in place to regularly identify and address environmental challenges. Thirty-six percent of them cooperated with other actors, the most frequently with suppliers and with actors within their country. In addition, the mean employee number is located in the interval of 50~249. About 23% of the enterprises received financial support from public sectors, and the most common sponsors were central governments compared to local governments and the EU. For more preliminary analyses, please refer to Figures S1–S4 of the Supplementary Materials for this paper.
Figure 2 depicts the numbers and percentages of enterprises answering “yes” for each type of eco-innovation and public procurement. Note that 26,488 enterprises responded to innovation with different environmental impacts. The top three adopted innovations were: reduced energy use or carbon dioxide production (ECOENO, 27.4% of the responses), recycled waste, water, or material within the enterprise (ECOREC, 24.1%), and reduced air, water, noise, or soil pollution (ECOPOL, 21.3%). On the contrary, extended product life (ECOEXT, 15.0%) and facilitated recycling of product after use (ECOREA, 15.2%) were the least considered impacts to address with innovation. Furthermore, among the 8651 firms responding to types of environmental innovation, 43.2%, 33.8%, 25.7, and 11.9% reported that the environmental benefits were due to process innovation, product innovation, organizational innovation, and marketing innovation, respectively. There were 62,030 firms that replied on whether they won a public contract, 17.52% of them claimed to provide goods or services to domestic public sectors, and 2.3% to foreign public sectors.
Figure 3 (left) shows innovative enterprises introducing innovation with at least one kind of environmental benefit in each country. Portugal, Germany, and the Czech Republic were the top three countries where innovative firms accounted for the highest proportion out of all companies (above 60%), while, Cyprus, Bulgaria, and Estonia possessed the least three ratios of innovative companies, lower or around 20%. Figure 3 (right) displays companies’ participation in public procurement. The percentage of companies that had a contract to provide goods or services for domestic public sectors ranged from 7.7% to 34.1% in countries, that for foreign public sectors was 0.6~5.7%.

5.2. PSM Results and Discussions

In the PSM analysis, we depict the results for the nearest-neighboring matching, 3NN, 5NN, and kernel matching of all specifications. NN, 3NN, and 5NN are all further constrained by 0.1 std. dev. of the p-score. Table 5 demonstrates that after matching, the average treatment effect to the treated (ATT) for the outcome “innovation with environmental benefits” is positive and significant at a 99% level, ranging from 4.9% to 6.1% in different matching algorithms. Among the ten individual eco-innovation with different environmental benefits, five are estimated to be correlated positively with public procurement: ECOREC (recycled waste, water, or materials for own use or sale, 3.3~4.5%), ECOENU (reduced energy use or CO2 footprint, 3.1~4.2%), ECOPOS (reduced air, water, noise, or soil pollution, 5.4~5.7%), ECOREA (facilitated recycling of product after use, 2.6~3.4%), and ECOEXT (extended product life through longer-lasting, more durable products, 2.9~3.4%). What is more, when enterprises have public contracts, they are more (4.1~5.6%) likely to perceive that their environmental benefits are due to product innovation, amidst the four categories of innovation (product, process, organizational, and marketing).
All four innovations with environmental benefits obtained by the end user are estimated to be positively affected by public procurement, at a 99% level of significance. Moreover, ECOENO and ECOENU are both “reduced energy use or CO2 footprint”, but the former is for that within the enterprises and the latter for that obtained during the consumption or use of a good or service by the end user. There are no persuasive results for ECOENO, while there are significant coefficients for ECOENU. A similar comparison happens between ECOPOL and ECOPOS. It is indicated that public procurement can stimulate companies’ eco-innovation during consumption and end use, more easily than that within the enterprises.
Table 6 displays the PSM results when we match the firm size perfectly. For enterprises that have under 50 or above 250 employees, the average effects on the companies with a public contact are positive and significant (p ≤ 0.01 or p ≤ 0.05) for all matching algorithms. For the small companies (under 50), those providing products or services to public authorities are 5.0~6.3% more likely to be environmentally innovative compared to the matched control group. For the large companies (250 and more), the estimated average effect is 7.5~10.6%. For the medium-sized enterprises, only one-to-one matching statistically supports the effect of public contracts (7.1%, p ≤ 0.05).
The literature has researched the drivers of innovation in small and medium-sized enterprises (SMEs) [22,23] and the SMEs’ innovation performance under PP policy [33,67]. Support and preference for SMEs in economic incentive strategies, such as PP, is regular with an aim of equality and assistance. The sustainable considerations “offer better opportunities to SMEs than to large firms because they have a more adaptable productive structure and major capacity to understand specialized and local markets” [22]. The demand from the government can account for a larger part of SMEs’ order of goods, and they are actively involved in PP [68]. The results of this paper further divided SMEs into small firms and medium-sized firms, and small firms can be encouraged more than the medium-sized group. Large firms also proved to be promoted by PP for innovation with environmental benefits, and the marginal effect is even larger than that on small firms. Large companies have more resources to commercialize the innovation and reap the value produced. They possess greater competitive advantages in tenders than SMEs, especially when the government does not provide preference to SMEs [33].
Table 7 demonstrates the PSM results when we match the cooperation or nation perfectly. Public procurement works on environmental innovation in enterprises cooperating with clients from the private sector (6.4~12.3%, p ≤ 0.05), with partners from the same country (6.4%, p ≤ 0.05, only in NN), and with partners from other European countries (7.1~8.7%, p ≤ 0.05, 3NN, 5NN, and kernel). For the subgroups of nations, merely in Bulgaria, the public contract is estimated to be statistically significantly related to a company’s decisions on eco-innovation (9.7~12.1%, p ≤ 0.01).
Table 8 implies the impact of a public contract on eco-innovation in each industrial sector. In the following five sectors, enterprises having public contracts are more likely to introduce environmental innovation: mining and quarrying (30.0~40.0%), water and waste management (16.4~19.8%), cultural-related activities and information services (7.1~9.7%), financial service activities (16.2%, 25%), and professional, scientific, technical activities, and veterinary (12.9%).

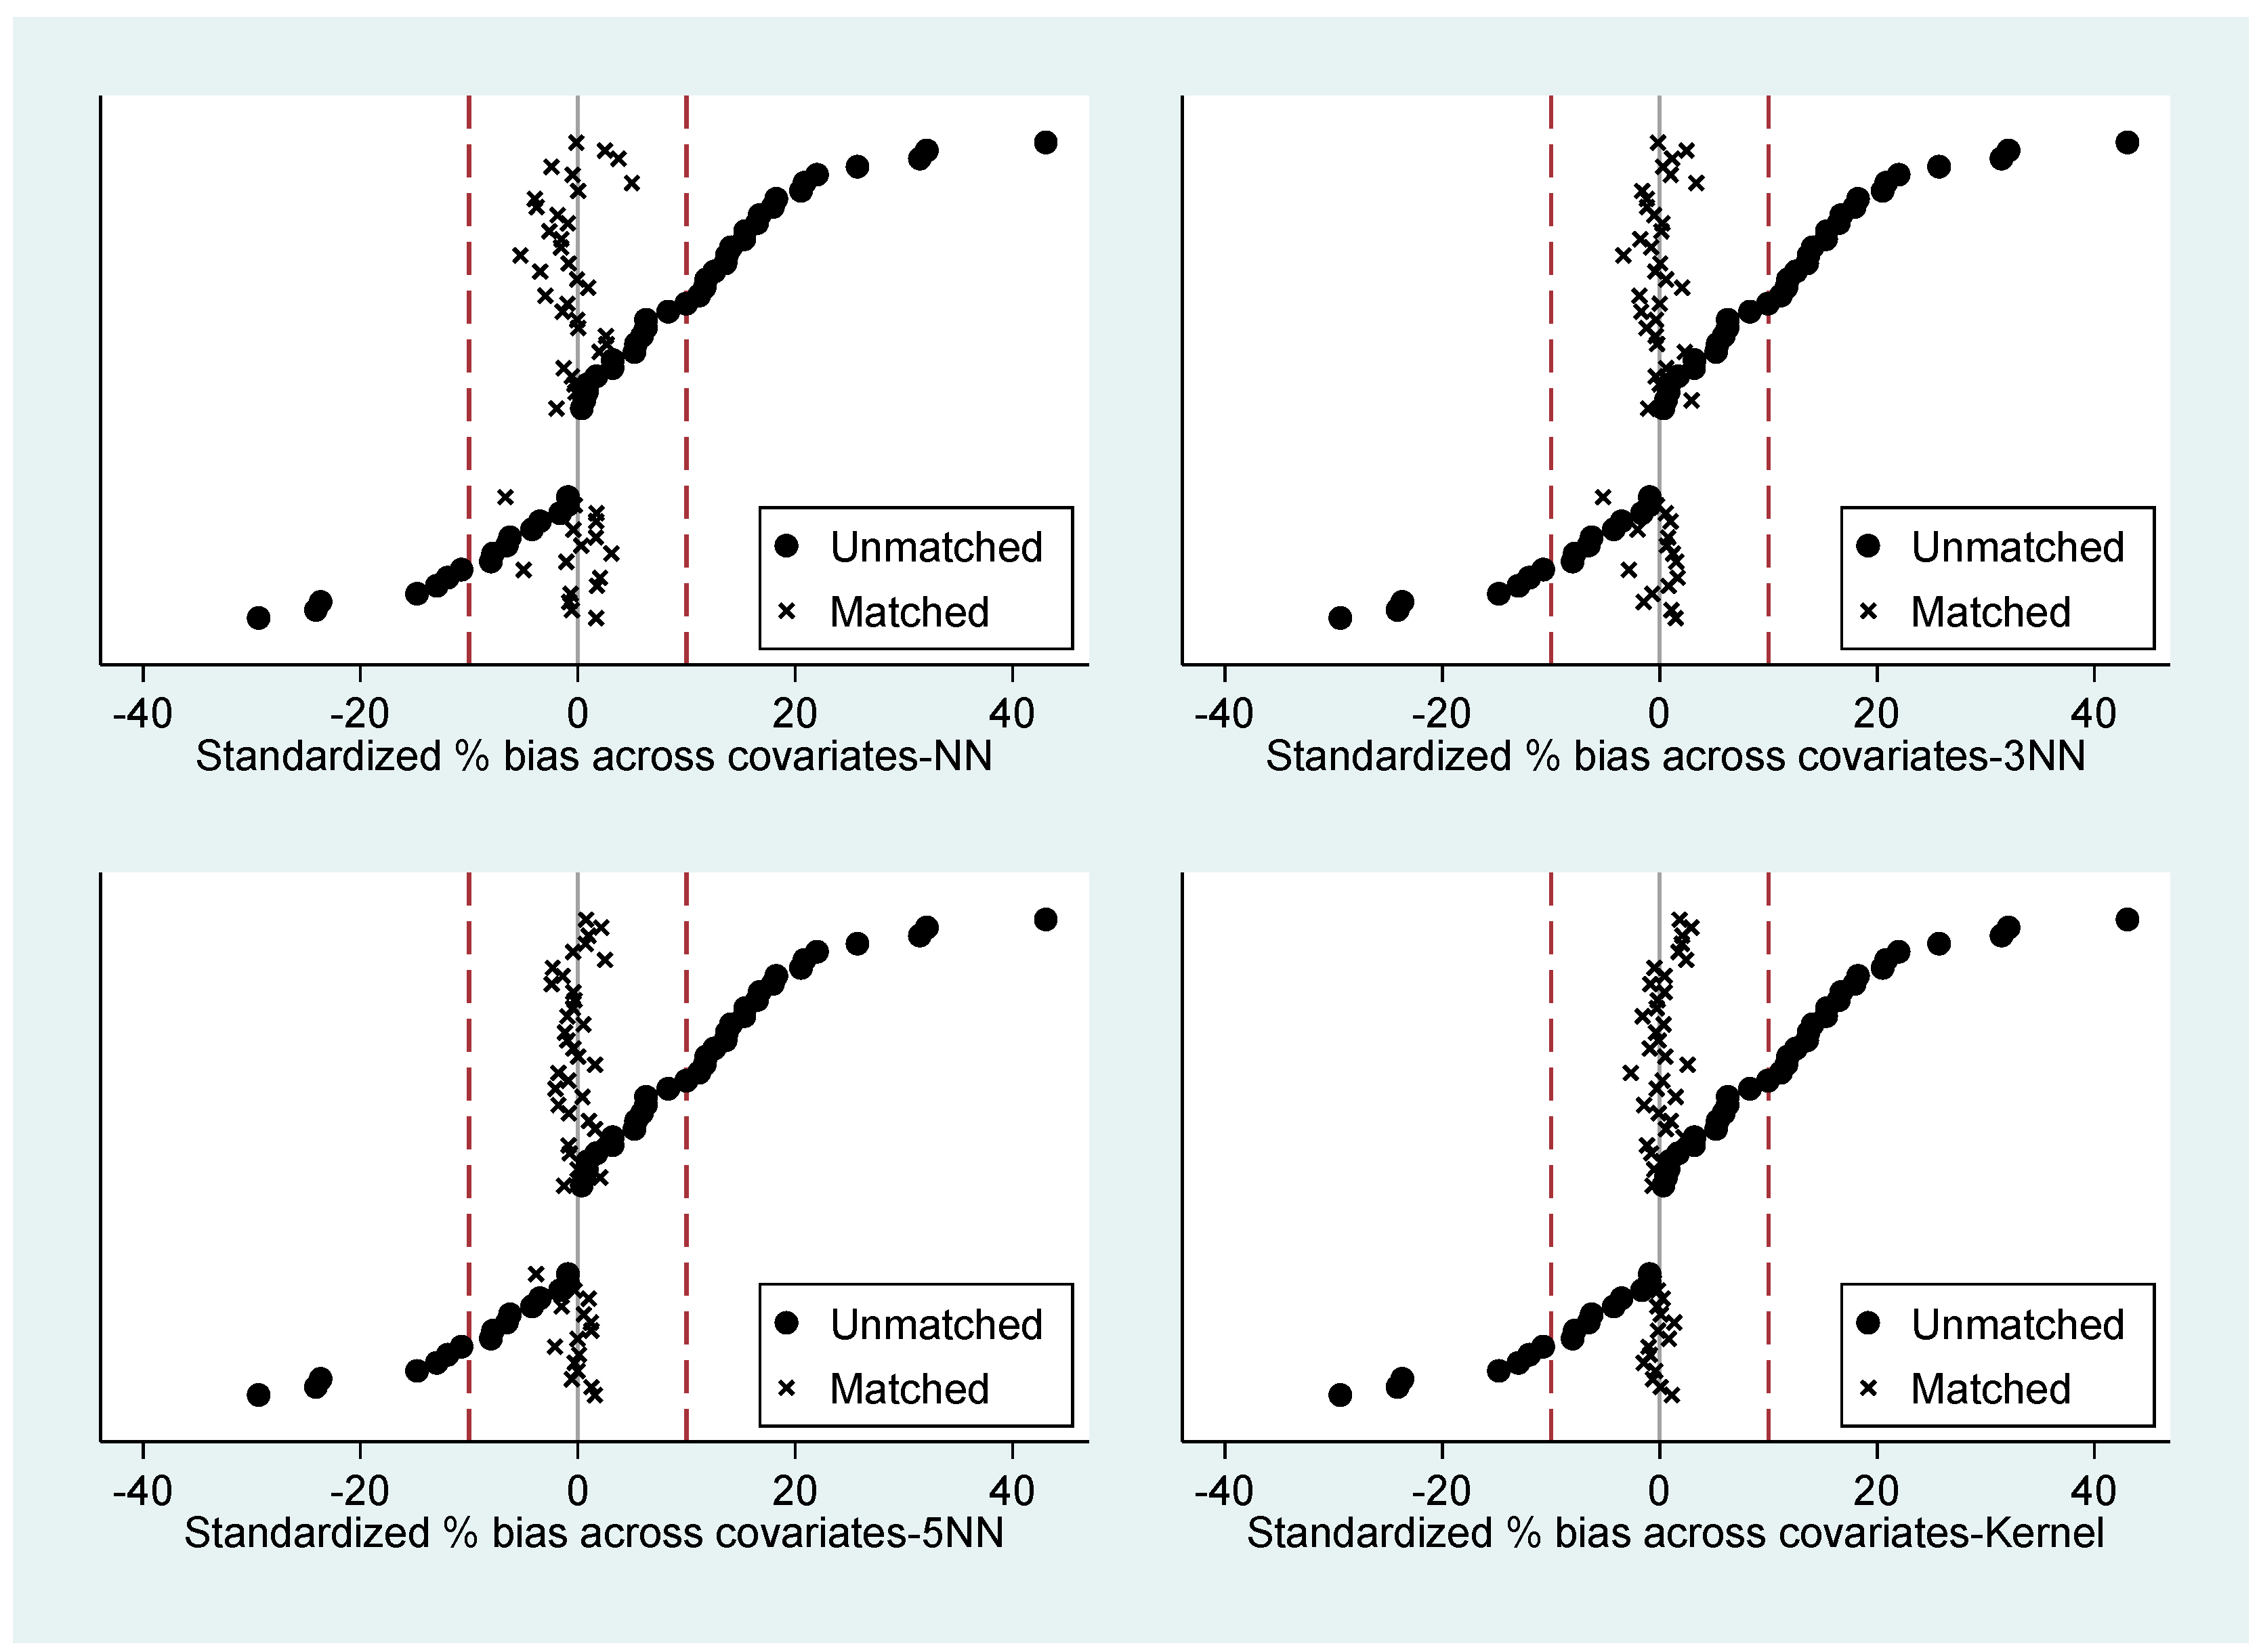
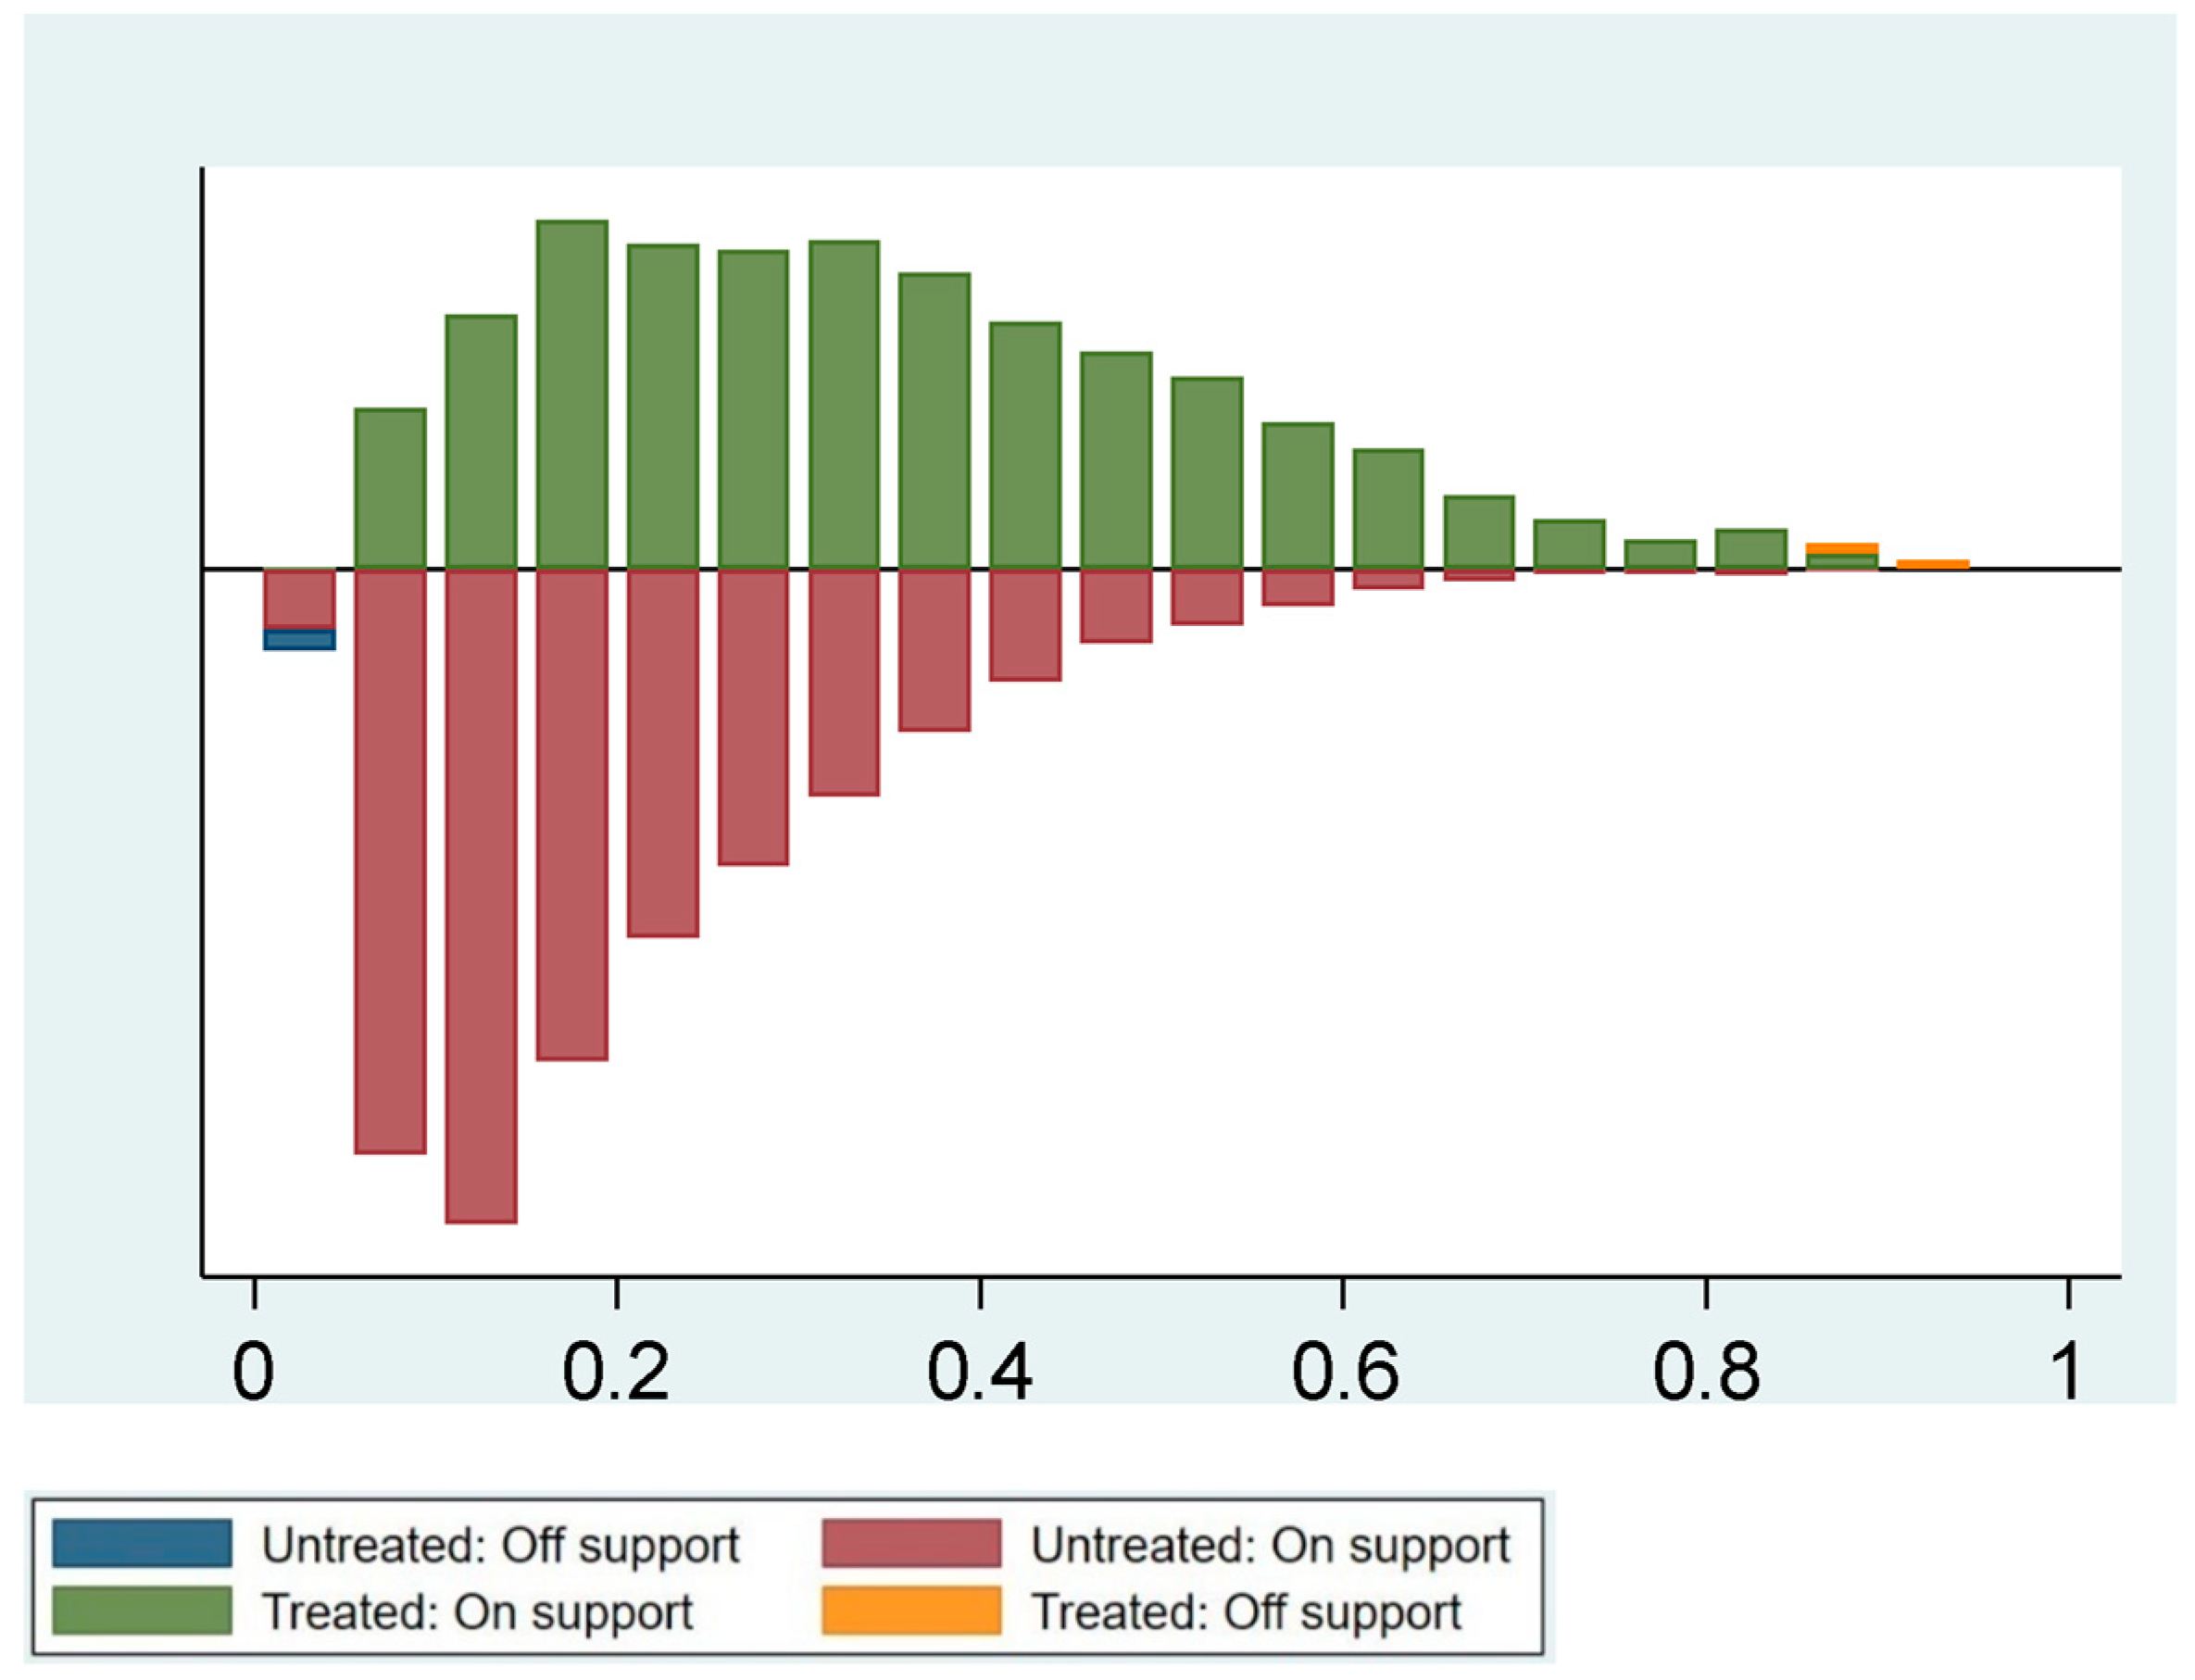
5.3. Specification Tests

Three assumptions or preconditions should be satisfied: Stable Unit Treatment Value Assumption (SUTVA), Conditional Independent Assumption (CIA), and Overlap Assumption. SUTVA means whether a company has a public contract or not, does not depend on another company’s result on the treatment, and we assume it is fulfilled in this research. CIA requires that the distributions of covariates in the treatment and control groups are the same. We calculate the “standardized bias” ( ( x ¯ t r e a t x ¯ c o n t r o l ) / ( s x ,   t r e a t 2 + s x ,   c o n t r o l 2 ) / 2 )) of each covariance before and after matching (Figure 4). After matching, the standardized bias of each covariate decreased to a satisfied degree of less than 10%. All four matching algorithms achieved data balancing between the treated group and the matched control group. Overlap Assumption is the premise for pairing comparison, meaning that propensity score has adequate common support in the treatment and control groups. Figure 5 shows that the p-scores are substantially on support, and there is little loss of observations during the matching process.

6. Conclusions

This paper examines the impact of winning a public contract on innovation with environmental benefits in EU enterprises, using CIS 2014 survey data and the PSM model. The findings suggest that the companies who have won public contracts are 5.7% more likely to bring in innovations with environmental benefits than their counterparts.
The “dual-impetus” framework to interpret PP’s positive influence on eco-innovation is creatively constructed in this paper. One rationale is “regulatory effect” by Environmental Innovation Theory, or government as regulator by Stakeholder Theory, or “coercive pressure” to firms by Neo-institutional Theory. This rationale is commonly possessed by innovation policies. The other rationale is “demand pull” by Environmental Innovation Theory, or government as customer by Stakeholder Theory, or “normative pressure” to firms by Neo-institutional Theory. This rationale is distinct and unique for PP, granting it additional potential to achieve policy goals compared to other environmental regulations. The customer is core stakeholder for private companies; public customer is not different in this respect. Government expenditure reaches almost 20% of GDP in EU, and the public contracts are usually of large volume and value. Furthermore, the governments can lead in their role and open the early market. Theoretically, public procurement takes the advantage from extra demand effect over other innovation policy and shall be investigated in depth. In this sense, the potential of PP to promote innovative or eco-innovative activities has been underestimated.
As the results display, the effect of PP on innovations with different environmental benefits varies. Compared with eco-innovation that occurred within the enterprises, it is easier for PP to stimulate firms’ eco-innovations during the consumption and use of goods or services by the end user. What is more, environmental innovations in recycling both within the companies and by end users are evaluated to be promoted by public contracts. In detail, PP is tested to be effective on innovations of five environmental benefits: recycled waste, water, and materials for own use or sale (firms with a public contract are 3.3~4.5% more likely to achieve that than firms without a public contract); reduced energy use and CO2 footprint by end users (3.1~4.2%); reduced air, water, noise, and soil pollution by end users (5.4~5.7%); facilitated recycle of the product after use (2.6~3.4%); and extended life length of the product (2.9~3.4%). The underlying reason for the positive effect on recycling and on the environmental activities of end users may be that the corresponding green criteria could be employed more readily in the technical specifications, selection criteria, award criteria, and contract performance clauses in a procurement project. When examining the award criteria documents in the EU, the most frequently occurring green words relate to air pollution, waste water, recycle, reuse, repair, and the warranty of the targets [69]. Except for the PPI, green criteria embraced along the procedures of GPP is the main mechanism of the effect and the key to its success [70]. The inclusion of green criteria, their measurability and evaluability could be the priorities to maintain and enhance the policy effect.
This study also analyzes the subgroups by firm size, cooperation, nation, and industrial sector. The results demonstrate that PP impels small and large enterprises to make eco-innovation decisions, of the magnitude of 5.0~6.3% and 7.5~10.6%, respectively, while it does not obviously work on medium-sized ones. Small firms have more adaptable structures and preferential treatment in PP policy. Large companies possess larger competitive abilities and R&D capabilities to win the public tenders. The results from Krieger and Zipperer [34] were not exactly the same, where the effect was statistically significant for SMEs while not for large companies. SMEs attracted much attention with respect to understanding eco-innovation development. Government support such as financial subsidies, technical assistance, skill training, information access, and bank credit systems have a positive impact on green innovation [71]. The incentives of public funding and grants are tested to be drivers of SMEs’ eco-innovation [72,73]. One pathway of public procurement promoting eco-innovation is demand or consumption, which can be deemed as an economic incentive. This research proposes to incorporate PP or GPP into the regulatory drivers of green innovation in SMEs.
Moreover, in cooperation, firms collaborating with customers from private sectors, and with partners from other European countries, are proved to be eco-innovatively stimulated by PP, eco-innovation increased by 6.4~12.3% and 7.1~8.7%, separately. For the subsample of each nation, enterprises in Bulgaria are tested to be promoted by PP with the significant coefficients during 9.7~12.1%. Lastly, in the sectors, PP plays an important role in driving eco-innovation for firms in sectors of mining and quarrying (30.0~40.0%), water treatment, and waste management (16.4~19.8%), financial service activities (16.2%, 25%), information and communication (7.1~9.7%), and professional, scientific, and technical services (12.9%). These heterogeneous analyses contribute to further learning on the policy mix for eco-innovation. For instance, sectors where PP could hardly function would need other policy instruments to fill the gaps.
Several topics deserve further exploration. The results from subsamples should be further explained in the future. Why does Bulgaria stand out for the effectiveness of its PP policy? Whether it is caused by methodological issues or by differences in the policy or its socio-economic background? Regarding the recognized important sectors in GPP policy, such as construction, food, and transportation, their estimations do not show a significant influence. This dilemma and inconsistency need further investigation.

Supplementary Materials

The following supporting information can be downloaded at: https://www.mdpi.com/article/10.3390/su151914354/s1, Figure S1. The importance of various factors to drive environmental innovation for firms; Figure S2. Enterprises with eco-innovation and public contract participation, 2012–2014; Figure S3. The enterprises introducing at least one kind of innovation for environmental benefits by country, 2012–2014; Figure S4. The enterprises having contracts for domestic or foreign public sectors by country, 2012–2014.

Author Contributions

C.Y. (Data curation, Writing, Software, Conceptualization, Methodology, Visualization, Original draft preparation); T.M. (Supervision, Investigation, Validation, Writing—Reviewing and Editing); Q.W. (Validation, Writing—Reviewing and Editing). All authors agreed with the content, gave explicit consent to submit, and obtained consent from the responsible authorities at the organization where the work has been carried out. All authors have read and agreed to the published version of the manuscript.

Funding

This work was supported by Jiangsu Provincial Social Science Fundation of China (江苏省社会科学基金项目研究成果) (1010-RIC22005), and the China Scholarship Council (201806100200).

Institutional Review Board Statement

Not applicable.

Informed Consent Statement

Not applicable.

Data Availability Statement

Not applicable.

Acknowledgments

The anonymous data of the Community Innovation Survey (CIS) 2014 used in the analysis of this paper were provided by EUROSTAT. All results and conclusions are given by the authors and represent their opinion and not those of EUROSTAT, the European Commission, or any of the national authorities whose data have been used.

Conflicts of Interest

The authors declare no conflict of interest.

Appendix A. Samples and Response Rates for Main Variables by Country

Table A1 shows the sample size and response rates by countries, for public contracts (PUBPRO), for eco-innovation of different environmental benefits (ECIIMP), and for categories of eco-innovation (ECOCAT). In all, there were 98,809 observations (questionnaires) collected. Spain and Bulgaria collected answers from most companies. However, Spain did not survey innovation with environmental benefits and public-sector procurements. In addition, the data for ECOCAT were missing in the Czech Republic, Germany, Spain, and Norway. Germany also ignored the public procurement data in its survey. Taking those countries into consideration, the response rate for PUBPRO, ECOIMP, and ECOCAT are 63%, 26.81%, and 8.76%, respectively.
Table A1. Samples and response rates for main variables by country.
CountryObs.Res.
PUBPRO
Res. (%)Res. ECOIMPRes. (%)Res. ECOCATRes. (%)
Bulgaria (BG)14,25514,255100372526.137595.32
Cyprus (CY)13461346100134610021515.97
Czech Republic (CZ)51985198100236445.48----
Germany (DE)6282----482776.84----
Estonia (EE)1760166695163392.7834519.60
Greece (EL)25072507100145658.0880231.99
Spain (ES)30,333------------
Croatia (HR)32653265100133240.8068721.04
Hungary (HU)68176817100201229.5182312.07
Lithuania (LT)24212421100129753.57129753.57
Latvia (LV)150114379650433.5824416.26
Norway (NO)50455045100--------
Portugal (PT)70837083100416758.83273438.60
Romania (RO)82068200100107913.154054.94
Slovakia (SK)2790279010074626.7434012.19
Total98,80962,0306326,48826.8186518.76
Source: authors’ elaboration. “Res.” is the number of responded questionnaires. “Res. (%)” is the response rate. “--” means the data for the corresponding nation is missing.

Appendix B. Sector and Main Activities Code

Table A2. Sector and main activities code, based on “NACE” (“NACE” is the statistical classification of economic activities used in the European Community. The sector and activity code in this paper are established based on the NACE code) of CIS data.
CodeNACEMain ActivitiesCodeNACEMain Activities
11–3Agriculture, forestry, and fishing25–9Mining and quarrying
310–12Manufacture of food products, beverages, and tobacco products413–15Manufacture of textiles, wearing apparel, leather, and related products
516–17Manufacture of wood and of products of wood and cork (except furniture), articles of straw and plaiting materials, paper and paper products618Printing and reproduction of recorded media
719–21Manufacture of coke and refined petroleum products, chemicals and chemical products, and basic pharmaceutical products and pharmaceutical preparations822–23Manufacture of rubber and plastic products and other non-metallic mineral products
924–25Manufacture of basic metals and fabricated metal products (except machinery and equipment)1026–28Manufacture of computer, electronic and optical products, electrical equipment, machinery, and equipment
1129–30Manufacture of motor vehicles, trailers and semi-trailers, and other transport equipment1231–32Manufacture of furniture and other manufacturing
1333Repair and installation of machinery and equipment1435Electricity, gas, steam, and air conditioning supply
1536–39Water supply; sewerage; waste management and remediation activities1641–43Construction of buildings, civil engineering, and specialized construction activities
1745–47Wholesale and retail trade; repair of motor vehicles and motorcycles1849–51Land transport and transport via pipelines, Water transport, and air transport
1952–53Warehousing and support activities for transportation and postal and courier activities2055–56Accommodation, food and beverage service activities
2158–63Information and communication (Activities on publishing, motion picture, video and television program production, sound recording and music publishing, programming and broadcasting, telecommunications, computer programming, consultancy, and related activities and information service)2577–82Administrative and support service activities (Activities on rental and leasing, employment, travel agency, tour operator and other reservation services, security and investigation, services to buildings and landscape, office administrative, office support, and other business support)
2264–66Financial and insurance activities (Financial service activities (except insurance and pension funding), insurance, reinsurance and pension funding (except compulsory social security), and activities auxiliary to financial services and insurance)2685–88Education, human health activities, residential care, social work activities without accommodation
2368Real estate activities
2469–75Professional, scientific and technical activities (Activities on legal and accounting, of head offices; management consultancy, architectural and engineering, technical testing and analysis, scientific research and development, advertising and market research, other professional, scientific, and technical activities, and veterinary)2790–93Arts, entertainment, and recreation (creative activities, arts and entertainment, libraries, archives, museums, and other cultural affairs, gambling and betting, sports and amusement and recreation)
Source: authors’ elaboration, [74].

References

  1. UNEP. Metadata for Indicator 12.7.1: Degree of Sustainable Public Procurement Policies and Action Plan Implementation. 2020. Available online: https://unstats.un.org/sdgs/metadata/files/Metadata-12-07-01.pdf (accessed on 5 January 2021).
  2. European Commission. Buying Green! A Handbook of Green Public Procurement. 2004. Available online: https://ec.europa.eu/environment/archives/gpp/buying_green_handbook_en.pdf (accessed on 5 January 2021).
  3. Monti, M. A New Strategy for the Single Market at the Service of Europe’s Economy and Society; Report to the President of the European Commission José Manuel Barroso; European Commission: Brussels, Belgium, 2010; 9p. [Google Scholar]
  4. European Commission. COM (2011) 815, Annual Growth Survey 2012. Available online: https://ec.europa.eu/transparency/regdoc/rep/1/2011/EN/1-2011-815-EN-F1-1-ANNEX-1.PDF (accessed on 1 December 2020).
  5. Hafsa, F.; Darnall, N.; Bretschneider, S. Estimating the true size of public procurement to assess sustainability impact. Sustainability 2021, 13, 1448. [Google Scholar] [CrossRef]
  6. European Commission. COM (2011) 899, Innovation for A Sustainable Future—The Eco-Innovation Action Plan (Eco-AP). Available online: https://eur-lex.europa.eu/legal-content/EN/TXT/PDF/?uri=CELEX:52011DC0899&from=EN (accessed on 15 January 2022).
  7. Lăzăroiu, G.; Ionescu, L.; Uţă, C.; Hurloiu, I.; Andronie, M.; Dijmarescu, I. Environmentally responsible behavior and sustainability policy adoption in green public procurement. Sustainability 2020, 12, 2110. [Google Scholar] [CrossRef]
  8. Abu Seman, N.A.; Govindan, K.; Mardani, A.; Zakuan, N.; Mat Saman, M.Z.; Hooker, R.E.; Ozkul, S. The mediating effect of green innovation on the relationship between green supply chain management and environmental performance. J. Clean. Prod. 2019, 229, 115–127. [Google Scholar] [CrossRef]
  9. Wang, M.; He, Y.; Zhou, J.; Ren, K. Evaluating the Effect of Chinese Environmental Regulation on Corporate Sustainability Performance: The Mediating Role of Green Technology Innovation. Int. J. Environ. Res. Public Health 2022, 19, 6882. [Google Scholar] [CrossRef] [PubMed]
  10. Porter, M.E.; van der Linde, C. Toward a New Conception of the Environment-Competitiveness Relationship. J. Econ. Perspect. 1995, 9, 97–118. [Google Scholar] [CrossRef]
  11. Hojnik, J.; Ruzzier, M. What drives eco-innovation? A review of an emerging literature. Environ. Innov. Soc. Transit. 2016, 19, 31–41. [Google Scholar] [CrossRef]
  12. Jaffe, A.B.; Palmer, K. Environmental Regulation and Innovation: A Panel Data Study. Rev. Econ. Stat. 1997, 79, 610–619. [Google Scholar] [CrossRef]
  13. Brunnermeier, S.B.; Cohen, M.A. Determinants of environmental innovation in US manufacturing industries. J. Environ. Econ. Manag. 2003, 45, 278–293. [Google Scholar] [CrossRef]
  14. Kneller, R.; Manderson, E. Environmental regulations and innovation activity in UK manufacturing industries. Resour. Energy Econ. 2012, 34, 211–235. [Google Scholar] [CrossRef]
  15. Sánchez, Á.P.; Deza, X.V. Environmental Policy Instruments and Eco-innovation: An Overview of Recent Studies. Innovar 2015, 25, 65–80. [Google Scholar] [CrossRef]
  16. Cai, W.; Li, G. The drivers of eco-innovation and its impact on performance: Evidence from China. J. Clean. Prod. 2018, 176, 110–118. [Google Scholar] [CrossRef]
  17. Rehfeld, K.-M.; Rennings, K.; Ziegler, A. Integrated product policy and environmental product innovations: An empirical analysis. Ecol. Econ. 2007, 61, 91–100. [Google Scholar] [CrossRef]
  18. Rennings, K.; Ziegler, A.; Ankele, K.; Hoffmann, E. The influence of different characteristics of the EU environmental management and auditing scheme on technical environmental innovations and economic performance. Ecol. Econ. 2005, 57, 45–59. [Google Scholar] [CrossRef]
  19. Popp, D. International innovation and diffusion of air pollution control technologies: The effects of NOX and SO2 regulation in the US, Japan, and Germany. J. Environ. Econ. Manag. 2006, 51, 46–71. [Google Scholar] [CrossRef]
  20. Horbach, J. Determinants of environmental innovation—New evidence from German panel data sources. Res. Policy 2008, 37, 163–173. [Google Scholar] [CrossRef]
  21. Blind, K. The influence of regulations on innovation: A quantitative assessment for OECD countries. Res. Policy 2012, 41, 391–400. [Google Scholar] [CrossRef]
  22. Cuerva, M.C.; Triguero-Cano, Á.; Córcoles, D. Drivers of green and non-green innovation: Empirical evidence in Low-Tech SMEs. J. Clean. Prod. 2014, 68, 104–113. [Google Scholar] [CrossRef]
  23. Triguero, A.; Moreno-Mondéjar, L.; Davia, M.A. Drivers of different types of eco-innovation in European SMEs. Ecol. Econ. 2013, 92, 25–33. [Google Scholar] [CrossRef]
  24. Zhou, Q.; Song, Y.; Wan, N.; Zhang, X. Non-linear effects of environmental regulation and innovation—Spatial interaction evidence from the Yangtze River Delta in China. Environ. Sci. Policy 2020, 114, 263–274. [Google Scholar] [CrossRef]
  25. Liao, Z.; Weng, C.; Shen, C. Can public surveillance promote corporate environmental innovation? The mediating role of environmental law enforcement. Sustain. Dev. 2020, 28, 1519–1527. [Google Scholar] [CrossRef]
  26. Radicic, D.; Pugh, G. R&D Programmes, Policy Mix, and the ‘European Paradox’: Evidence from European SMEs. Sci. Public Policy 2017, 44, 497–512. [Google Scholar] [CrossRef]
  27. Greco, M.; Germani, F.; Grimaldi, M.; Radicic, D. Policy Mix or Policy Mess? Effects of Cross-Instrumental Policy Mix on Eco-Innovation in German Firms. Technovation 2022, 117, 102194. [Google Scholar] [CrossRef]
  28. Lichtenberg, R.F. The private R&D investment response to federal design and technical competitions. Am. Econ. Rev. 1988, 78, 550–559. [Google Scholar]
  29. Aschhoff, B.; Sofka, W. Innovation on demand-Can public procurement drive market success of innovations? Res. Policy 2009, 38, 1235–1247. [Google Scholar] [CrossRef]
  30. Slavtchev, V.; Wiederhold, S. The Impact of Government Procurement Composition on Private R&D Activities; Jena Economic Research Papers 2011–036; Friedrich Schiller University Jena and Max Planck Institute of Economics: Jena, Germany, 2011. [Google Scholar]
  31. Guerzoni, M.; Raiteri, E. Demand-side vs. supply-side technology policies: Hidden treatment and new empirical evidence on the policy mix. Res. Policy 2015, 44, 726–747. [Google Scholar] [CrossRef]
  32. Markovic-Hribernik, T.; Detelj, K. Simulation of public procurement’s impact on innovativeness of EU countries. Int. J. Simul. Model. 2016, 15, 249–261. [Google Scholar] [CrossRef]
  33. Saastamoinen, J.; Reijonen, H.; Tammi, T. Should SMEs pursue public procurement to improve innovative performance? Technovation 2018, 69, 2–14. [Google Scholar] [CrossRef]
  34. Krieger, B.; Zipperer, V. Does green public procurement trigger environmental innovations? Res. Policy 2022, 51, 104516. [Google Scholar] [CrossRef]
  35. Ghisetti, C. Demand-pull and environmental innovations: Estimating the effects of innovative public procurement. Technol. Forecast. Soc. Chang. 2017, 125, 178–187. [Google Scholar] [CrossRef]
  36. Orsatti, G.; Perruchas, F.; Consoli, D.; Quatraro, F. Public Procurement, Local Labor Markets and Green Technological Change. Evidence from US Commuting Zones. Environ. Resour. Econ. 2020, 75, 711–739. [Google Scholar] [CrossRef]
  37. Stojčić, N. Social and private outcomes of green innovation incentives in European advancing economies. Technovation 2021, 104, 102270. [Google Scholar] [CrossRef]
  38. Deambrogio, E.; Allegretti, S.; Turi, P.; Zuccarello, F.; Lariccia, P.; Aghemo, C.; Pellegrino, A. Increase Sustainability in Buildings Through Public Procurements: The PROLITE project for Lighting Retrofit in Schools. Energy Procedia 2017, 111, 328–337. [Google Scholar] [CrossRef]
  39. Morley, A. Procuring for change: An exploration of the innovation potential of sustainable food procurement. J. Clean. Prod. 2020, 279, 123410. [Google Scholar] [CrossRef]
  40. Trindade, P.C.; Antunes, P.; Partidário, P. SPP Toolbox: Supporting Sustainable Public Procurement in the Context of Socio-Technical Transitions. Sustainability 2018, 10, 67. [Google Scholar] [CrossRef]
  41. Crespi, F.; Guarascio, D. The demand-pull effect of public procurement on innovation and industrial renewal. Ind. Corp. Chang. 2019, 28, 793–815. [Google Scholar] [CrossRef]
  42. Kundu, O.; James, A.D.; Rigby, J. Public procurement and innovation: A systematic literature review. Sci. Public Policy 2020, 47, 490–502. [Google Scholar] [CrossRef]
  43. Rennings, K. Towards a Theory and Policy of Eco-Innovation-Neoclassical and (Co-)Evolutionary Perspectives; ZEW Discussion Papers No. 98-24; Zentrum für Europäische Wirtschaftsforschung (ZEW): Mannheim, Germany, 1998. [Google Scholar]
  44. Rennings, K. Redefining innovation—Eco-innovation research and the contribution from ecological economics. Ecol. Econ. 2000, 32, 319–332. [Google Scholar] [CrossRef]
  45. Fontana, R.; Guerzoni, M. Incentives and uncertainty: An empirical analysis of the impact of demand on innovation. Camb. J. Econ. 2008, 32, 927–946. [Google Scholar] [CrossRef]
  46. Georghiou, L.; Edler, J.; Uyarra, E.; Yeow, J. Policy instruments for public procurement of innovation: Choice, design and assessment. Technol. Forecast. Soc. Chang. 2014, 86, 1–12. [Google Scholar] [CrossRef]
  47. Marron, D. Greener Public Purchasing as an Environmental Policy Instrument. OECD J. Budg. 2004, 3, 71–105. [Google Scholar] [CrossRef]
  48. Geroski, P.A. Government Procurement as a Tool of Industrial Policy. Int. Rev. Appl. Econ. 1990, 4, 182–198. [Google Scholar] [CrossRef]
  49. Eurostat. Community Innovation Survey. 2014. Available online: https://ec.europa.eu/eurostat/web/microdata/community-innovation-survey (accessed on 1 October 2020).
  50. European Commission. Community Innovation Survey, Description of Dataset. 2020. Available online: https://ec.europa.eu/eurostat/web/microdata/community-innovation-survey (accessed on 9 February 2021).
  51. OECD. Oslo Manual: Guidelines for Collecting and Interpreting Innovation Data, 3rd ed.; OECD: Paris, France, 2005. [Google Scholar]
  52. D’Attoma, I.; Ieva, M. The role of marketing strategies in achieving the environmental benefits of innovation. J. Clean. Prod. 2022, 342, 130957. [Google Scholar] [CrossRef]
  53. Horbach, J.; Oltra, V.; Belin, J. Determinants and Specificities of Eco-Innovations Compared to Other Innovations—An Econometric Analysis for the French and German Industry Based on the Community Innovation Survey. Ind. Innov. 2013, 20, 523–543. [Google Scholar] [CrossRef]
  54. Horbach, J. Empirical determinants of eco-innovation in European countries using the community innovation survey. Environ. Innov. Soc. Transit. 2016, 19, 1–14. [Google Scholar] [CrossRef]
  55. Caravella, S.; Crespi, F. Unfolding heterogeneity: The different policy drivers of different eco-innovation modes. Environ. Sci. Policy 2020, 114, 182–193. [Google Scholar] [CrossRef]
  56. Hashi, I.; Stojčić, N. The impact of innovation activities on firm performance using a multi-stage model: Evidence from the Community Innovation Survey 4. Res. Policy 2013, 42, 353–366. [Google Scholar] [CrossRef]
  57. European Commission. Community Innovation Survey, Microdatasets Availability Table. 2020. Available online: https://ec.europa.eu/eurostat/documents/203647/771732/Datasets-availability-table.pdf (accessed on 9 February 2021).
  58. CIRCABC. CIS2014_Questionnaire. 2014. Available online: https://circabc.europa.eu/ui/group/47133480-29c1-4c23-9199-72a631f4fd96/library/32ab7d19-446e-404c-9ea5-e2524065b2a0/details (accessed on 20 March 2022).
  59. De Jesus, A.; Lammi, M.; Domenech, T.; Vanhuyse, F.; Mendonça, S. Eco-Innovation Diversity in a Circular Economy: Towards Circular Innovation Studies. Sustainability 2021, 13, 10974. [Google Scholar] [CrossRef]
  60. Horbach, J.; Rammer, C.; Rennings, K. Determinants of eco-innovations by type of environmental impact—The role of regulatory push/pull, technology push and market pull. Ecol. Econ. 2012, 78, 112–122. [Google Scholar] [CrossRef]
  61. Rosenbaum, P.R.; Rubin, D.B. The central role of the propensity score in observational studies for causal effects. Biometrika 1983, 70, 41–55. [Google Scholar] [CrossRef]
  62. Caliendo, M.; Kopeinig, S. Some practical guidance for the implementation of propensity score matching. J. Econ. Surv. 2008, 22, 31–72. [Google Scholar] [CrossRef]
  63. Heckman, J.J.; Ichimura, T.; Todd, P.E. Matching as an Econometric Evaluation Estimator: Evidence from Evaluating a Job TrainingProgramme. Rev. Econ. Stud. 1997, 64, 605–654. [Google Scholar] [CrossRef]
  64. Dehejia, R.H.; Wahba, S. Causal Effects in Nonexperimental Studies: Reevaluating the Evaluation of Training Programs. J. Am. Stat. Assoc. 1999, 94, 1053–1062. [Google Scholar] [CrossRef]
  65. Bryson, A.; Dorsett, R.; Purdon, S.; Great, B. Department for Work and Pensions. In The Use of Propensity Score Matching in the Evaluation of Active Labour Market Policies; Department for Work and Pensions: London, UK, 2002. [Google Scholar]
  66. Chen, Q. Advanced Econometrics and Stata Application, 2nd ed.; Higher Education Press: Beijing, China, 2014. [Google Scholar]
  67. Pickernell, D.; Kay, A.; Packham, G.; Miller, C. Competing agendas in public procurement: An empirical analysis of opportunities and limits in the UK for SMEs. Environ. Plan. C Gov. Policy 2011, 29, 641–658. [Google Scholar] [CrossRef]
  68. Reijonen, H.; Tammi, T.; Saastamoinen, J. SMEs and public sector procurement: Does entrepreneurial orientation make a difference? Int. Small Bus. J. 2016, 34, 468–486. [Google Scholar] [CrossRef]
  69. Yu, C.; Morotomi, T.; Yu, H. What Influences Adoption of Green Award Criteria in a Public Contract? An Empirical Analysis of 2018 European Public Procurement Contract Award Notices. Sustainability 2020, 12, 1261. [Google Scholar] [CrossRef]
  70. Vidal, R.; Sanchez-Pantoja, N. Method based on life cycle assessment and TOPSIS to integrate environmental award criteria into green public procurement. Sustain. Cities Soc. 2019, 44, 465–474. [Google Scholar] [CrossRef]
  71. Jun, W.; Ali, W.; Bhutto, M.; Hussain, H.; Khan, N. Examining the determinants of green innovation adoption in SMEs: A PLS-SEM approach. Eur. J. Innov. Manag. 2019, 24, 67–87. [Google Scholar] [CrossRef]
  72. Passaro, R.; Quinto, I.; Scandurra, G.; Thomas, A. The drivers of eco-innovations in small and medium-sized enterprises: A systematic literature review and research directions. Bus. Strategy Environ. 2023, 32, 1432–1450. [Google Scholar] [CrossRef]
  73. Cecere, G.; Corrocher, N.; Mancusi, M.L. Financial constraints and public funding of eco-innovation: Empirical evidence from European SMEs. Small Bus. Econ. 2020, 54, 285–302. [Google Scholar] [CrossRef]
  74. EUROPA. List of NACE Codes. 2010. Available online: https://ec.europa.eu/competition/mergers/cases/index/nace_all.html (accessed on 10 April 2022).
Figure 1. The theoretical underpinning of effects of PP on (eco-)innovation. Source: authors’ elaboration.
Sustainability 15 14354 g001
Figure 2. Percentage of enterprises answering “yes” or “no” for each eco-innovation and public contract participation, 2012–2014. Source: author’s elaboration. Please refer to Table 1 for the label meanings.
Sustainability 15 14354 g002
Figure 3. Spatial diagrams of enterprise percentages introducing at least one kind of innovation for environmental benefits (left), and having public contracts (right), 2012–2014. Source: author’s elaboration. The data for Germany and Spain are missing. The unit for legend is “%”.
Sustainability 15 14354 g003
Figure 4. The standardized bias of covariates in PSM analysis for eco-innovation without perfect matching.
Sustainability 15 14354 g004
Figure 5. Common support in PSM analysis for eco-innovation without perfect matching.
Sustainability 15 14354 g005
Table 1. Sub-questions for public procurement and innovations with environmental benefits.
Questions and Definitions of VariablesVariable Name
“During the three years 2012 to 2014, did your enterprise have any contracts to provide goods or services for:”PUBPRO
Domestic public-sector organizationsPUBDOM
Foreign public-sector organizations PUBFOR
“During the three years 2012 to 2014, did your enterprise introduce a product (good or service), process, organizational or marketing innovation with any of the following environmental benefits?”ECOIMP
(1) Environmental benefits obtained within your enterpriseECOIMP-within
Reduced material or water use per unit of output ECOMAT
Reduced energy use or CO2 ‘footprint’ (reduce total CO2 production)ECOENO
Reduced air, water, noise, or soil pollutionECOPOL
Replaced a share of materials with less polluting or hazardous substitutesECOSUB
Replaced a share of fossil energy with renewable energy sourcesECOREP
Recycled waste, water, or materials for own use or saleECOREC
(2) Environmental benefits obtained during the consumption or use of a good or service by the end userECOIMP-end
Reduced energy use or CO2 ‘footprint’ECOENU
Reduced air, water, noise, or soil pollutionECOPOS
Facilitated recycling of products after use ECOREA
Extended product life through longer-lasting, more durable products ECOEXT
“Were any of these environmental benefits due to the following types of your enterprise’s innovations?”ECOCAT
Product (goods or services) innovationsECOPRD
Process innovationsECOPRC
Organizational innovationsECORG
Marketing innovations ECOMKT
Source: authors’ elaboration based on [58].
Table 2. Drivers of eco-innovation and control variables.
CategoriesIndicators in TheoryIndicators in This ResearchCONT
Technological push R&D investment Expenditure on different innovation activities in 2014RD
High-qualified human resource Percentage of the enterprise’s employees in 2014 who have a tertiary degreeEMPRD
Organizational capability Environmental managementProcedures in place to regularly identify and reduce environmental impacts (for example, environmental audits, environmental performance goals, ISO 14001 certification, etc.)ENVMG
CSR----
Network with other agentsCooperate on innovation with other enterprises or organizations (in): 1-within the enterprise group; 2-suppliers; 31-clients/customers from the private sector; 32-clients/customers from the public sector; 4-competitors or other enterprises in the sector; 5-consultants or commercial labs; 6-universities or other higher education institutes; 7-research institutes; A-your country; B-other Europe; C-United States; D-China or India; E-all other countriesCO:
CO1 CO2
CO31 CO32 CO4 CO5 CO6 CO7 COA COB COC COD COE
Demand and market Demand for green products ----
Social awareness ----
Competition Apply for a patent, European utility model, industrial design right, or trademarkCOMPET
Cost saving Firm size Total turnover in 2014;
employee number in 2014
SIZE1
SIZE2
Material price----
Energy price ----
Regulations Existing regulations ----
Anticipated regulations----
Access to subsidies Public financial support from local (regional), national governments, or EUFUND:
FUNLOC
FUNGMT
FUNEU
Source: authors’ elaboration based on [20,22,23,58,60].
Table 3. Selection of covariates. Logit models are applied. The dependent variable is the public contract (PUBPRO).
RegressorsSignificance
(1)(2)(3)(4)
Public financial support/FUND------
Local or regional authorities/FUNLOC--
Central government/FUNGMT--
European Union/FUNEU--
Cooperation with other actors/CO------
CO1--
CO2--
CO31--
CO32--
CO4--
CO5--
CO6--
CO7--
Expenditure on innovation activities/RD
Applied for a patent, trademark, European utility model, or industrial design right/COMPET
Environmental management/ENVMG
Ln turnover in 2014/LNSIZE1
Largest market/LARMAR√ (for square)
% of employees with a tertiary degree/EMPRD
Employee number/SIZE2dummiesdummies
Main activities or sectorsdummiesdummies
Nations dummiesdummies
Intercept
Correct prediction rate75.6%76.5%77.8%77.8%
Pseudo R20.0760.0900.1260.127
Source: author’s elaboration. “√” means the coefficient is significant at 95% or 99% level. “--” means the variable is not included in the regression. The blank cell means not statistically significant. FUNLOC, FUNGMT, and FUNEU are sub-variables for public financial funds (FUND). CO1, CO2, CO31, CO32, CO4, CO5, CO6, CO7 are sub-variables for cooperation (CO). In regression (4), the square terms of each regressor are additionally included.
Table 4. Descriptive results.
VariablesObs.MeanStd. Dev.Min.Max.VariablesObs.MeanStd. Dev.Min.Max.
ECOINNO26,3390.470.5001CO136,2530.130.3401
PUBPRO62,0050.180.3801CO236,2530.200.4001
RD56,7990.101.47098.23CO3136,2530.130.3301
EMPRD90,0042.651.8406CO3236,2530.0460.2101
ENVMG51,7920.200.4001CO436,2530.0760.2601
CO36,2530.360.4801CO536,2530.110.3101
COMPET87,0970.0970.3001CO636,2530.140.3501
SIZE198,7474.77 × 1076.58 × 10807.32 × 1010CO736,2530.120.3201
SIZE291,2531.470.7314COA36,2530.320.4701
FUND52,0120.230.4201COB36,2530.150.3601
FUNLOC52,0120.0740.2601COC36,2530.0370.1901
FUNGMT52,0130.160.3601COD36,2530.0230.1501
FUNEU52,0120.0860.2801COE36,2530.0320.1801
Source: authors’ elaboration. RALLX and TURN14 are continuous variables. RALLX is the ratio of innovation expenditure out of turnover. EMPRD and EMP14 are ordinary variables. EMPRD: 0 (0%); 1 (1~4%); 2 (5~9%); 3 (10~24%); 4 (25~49%); 5 (50~74%); 6 (75~100%). EMP14: 1 (1~50); 2 (50~249); 3 (250~499); 4 (≥500). Others are dummy variables. Please refer to Table 2 for variable descriptions.
Table 5. PSM results. Outcomes are individual eco-innovation with different environmental benefits.
Individual InnovationsATT and T-stat
ECOINNOECOIMP-within
ECOMATECOENOECOPOLECOSUBECOREPECOREC
NN0.057 ***
(3.25)
0.006
(0.42)
0.020
(1.31)
0.018
(1.25)
0.012
(0.83)
0.013
(1.39)
0.045 ***
(2.87)
3NN0.053 ***
(3.60)
0.004
(0.03)
0.005
(0.41)
0.003
(0.25)
0.018
(1.47)
0.011
(1.45)
0.037 ***
(2.76)
5NN0.049 ***
(3.47)
0.004
(0.34)
0.008
(0.64)
0.006
(0.49)
0.018
(1.55)
0.014 *
(1.88)
0.037 ***
(2.90)
Kernel0.061 ***
(4.65)
0.008
(0.73)
0.012
(1.09)
0.007
(0.67)
0.016
(1.51)
0.011
(1.60)
0.033 ***
(2.75)
Obs.9724975497559756975797549757
Caliper0.0160.0160.0160.0160.0160.0160.016
Individual innovationsATT and T-stat
ECOIMP-endECOCAT
ECOENUECOPOSECOREAECOEXTECOPRDECOPRCECORGECOMKT
NN0.031 **
(2.14)
0.054 ***
(3.93)
0.034 **
(2.43)
0.034 **
(2.45)
0.056 **
(2.27)
0.013
(0.53)
0.014
(0.62)
0.009
(0.50)
3NN0.038 ***
(3.14)
0.057 ***
(4.97)
0.026 **
(2.20)
0.029 **
(2.47)
0.041 **
(1.96)
0.004
(0.17)
0.12
(0.61)
0.004
(0.28)
5NN0.037 ***
(3.17)
0.056 ***
(5.06)
0.030 ***
(2.60)
0.030 ***
(2.70)
0.047 **
(2.35)
−0.002
(−0.11)
0.012
(0.64)
0.003
(0.25)
Kernel0.042 ***
(3.90)
0.054 ***
(5.23)
0.033 ***
(3.14)
0.033 ***
(3.17)
0.034 *
(1.82)
−0.003
(−0.19)
0.026
(1.55)
0.013
(1.05)
Obs.97579740973797364811481148124812
Caliper0.0160.0160,0160.0160.0170.0170.0170.017
Source: authors’ elaboration. ATT is the average treatment effect on the treated. T-stat is the t-statistic of the difference t-test of the treated group and the matched control group. * p < 0.1, ** p < 0.05, *** p < 0.01 if the t-statistic is located within (1.645, 1.960), (1.960, 2.576), and >2.576, respectively. Matching is conducted only within the common support. All individuals with the same proper p-score are selected if there are any. Caliper is 0.1 * std. dev. of the p-score.
Table 6. PSM results, perfectly matched on firm size.
Firm SizeATT and T-stat
Under 5050–249250 and More
NN0.051 **
(2.20)
0.071 **
(2.36)
0.106 ***
(2.61)
3NN0.050 ***
(2.58)
0.045 *
(1.79)
0.087 **
(2.53)
5NN0.063 ***
(3.36)
0.037
(1.51)
0.075 **
(2.27)
Kernel0.063 ***
(3.68)
0.037 *
(1.64)
0.082 ***
(2.65)
Obs.581435561520
Caliper0.0150.0180.021
Source: authors’ elaboration. ATT is the average treatment effect on the treated. T-stat is the t-statistic of the difference t-test of the treated group and the matched control group. * p < 0.1, ** p < 0.05, *** p < 0.01 if the t-statistic is located within (1.645, 1.960), (1.960, 2.576), and >2.576, respectively. Matching is conducted only within the common support. All individuals with the same proper p-score are selected if there are any. Caliper is 0.1 * std. dev. of the p-score.
Table 7. PSM results, perfectly matched cooperation and nation. The outcome is innovation with environmental benefits.
CooperationATT and T-stat
CO1CO2CO31CO32CO4CO5CO6CO7COACOBCOCCODCOE
NN0.080 *
(1.51)
0.042
(1.16)
0.123 ***
(2.63)
0.123
(1.25)
0.074
(1.19)
0.079
(1.52)
0.060
(1.24)
0.082
(1.23)
0.064 **
(2.07)
0.060
(1.37)
0.109
(1.07)
0.020
(0.17)
0.135
(1.27)
3NN−0.005
(−0.12)
0.034
(1.12)
0.090 **
(2.34)
0.094
(1.08)
0.040
(0.77)
0.033
(0.78)
0.033
(0.81)
0.070
(1.29)
0.049 *
(1.88)
0.079 **
(2.19)
0.076
(0.89)
0.157
(1.49)
0.090
(0.99)
5NN−0.013
(−0.31)
0.026
(0.89)
0.064 **
(2.09)
0.110
(1.26)
0.036
(0.72)
0.048
(1.17)
0.036
(0.93)
0.061
(1.14)
0.045*
(1.79)
0.087 **
(2.56)
0.063
(0.77)
0.162
(1.56)
0.084
(0.94)
Kernel−0.008
(−0.21)
0.029
(1.08)
0.074 **
(2.15)
0.137 *
(1.77)
0.031
(0.65)
0.045
(1.18)
0.040
(1.10)
0.045
(0.88)
0.037
(1.59)
0.071 **
(2.26)
0.091
(1.22)
0.016
(0.16)
0.102
(1.22)
Obs.8641897113932961381195651525141380235158225
Caliper0.0150.0150.0170.0220.0190.0170.0190.0200.0160.0160.0180.0220.021
NationsATT and T-stat
BulgariaEstoniaGreeceCroatiaHungaryLatviaPortugalRomania
NN0.121 ***
(3.20)
0.125
(1.31)
0.054
(1.05)
0.054
(0.94)
−0.016
(−0.31)
0.056
(0.54)
0.019
(0.62)
−0.024
(−0.26)
3NN0.100 ***
(3.09)
0.068
(0.82)
0.035
(0.84)
0.049
(0.99)
0.002
(0.04)
0.146 *
(1.65)
0.037
(1.42)
−0.024
(−0.28)
5NN0.097 ***
(3.13)
0.052
(0.65)
0.044
(1.10)
0.045
(0.95)
0.019
(0.46)
0.135
(1.58)
0.031
(1.25)
−0.053
(−0.64)
Kernel0.107 ***
(3.81)
0.016
(0.21)
0.059
(1.58)
0.058
(1.31)
0.015
(0.41)
0.127
(1.60)
0.031
(1.36)
−0.023
(−0.31)
Obs.2436301106277612042963204419
Caliper0.0150.0210.0190.0210.0180.0210.0150.019
Source: author’s elaboration. ATT is the average treatment effect on the treated. T-stat is shown in the parentheses, as are the t-statistic of the difference t-test of the treated group and the matched control group. * p < 0.1, ** p < 0.05, *** p < 0.01 if the t-statistic is located within (1.645, 1.960), (1.960, 2.576), and >2.576, respectively. Matching is conducted only within the common support. All individuals with the same proper p-score are selected if there are any. Caliper is 0.1 * std. dev. of the p-score. The results for other countries are omitted because of “no observations” and “insufficient observations”. Please refer to Table 2 for a detailed variable description.
Table 8. PSM results, perfectly matched on sectors. The outcome is innovation with environmental benefits.
ATT and T-stat
Sector23456789101112
NN0.400 **
(2.00)
0.023
(0.33)
0.167
(1.56)
0.000
(0.00)
−0.094
(−0.71)
0.107
(1.26)
0.068
(0.93)
0.000
(0.00)
−0.038
(−0.64)
−0.08
(−0.51)
0.000
(0.00)
3NN0.300 **
(2.16)
0.059
(1.02)
0.090
(1.03)
0.045
(0.57)
−0.038
(−0.32)
0.054
(0.78)
0.040
(0.67)
0.027
(0.44)
0.017
(0.34)
−0.013
(−0.09)
0.065
(0.83)
5NN0.305 **
(2.27)
0.035
(0.63)
0.070
(0.84)
0.046
(0.62)
−0.015
(−0.13)
0.024
(0.36)
0.050
(0.85)
0.038
(0.63)
0.003
(0.06)
−0.016
(−0.11)
0.049
(0.66)
Kernel0.250 *
(1.71)
0.016
(0.31)
0.061
(0.79)
0.074
(1.08)
−0.003
(−0.03)
0.019
(0.31)
0.063
(1.15)
0.014
(0.24)
0.008
(0.17)
−0.032
(−0.23)
0.058
(0.83)
Obs.70808605402190420697836910172453
Caliper0.0310.0140.0110.0090.0210.0150.0100.0090.0170.0190.013
Sector13141516171819212224
NN0.026
(0.18)
0.167
(0.81)
0.132
(1.36)
0.100
(0.33)
0.042
(0.95)
−0.016
(−0.014)
−0.04
(−0.25)
0.097 **
(2.27)
0.250 ***
(3.27)
0.080
(1.22)
3NN0.017
(0.13)
0.117
(0.57)
0.198 **
(2.12)
0.100
(0.33)
0.067 *
(1.80)
0.024
(0.24)
0.027
(0.20)
0.075 **
(2.04)
0.162 **
(2.27)
0.070
(1.24)
5NN0.032
(0.24)
0.112
(0.58)
0.198 **
(2.16)
0.100
(0.33)
0.065 *
(1.82)
0.019
(0.20)
0.077
(0.60)
0.074 **
(2.06)
0.114
(1.63)
0.087
(1.61)
Kernel0.063
(0.54)
0.124
(0.68)
0.164 **
(2.05)
0.231
(0.83)
0.041
(1.17)
0.051
(0.54)
0.140
(1.19)
0.071 **
(2.09)
0.093
(1.36)
0.129 **
(2.55)
Obs.13886246351173273202956326591
Caliper0.0250.0340.0230.0250.0140.0210.0170.0190.0150.021
Source: author’s elaboration. ATT is the average treatment effect on the treated. T-stat is shown in the parentheses, as are the t-statistic of the difference t-test of the treated group and the matched control group. * p < 0.1, ** p < 0.05, *** p < 0.01 if the t-statistic is located within (1.645, 1.960), (1.960, 2.576), and >2.576, respectively. Matching is conducted only within the common support. All individuals with the same proper p-score are selected if there are any. Caliper is 0.1 * std. dev. of the p-score. Please refer to Appendix B for the code of sectors or main activities. The results for sector = 1, 20, 23, 25, 26, 27 are omitted because of “no observations” and “insufficient observations”.
Disclaimer/Publisher’s Note: The statements, opinions and data contained in all publications are solely those of the individual author(s) and contributor(s) and not of MDPI and/or the editor(s). MDPI and/or the editor(s) disclaim responsibility for any injury to people or property resulting from any ideas, methods, instructions or products referred to in the content.

