Abstract
Recent studies on the global value chain (GVC) have highlighted the need to better integrate the value chains of developing countries of the global South with that of the global North regions, which are more highly developed. This is aimed at enhancing the economic and social sustainable upgrading of the value chains of the global South regions. The paper thus seeks to answer a critical question as to whether the existing GVC set-up pertaining to global North and South countries is equitable and whether it would yield the needed socio-economic and wider sustainable benefits, particularly to global South countries. a conceptual Global Value Chain (GVC) model is developed based on the economy-wide and system-based Multi-Regional Input–Output methodology to achieve this goal. Subsequently, this was empirically tested to measure embodied flows in capital and labour for sustainable development between global North and South regions. These are achieved using the GVC networks of the UK (from the global North) and some countries in sub-Saharan Africa (from the global South) to exemplify these developments. With implications for equitable, sustainable development, our study shows significant imbalances exist in the flows of value added activities from the global South to the global North, particularly in the primary industries, which produce low-value products in their raw state. Subsequently, this creates a disproportionate economic disadvantage for South countries. As such, if global South countries are to fully benefit from GVC, the study shows that these imbalances must be addressed, such as through structural changes in the economies of global South countries from their dependencies on the primary industries.
1. Introduction
In the past few decades, global value chains (GVCs) have emerged as a pivotal feature of the global economy and altered the global production processes [1,2,3,4,5]. GVC encompasses “a network of labour and production processes whose end result is a finished commodity” [6] (p.17). For developing countries in the global South, it has been argued that integrating these countries within the GVC networks can result in sustainable economic and social upgrading [7].
Indeed, previous research on industrial clusters within GVC studies has mainly sought to highlight the need to integrate nations of the global North and global South into an integrated global production network [5]. This paper argues that while GVC provides the platform through which production in primary, manufacturing, and service sectors are coordinated and organised on a global basis [2] and so may strengthen productivity and growth [8], it is also an economic system that can be characterised by some economic implications that may hinder the drive towards achieving equitable sustainable development.
The paper emphasises that the negative implications of an integrated GVC are the results of disproportionate flows of resources, such as raw material and finished products, as inputs that contribute to the value chains between key stakeholders and countries/regions brought about by globalisation. The advent of globalisation, a consequence of international trade, has increased competition within GVCs [9]. This is mainly driven by factors such as the way firms are organising and shaping their value chain activities [10], increased interdependence between production networks such as firms and industries [11] and because of resource, efficiency and new market-seeking strategies [12]. Disproportionate flows of resource inputs within GVCs lead to imbalances between countries and regions in terms of measures such as biophysical indicators like carbon [13], natural resources such as water and land use [14] and even power [15]. Despite the growing body of literature on the GVCs [16] and their positive effects on stakeholders, including countries and regions [17,18,19,20], few scholars have sought to examine some of the negative economic implications of activities within the GVC network.
Against this background, the principal aim of this paper is to fill the research void outlined by theoretically developing a GVC model, which is then empirically tested to measure the implications of economic activities in terms of embodied flows in capital and labour between the integrated GVC networks of the global North and South regions. Embodied capital and labour are indirect capital and labour within international trade flows of goods and services under a given production structure. The model is tested using the value chain systems between the UK (a global North country) and the following developing sub-Saharan Countries in the global South: Cameroon, Cote d’Ivoire, Ghana, Nigeria and Senegal. These global South countries were chosen as exemplary representations of countries in the region from Africa, which are major trading partners with the UK and because of easier access to data. The paper raises pertinent questions about the economic implications of the relative dependences of labour and capital embodied within the GVC networks of the global North and global South countries. Indeed, GVC issues cannot be separated from the concept of sustainable development (which seeks to enhance and balance economic, social and environmental development now and in the future), whether sustainable development is analysed using a historical or transhistorical perspective [21] or even a contemporary perspective [22]). In light of these, we contribute to the GVC literature and debate by arguing that one of the biggest risks to economic and social upgrading and for an equitable drive towards sustainable development in the global South is a result of the disproportionate flow of some resource inputs into the value added activities between the global North and global South countries (see, Guschanski and Onaran [23]).
The paper employs an economic system-based Input–Output (IO) methodology [24,25] to test the theoretical GVC model developed in this paper. GVC networks consist of production and consumption activities, which are associated with material exchanges, value chain transformations associated with activities such as extraction, manufacturing, processing, etc. and the use of factors of production such as labour and capital. Bridge and Bradshaw [26] highlight the suitability of the IO framework for such analyses because its structure captures the series of territorially embedded physical IO production networks, which typifies GVCs. Similarly, Lee and Kim [27] adopted the IO methodology when analysing GVC and inequality with endogenous labour supply.
Empirically testing the model enables some economic implications of the activities of the GVC network in terms of capital and labour, a measure for socio-economic sustainability to be quantified and analysed. The paper, therefore, highlights the asymmetric transfer of value addition in the primary industries in the listed African countries in the global South and the UK in the global North. Thus, the study emphasises the need for such industrial-level economic analysis, as it provides a system-wide basis to gain further insight into value added flows between regions and assess the benefits and implications of economic interactions at the industrial level across countries. The study seeks to highlight that the firm-based view analyses (a bottom-up perspective) of GVC can be narrow as limited insight can be drawn from such a reduced scale and scope of analysis. Consequently, the analyses in this study are undertaken at the industrial level between the economic sectors of the UK from the global North and the developing sub-Saharan countries of Cameroon, Cote d’Ivoire, Ghana, Nigeria and Senegal in the global South.
The literature review on GVC is outlined in the next section to achieve the objectives outlined above. Subsequently, the conceptual framework for the paper is presented. Following this, the methodology used for the entire research is outlined. The results of the analysis based on the quantitative assessment of value chain activities between the global North and South are presented. Furthermore, the implications are discussed, allowing for the concluding remarks in the final section.
2. Literature Review
Debates on the Global Value Chain (GVC) and Global Production Network (GPN) have recently gained momentum in the Economic Geography research space. Issues that have contributed to the intellectual debates between these concepts have ranged from theoretical models, underlying determinants and drivers, differences in terminologies, empirical testing and applications, among others [28].
Value chain activities can be generally explained to comprise the processes by which technology is combined with material and labour inputs, and then processed inputs are assembled, marketed, and distributed [29]. Although no single definition of the term “value chain” exists today, an all-encompassing description put forward by The Global Value Chains Initiative [30] states that the value chain describes the full range of activities that firms and workers do to bring a product from its conception to its end use and beyond. This includes activities such as design, production, marketing, distribution, communication, financial services and support to the final consumer. The activities that comprise a value chain can be contained within a single firm or divided among different firms. Value chain activities lead to producing goods or services and can be contained within a single geographical location or spread over wider areas. Indeed, Tukker and Dietzenbacher [31] explain that value chain activities are generally multi-regional or global, given that they cross multiple national boundaries.
From this global perspective, GVC encompasses all the value added activities (such as extraction, manufacturing, processing, etc.) that are directly and indirectly required to produce an output [32]. Hopkins and Wallerstein ([6], p. 17) had earlier articulated this view when they reported that GVCs are “a network of labour and production processes whose end result is a finished commodity”. From these, two important characteristics of GVCs emerge; firstly, they consist of value chain activities, and secondly, they result in producing an output. GVC can, therefore, be conceptualised as fragmented production processes, which leads to the production of goods and services either as intermediate goods and services for other goods and services that are yet to be produced or as goods and services delivered at the final stage of production. On the other hand, Global Production Networks (GPN) bear some relationship with GVC because both concepts are underpinned by stakeholders, which are concerned with producing goods and services within complex economic systems. Despite these common characteristics, Klein et al. [33] highlight that GPN is deliberately broader in remit. In fact, a GPN constitutes all production systems and thus consists of a series of products called GVCs. In effect, a series of GVCs make up GPN.
Given the fragmented and dispersed nature of GVCs within GPN, today’s global economy has emerged into borderless production systems with differing levels of complex networks that may be global or regional. GVCs have become an integral feature of world trade, including developed, emerging and developing economies [34,35]. Indeed, Elms and Low [36] state that any discussion today that pertains to world trade that does not recognise the centrality of GVCs would be considered largely outdated and of doubtful relevance. This is particularly so as the global economy is progressively structured around GVCs, which are responsible for an increasing proportion of international trade, global GDP and employment [37]. The contribution of GVCs to development can be significant because it establishes a link between industries, firms, employees and consumers worldwide, and it can serve as a springboard for economic actors in developing countries to integrate into the global economy [37,38]. The positive contribution of GVCs to the global economy is undisputed [39], even to the extent of using it as a strategic intervention facility for developing countries to construct productive capacity through technology transfer and dissemination and skill building, thereby creating opportunities for industrial upgrading cannot be underestimated. Despite these positives, it is important to understand potentially negative economic implications, which may result in non-equitable sustainable development, particularly in the global South regions.
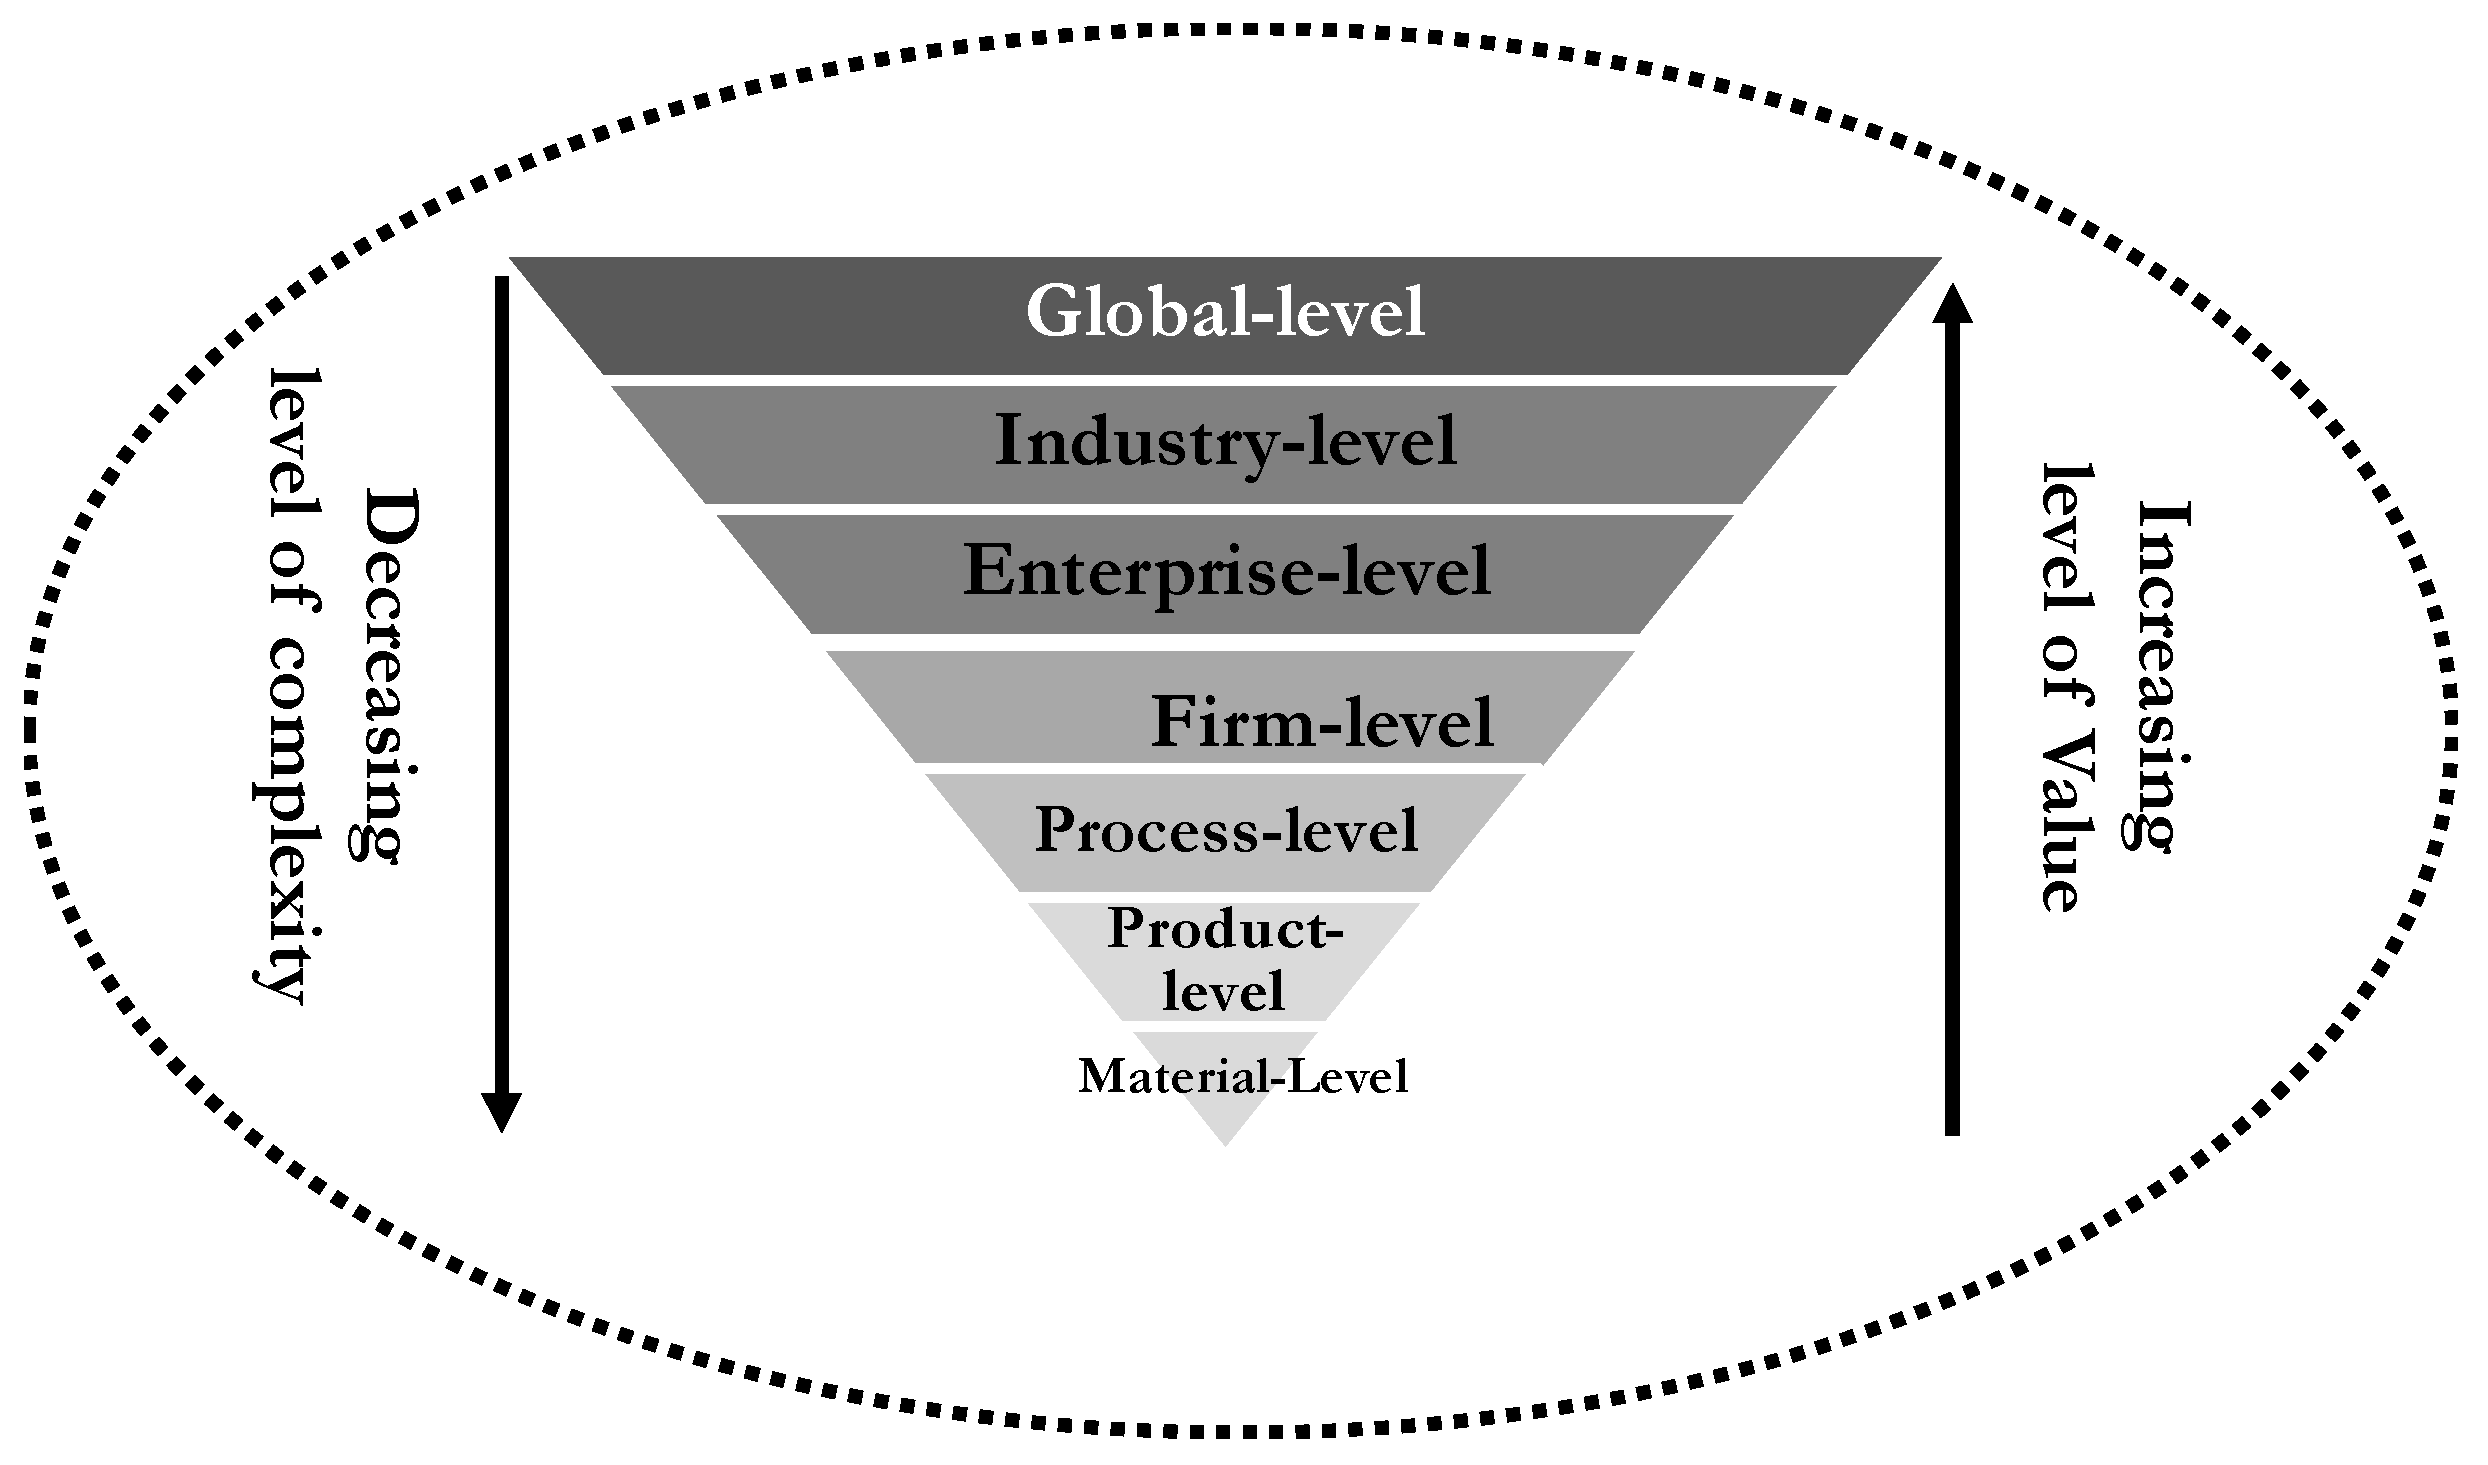
As explained by Acquaye et al. [40], GPN, which consists of a series of GVCs, can be viewed from different analytical perspectives depending on the level of complexity and scale of value added activities being considered; refer to Figure 1. Consequently, these perspectives can range from lower levels of GVCs, such as firms, to higher levels of GVCs, such as industries. In this paper, an industry-level perspective of the GVC is used as the unit of analysis in an attempt to build on the theory and evidence base of contemporary GVC research. This is supported by the view that although industrial-level perspectives of the global value chains are characterised by increased complexity, they are also associated with the most increased levels of value added activities [1]. Further to this, Sturgeon [41] and Acquaye et al. [42] have also asserted that an industry-level analysis of economic activity that uses a ‘value chain’ approach works well in studies of cross-border economic integration because it takes a significant but still manageable slice of the world economy as the object of the study. Sturgeon [41] further stresses that the industry-level approach is geographically “scalable”, so what is observed at the local level often has some direct relationship to what is seen at the national, regional, and global levels. The paper, therefore, asserts that attempts at assessing some of the economic implications within the GVC across countries in the global North and South can yield the most insight when industry-level analyses of the different economic sectors across the different countries are adopted.

Figure 1.
Different perspectives of analytical GVCs.
The literature suggests that within GVCs, there have been shifts in the global production networks (the so-called supply base), mainly from the global North to the global South, making the need for assessing any imbalances of inputs such as embodied capital and labour into the value chain, as being investigated in this paper not just important but timely. This is because disproportionate flows of inputs have wider economic implications for a drive towards equitable sustainable development.
Using the GVC framework, the manner in which global industries are organized and interconnected can be understood through the examination of the structure and dynamics of different actors participating in a given industry. Given the globalised nature of the economy and the complexity of the interaction between industries, the GVC framework can be an invaluable mechanism for tracing the shifts in patterns of global production, linking activities actors of a single industry that are geographically dispersed and ascertaining the roles they play in both developed and developing countries [37]. For instance, Pietrobelli and Rabellotti [18] submitted that the GVC framework could be used to establish a robust link between domestic innovation activities and global governance, emphasising the interaction between domestic manufacturers and the global production network. As such, GVC can provide a holistic view of global industries both from the top-down (industry level) and bottom-up (firm level).
Against this backdrop, a number of studies have employed the GVC framework to investigate various issues at regional and global levels [43]. For instance, authors including Bi et al. [44], Kiamehr [45], Pietrobelli and Puppato [46] have all employed the GVC framework to examine the dynamics of technology development under a globalised economy. For instance, using the manufacturing sector of China as a case study, Bi et al. [47] integrated the GVC framework with a linear innovation process model to analyse the innovation performance of low-carbon technological innovation activities under the GVC and the influencing factors. They concluded that every aspect of the Chinese manufacturing industry is highly embedded in the GVC, especially as it pertains to low-carbon R&D, manufacturing, and marketing activities. Similarly, Zhang and Gallagher [48] employed China’s photovoltaics industry to examine the impact of innovation and technology transfer through global value chains. They identified four distinct themes, including global market formation policy, international mobilization of talent, the flexibility of manufacturing in China, and belated policy incentives from China’s government, as the main drivers for PV technology transfer from the global innovation system to China. They concluded that the development trajectory of the PV industry in China suggests that innovation in cleaner energy technologies can occur through both global and national innovation processes and knowledge exchange along the global PV value chain. Vellema and van Wijk [49] also adopted GVC, and global production network approaches to analyse two distinct examples of global-local interactions. GVCs framework have been employed to investigate agri-food sector global sustainability partnerships [50]; inter-firm and intra-firm networks [46]; implications of integration and harmonisation of enterprise and enterprise groups [51]; international trade statistics and policy analysis [52]; dynamics of technology development [46]; business strategy and upgrading within the IT sector in Brazil [53]; pathways to women empowerment [54]; international exposure and sustainable consumption [55]; policy regulation [56] and many other areas. More recently, GVC has been used as the central theme to analyze inequality issues [57] including labour market wages and employment [58].
Despite the positive potential of GVC in terms of fostering social and global upgrading, limited research has been undertaken to fully understand some potentially negative implications of the economic activities associated with GVC within the integrated networks of the global North and South regions; a major research question this paper seeks to unravel.
3. Conceptual GVC Model
The conceptual framework developed for this study, as presented in Figure 2, combines research strands and principles of Value Chains [59,60,61], which are embedded within Production Networks [2,28,62] and lead to the generation of value added outputs for an equitable sustainable development [62,63,64].
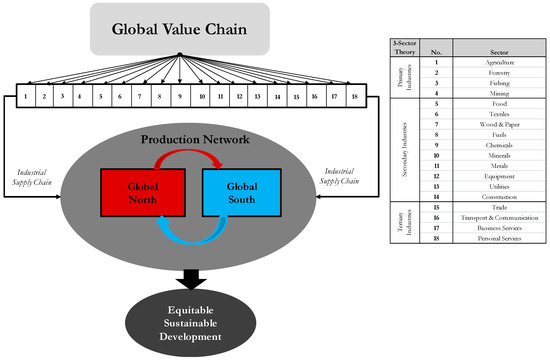
Figure 2.
A Global Value Chain Model for assessing sustainable economic implications between global North and South regions.
Value creation through stakeholder interactions is a notable element addressed within the existing academic discourse on sustainable production and consumption [65,66,67,68]. However, it has received a dearth of research attention within the context of global North and South GVC interactions. Therefore, the GVC analyses of these interactions call for analyses of the ties between actors higher up the value chain (industries), as this can enhance understanding in terms of the economic implications of these activities, as these are not very obvious. In light of these, the GVC model used in this analysis is presented below and expanded upon in Section 4.
These value chain activities are delivered through industrial sectors grouped under primary, secondary and tertiary industries per the three-sector theory [69]. These industrial sectors are further expanded upon in Appendix A. The proposed model seeks to understand any negative economic implications due to the integration of the GVCs of global North and South regions, particularly in the global South, despite the widely accepted notion that it helps to enhance social and economic upgrading. In order to test the model, the IO approach, which can be used to analyse production and consumption network interactions, is adopted.
4. Research Methodology
4.1. Methodological Framework for GVC Analysis
The paper draws on the economy-wide system-based IO methodology [24,25] to test the theoretical GVC model developed in this paper. Within GVC networks consist of production and consumption activities, which are associated with material exchanges, value chain transformation activities such as extraction, manufacturing, processing, etc. and the use of factors of production such as labour and capital. Bridge and Bradshaw [26] highlights the suitability of the IO framework for such analyses because its structure captures the series of territorially embedded physical IO production network. Lee and Yi [27] also adopted the IO methodology in analysing GVC and inequality with endogenous labour supply. Within GVC research, Del Prete and Rungi [70] also used the IO framework as a basis to modify the data structure of the production stages.
The quantitative research methodology adopted must be able to model the complexities of the production and consumption activities and dependencies between the nations being assessed to determine the Value-Added effects between the production and consumption network of different nations. Following this, the general IO approach originally developed by Wassily Leontief [71] is used as the methodological basis. This is because it is based on the structure of the production and consumption processes within an economy [72,73,74] and can thus be extended to cover multiple economies within a multi-regional framework. The general IO model records monetary transactions representing the flows of resources (products and services) between the industrial sector in and between countries. This can be transformed from a monetary to a physical IO model to assess the effects that nations have on each other in terms of value added transfers, which, in essence, describes the full set of activities in the production and consumption network between countries [37].
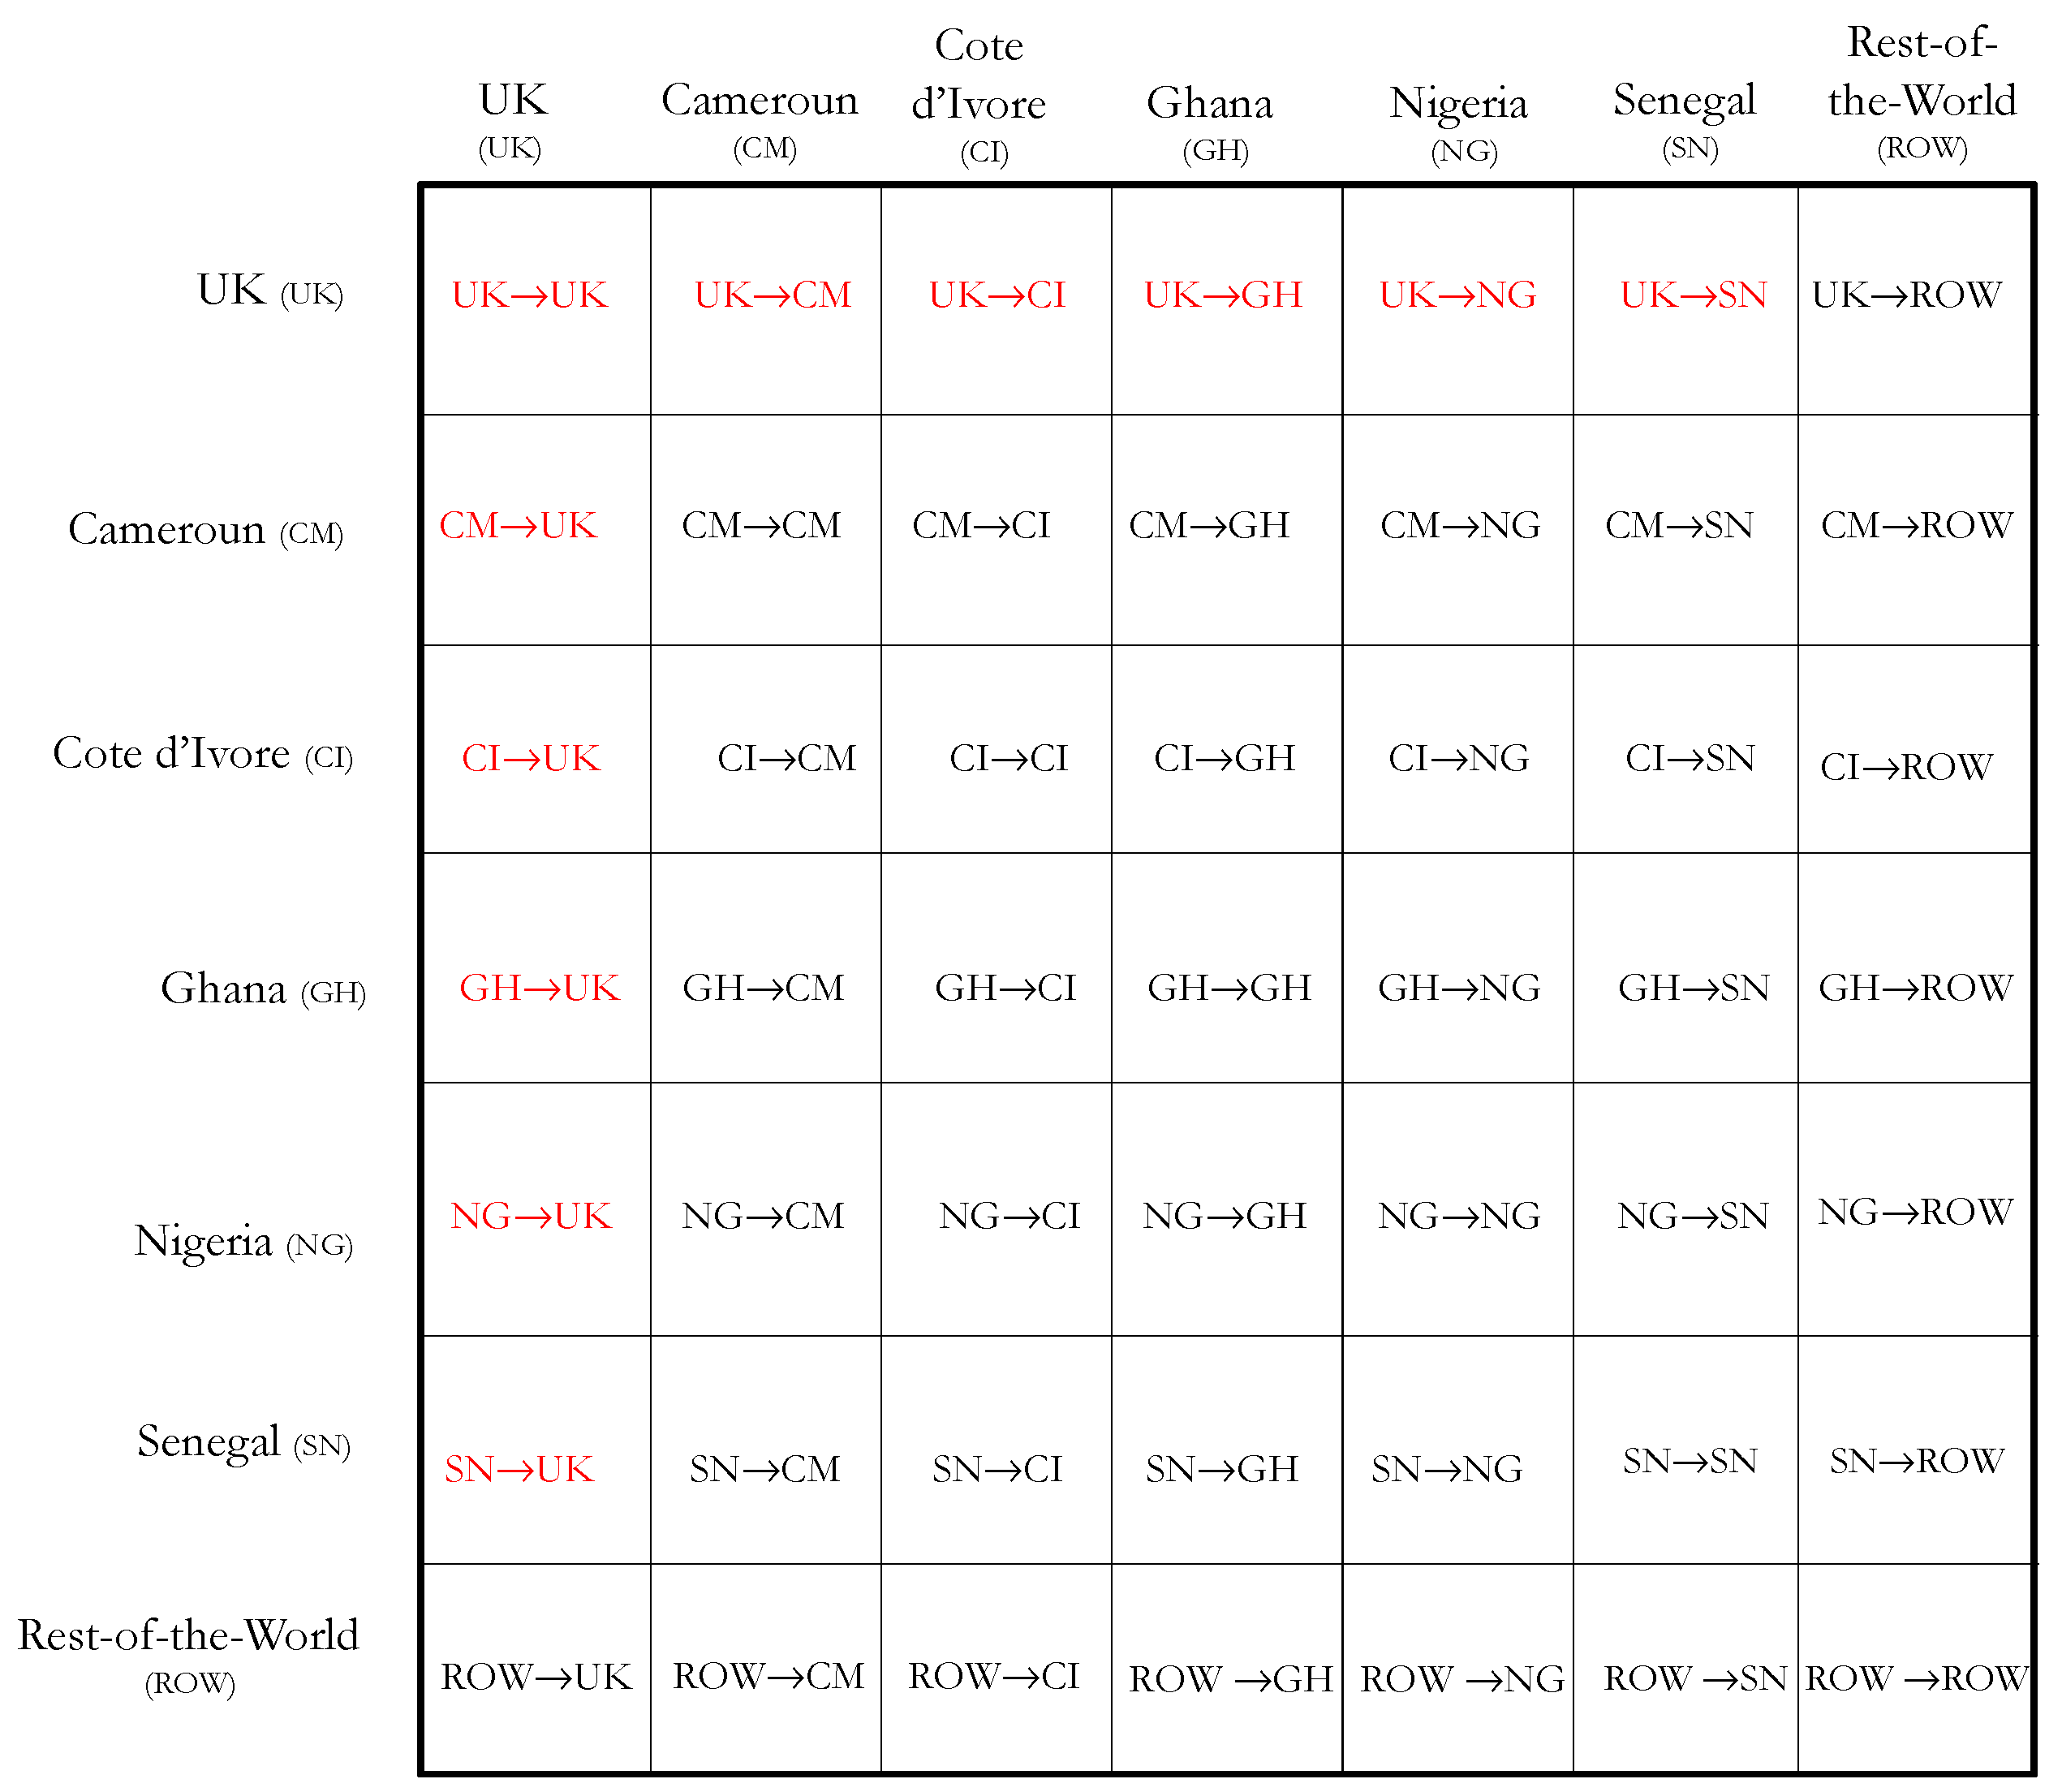
In terms of scope, the conceptual model presented in Figure 2 is configured in Figure 3 to highlight interactions between the UK (global North) and the following developing sub-Saharan Countries in the global South: Cameroon, Cote d’Ivoire, Ghana, Nigeria and Senegal.
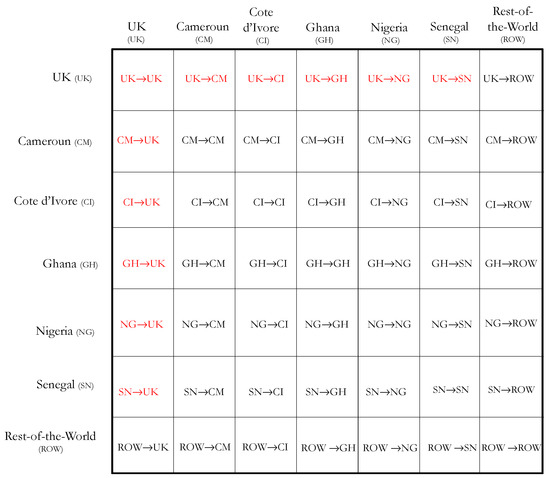
Figure 3.
Conceptual model used to capture Value Added activities between countries.
In Figure 3, each block represents the supply of resources from the industries in the row nation to the use of those resources by the industries in the column nation. Some blocks in Figure 3 have been highlighted in RED to indicate that the analyses on the Value-Added activities will focus on Value Addition from the UK to Cameroon, Cote d’Ivoire, Ghana, Nigeria and Senegal and vice versa.
Following this conceptual model and the general assumptions of IO analyses [25,75], For any economy, it can be shown that:
where:
—The total sector products consumed (row total), or the total industry production output (column total) . Theoretically, given that the IO table is balanced, and the units are expressed in millions of dollars ($).
—The matrix representation of the intermediate consumption, i.e., the amount of product used as an intermediate input in the production process of industry . The matrix representation is given in monetary terms (million $).
—The final demand of products , which represents the demand by (households, government, capital goods, exports, etc.) for products .
In a generalised form, Equation (1) can be expressed as:
For any economy, it can also be shown that:
where:
—Represent the technical coefficient matrix of the whole economy because it defines the technology of all the individual industries. It is unitless.
—Represent all the elements of the technical coefficient matrix, . The technical coefficient matrix consists of the technology matrix for each of the industries in the economy. Hence, for an industry where its technology matrix is given by elements of the matrix . These elements are all the products and services (for example, raw materials, machinery, energy, goods, transport, services, etc.) required from its own and all other industries in the economy, which enables that industry to produce a unit of output.
Hence, from Equation (3):
where is the diagonalised . In a generalised form: .
Therefore, from Equation (2) where: , it follows that: . Solving for and expressing in matrix notations:
Matrix is the identity matrix and is known as the Leontief inverse matrix, [76].
The implication of the expansion of the Leontief Inverse Matrix is that the complete supply chain requirement at any tier can be evaluated given that:
, therefore, describes the total (direct and indirect) requirements that are needed at all tiers of the industrial supply chain by an industry to produce a unit of output.
Acquaye and Genovese et al. [77] explain that capturing the direct and indirect requirements at all supply chain tiers ensures complete supply chain visibility, a key requirement in supply chain modelling [78].
The Leontief Inverse Matrix expression presented in Equation (5) does not capture the multi-country nature that the conceptual framework in Figure 3 seeks to uphold. In addition, it has not yet been integrated with Value Added factors. The following sub-section, therefore, addresses these issues.
4.2. Multi-Regional Perspective of Value Added Activities
Following on from Equation (4), an MRIO of the UK and global South countries can be defined as a framework that captures the inter-relationship and represents the dependencies between the countries in a single system, as highlighted by the conceptual GVC model in Figure 2.
The technical coefficient matrix (see Equation (3)) with dimensions of these nations can thus be presented below:
Including ROW within the framework as presented in Equation (6) is because of the fact that the UK, as well as Cameroon, Cote d’Ivoire, Ghana, Nigeria and Senegal, are not closed economies to all other countries in the world. Hence, the model considers the fact that there are also resource flows (products and services) between all other countries from the Rest of the World (ROW) region and these countries.
From Equation (5), the Leontief Inverse matrix with dimension can be structured in Equation (7) as:
4.3. Assessments of MRIO-Based Value Added Effects of the Industrial Supply Chain
Value Added is a commonly used measure of economic performance in terms of value-addition activities [79]. Using this indicator, the study evaluates the value additions as a result of the final demand for goods and services of each industry in each of the countries. The following sub-sections present the developments made in this respect.
4.3.1. Industrial Value Added Intensities
As previously explained in Section 4.2, the IO model (as in the Leontief framework in Equation (7)) is transformed to assess the Value Added activities by integrating it with Value Added factors.
Let:
—Represent the direct Value Added output for any industry in each of the countries. It has a dimension of .
Given that is the total industry production output expressed in million $, the direct intensity matrix for Value-Added of any industry is given by:
Equation (8) highlights the dependences between the industry of a country in terms of its output and capital and labour as resources. Equation (8), therefore, provides a measure of the direct Value Added intensity of an industry. This is a limited measure and does not account for any upstream value added activities of the industrial supply chain. This is because only measures the value added intensity of an industry from a production-based perspective [80], meaning that only the value added activities that occur within the fixed boundary of a country from an industry’s direct activities are assessed.
for all the industries put together takes the form of a row matrix with dimension of . Based on Equation (5), given that the Leontief Inverse Matrix represents both the total (i.e., direct and indirect) activities of the industrial supply chain, the Total Intensity Matrix in terms of Value Added intensities is therefore expressed in Equation (9) as:
Expressing Equation (9) in the structure adopted in this paper for the BRICS and ROW framework, the Total Intensity Matrix with the dimensions is presented as the supply chain industrial efficiencies as defined in Equation (10) as:
Contrary to the Direct Intensity Matrix in Equation (8), the Total Intensity Matrix provides a complete assessment of the supply chain Value Added Intensities from a consumption-based perspective [80]. This shows the dependencies and enables a complete visibility of the entire supply chain to be assessed; hence, value added activities from other countries are used but indirectly as inputs along supply chains located in other regions or directly as intermediate requirements of a particular industry in the reference country can be captured [81,82].
4.3.2. Total Value Added as a Result of Final Demand
The final demand for goods and services determines the absolute Value-Added to a country’s economy. In IO economics, these final demand groups are made up of households, government, stocks, gross fixed capital formation and exports [83].
Given that describes the total (i.e., direct and indirect) Value Added intensity (refer to Equations (9) and (10)), the Value Added in absolute terms as a result of a given final demand for goods and services can be expressed as:
Expressing Equation (11) in the structure of the conceptual framework yields the Effective Value Added with dimension , as presented in Equation (12):
4.4. Data Source
The MRIO model was constructed using both global MRIO tables and Value Added data collected from the latest Global Trade Analysis Project (GTAP) database version 9 [84]. The MRIO table used in this study consisted of UK data and that of Cameroun, Cote d’Ivoire, Ghana, Nigeria, Senegal and an aggregation of the Rest-of-the-World (ROW) data with reference year of 2011. The IO table in each country includes 57 economic sectors.
5. Results and Discussion
5.1. Value Addition as a Measure for Socio-Economic Sustainability
Value addition has been recognised as a socio-economic sustainability enabler, particularly for developing countries [85], because it presents growth opportunities that can translate into real economic development and social benefit.
This section provides insight into the GVC between the global North (UK) and the global South (developing markets of sub-Saharan Africa: Cameroon, Cote d’Ivoire, Ghana, Nigeria and Senegal). In particular, it assesses if there are any uneven contributions of embodied capital and labour in the GVCs between the UK (used as an exemplar global North country) and the listed African countries in the global South. Given the dependence of countries from the global South, particularly in sub-Saharan Africa, on primary industries such as agriculture, forestry, fishing and mining, this research also seeks to understand the nature of the net embodied labour and capital flows between the global North and global South. These analyses would shed light on the equitability of using GVCs as an enabler of sustainable development, particularly in the global South regions. Capital and labour are chosen as the value added indicators used in this study because they represent the two main measures of value addition [86] and because the choice of capital is inherently connected with the choice of other factors, labour in particular [87]. In fact, within GVC networks, labour and capital are production factors that generate value added activities. Therefore, Labour and capital are used as two independent variables in measuring value added activities, so causal relationships between these independent variables are not examined. Embodied capital and labour are indirect capital and labour within international trade flows of goods and services under a given structure of production.
In economic theory and practice, value addition represents an important indicator that can be used for socio-economic sustainability performance [88,89,90]. For instance, the World Business Council for Sustainable Development [91] reported on how IO modelling of economic value added can be used as a basis to calculate the impact that companies have on a particular national economy and, therefore, help companies predict loyalty, performance, stability, and capacity for growth of suppliers, distributors and retail partners as well as identifying vulnerabilities and opportunities to address these issues. This section of the paper, therefore, presents the results of the analytical study by drawing on the theoretical model and discusses whether there is an equitable sustainability case to be made in terms of the level of value addition (Capital and Labour) that the UK a global North country has on the economies of Cameroon, Cote d’Ivoire, Ghana, Nigeria and Senegal.
The net labour and capital value-additions between the UK and the respective countries were compared on an industry-to-industry basis since it provides a better basis to compare like-for-like, given that each industry is inherently unique. In addition, comparing the combined net effect for all industries together obscures the finer details of the net exchanges and so limits the insightful inferences that could be made.
5.1.1. Measuring Capital Value Addition between UK (Global North) and Listed Global South Countries
Capital goods are already-produced, and non-financial goods or assets are used to produce other goods or services [92]. Capital goods underpin modern industrial activity [93]. In addition, a country’s productivity depends on its access to capital goods from around the world [94]. As such, measuring the embodied capital flows in the GVC between the UK on each of Cameroon, Cote d’Ivoire, Ghana, Nigeria and Senegal would provide insight into the net capital value addition between the UK and the other countries. This thus provides a proxy for measuring socio-economic sustainability as highlighted by using capital as a value added indicator [88,89].
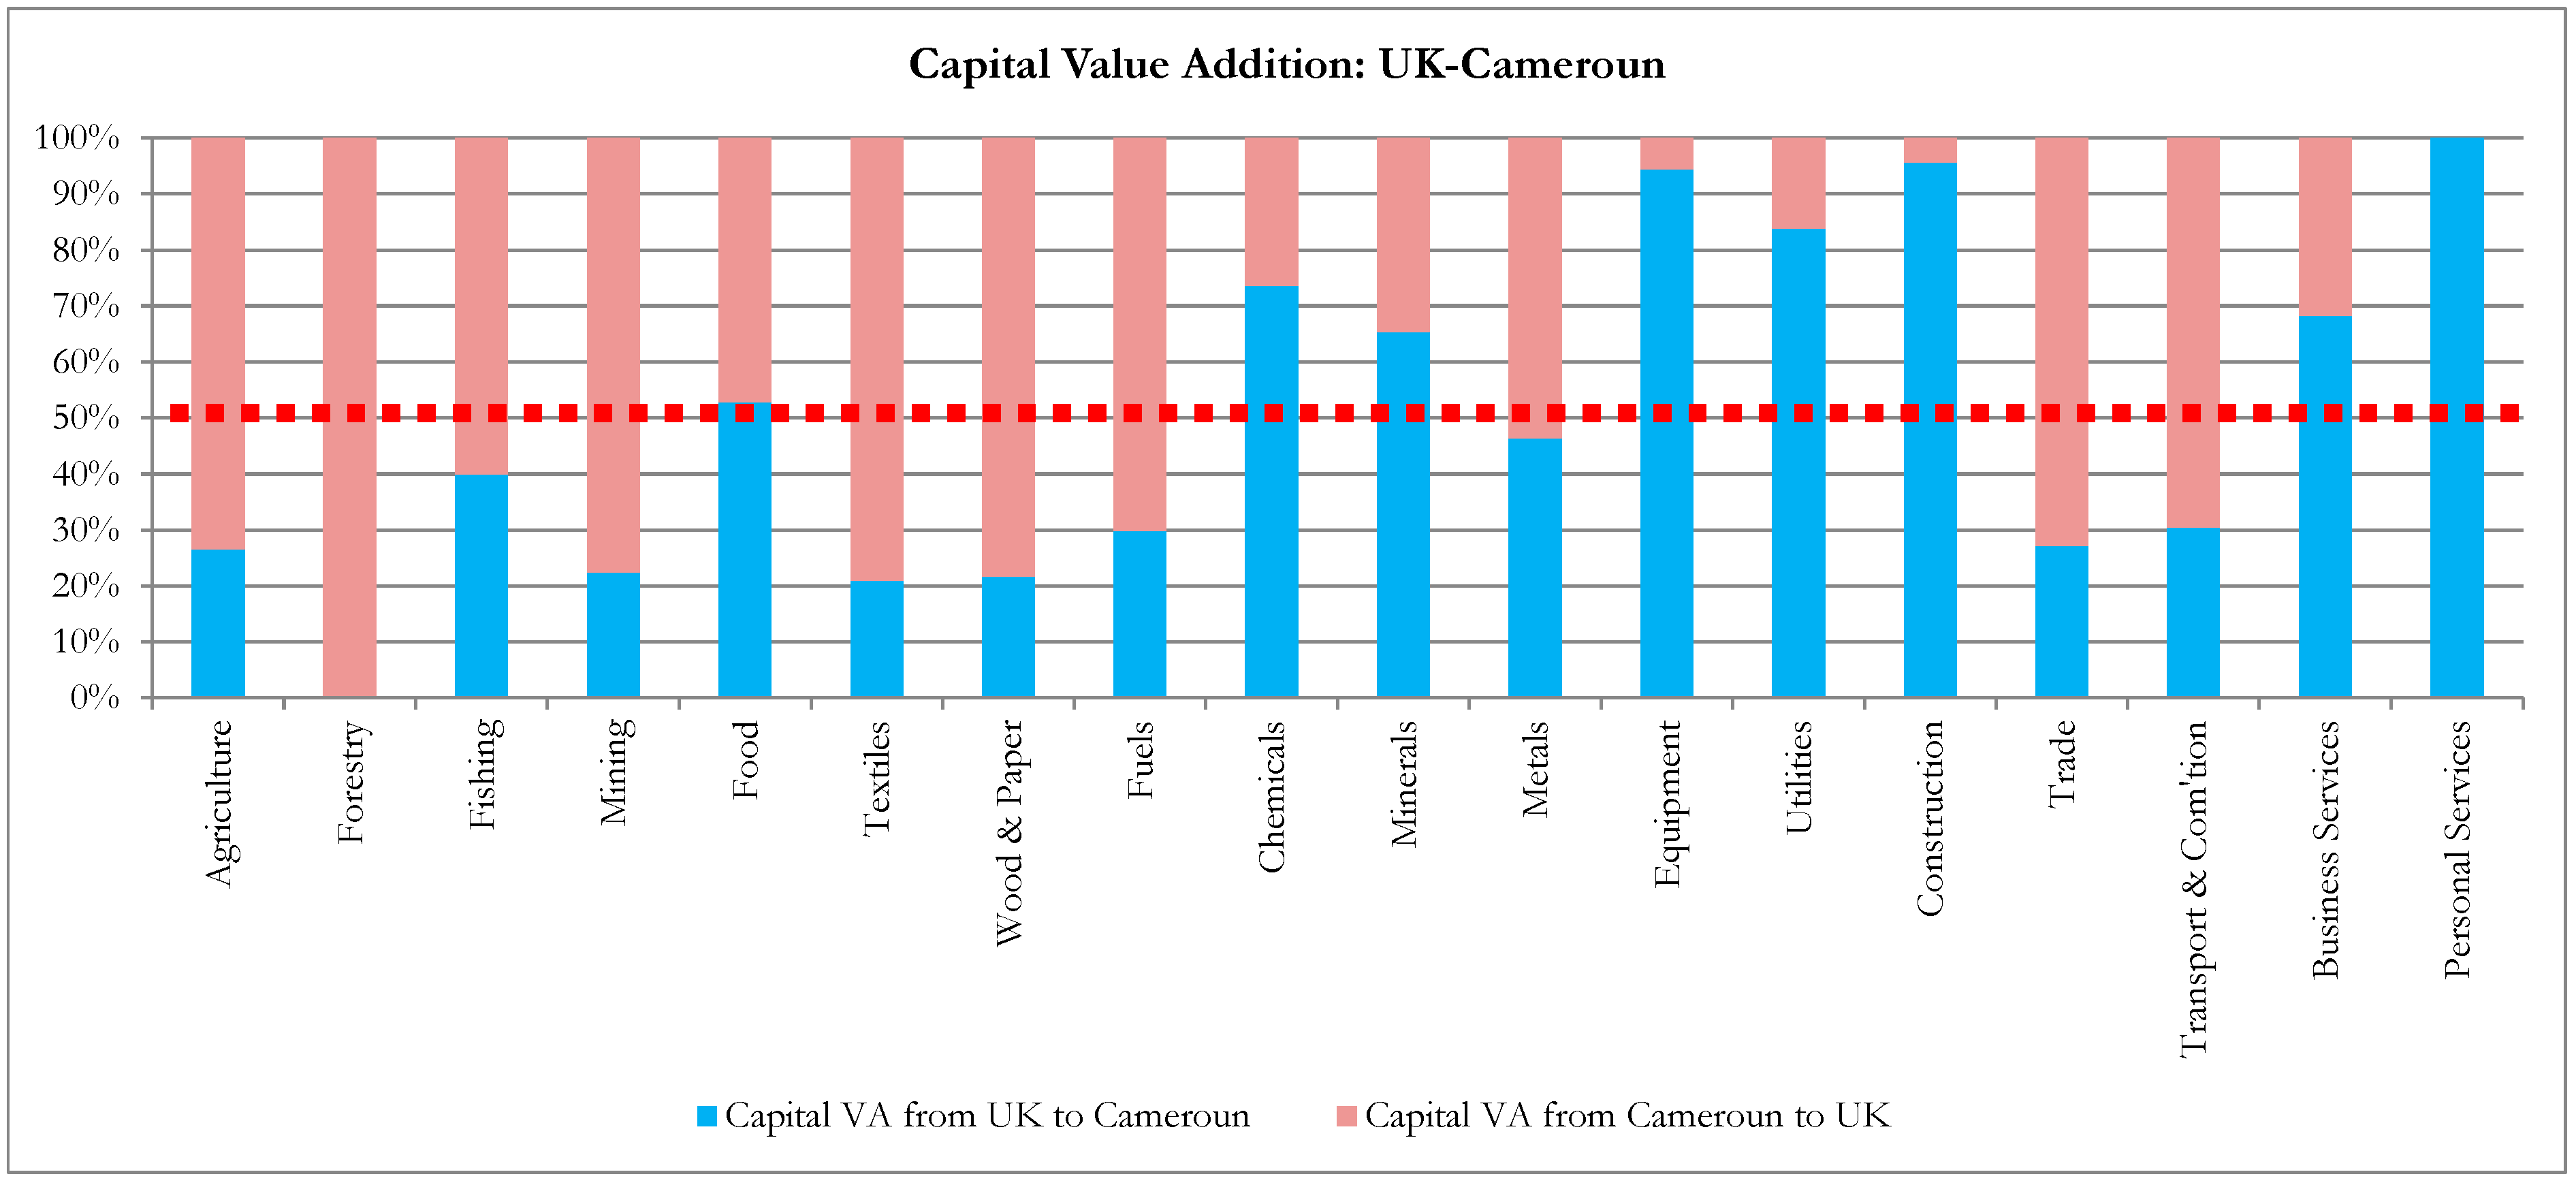
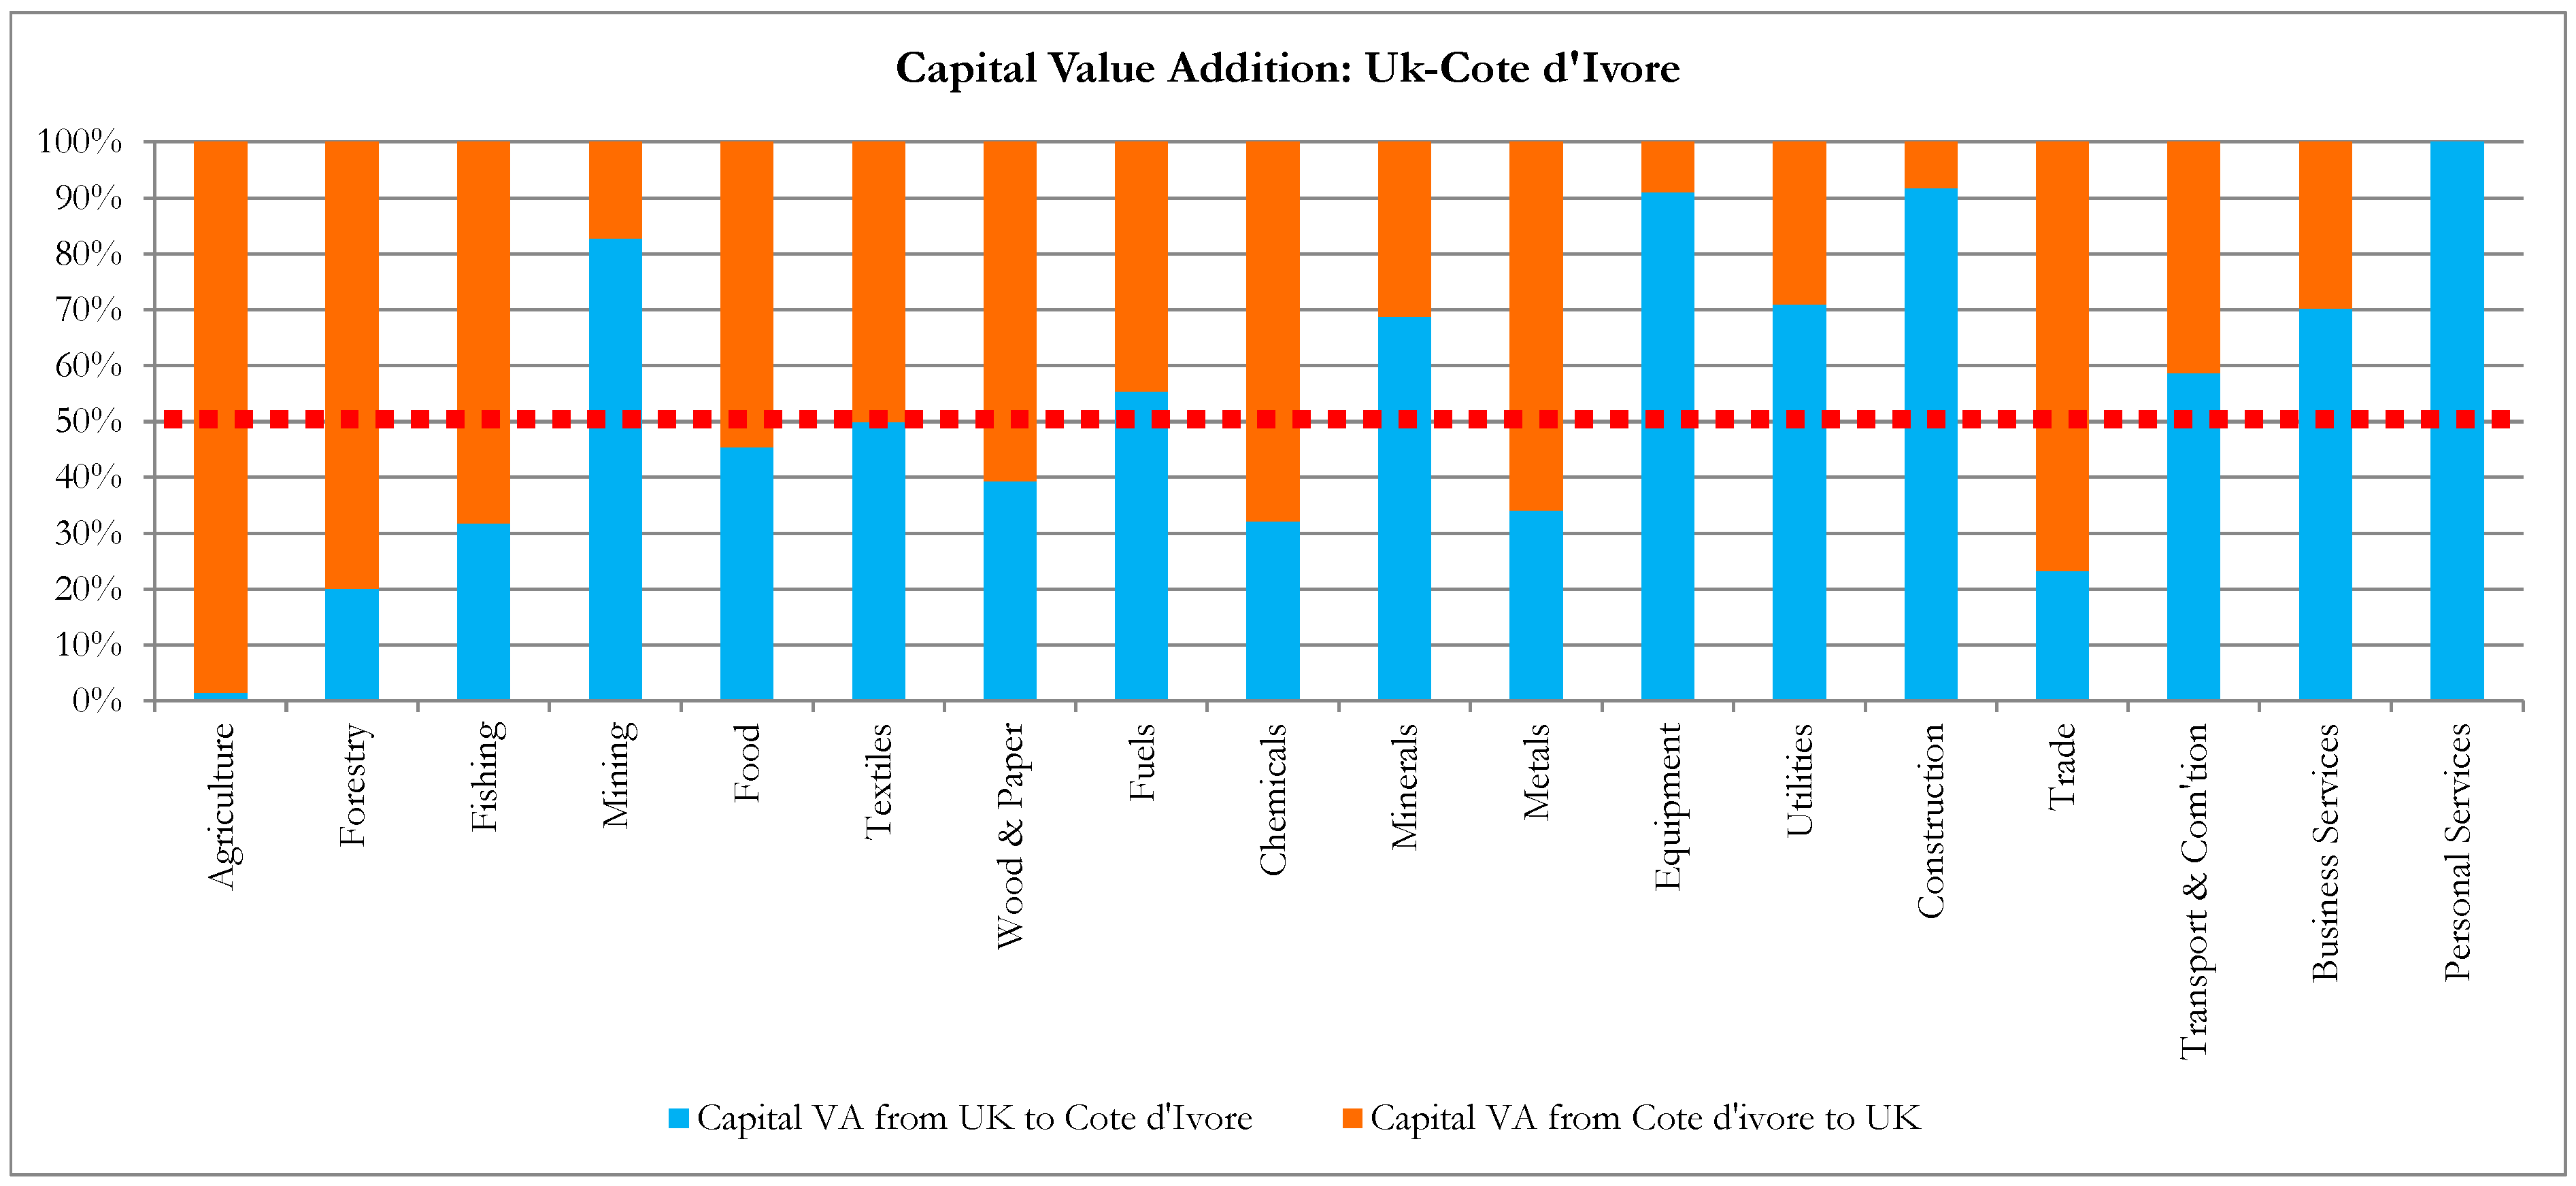
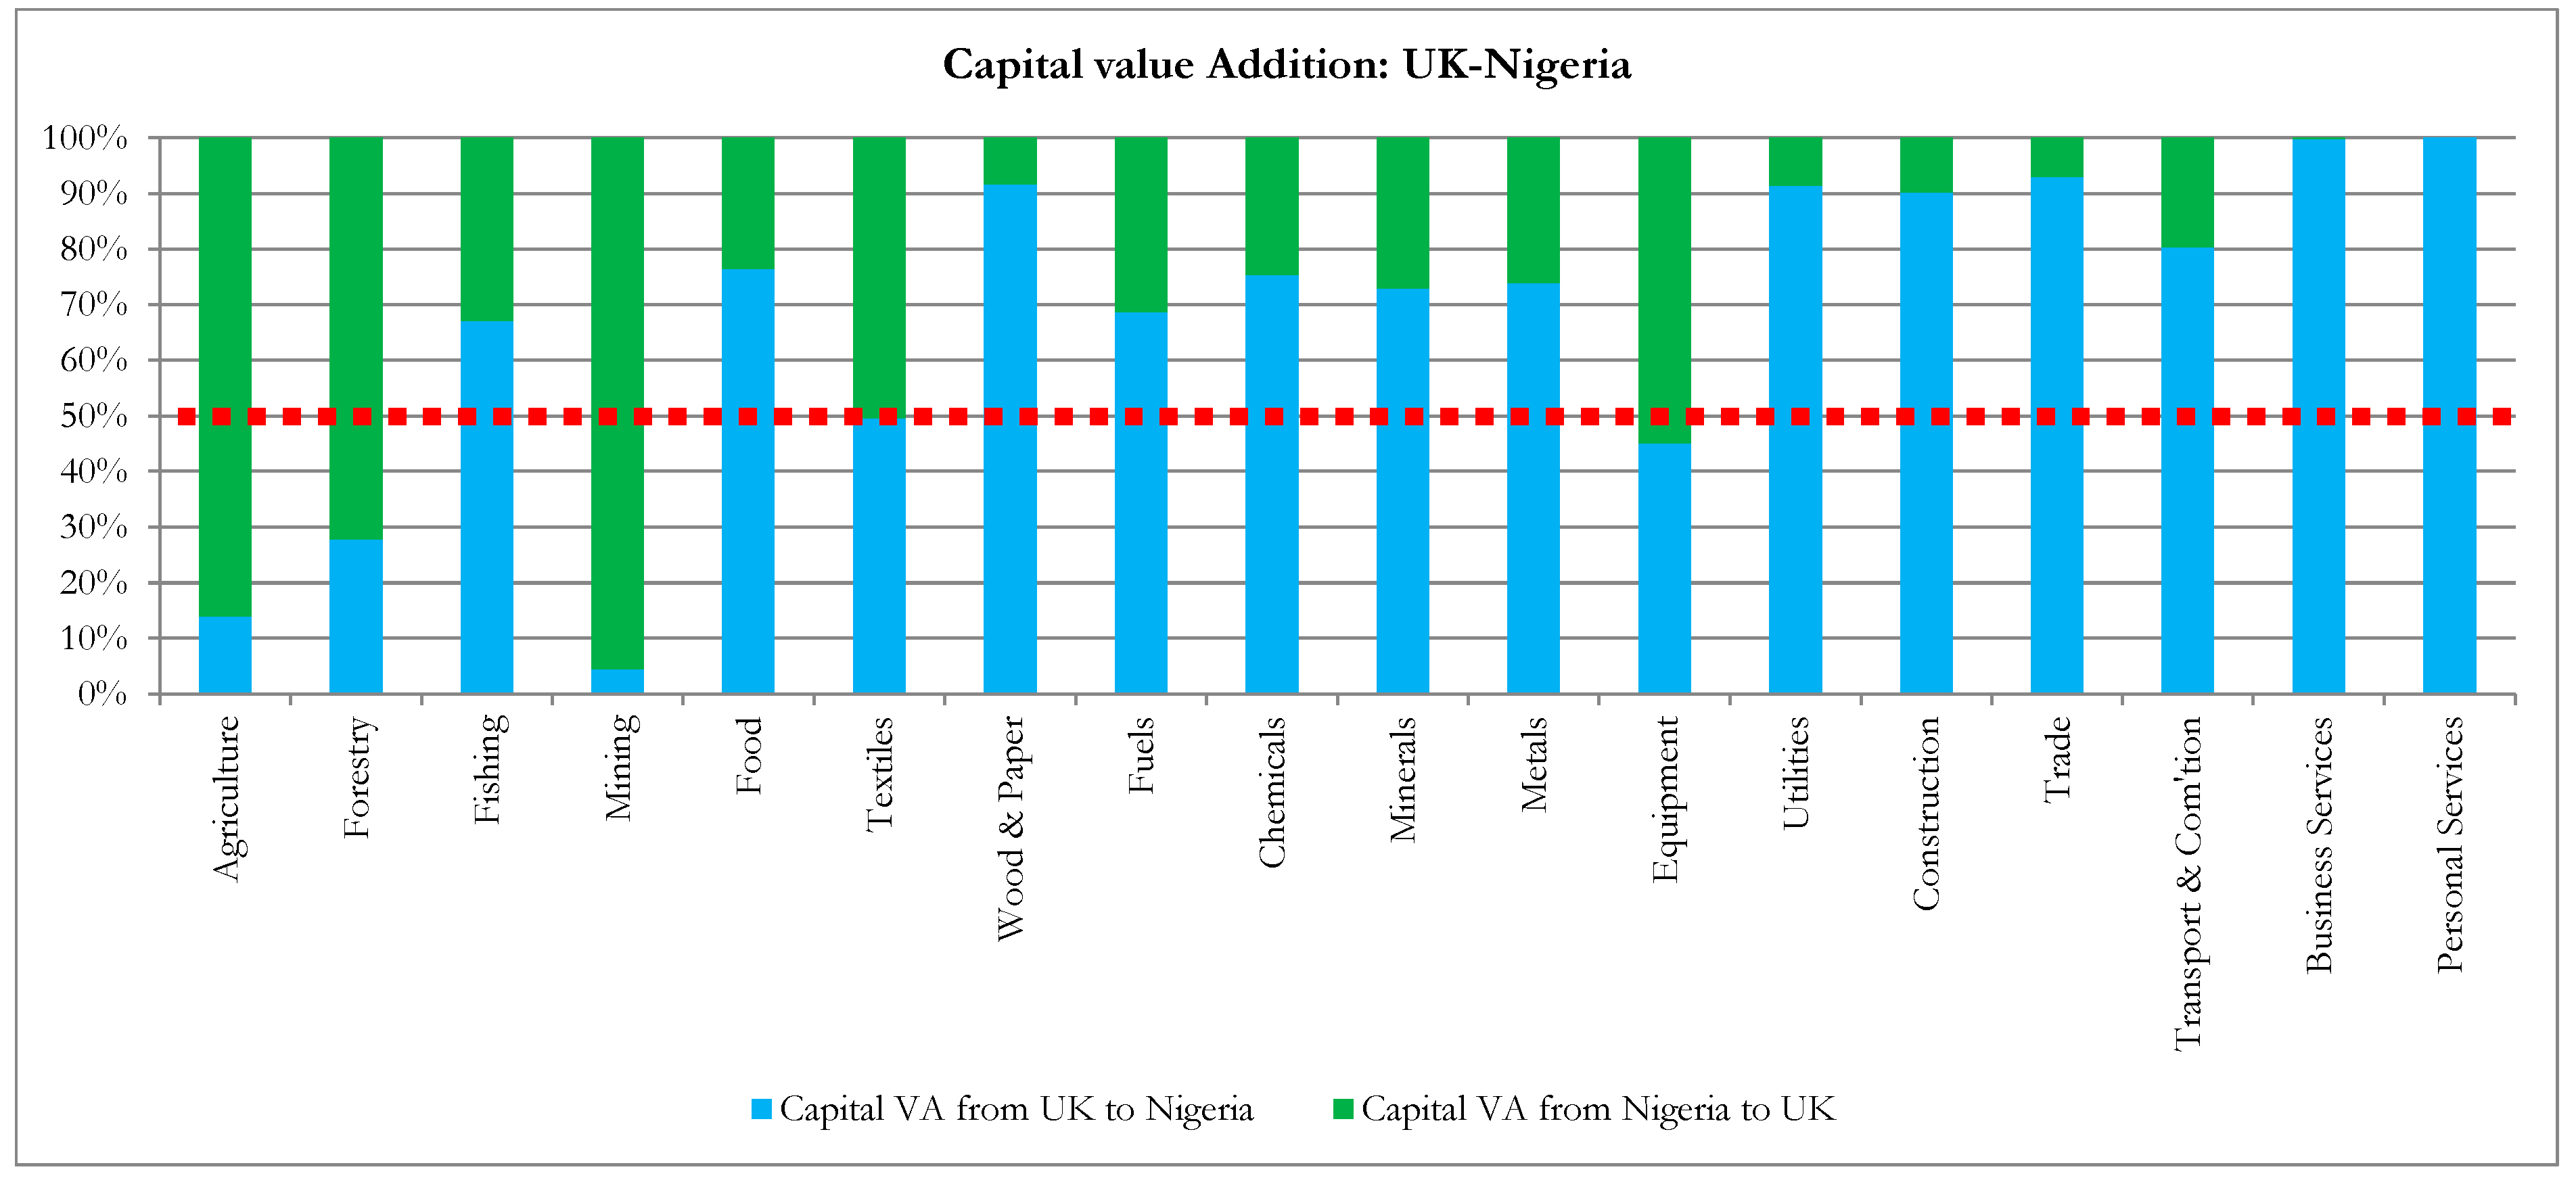
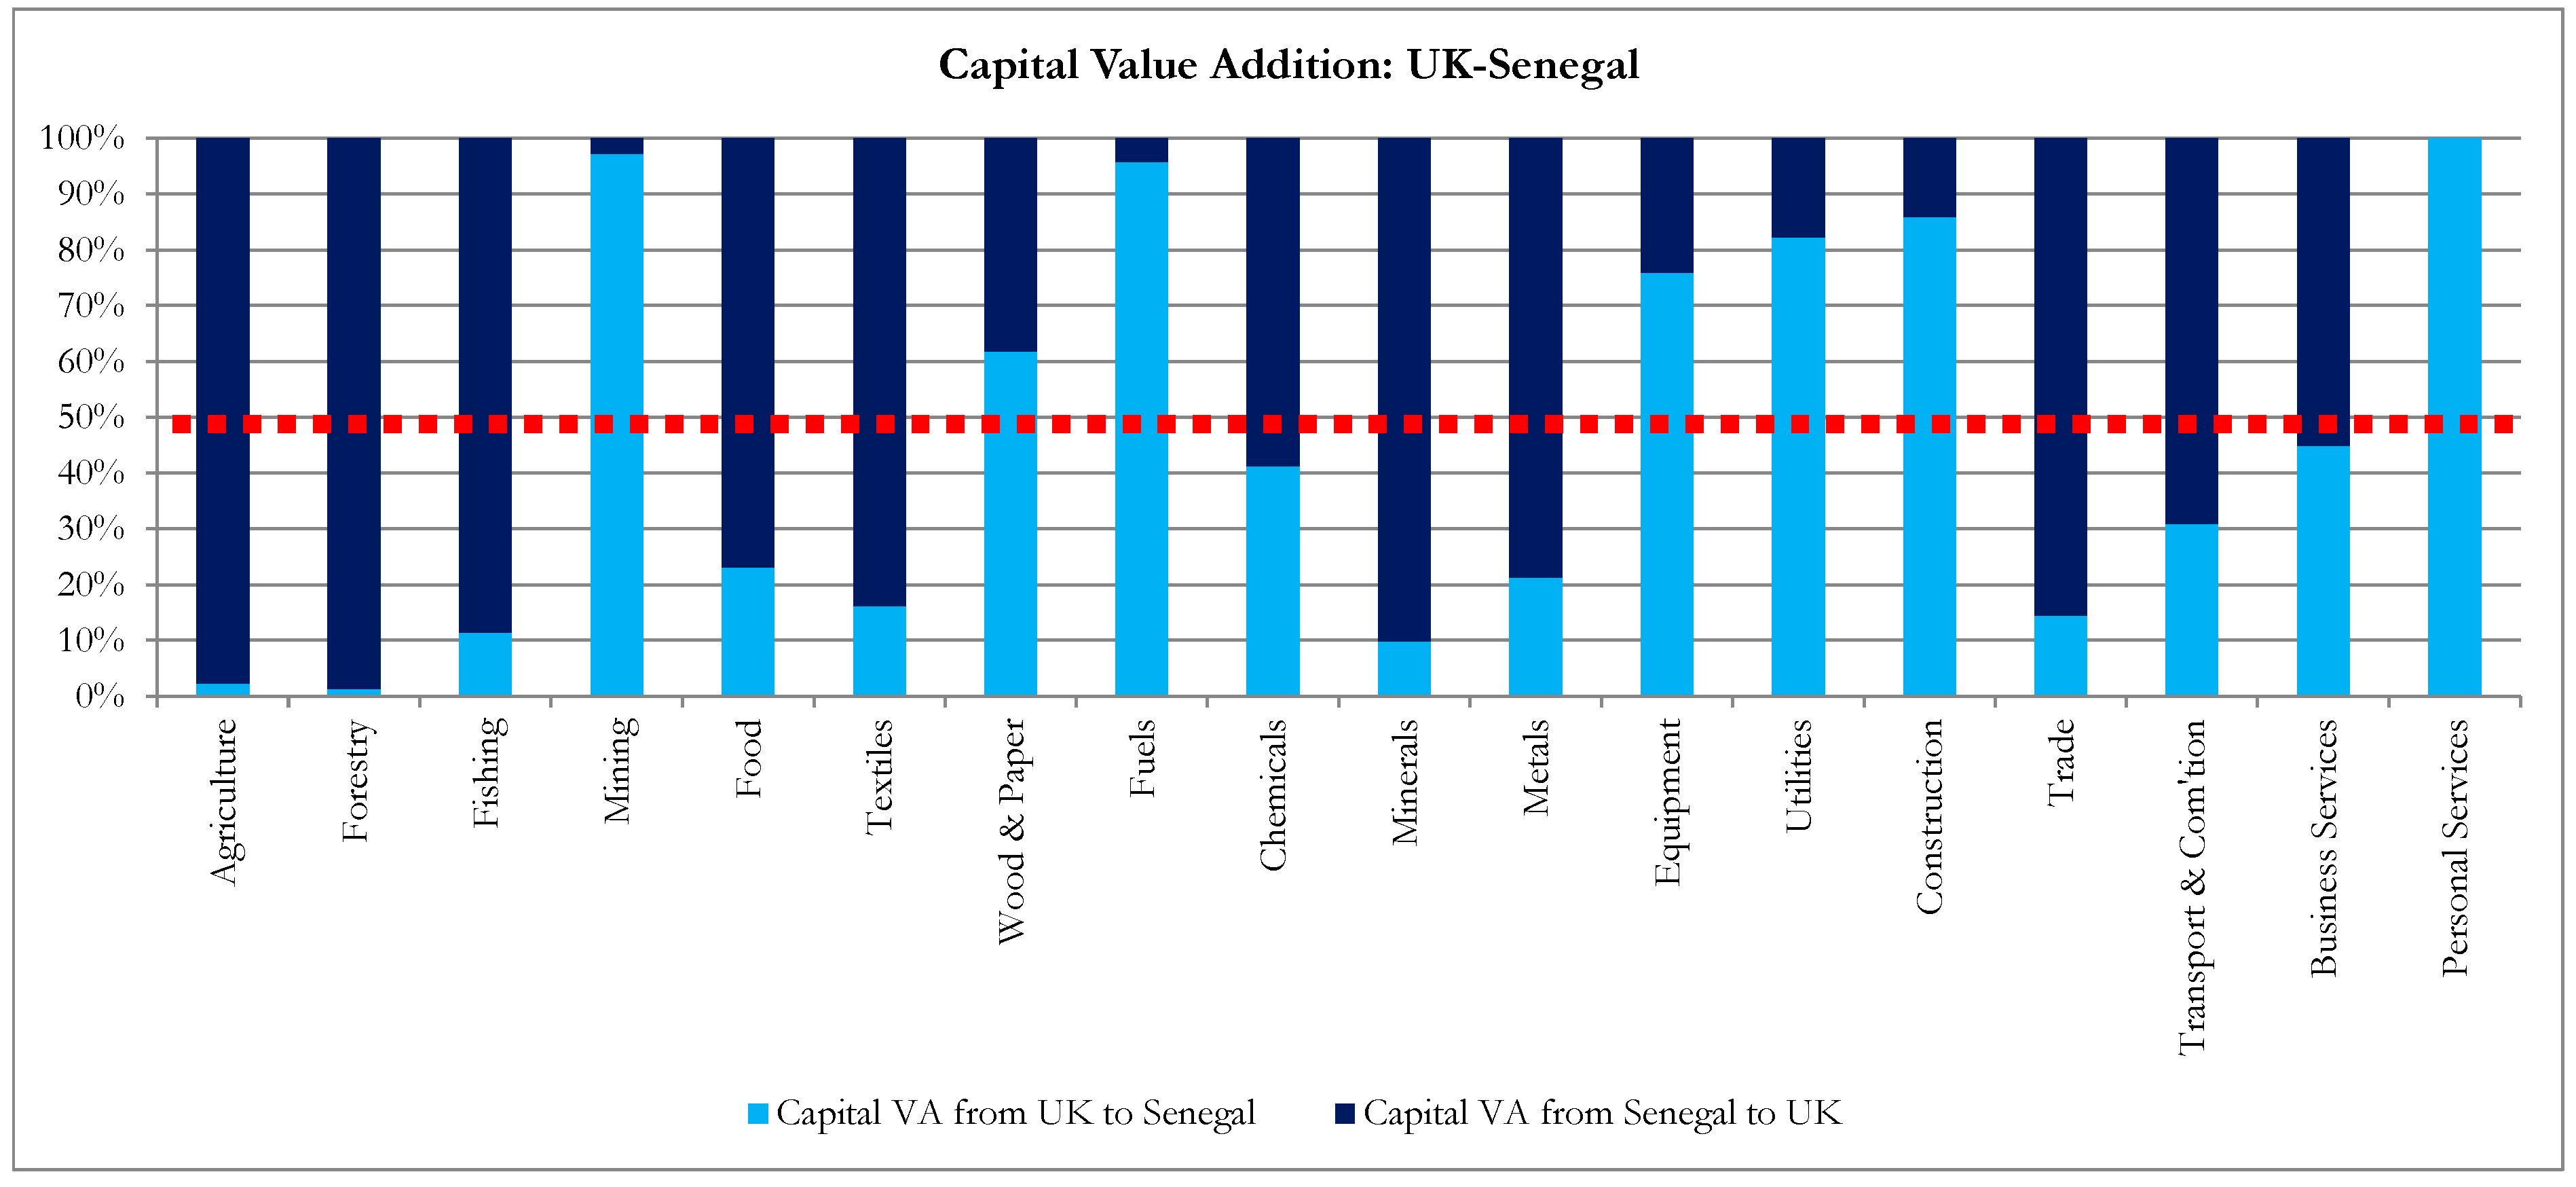
For ease in presenting the results, the economy of each of the nations, which consists of 57 sectors in the dataset, was aggregated to 18 broader GVC market segments, namely agriculture, forestry, fishing, mining, food, textiles, wood and paper, fuels, chemicals, minerals, metals, equipment, utilities, construction, trade, transport & communication, business services and personal services. The 57-to-18 sector mapping is presented in Appendix A. Following this, the net capital value addition between the UK and listed countries was evaluated as the difference between that of the UK (the reference country) and that of the listed countries to determine any disproportionate value added flows.
According to the three-sector theory, sector numbers 1–4 represent the primary industries, 5–14 are the secondary industries, and 15–18 are the tertiary or service industries.
It can be observed from Table 1 that in the primary industries (i.e., industries concerned with obtaining or providing natural raw materials for conversion into other commodities and products for the consumer) represented by Agriculture, Forestry, Fishing and Mining, there is a greater flow of embodied capital from the listed countries to the UK than vice versa. This is so particular for the agricultural-based industries of Agriculture, Forestry and Fishing. The only exception is the embodied capital flow in the fishing industry between the UK and Nigeria. There is a negative net embodied capital in the GVC between the UK and the listed countries for all others. Accordingly, it can be argued that the listed African countries in the global South generally provide more embodied capital value added, a measure of sustainability contributions to the global North, than vice versa.

Table 1.
Net Capital Value Added between the UK and the listed countries [millions of dollars ($)].
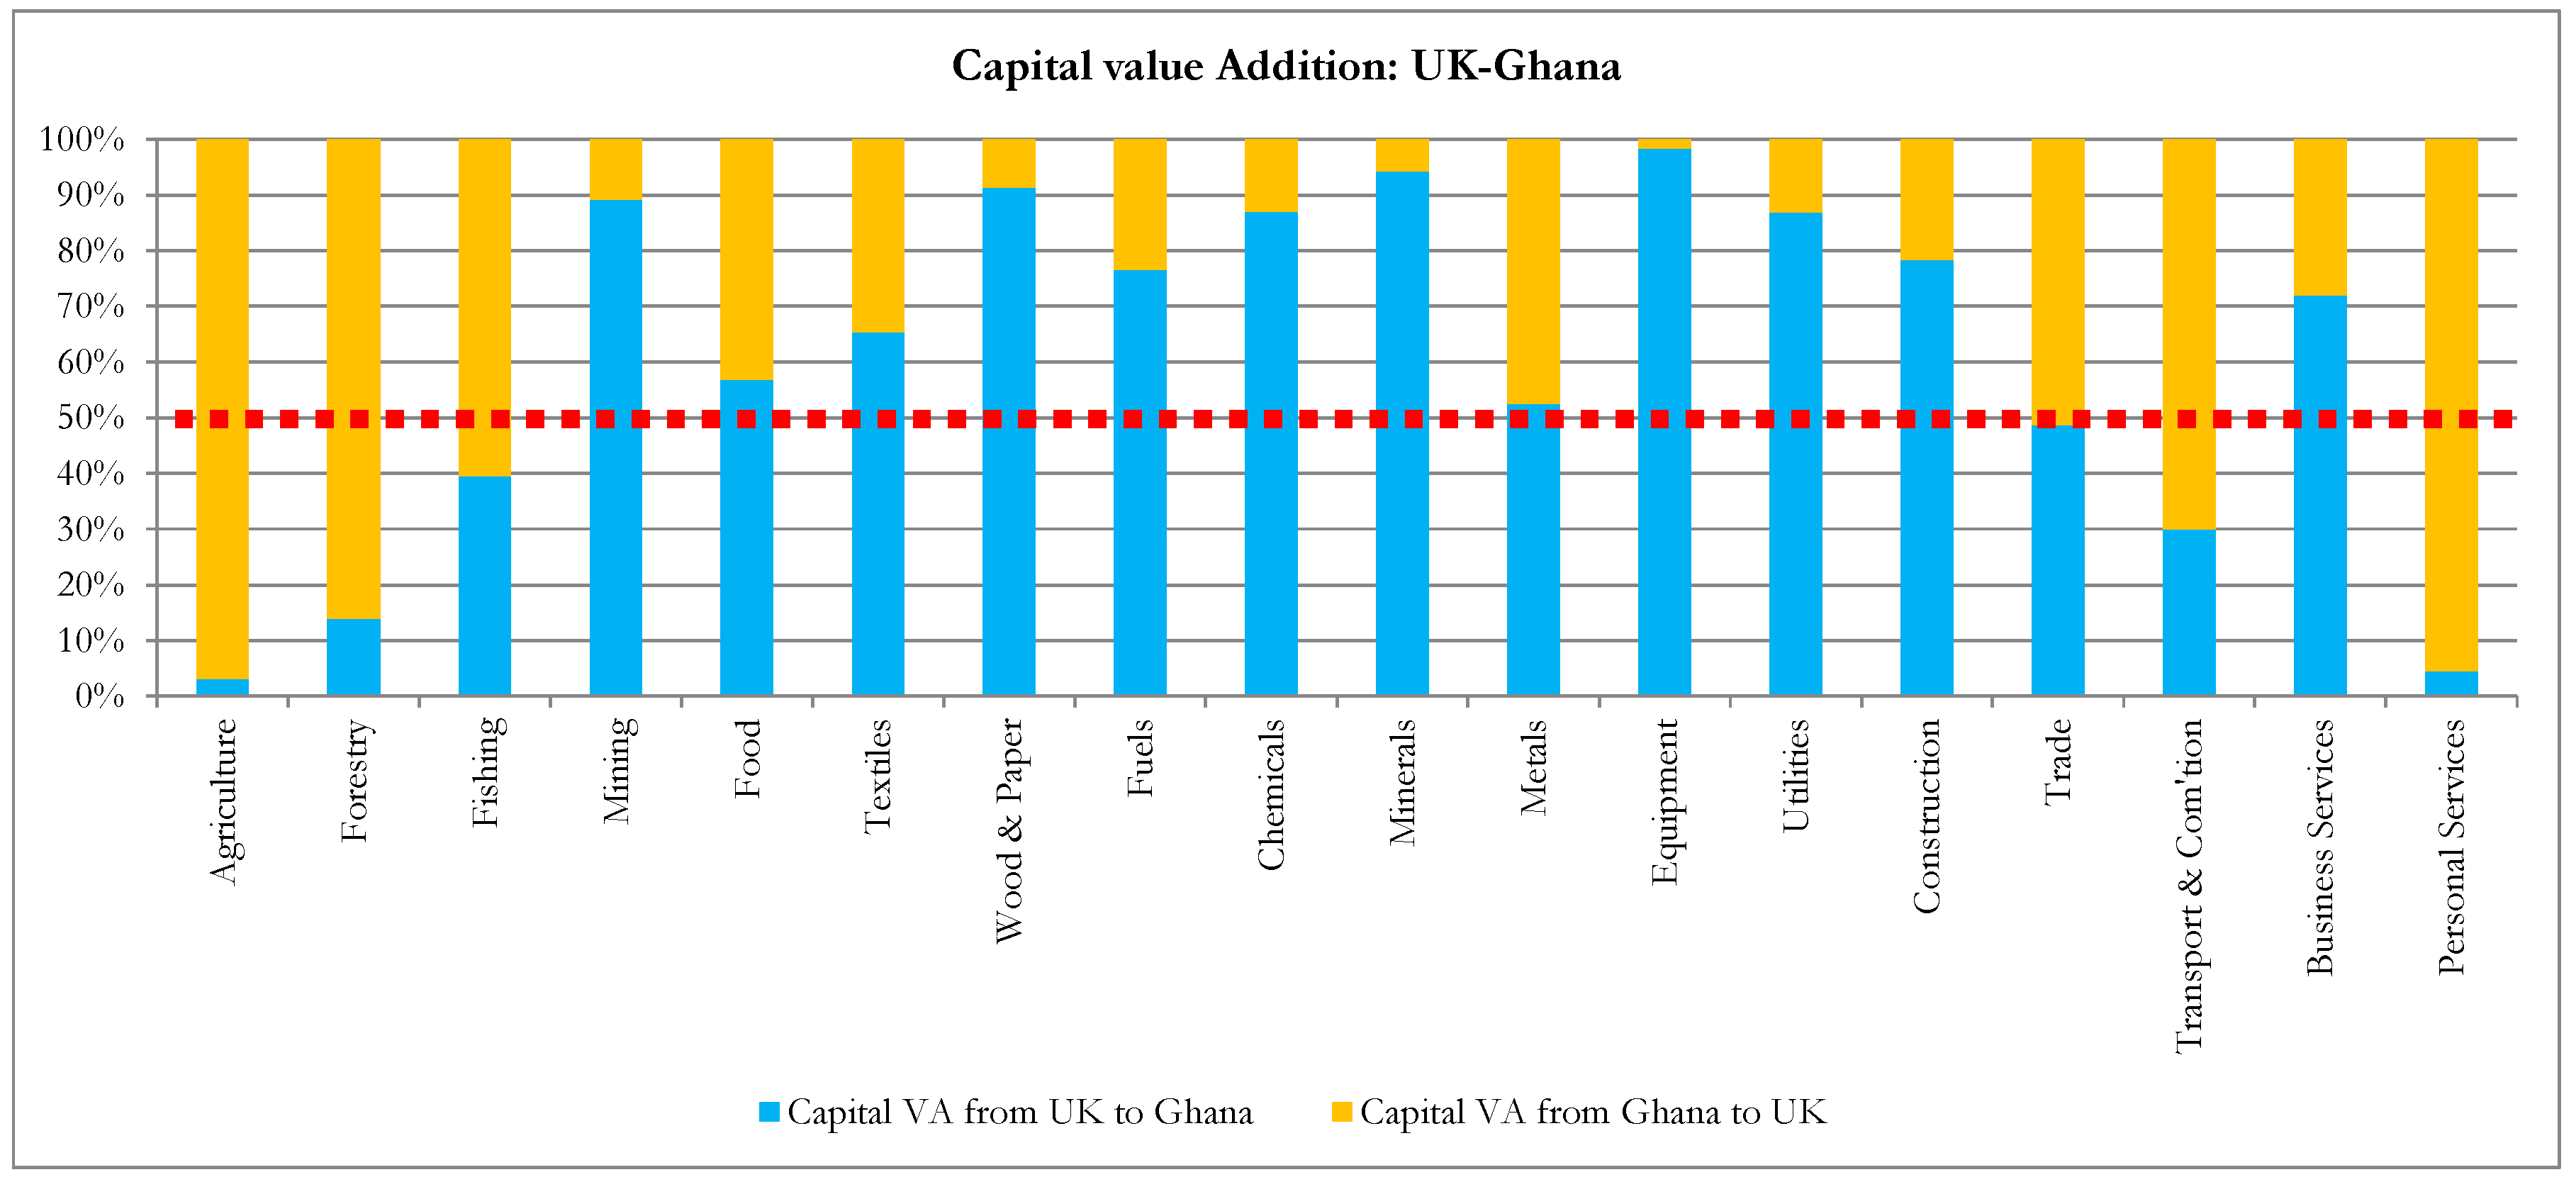
For example, in the case of the UK and Ghana, as seen in Figure 4, when the relative percentage embodied capital in the GVC is compared for the agricultural-based industries of Agriculture, Forestry and Fishing, the UK contributes 3.09%, 13.93% and 39.57% respectively to Ghana as opposed to 96.91%, 86.07%, 60.43% from Ghana to the UK. For a country where 60% of the workforce depends on agriculture [95], an enhanced contribution of embodied capital to the agricultural-based industries would no doubt improve the economic development and social upscaling of the country. Refer to Appendix B for the capital value added results for Cameroun, Cote d’Ivoire, Nigeria and Senegal.
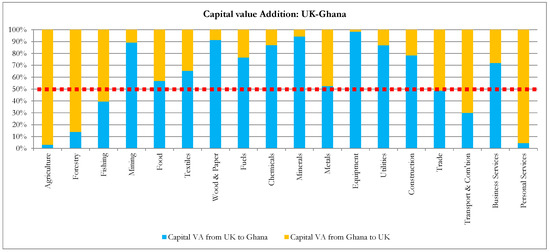
Figure 4.
Relative Capital Value Added between the UK and Ghana expressed as a percentage.
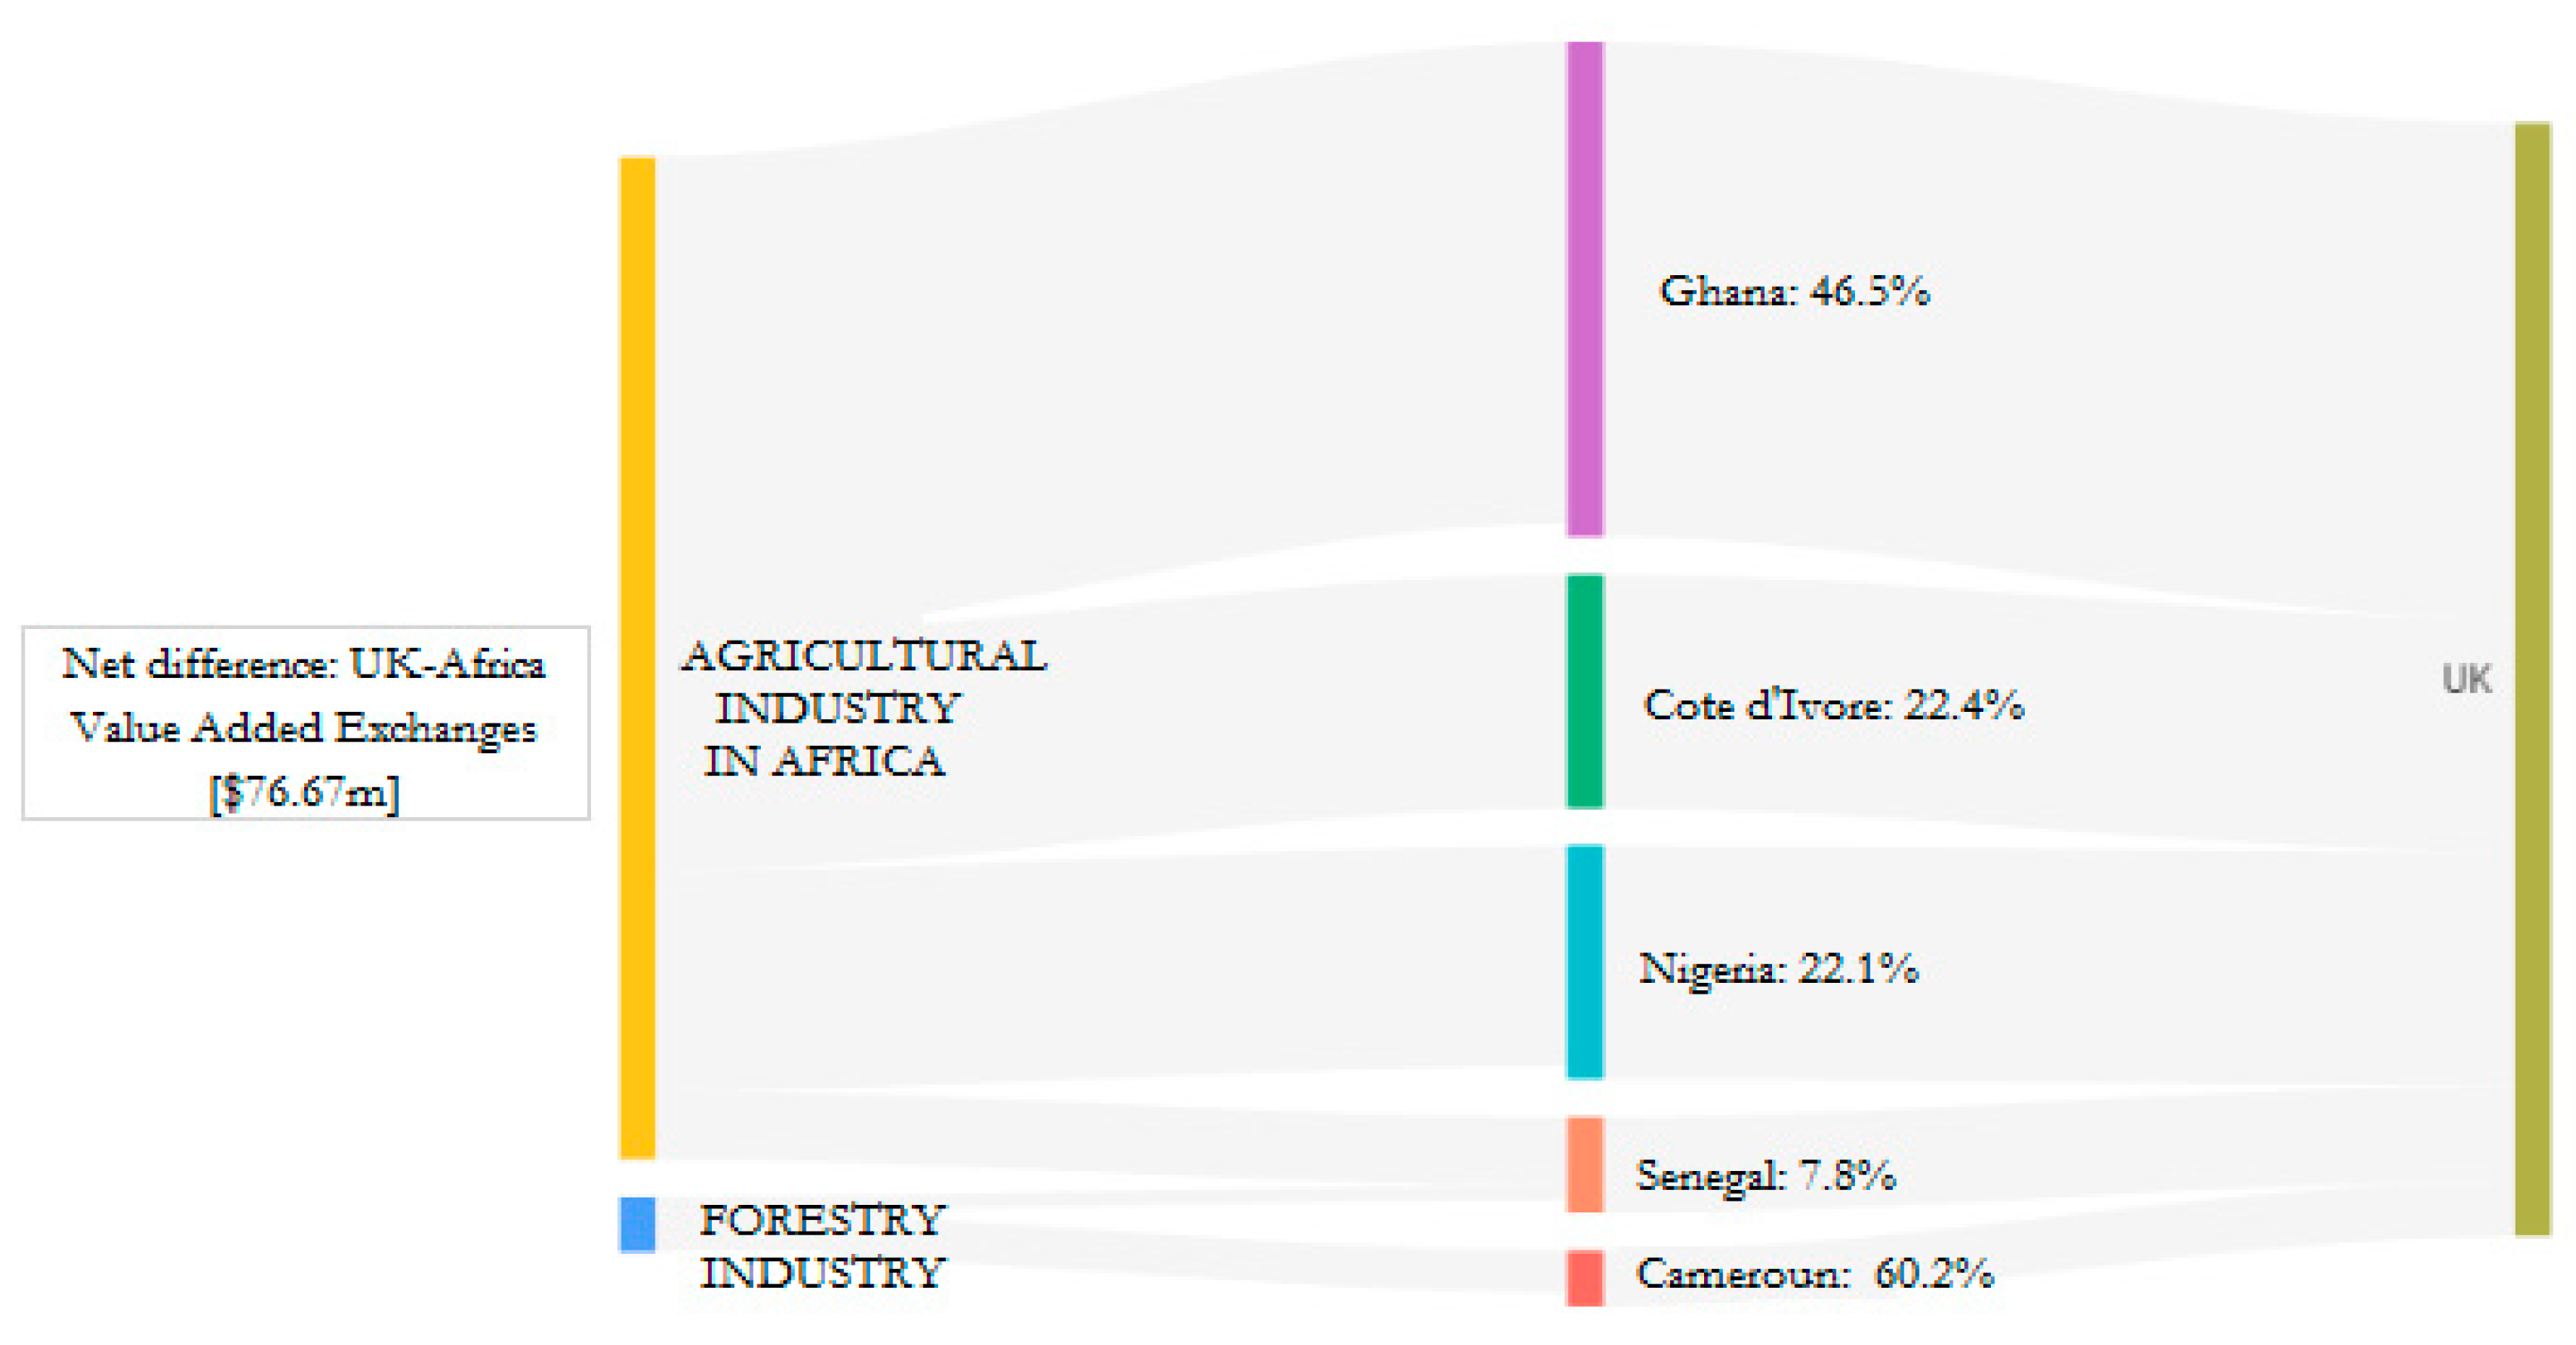
The Sankey diagram in Figure 5 shows the relative net embodied capital in the GVC between the UK and the African countries for the agriculture-based industries (Agriculture, Forestry and Fishing). Within this context, the total net difference of value addition amounted to $76.67 million, of which Ghana contributed the largest, 46.5%, and Cameroun accounted for 1.2%. For the forestry industry, Cameroun (60.2%) contributed the largest proportion to the relative net capital value added between the UK and the African countries. For most of these sub-Saharan African countries where around 60% (Ghana as an example) of the workforce depends on agriculture [95], an enhanced contribution of embodied capital to the GVCs of the agriculture-based industries would no doubt improve the economic development and social upgrading of the region.

Figure 5.
Relative Net Capital Value Added between the UK and the African countries.
Given the disproportionate contributions of embodied capital, in particular, in the agricultural-based industries, it can be reported that the global North stakeholders contribute less to capital value added activities in the developing markets of the global South, in particular in the primary industries. This results in a limited value added socio-economic sustainability support in relative terms received from the global North by the global South in what can be described as an unbalanced stakeholder benefit or inequitable contribution towards sustainable development in favour of the global North.
5.1.2. Measuring Labour Value Addition between the UK (Global North) and Listed African Countries (Global South)
A further analysis was performed by measuring flows of embodied labour between the UK and the other global South nations, that is, Cameroon, Cote d’Ivoire, Ghana, Nigeria and Senegal. With labour as the other fundamental production factor [96], this provided a further proxy for measuring socio-economic sustainability, as highlighted by using labour as a value added indicator [88,89].
For ease in presenting the results, the same sector aggregation utilised in Section 5.1.1 was employed (based on the 57-to-18 sector mapping presented in Appendix A). Following this, the net embodied labour in the GVCs between the UK and listed global South countries was evaluated as the difference between that of the UK (the reference country) and that of the listed countries to determine any uneven value added flows.
It can be observed from Table 2 that, similar to the case of embodied capital flows, there is a greater flow of embodied labour from the GVCs in the primary industries of the listed global South countries to the UK than vice versa. In particular, for the agricultural-based industries (Agriculture, Forestry and Fishing), there is always a negative net labour value addition between the UK and the listed countries. As such, it can be argued that the listed African countries in the global South generally provide more embodied labour value added sustainability contributions to the global North than vice versa.
Table 2.
Net Labour Value Added between the UK and the listed countries [million $].
These disproportionate contributions of labour value addition, in particular in the agricultural-based industries, further reinforce the fact that the global North stakeholders contribute less to value added activities in the developing markets of the global South in what can also be described as an unbalanced stakeholder benefit or inequitable contribution towards sustainable development in favour of the global North.
5.1.3. Similarity in Embodied Net Capital and Labour Value Added Flows
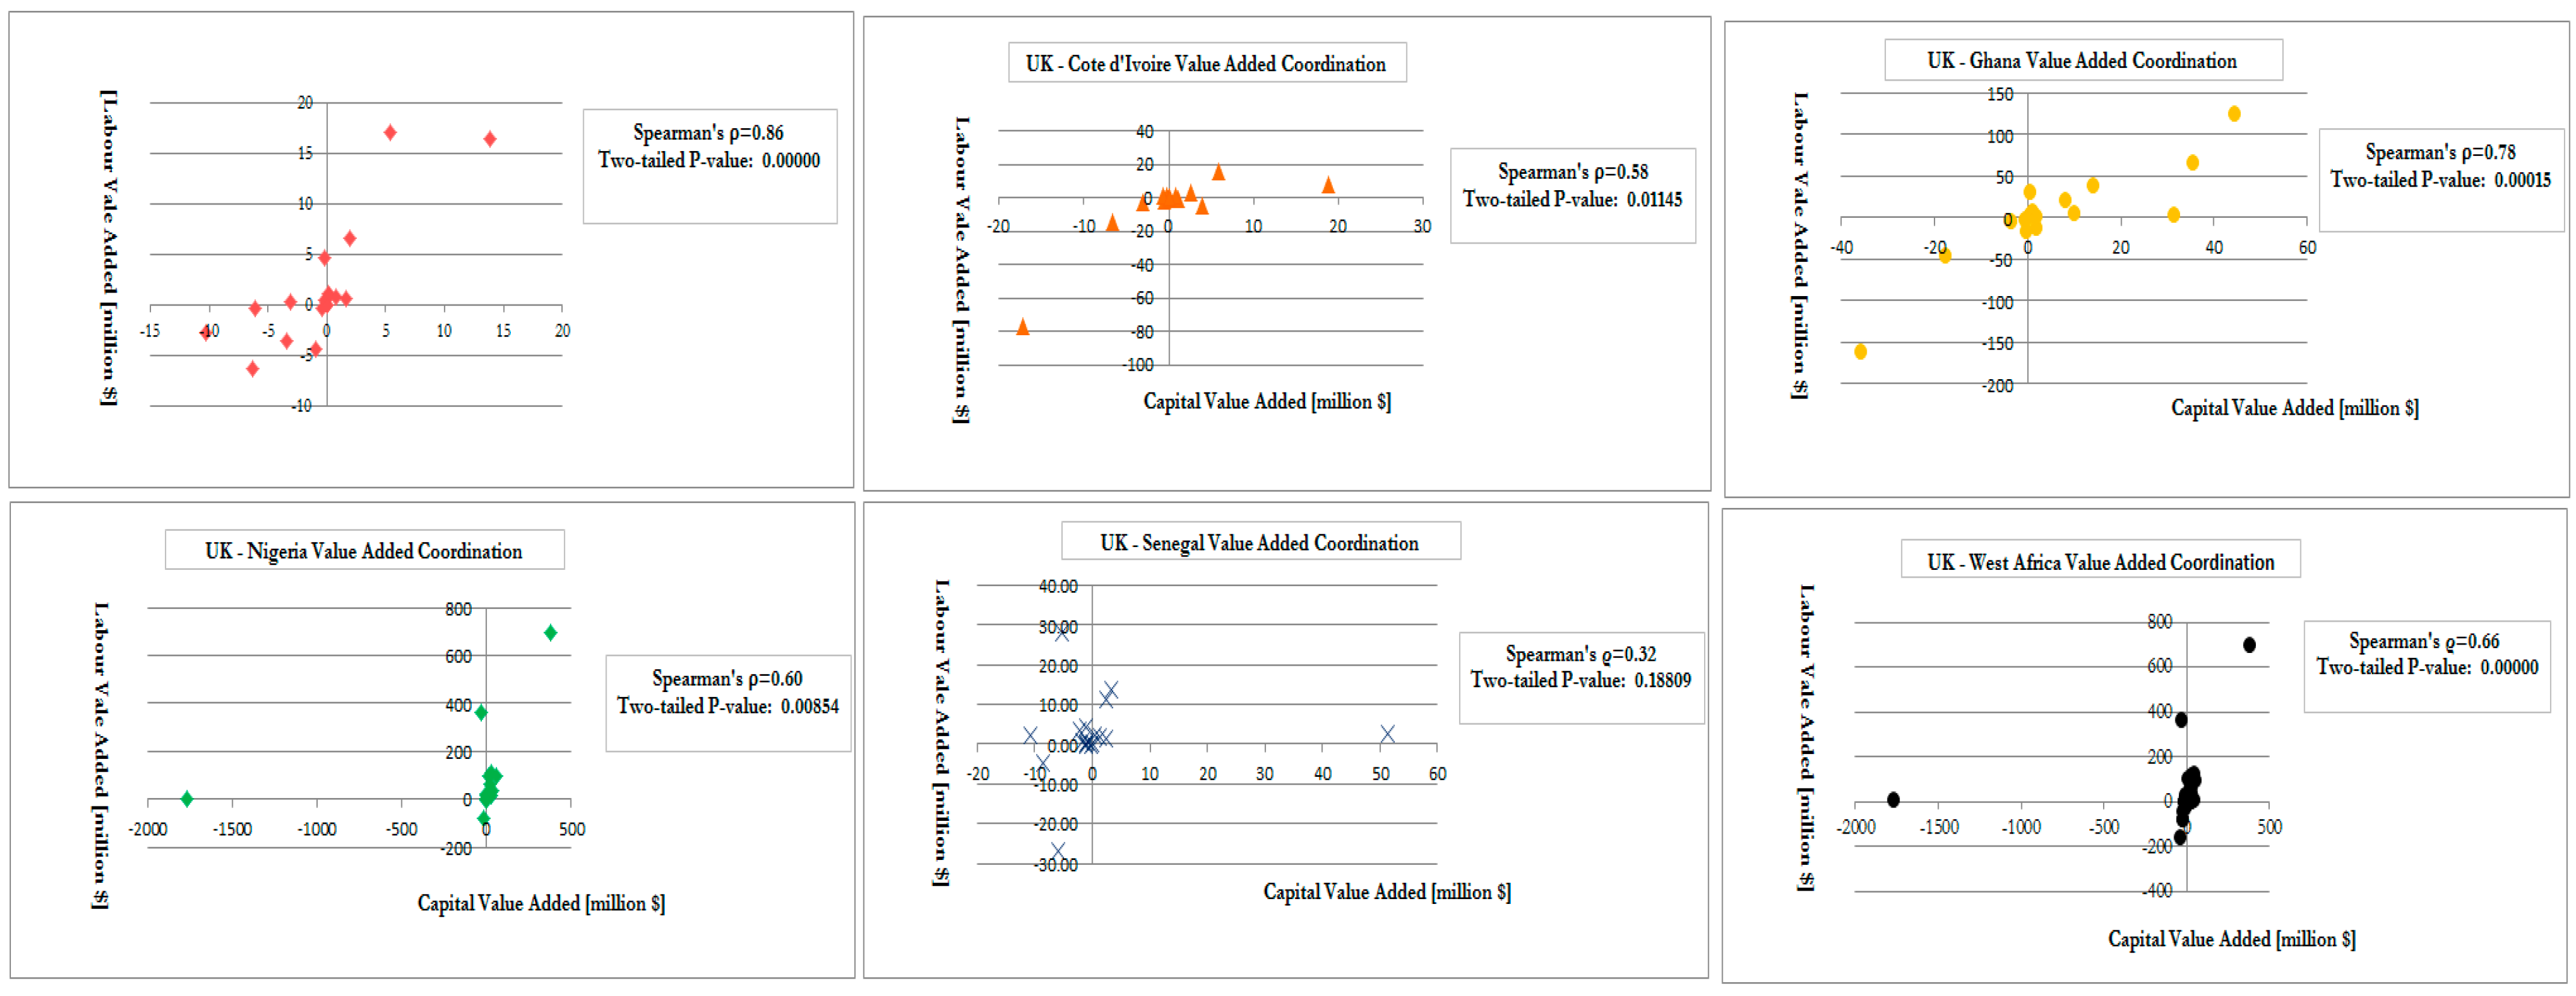
In order to determine if there are any similarities between the effects of net embodied capital value added flows and net embodied labour value added flows between the UK and the listed global South African countries across each of the 18 industrial sectors analysed, a Spearman Rank Correlation analysis [97] was conducted. This analysis provides a statistical measure of the strength of the association between the two value added variables across the 18 industrial sectors. In so doing, we are able to understand whether any inequitable contribution of net embodied value added flows for either labour or capital affects specific sectors more than other sectors.
The output for Ghana, as an example, indicates that the Spearman’s Rho, , and the two-tailed value of p is 0.0015. This indicates that the association between the two variables, embodied capital and labour value added flows, is statistically significant. The implication is that the net embodied labour and capital flows in the value chains appear to be very coordinated, so the impacts from these two variables on the 18 industrial sectors are similar. This is contrary in the case of Senegal with a Spearman’s Rho, and the two-tailed value of p is 0.18809, which is greater than the significance level of 0.05, which indicates that embodied capital and labour value added flows are statistically not significant.
This is particularly so in the agricultural-based industries. Capital and Labour Value Added Coordination for each country is presented in Figure 6.
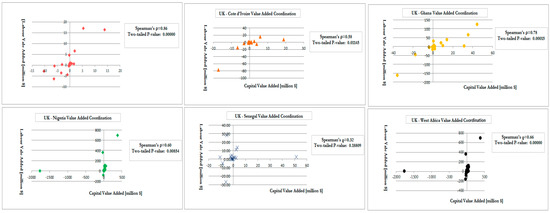
Figure 6.
Similarity Analyses in Embodied Net Capital and Labour Value Added activities for each of the listed countries across all industries.
5.2. Discussion and Research Implications
There are two key theoretical implications of this research. First, our study introduces a conceptual GVC model, which is then tested to account for the effects of integrating different nations in the global South and North for sustainability-oriented GVC analyses. In so doing, our study highlights some of the key dynamics and production effects in integrating such countries. In addition, although the essence of a collaborative engagement by stakeholders within a supply chain to create value additions is well articulated in academic literature (see, for instance, [98,99,100,101,102], harnessing stakeholders’ interests and relationships to promote value addition initiatives that engender sustainable production and consumption, particularly in developing markets remains a huge research challenge [103,104,105]. We, therefore, seek to contribute to research developments on these issues using cross-disciplinary themes of GVC and Stakeholder Theory applied at the industry levels. We, therefore, contribute to the literature on GVC [5,70] by developing and testing a GVC model on the potential implications of integrating global South and North. Thus, our study advances our understanding of global value chain co-creation dynamics. In addition, the study has theoretical implications for studies on sustainable production and consumption. For instance, combined strands of research themes consisting of value creation, sustainability management and stakeholder theory provide sound theoretical solutions to sustainable production and consumption challenges. This also builds on the model by Hörisch and Freeman et al. [106], which proposed education, regulation and sustainability-based value creation as an integrative remedy to the same challenge.
From a practical and policy standpoint, there are some issues worth noting. Value added flows from the global North to the South, for instance, in the African regions, can be improved with increased investment flowing from the global North to the South. Despite compelling reasons from stakeholders’ perspectives to include Africa, many nations still face some impediments. First, one of the pivotal factors retarding development and hampering firms’ ability to connect to the GVC is the poor infrastructure due to limited investments. Policy directives should seek to address these practical impediments. This impedes business activities and transcontinental logistics networks [107,108]. Despite the economic growth in the last decade in Africa [107], many nations, including those in the study, often lack efficient transportation networks connecting railways, airports, cities and towns, and warehouses, coupled with a lack of reliable water and electricity supply [109]. Indeed, the continent’s infrastructure requires between $130–170 billion a year, with a financing gap ranging from $68 to $108 billion [107]. Accordingly, firms’ ability to capture the location-specific advantages of African nations is diminished. In this direction, developing an efficient transportation network is essential for countries to tap into the GVC network and ensure a more equitable distribution of sustainable development. Without such robust infrastructural development through investment support from the global North, the key motives for economic and social upscaling through the GVC are undercut. It is also important for countries in the global South to develop their secondary and tertiary industries in order to enhance the production and service value additions they deliver to their economies beyond relying on primary industries such as agriculture.
5.3. Limitations and Future Research
Despite the key contributions to the literature outlined above, this research has some noteworthy limitations. First, despite the methodologically consistent structure the IO analysis offers, it is known to suffer from a number of limitations, such as IO data not being very recent as it is not regularly produced. As such, these may not capture any significant structural changes and technological advances that may have taken place with the economy. Acquaye et al. [110] and Lenzen et al. [111] have also explained how IO analysis may suffer from inherent limitations because of aggregation, homogeneity and proportionality assumptions. Our study is also limited in scope in the sense that it focuses on a few global South (Cameroon, Cote d’Ivoire, Ghana, Nigeria and Senegal) and the global North (UK). Future research could seek a much bigger sample, which extends beyond sub-Saharan countries to include, for instance, the whole of Africa and the European Union.
6. Conclusions
The paper conceptually developed and empirically tested a GVC model to measure some implications of the economic activities within the GVC in terms of embodied flows in capital and labour between the UK, a global North country and the global South countries of Cameroon, Cote d’Ivoire, Ghana, Nigeria and Senegal. Understanding these issues enables us to gain some insight to ascertain whether there are any negative economic implications exhibited through inequitable sustainable development by integrating global North and South countries within the GVC network. Our study, therefore, advances our understanding of the dynamics and implications of GVCs. Results from the study indicate that there are disproportionate contributions of embodied capital and labour value added flows, particularly in the agricultural-based primary industries, from the global South to the global North and vice versa. Indeed, products in their raw forms from the primary industries, such as agriculture, have limited value as opposed to when it is processed in the secondary industries as high-value intermediate goods or final products. Therefore, the value-added benefits for the global South from these primary industries are limited. A structural change in the economies through the industrialisation of these global South countries can help speed up the sustainable development agenda. The results show that global South countries deliver less value from the secondary and tertiary industries within the GVC. Thus, global North stakeholders are advantaged through value added benefits they derive in the developing markets of the global South, particularly from the secondary and tertiary industries. It is recommended that countries in the global South must develop their secondary and tertiary industries in order to enhance the production and service value additions these industries deliver to their economies beyond their reliance on the primary industries.
Theoretically, the GVC model presented accounts for the effects of integrating different stakeholders and nations in the global South and North for sustainability-oriented GVC analyses. In so doing, we highlight some of the key dynamics, stakeholders, and production effects in integrating such countries in the GVC and advance our understanding of the global value chain co-creation dynamics.
Author Contributions
Conceptualization, A.A.A. and F.A.Y.; methodology, A.A.A. and T.I.-M.; formal analysis, A.A.A., F.A.Y. and T.I.-M.; data curation, A.A.A. and E.Q.; writing—original draft preparation, A.A.A., F.A.Y. and T.I.-M.; writing—review and editing, A.A.A., F.A.Y., T.I.-M., E.Q. and D.E.Y.; visualization, E.Q. All authors have read and agreed to the published version of the manuscript.
Funding
This research received no external funding.
Institutional Review Board Statement
Not applicable.
Informed Consent Statement
Not applicable.
Data Availability Statement
The data supporting and used in this study is available from the corresponding author upon reasonable request.
Conflicts of Interest
The authors declare no conflict of interest.
Appendix A
Table A1.
Sector Mapping.
Table A1.
Sector Mapping.
| No. | Disaggregated Sectors | Economic Markets | 3 Sector Theory |
|---|---|---|---|
| 1 | Paddy rice | 1: Agriculture | Primary Industries |
| 2 | Wheat | ||
| 3 | Cereal grains nec | ||
| 4 | Vegetables; fruit; nuts | ||
| 5 | Oil seeds | ||
| 6 | Sugar cane; sugar beet | ||
| 7 | Plant-based fibers | ||
| 8 | Crops nec | ||
| 9 | Bovine cattle; sheep and goats; horses | ||
| 10 | Animal products nec | ||
| 11 | Raw milk | ||
| 12 | Wool; silk-worm cocoons | ||
| 13 | Forestry | 2: Forestry | |
| 14 | Fishing | 3: Fishing | |
| 15 | Coal | 4: Mining | |
| 16 | Oil | ||
| 17 | Gas | ||
| 18 | Minerals nec | ||
| 19 | Bovine meat products | 5: Food | Secondary Industries |
| 20 | Meat products nec | ||
| 21 | Vegetable oils and fats | ||
| 22 | Dairy products | ||
| 23 | Processed rice | ||
| 24 | Sugar | ||
| 25 | Food products nec | ||
| 26 | Beverages and tobacco products | ||
| 27 | Textiles | 6: Textiles | |
| 28 | Wearing apparel | ||
| 29 | Leather products | ||
| 30 | Wood products | 7: Wood and Paper | |
| 31 | Paper products; publishing | ||
| 32 | Petroleum; coal products | 8: Fuel | |
| 33 | Chemical; rubber; plastic products | 9: Chemical | |
| 34 | Mineral products nec | 10: Mineral | |
| 35 | Ferrous metals | 11: Metal | |
| 36 | Metals nec | ||
| 37 | Metal products | ||
| 38 | Motor vehicles and parts | 12: Equipm’ts | |
| 39 | Transport equipment nec | ||
| 40 | Electronic equipment | ||
| 41 | Machinery and equipment nec | ||
| 42 | Manufactures nec | ||
| 43 | Electricity | 13: Utilities | |
| 44 | Gas manufacture; distribution | ||
| 45 | Water | ||
| 46 | Construction | 14: Construction | |
| 47 | Trade | 15: Trade | Tertiary Industries |
| 48 | Transport nec | 16: Transport | |
| 49 | Water transport | ||
| 50 | Air transport | ||
| 51 | Communication | ||
| 52 | Financial services nec | 17: Business Services | |
| 53 | Insurance | ||
| 54 | Business services nec | ||
| 55 | Recreational and other services | ||
| 56 | Public Administration; Defense; Education; Health | ||
| 57 | Dwellings | 18: Personal Services |
Appendix B
Relative Capital Value Added between the UK and other listed countries expressed as a percentage.
References
- Gereffi, G.; Humphrey, J.; Sturgeon, T. The governance of global value chains. Rev. Int. Political Econ. 2005, 121, 78–104. [Google Scholar] [CrossRef]
- Yeung, H.W.-C.; Coe, N. Toward a Dynamic Theory of Global Production Networks. Econ. Geogr. 2015, 911, 29–58. [Google Scholar] [CrossRef]
- Humphrey, J.; Schmitz, H. How does insertion in global value chains affect upgrading in industrial clusters? Reg. Stud. 2002, 369, 1017–1027. [Google Scholar] [CrossRef]
- Acquaye, A.A.; Yamoah, F.A.; Feng, K. An integrated environmental and fairtrade labelling scheme for product supply chains. Int. J. Prod. Econ. 2015, 164, 472–483. [Google Scholar] [CrossRef]
- Taglioni, D.; Winkler, D. Making Global Value Chains Work for Development; The World Bank: Washington, DC, USA, 2016. [Google Scholar]
- Hopkins, T.K.; Wallerstein, I. Commodity chains: Construct and research. In Commodity Chains and Global Capitalism; Gereffi, G., Korzeniewicz, M., Eds.; Greenwood Press: Westport, Connecticut, 1994; Volume 17. [Google Scholar]
- Barrientos, S.; Knorringa, P.; Evers, B.; Visser, M.; Opondo, M. Shifting regional dynamics of global value chains: Implications for economic and social upgrading in African horticulture. Environ. Plan. A Econ. Space 2016, 48, 1266–1283. [Google Scholar] [CrossRef]
- OECD. Interconnected Econ.: Benefiting Glob. Value Chains; OECD Publishing: Washington, DC, USA, 2013. [Google Scholar]
- Galar, M. Competing within global value chains. ECFIN Econ. Brief 2012, 17, 1–12. [Google Scholar]
- Dunning, J.H. Reappraising the Eclectic Paradigm in an Age of Alliance Capitalism. In The Eclectic Paradigm: A Framework for Synthesizing and Comparing Theories of International Business from Different Disciplines or Perspectives; Cantwell, J., Ed.; Palgrave Macmillan: London, UK, 2015; pp. 111–142. [Google Scholar]
- Kano, L. Global value chain governance: A relational perspective. J. Int. Bus. Stud. 2018, 496, 684–705. [Google Scholar] [CrossRef]
- Pavlínek, P. Global Production Networks, Foreign Direct Investment, and Supplier Linkages in the Integrated Peripheries of the Automotive Industry. Econ. Geogr. 2018, 942, 141–165. [Google Scholar] [CrossRef]
- Moran, D.D.; Lenzen, M.; Kanemoto, K.; Geschke, A. Does ecologically unequal exchange occur? Ecol. Econ. 2013, 890, 177–186. [Google Scholar] [CrossRef]
- Oppon, E.; Acquaye, A.; Ibn-Mohammed, T.; Koh, L. Modelling Multi-regional Ecological Exchanges: The Case of UK and Africa. Ecol. Econ. 2018, 147, 422–435. [Google Scholar] [CrossRef]
- Dallas, M.; Ponte, S.; Sturgeon, T. A Typology of Power in Global Value Chains; Copenhagen Business School, Working paper in Business and Politics; Copenhagen Business School: Copenhagen, Denmark, 2017; Volume 91. [Google Scholar]
- Turkina, E.; Van Assche, A.; Kali, R. Structure and evolution of global cluster networks: Evidence from the aerospace industry. J. Econ. Geogr. 2016, 166, 1211–1234. [Google Scholar] [CrossRef]
- Gereffi, G.; Lee, J. Economic and social upgrading in global value chains and industrial clusters: Why governance matters. J. Bus. Ethics 2016, 1331, 25–38. [Google Scholar] [CrossRef]
- Pietrobelli, C.; Rabellotti, R. Global value chains meet innovation systems: Are there learning opportunities for developing countries? World Dev. 2011, 397, 1261–1269. [Google Scholar] [CrossRef]
- Humphrey, J.; Schmitz, H. Inter-firm relationships in global value chains: Trends in chain governance and their policy implications. Int. J. Technol. Learn. Innov. Dev. 2008, 13, 258–282. [Google Scholar] [CrossRef]
- Saliola, F.; Zanfei, A. Multinational firms, global value chains and the organization of knowledge transfer. Res. Policy 2009, 382, 369–381. [Google Scholar] [CrossRef]
- Manioudis, Manolis, and Giorgos Meramveliotakis. Broad Strokes Towards a Grand Theory in the Analysis of Sustainable Development: A Return to the Classical Political Economy. New Political Econ. 2022, 27, 866–878. [Google Scholar] [CrossRef]
- Tomislav, K. The concept of sustainable development: From its beginning to the contemporary issues. Zagreb Int. Rev. Econ. Bus. 2018, 21, 67–94. [Google Scholar]
- Guschanski, A.; Onaran, Ö. Global Value Chain Participation and the Labour Share: Industry-level Evidence from Emerging Economies. Dev. Change 2023, 54, 31–63. [Google Scholar] [CrossRef]
- Garhart, R. Frontiers of Input-Output Analysis. Econ. Geogr. 1991, 671, 84–86. [Google Scholar] [CrossRef]
- Miller, R.E.; Blair, P.D. Input-Output Analysis: Foundations and Extensions; Cambridge University Press: Cambridge, UK, 2009. [Google Scholar]
- Bridge, G.; Bradshaw, M. Making a global gas market: Territoriality and production networks in liquefied natural gas. Econ. Geogr. 2017, 933, 215–240. [Google Scholar] [CrossRef]
- Lee, E.; Yi, K.M. Global Value Chains and Inequality with Endogenous Labor Supply. J. Int. Econ. 2018, 115, 223–241. [Google Scholar] [CrossRef]
- Neilson, J.; Pritchard, B.; Fold, N.; Dwiartama, A. Lead firms in the cocoa–chocolate global production network: An assessment of the deductive capabilities of GPN 2.0. Econ. Geogr. 2018, 94, 400–424. [Google Scholar] [CrossRef]
- Kogut, B. Designing global strategies: Comparative and competitive value added chains. Sloan Manag. Rev. 1985, 26, 15. [Google Scholar]
- The Global Value Chains Initiative. Concepts and Tools. 2016. Available online: https://globalvaluechains.org/concept-tools (accessed on 1 August 2016).
- Tukker, A.; Dietzenbacher, E. Global multiregional input–output frameworks: An introduction and outlook. Econ. Syst. Res. 2013, 251, 1–19. [Google Scholar] [CrossRef]
- Timmer, M.P.; Erumban, A.A.; Los, B.; Stehrer, R.; de Vries, G.J. Slicing up global value chains. J. Econ. Perspect. 2014, 28, 99–118. [Google Scholar] [CrossRef]
- Klein, O.; Pachura, P. Tamásy Ch.Globalizing production networks. Pol. J. Manag. Stud. 2016, 13, 81–89. [Google Scholar]
- OECD. Global Value Chains. 2016. Available online: http://www.oecd.org/sti/ind/global-value-chains.htm (accessed on 1 August 2016).
- Cuervo-Cazurra, A.; Pananond, P. The rise of emerging market lead firms in global value chains. J. Bus. Res. 2023, 154, 113327. [Google Scholar] [CrossRef]
- Elms, D.K.; Low, P. Global Value Chains in a Changing World; World Trade Organization: Geneva, Switzerland, 2013. [Google Scholar]
- Gereffi, G.; Fernandez-Stark, K. Global value chain analysis: A primer. In Center on Globalization, Governance & Competitiveness CGGC; Duke University: Durham, NC, USA, 2011. [Google Scholar]
- Yawson, D.E.; Yamoah, F.A. Review of strategic agility: A holistic framework for fresh produce supply chain disruptions. Sustainability 2022, 14, 14977. [Google Scholar] [CrossRef]
- UNCTAD. Global Value Chains: Investment and Trade for Development; World Investment Report; UNCTAD: Geneva, Switzerland, 2013. [Google Scholar]
- Acquaye, A.; Feng, K.; Oppon, E.; Salhi, S.; Ibn-Mohammed, T.; Genovese, A.; Hubacek, K. Measuring the environmental sustainability performance of global supply chains: A multi-regional input-output analysis for carbon, sulphur oxide and water footprints. J. Environ. Manag. 2017, 187, 571–585. [Google Scholar] [CrossRef]
- Sturgeon, T.J. How Do We Define Value Chains and Production Networks? IDS Bull. 2001, 323, 9–18. [Google Scholar] [CrossRef]
- Acquaye, A.; Ibn-Mohammed, T.; Genovese, A.; Afrifa, G.A.; Yamoah, F.A.; Oppon, E. A quantitative model for environmentally sustainable supply chain performance measurement. Eur. J. Oper. Res. 2018, 269, 188–205. [Google Scholar] [CrossRef]
- Antràs, P.; Chor, D. Global value chains. Handb. Int. Econ. 2022, 5, 297–376. [Google Scholar]
- Bi, K.; Huang, P.; Ye, H. Risk identification, evaluation and response of low-carbon technological innovation under the global value chain: A case of the Chinese manufacturing industry. Technol. Forecast. Soc. Change 2015, 100, 238–248. [Google Scholar] [CrossRef]
- Kiamehr, M. Paths of technological capability building in complex capital goods: The case of hydroelectricity generation systems in Iran. Technol. Forecast. Soc. Change 2017, 122, 215–230. [Google Scholar] [CrossRef]
- Pietrobelli, C.; Puppato, F. Technology foresight and industrial strategy. Technol. Forecast. Soc. Change 2016, 110, 117–125. [Google Scholar] [CrossRef]
- Bi, K.; Huang, P.; Wang, X. Innovation performance and influencing factors of low-carbon technological innovation under the global value chain: A case of Chinese manufacturing industry. Technol. Forecast. Soc. Change 2016, 111, 275–284. [Google Scholar] [CrossRef]
- Zhang, F.; Gallagher, K.S. Innovation and technology transfer through global value chains: Evidence from China’s PV industry. Energy Policy 2016, 94, 191–203. [Google Scholar] [CrossRef]
- Vellema, S.; Van Wijk, J. Partnerships intervening in global food chains: The emergence of co-creation in standard-setting and certification. J. Clean. Prod. 2015, 107, 105–113. [Google Scholar] [CrossRef]
- Adolf, S.; Bush, S.R.; Vellema, S. Reinserting state agency in global value chains: The case of MSC certified skipjack tuna. Fish. Res. 2016, 182, 79–87. [Google Scholar] [CrossRef]
- Luppes, M.; Nielsen, P.B. Global Value Chains in Official Business Statistics. 2015. Available online: https://unstats.un.org/unsd/trade/events/2016/newyork-egm/documents/background/Luppes%20and%20Nielsen%20-%202015%20-%20Global%20Value%20Chains%20in%20official%20business%20statistics.pdf (accessed on 30 August 2023).
- Jara, A.; Escaith, H. Global value chains, international trade statistics and policymaking in a flattening world. World Econ. 2012, 13, 19–38. [Google Scholar]
- Armando, E.; Azevedo, A.C.; Fischmann, A.A.; Pereira, C.E.C. Business Strategy and Upgrading in Global Value Chains: A Multiple Case Study in Information Technology Firms of Brazilian Origin. RAI 2016, 13, 39–47. [Google Scholar] [CrossRef]
- Said-Allsopp, M.; Tallontire, A. Pathways to empowerment? Dynamics of women’s participation in Global Value Chains. J. Clean. Prod. 2015, 107, 114–121. [Google Scholar] [CrossRef]
- Yamoah, F.A.; Yawson, D.E. Promoting global well-being through fairtrade food: The role of international exposure. Int. Food Agribus. Manag. Rev. 2023, 26, 243–265. [Google Scholar] [CrossRef]
- Harnesk, D.; Brogaard, S.; Peck, P. Regulating a global value chain with the European Union’s sustainability criteria–experiences from the Swedish liquid transport biofuel sector. J. Clean. Prod. 2017, 153, 580–591. [Google Scholar] [CrossRef]
- Utrilla-Catalan, R.; Rodríguez-Rivero, R.; Narvaez, V.; Díaz-Barcos, V.; Blanco, M.; Galeano, J. Growing inequality in the coffee global value chain: A complex network assessment. Sustainability 2022, 14, 672. [Google Scholar] [CrossRef]
- Szymczak, S.; Wolszczak-Derlacz, J. Global value chains and labour markets–simultaneous analysis of wages and employment. Econ. Syst. Res. 2022, 34, 69–96. [Google Scholar] [CrossRef]
- Damali, U.; Miller, J.L.; Fredendall, L.D.; Moore, D.; Dye, C.J. Co-creating value using customer training and education in a healthcare service design. J. Oper. Manag. 2016, 47–48, 80–97. [Google Scholar] [CrossRef]
- Tsai, J.Y.; Raghu, T.S.; Shao, B.B.M. Information systems and technology sourcing strategies of e-Retailers for value chain enablement. J. Oper. Manag. 2013, 316, 345–362. [Google Scholar] [CrossRef]
- Radhakrishnan, A.; Zu, X.; Grover, V. A process-oriented perspective on differential business value creation by information technology: An empirical investigation. Omega 2008, 366, 1105–1125. [Google Scholar] [CrossRef]
- Harrison, J. Trade Agreements and Sustainability: Exploring the Potential of Global Value Chain (GVC) Obligations. J. Int. Econ. Law 2022, 26, 199–215. [Google Scholar] [CrossRef]
- Harris, J.M. Basic Principles of Sustainable Development; Dimensions of Sustainable Development; Seidler, R., Bawa, K.S., Eds.; 2000; Volume 1, pp. 21–41. Available online: https://sites.tufts.edu/gdae/files/2019/10/00-04Harris-BasicPrinciplesSD.pdf (accessed on 20 August 2023).
- Hart, S.L.; Milstein, M.B. Creating sustainable value. Acad. Manag. Perspect. 2003, 172, 56–67. [Google Scholar] [CrossRef]
- Tseng, M.-L.; Tan, K.H.; Geng, Y.; Govindan, K. Sustainable consumption and production in emerging markets. Int. J. Prod. Econ. 2016, 181, 257–261. [Google Scholar] [CrossRef]
- Husted, B.W.; Allen, D.B. Corporate social strategy. In Stakeholder Engagement and Competitive Advantage; Cambridge University Press: New York, NY, USA, 2011. [Google Scholar]
- Garvare, R.; Johansson, P. Management for sustainability—A stakeholder theory. Total Qual. Manag. 2010, 217, 737–744. [Google Scholar] [CrossRef]
- Lee, M.D.P. A review of the theories of corporate social responsibility: Its evolutionary path and the road ahead. Int. J. Manag. Rev. 2008, 101, 53–73. [Google Scholar] [CrossRef]
- Tilt, C.A. Environmental Policies of Major Companies: Australian Evidence. Br. Acc. Rev. 1997, 294, 367–394. [Google Scholar] [CrossRef]
- Del Prete, D.; Rungi, A. Organizing the Global Value Chain: A firm-level test. J. Int. Econ. 2017, 109, 16–30. [Google Scholar] [CrossRef]
- Leontief, W.W. Quantitative input and output relations in the economic systems of the United States. Rev. Econ. Stat. 1936, 18, 105–125. [Google Scholar] [CrossRef]
- Genovese, A.; Acquaye, A.A.; Figueroa, A.; Koh, S.C.L. Sustainable supply chain management and the transition towards a circular economy: Evidence and some applications. Omega 2017, 66, 344–357. [Google Scholar] [CrossRef]
- Prell, C.; Feng, K.; Sun, L.; Geores, M.; Hubacek, K. The Economic Gains and Environmental Losses of US Consumption: A World-Systems and Input-Output Approach. Soc. Forces 2014, 931, 405–428. [Google Scholar] [CrossRef]
- Koh, S.L.; Genovese, A.; Acquaye, A.A.; Barratt, P.; Rana, N.; Kuylenstierna, J.; Gibbs, D. Decarbonising product supply chains: Design and development of an integrated evidence-based decision support system–the supply chain environmental analysis tool SCEnAT. Int. J. Prod. Res. 2013, 517, 2092–2109. [Google Scholar] [CrossRef]
- Johnson, R.C.; Noguera, G. Accounting for intermediates: Production sharing and trade in value added. J. Int. Econ. 2012, 86, 224–236. [Google Scholar] [CrossRef]
- Aichele, R.; Inga, H. Where Is the Value Added? Trade Liberalization and Production Networks. J. Int. Econ. 2018, 115, 130–144. [Google Scholar] [CrossRef]
- Acquaye, A.; Genovese, A.; Barrett, J.; Koh, S.C.L. Benchmarking Carbon Emissions Performance in Supply Chains. Supply Chain Manag. Int. J. 2014, 19, 306–321. [Google Scholar] [CrossRef]
- Sundarakani, B.; de Souza, R.; Goh, M.; Van Over, D.; Manikandan, S.; Koh, S.L. A sustainable green supply chain for globally integrated networks. Enterprise networks and logistics for agile manufacturing. In Enterprise Network Logistics for Agile Manufacturing; Wang, L., Koh, S.C.L., Eds.; Springer: London, UK, 2010; pp. 191–206. [Google Scholar]
- Office of National Statistics. Measuring the Economic Impact of an Intervention or Investment Paper One: Context & Rationale; Office of National Statistics: London, UK, 2010.
- Jakob, M.; Steckel, J.C.; Edenhofer, O. Consumption-Versus Production-Based Emission Policies. Annu. Rev. Resour. Econ. 2014, 6, 297–318. [Google Scholar] [CrossRef]
- Ibn-Mohammed, T.; Greenough, R.; Taylor, S.; Ozawa-Meida, L.; Acquaye, A. Integrating economic considerations with operational and embodied emissions into a decision support system for the optimal ranking of building retrofit options. Build. Environ. 2014, 72, 82–101. [Google Scholar] [CrossRef]
- Davis, S.J.; Caldeira, K. Consumption-based accounting of CO2 emissions. Proc. Natl. Acad. Sci. USA 2010, 10712, 5687–5692. [Google Scholar] [CrossRef]
- West, G.R.; Jackson, R.W. Simulating Impacts on Regional Economies: A Modelling Alternative. In Hospitality Travel and Tourism: Concepts, Methodologies, Tools and Applications; Information Resources Management Association, Ed.; IGI Global: Hershey, PA, USA, 2015; pp. 1064–1083. [Google Scholar]
- GTAP. GTAP Version 9 Data Base; Purdue University: West Lafayette, IN, USA, 2015. [Google Scholar]
- Gereffi, G.; Humphrey, J.; Kaplinsky, R.; Sturgeon, T.J. Introduction: Globalisation, Value Chains and Development. IDS Bull. 2001, 323, 1–8. [Google Scholar] [CrossRef]
- Arrow, K.J.; Chenery, H.B.; Minhas, B.S.; Solow, R.M. Capital-labor substitution and economic efficiency. Rev. Econ. Stat. 1961, 43, 225–250. [Google Scholar] [CrossRef]
- Shapiro, M.D. The dynamic demand for capital and labor. Q. J. Econ. 1986, 101, 513–542. [Google Scholar] [CrossRef]
- World Bank. 2014 World Development Indicators—The World Bank; World Bank: Washington, DC, USA, 2014. [Google Scholar]
- Figge, F.; Hahn, T. Sustainable value added—Measuring corporate contributions to sustainability beyond eco-efficiency. Ecol. Econ. 2004, 482, 173–187. [Google Scholar] [CrossRef]
- Atkinson, G. Measuring Corporate Sustainability. J. Environ. Plan. Manag. 2000, 432, 235–252. [Google Scholar] [CrossRef]
- World Business Council for Sustainable Development. Measuring Socio-Economic Impact: A Guide for Business; World Business Council for Sustainable Development: Conches-Geneva, Switzerland, 2013. [Google Scholar]
- Rosenberg, N. Capital goods, technology, and economic growth. Oxf. Econ. Pap. 1963, 15, 217–227. [Google Scholar] [CrossRef]
- Wacker, J.G.; Yang, C.-L.; Sheu, C. Productivity of production labor, non-production labor, and capital: An international study. Int. J. Prod. Econ. 2006, 1032, 863–872. [Google Scholar] [CrossRef]
- Eaton, J.; Kortum, S. Trade in capital goods. Eur. Econ. Rev. 2001, 457, 1195–1235. [Google Scholar] [CrossRef]
- Appiah, M.; Blay, D.; Damnyag, L.; Dwomoh, F.; Pappinen, A.; Luukkanen, O. Dependence on forest resources and tropical deforestation in Ghana. Environ. Dev. Sustain. 2009, 113, 471–487. [Google Scholar] [CrossRef]
- Demeter, K.; Chikán, A.; Matyusz, Z. Labour productivity change: Drivers, business impact and macroeconomic moderators. Int. J. Prod. Econ. 2011, 1311, 215–223. [Google Scholar] [CrossRef]
- Hauke, J.; Kossowski, T. Comparison of values of Pearson’s and Spearman’s correlation coefficients on the same sets of data. Quaest. Geogr. 2011, 302, 87–93. [Google Scholar] [CrossRef]
- Osei, M.B.; Papadopoulos, T.; Acquaye, A.; Stamati, T. Improving sustainable supply chain performance through organisational culture: A competing values framework approach. J. Purch. Supply Manag. 2023, 29, 100821. [Google Scholar] [CrossRef]
- Kannan, D. Role of multiple stakeholders and the critical success factor theory for the sustainable supplier selection process. Int. J. Prod. Econ. 2018, 195, 391–418. [Google Scholar] [CrossRef]
- Nudurupati, S.S.; Bhattacharya, A.; Lascelles, D.; Caton, N. Strategic sourcing with multi-stakeholders through value co-creation: An evidence from global health care company. Int. J. Prod. Econ. 2015, 166, 248–257. [Google Scholar] [CrossRef]
- Daugherty, P.J. Review of Logistics and Supply Chain Relationship Literature and Suggested Research Agenda. Int. J. Phys. Distrib. Logist. Manag. 2011, 41, 16–31. [Google Scholar] [CrossRef]
- Lund-Thomsen, P.; Nadvi, K. Global value chains, local collective action and corporate social responsibility: A review of empirical evidence. Bus. Strategy Environ. 2010, 19, 1–13. [Google Scholar] [CrossRef]
- Gibbon, P. Commodities, Donors, Value-Chain Analysis and Upgrading; International Centre for Trade and Sustainable Development ICTSD: Geneva, Switzerland, 2004. [Google Scholar]
- Talbot, J.M. Tropical commodity chains, forward integration strategies and international inequality: Coffee, cocoa and tea. Rev. Int. Political Econ. 2002, 94, 701–734. [Google Scholar] [CrossRef]
- Cramer, C. Can Africa industrialize by processing primary commodities? The case of Mozambican cashew nuts. World Dev. 1999, 277, 1247–1266. [Google Scholar] [CrossRef]
- Hörisch, J.; Freeman, R.E.; Schaltegger, S. Applying stakeholder theory in sustainability management: Links, similarities, dissimilarities, and a conceptual framework. Organ. Environ. 2014, 27, 328–346. [Google Scholar] [CrossRef]
- African Development Bank. African Economic Outlook 2018; African Development Bank: Abidjan, Côte d’Ivoire, 2018. [Google Scholar]
- The Economist, Logistics in Africa: Network Effects. 2008. Available online: https://www.economist.com/business/2008/10/16/network-effects (accessed on 11 March 2023).
- The Economist. A road to somewhere. Afr. Infrastruct. 2011, 400, 44. [Google Scholar]
- Acquaye, A.; Duffy, A.P.; Biswajit, B. Development of a Construction Sub-Sector Embodied Energy Hybrid Analysis. 2008. Working Papers. 1. Available online: https://arrow.tudublin.ie/dubenwp/1 (accessed on 1 August 2023).
- Lenzen, M.; Moran, D.; Kanemoto, K.; Geschke, A. Building Eora: A Global Multi-Region Input–Output Database at High Country and Sector Resolution. Econ. Syst. Res. 2013, 251, 20–49. [Google Scholar] [CrossRef]

Disclaimer/Publisher’s Note: The statements, opinions and data contained in all publications are solely those of the individual author(s) and contributor(s) and not of MDPI and/or the editor(s). MDPI and/or the editor(s) disclaim responsibility for any injury to people or property resulting from any ideas, methods, instructions or products referred to in the content. |
© 2023 by the authors. Licensee MDPI, Basel, Switzerland. This article is an open access article distributed under the terms and conditions of the Creative Commons Attribution (CC BY) license (https://creativecommons.org/licenses/by/4.0/).